Horntown, VA Map & Demographics
Horntown Map
Horntown Overview
$31,609
PER CAPITA INCOME
$83,824
AVG FAMILY INCOME
0.37
INEQUALITY / GINI INDEX
453
TOTAL POPULATION
205
MALE POPULATION
248
FEMALE POPULATION
82.66
MALES / 100 FEMALES
120.98
FEMALES / 100 MALES
64.0
MEDIAN AGE
2.2
AVG FAMILY SIZE
2.0
AVG HOUSEHOLD SIZE
87
LABOR FORCE [ PEOPLE ]
19.2%
PERCENT IN LABOR FORCE
Horntown Zip Codes
Horntown Area Codes
Income in Horntown
Income Overview in Horntown
| Characteristic | Number | Measure |
| Per Capita Income | 453 | $31,609 |
| Median Family Income | 190 | $83,824 |
| Mean Family Income | 190 | $70,427 |
| Median Household Income | 222 | $0 |
| Mean Household Income | 222 | $62,203 |
| Income Deficit | 190 | $0 |
| Wage / Income Gap (%) | 453 | 0.00% |
| Wage / Income Gap ($) | 453 | 100.00¢ per $1 |
| Gini / Inequality Index | 453 | 0.37 |
Earnings by Sex in Horntown
| Sex | Number | Average Earnings |
| Male | 0 (0.0%) | $0 |
| Female | 87 (100.0%) | $0 |
| Total | 87 (100.0%) | $0 |
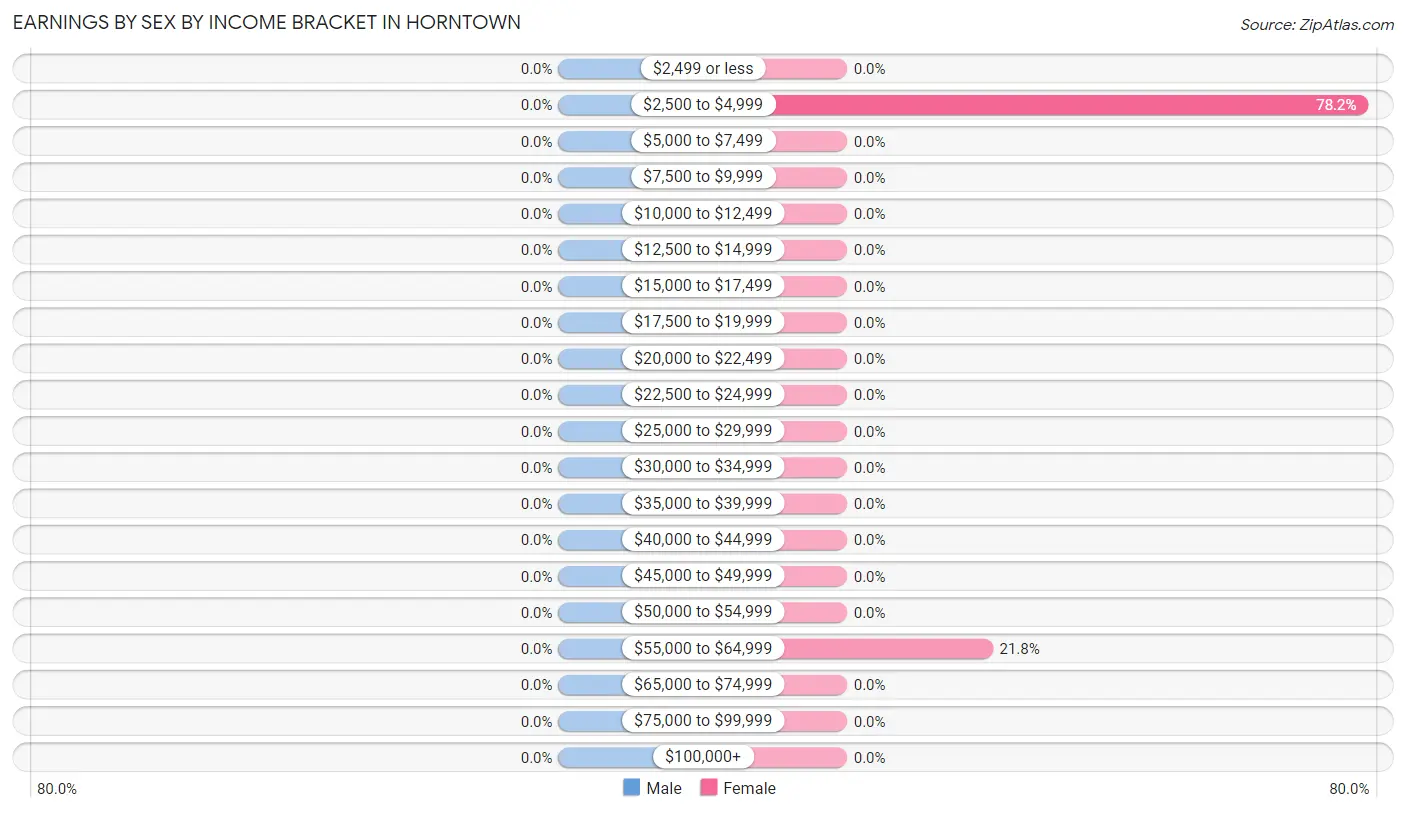
Earnings by Sex by Income Bracket in Horntown
| Income | Male | Female |
| $2,499 or less | 0 (0.0%) | 0 (0.0%) |
| $2,500 to $4,999 | 0 (0.0%) | 68 (78.2%) |
| $5,000 to $7,499 | 0 (0.0%) | 0 (0.0%) |
| $7,500 to $9,999 | 0 (0.0%) | 0 (0.0%) |
| $10,000 to $12,499 | 0 (0.0%) | 0 (0.0%) |
| $12,500 to $14,999 | 0 (0.0%) | 0 (0.0%) |
| $15,000 to $17,499 | 0 (0.0%) | 0 (0.0%) |
| $17,500 to $19,999 | 0 (0.0%) | 0 (0.0%) |
| $20,000 to $22,499 | 0 (0.0%) | 0 (0.0%) |
| $22,500 to $24,999 | 0 (0.0%) | 0 (0.0%) |
| $25,000 to $29,999 | 0 (0.0%) | 0 (0.0%) |
| $30,000 to $34,999 | 0 (0.0%) | 0 (0.0%) |
| $35,000 to $39,999 | 0 (0.0%) | 0 (0.0%) |
| $40,000 to $44,999 | 0 (0.0%) | 0 (0.0%) |
| $45,000 to $49,999 | 0 (0.0%) | 0 (0.0%) |
| $50,000 to $54,999 | 0 (0.0%) | 0 (0.0%) |
| $55,000 to $64,999 | 0 (0.0%) | 19 (21.8%) |
| $65,000 to $74,999 | 0 (0.0%) | 0 (0.0%) |
| $75,000 to $99,999 | 0 (0.0%) | 0 (0.0%) |
| $100,000+ | 0 (0.0%) | 0 (0.0%) |
| Total | 0 (0.0%) | 87 (100.0%) |
Earnings by Sex by Educational Attainment in Horntown
| Educational Attainment | Male Income | Female Income |
| Less than High School | - | - |
| High School Diploma | - | - |
| College or Associate's Degree | - | - |
| Bachelor's Degree | - | - |
| Graduate Degree | - | - |
| Total | - | - |
Family Income in Horntown
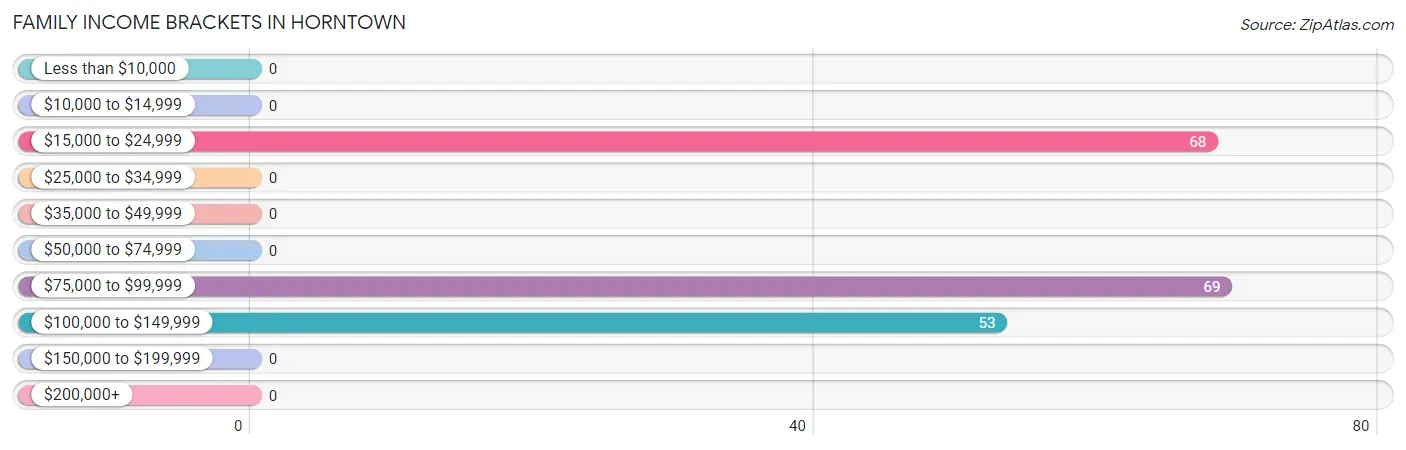
Family Income Brackets in Horntown
According to the Horntown family income data, there are 69 families falling into the $75,000 to $99,999 income range, which is the most common income bracket and makes up 36.3% of all families.
| Income Bracket | # Families | % Families |
| Less than $10,000 | 0 | 0.0% |
| $10,000 to $14,999 | 0 | 0.0% |
| $15,000 to $24,999 | 68 | 35.8% |
| $25,000 to $34,999 | 0 | 0.0% |
| $35,000 to $49,999 | 0 | 0.0% |
| $50,000 to $74,999 | 0 | 0.0% |
| $75,000 to $99,999 | 69 | 36.3% |
| $100,000 to $149,999 | 53 | 27.9% |
| $150,000 to $199,999 | 0 | 0.0% |
| $200,000+ | 0 | 0.0% |
Family Income by Famaliy Size in Horntown
| Income Bracket | # Families | Median Income |
| 2-Person Families | 172 (90.5%) | $0 |
| 3-Person Families | 18 (9.5%) | $0 |
| 4-Person Families | 0 (0.0%) | $0 |
| 5-Person Families | 0 (0.0%) | $0 |
| 6-Person Families | 0 (0.0%) | $0 |
| 7+ Person Families | 0 (0.0%) | $0 |
| Total | 190 (100.0%) | $83,824 |
Family Income by Number of Earners in Horntown
| Number of Earners | # Families | Median Income |
| No Earners | 104 (54.7%) | $0 |
| 1 Earner | 86 (45.3%) | $0 |
| 2 Earners | 0 (0.0%) | $0 |
| 3+ Earners | 0 (0.0%) | $0 |
| Total | 190 (100.0%) | $83,824 |
Household Income in Horntown
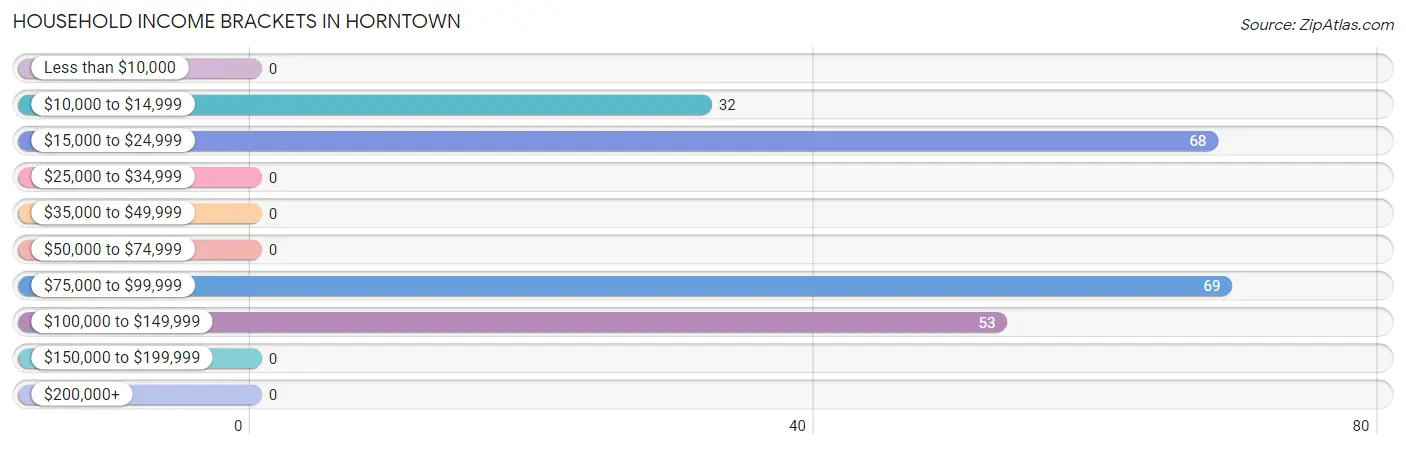
Household Income Brackets in Horntown
With 69 households falling in the category, the $75,000 to $99,999 income range is the most frequent in Horntown, accounting for 31.1% of all households.
| Income Bracket | # Households | % Households |
| Less than $10,000 | 0 | 0.0% |
| $10,000 to $14,999 | 32 | 14.4% |
| $15,000 to $24,999 | 68 | 30.6% |
| $25,000 to $34,999 | 0 | 0.0% |
| $35,000 to $49,999 | 0 | 0.0% |
| $50,000 to $74,999 | 0 | 0.0% |
| $75,000 to $99,999 | 69 | 31.1% |
| $100,000 to $149,999 | 53 | 23.9% |
| $150,000 to $199,999 | 0 | 0.0% |
| $200,000+ | 0 | 0.0% |
Household Income by Householder Age in Horntown
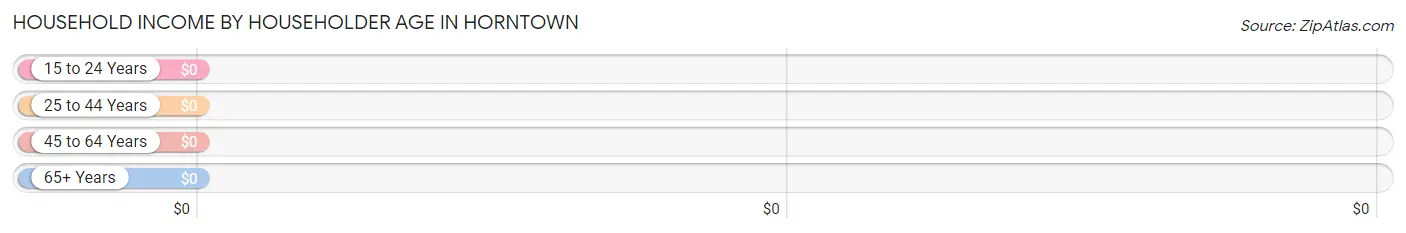
| Income Bracket | # Households | Median Income |
| 15 to 24 Years | 0 (0.0%) | $0 |
| 25 to 44 Years | 0 (0.0%) | $0 |
| 45 to 64 Years | 137 (61.7%) | $0 |
| 65+ Years | 85 (38.3%) | $0 |
| Total | 222 (100.0%) | $0 |
Poverty in Horntown
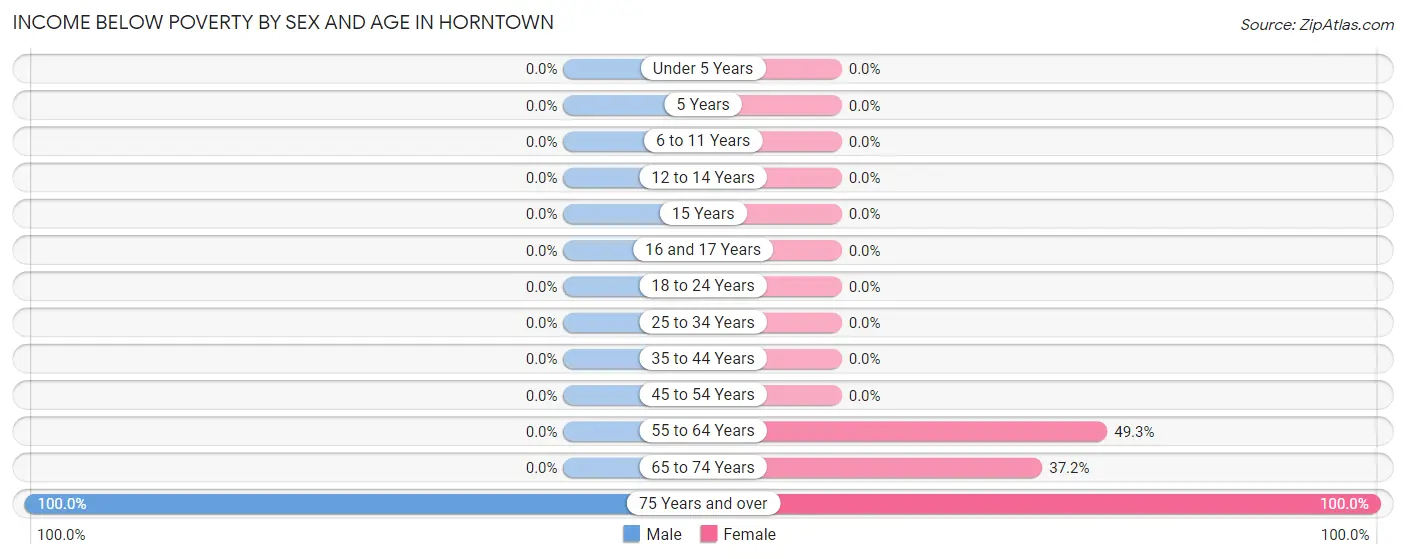
Income Below Poverty by Sex and Age in Horntown
With 36.1% poverty level for males and 40.7% for females among the residents of Horntown, 75 year old and over males and 75 year old and over females are the most vulnerable to poverty, with 74 males (100.0%) and 1 females (100.0%) in their respective age groups living below the poverty level.
| Age Bracket | Male | Female |
| Under 5 Years | 0 (0.0%) | 0 (0.0%) |
| 5 Years | 0 (0.0%) | 0 (0.0%) |
| 6 to 11 Years | 0 (0.0%) | 0 (0.0%) |
| 12 to 14 Years | 0 (0.0%) | 0 (0.0%) |
| 15 Years | 0 (0.0%) | 0 (0.0%) |
| 16 and 17 Years | 0 (0.0%) | 0 (0.0%) |
| 18 to 24 Years | 0 (0.0%) | 0 (0.0%) |
| 25 to 34 Years | 0 (0.0%) | 0 (0.0%) |
| 35 to 44 Years | 0 (0.0%) | 0 (0.0%) |
| 45 to 54 Years | 0 (0.0%) | 0 (0.0%) |
| 55 to 64 Years | 0 (0.0%) | 68 (49.3%) |
| 65 to 74 Years | 0 (0.0%) | 32 (37.2%) |
| 75 Years and over | 74 (100.0%) | 1 (100.0%) |
| Total | 74 (36.1%) | 101 (40.7%) |
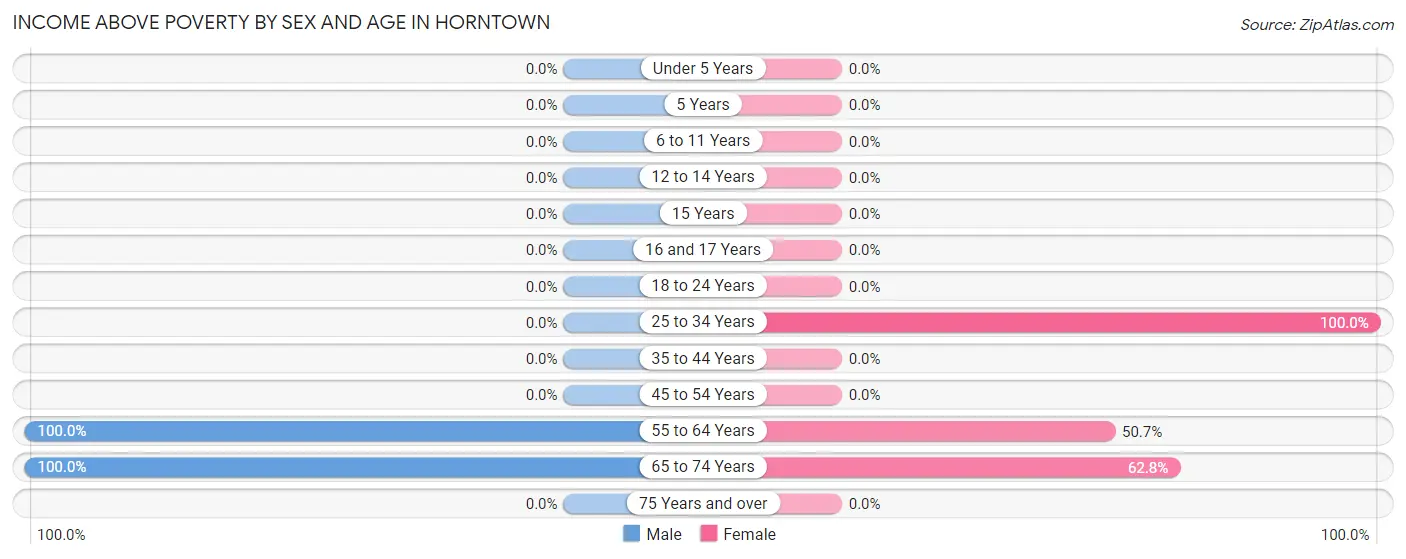
Income Above Poverty by Sex and Age in Horntown
According to the poverty statistics in Horntown, males aged 55 to 64 years and females aged 25 to 34 years are the age groups that are most secure financially, with 100.0% of males and 100.0% of females in these age groups living above the poverty line.
| Age Bracket | Male | Female |
| Under 5 Years | 0 (0.0%) | 0 (0.0%) |
| 5 Years | 0 (0.0%) | 0 (0.0%) |
| 6 to 11 Years | 0 (0.0%) | 0 (0.0%) |
| 12 to 14 Years | 0 (0.0%) | 0 (0.0%) |
| 15 Years | 0 (0.0%) | 0 (0.0%) |
| 16 and 17 Years | 0 (0.0%) | 0 (0.0%) |
| 18 to 24 Years | 0 (0.0%) | 0 (0.0%) |
| 25 to 34 Years | 0 (0.0%) | 23 (100.0%) |
| 35 to 44 Years | 0 (0.0%) | 0 (0.0%) |
| 45 to 54 Years | 0 (0.0%) | 0 (0.0%) |
| 55 to 64 Years | 66 (100.0%) | 70 (50.7%) |
| 65 to 74 Years | 65 (100.0%) | 54 (62.8%) |
| 75 Years and over | 0 (0.0%) | 0 (0.0%) |
| Total | 131 (63.9%) | 147 (59.3%) |
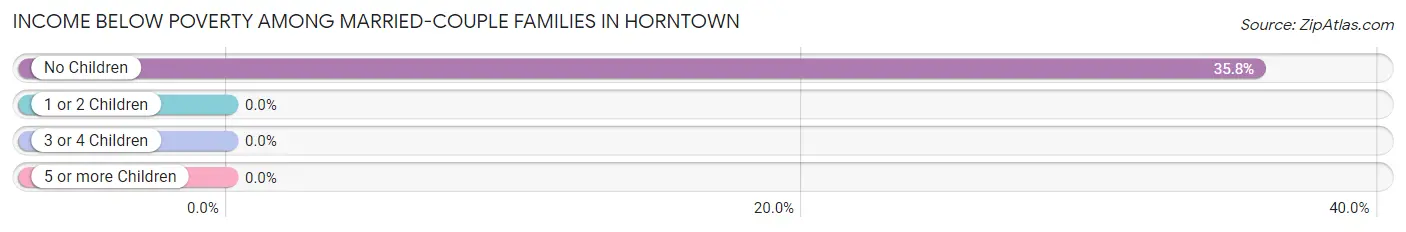
Income Below Poverty Among Married-Couple Families in Horntown
The poverty statistics for married-couple families in Horntown show that 35.8% or 68 of the total 190 families live below the poverty line. Families with no children have the highest poverty rate of 35.8%, comprising of 68 families. On the other hand, families with no children have the lowest poverty rate of 35.8%, which includes 68 families.
| Children | Above Poverty | Below Poverty |
| No Children | 122 (64.2%) | 68 (35.8%) |
| 1 or 2 Children | 0 (0.0%) | 0 (0.0%) |
| 3 or 4 Children | 0 (0.0%) | 0 (0.0%) |
| 5 or more Children | 0 (0.0%) | 0 (0.0%) |
| Total | 122 (64.2%) | 68 (35.8%) |
Income Below Poverty Among Single-Parent Households in Horntown
| Children | Single Father | Single Mother |
| No Children | 0 (0.0%) | 0 (0.0%) |
| 1 or 2 Children | 0 (0.0%) | 0 (0.0%) |
| 3 or 4 Children | 0 (0.0%) | 0 (0.0%) |
| 5 or more Children | 0 (0.0%) | 0 (0.0%) |
| Total | 0 (0.0%) | 0 (0.0%) |
Income Below Poverty Among Married-Couple vs Single-Parent Households in Horntown
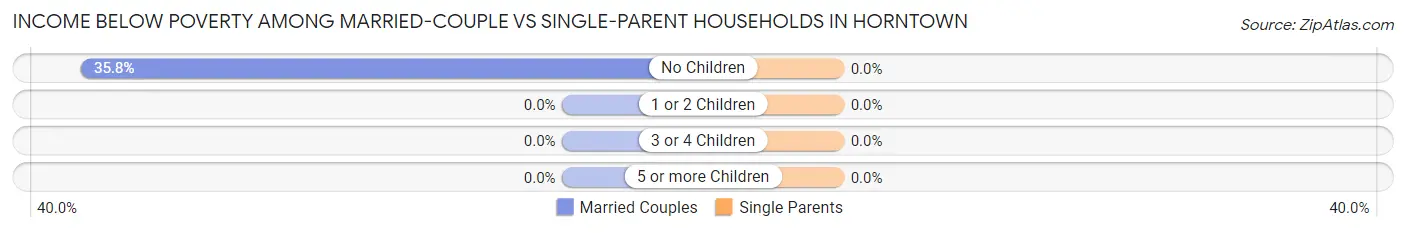
| Children | Married-Couple Families | Single-Parent Households |
| No Children | 68 (35.8%) | 0 (0.0%) |
| 1 or 2 Children | 0 (0.0%) | 0 (0.0%) |
| 3 or 4 Children | 0 (0.0%) | 0 (0.0%) |
| 5 or more Children | 0 (0.0%) | 0 (0.0%) |
| Total | 68 (35.8%) | 0 (0.0%) |
Race in Horntown
The most populous races in Horntown are White / Caucasian (420 | 92.7%), Two or more Races (32 | 7.1%), and Black / African American (1 | 0.2%).
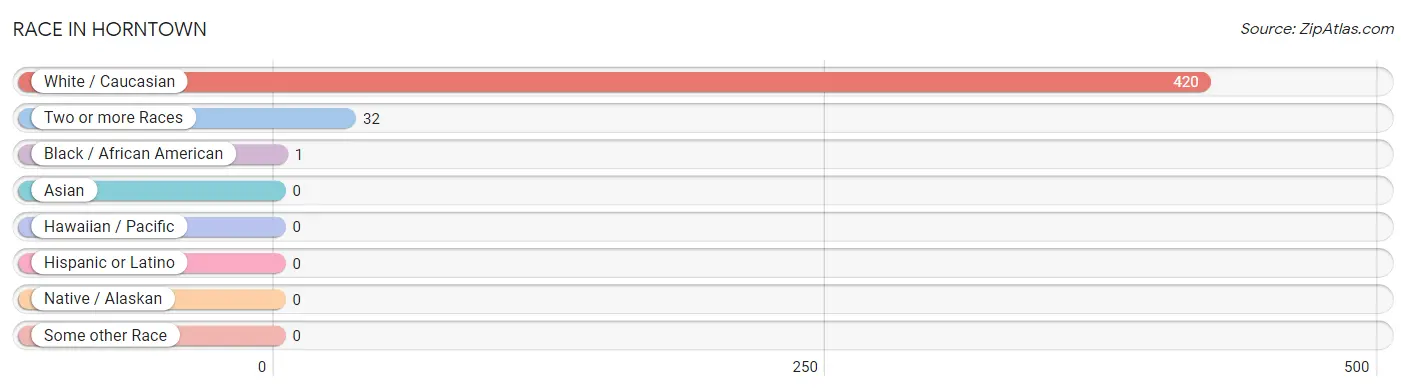
| Race | # Population | % Population |
| Asian | 0 | 0.0% |
| Black / African American | 1 | 0.2% |
| Hawaiian / Pacific | 0 | 0.0% |
| Hispanic or Latino | 0 | 0.0% |
| Native / Alaskan | 0 | 0.0% |
| White / Caucasian | 420 | 92.7% |
| Two or more Races | 32 | 7.1% |
| Some other Race | 0 | 0.0% |
| Total | 453 | 100.0% |
Ancestry in Horntown
The most populous ancestries reported in Horntown are American (174 | 38.4%), German (159 | 35.1%), Northern European (118 | 26.1%), Italian (51 | 11.3%), and Irish (49 | 10.8%), together accounting for 121.6% of all Horntown residents.
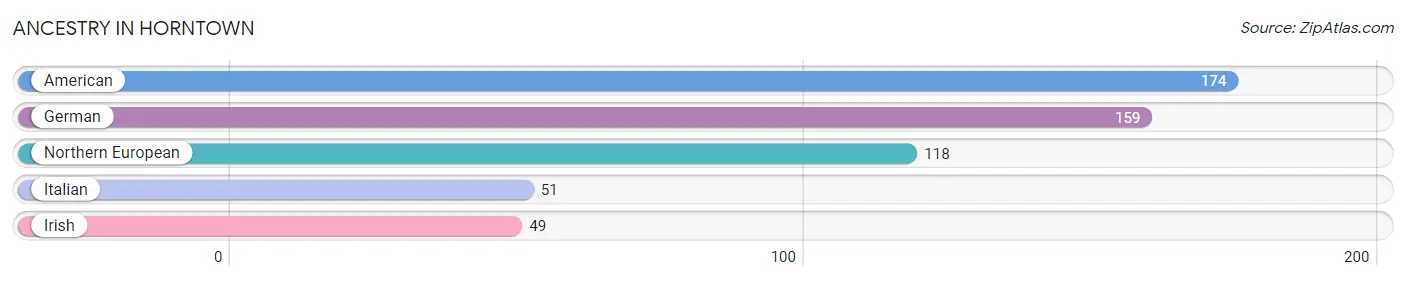
| Ancestry | # Population | % Population |
| American | 174 | 38.4% |
| German | 159 | 35.1% |
| Irish | 49 | 10.8% |
| Italian | 51 | 11.3% |
| Northern European | 118 | 26.1% | View All 5 Rows |
Immigrants in Horntown

| Immigration Origin | # Population | % Population | View All 0 Rows |
Sex and Age in Horntown
Sex and Age in Horntown
The most populous age groups in Horntown are 75 to 79 Years (74 | 36.1%) for men and 60 to 64 Years (119 | 48.0%) for women.
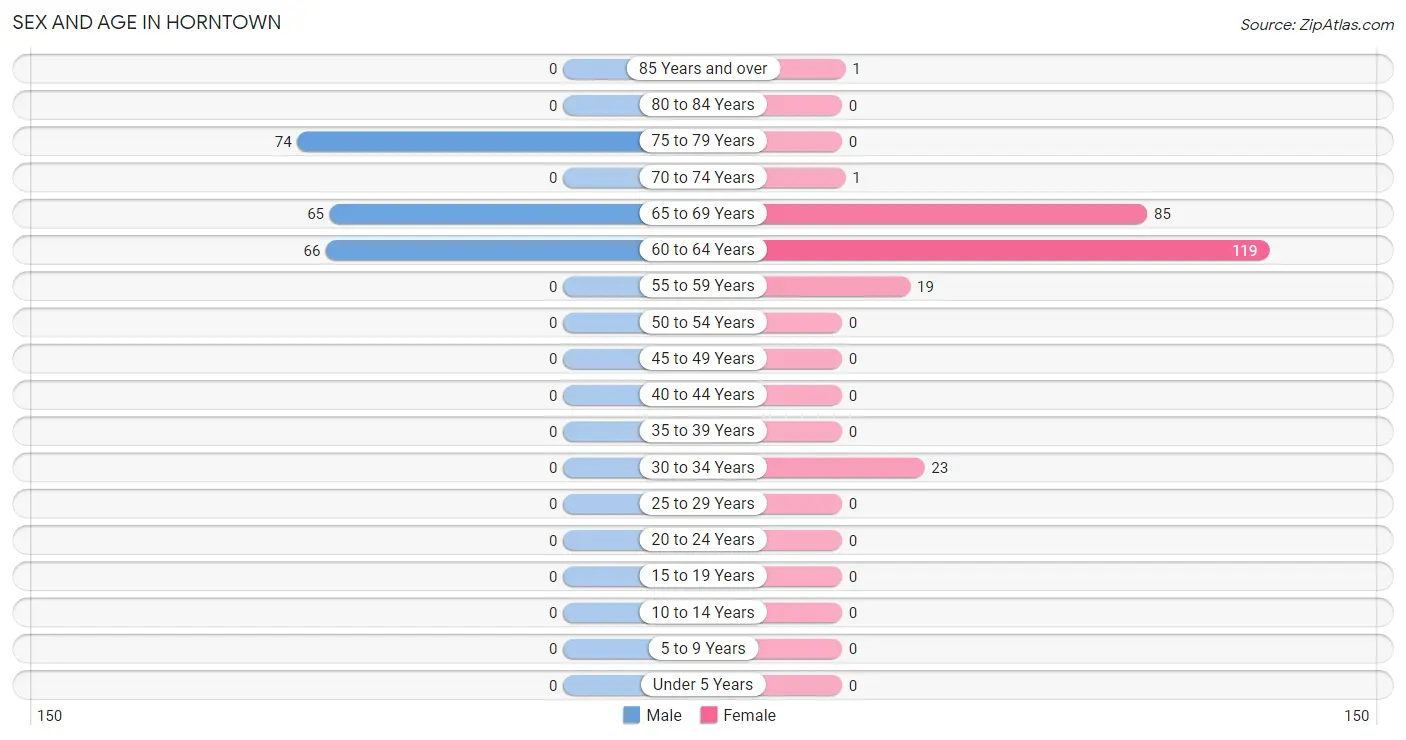
| Age Bracket | Male | Female |
| Under 5 Years | 0 (0.0%) | 0 (0.0%) |
| 5 to 9 Years | 0 (0.0%) | 0 (0.0%) |
| 10 to 14 Years | 0 (0.0%) | 0 (0.0%) |
| 15 to 19 Years | 0 (0.0%) | 0 (0.0%) |
| 20 to 24 Years | 0 (0.0%) | 0 (0.0%) |
| 25 to 29 Years | 0 (0.0%) | 0 (0.0%) |
| 30 to 34 Years | 0 (0.0%) | 23 (9.3%) |
| 35 to 39 Years | 0 (0.0%) | 0 (0.0%) |
| 40 to 44 Years | 0 (0.0%) | 0 (0.0%) |
| 45 to 49 Years | 0 (0.0%) | 0 (0.0%) |
| 50 to 54 Years | 0 (0.0%) | 0 (0.0%) |
| 55 to 59 Years | 0 (0.0%) | 19 (7.7%) |
| 60 to 64 Years | 66 (32.2%) | 119 (48.0%) |
| 65 to 69 Years | 65 (31.7%) | 85 (34.3%) |
| 70 to 74 Years | 0 (0.0%) | 1 (0.4%) |
| 75 to 79 Years | 74 (36.1%) | 0 (0.0%) |
| 80 to 84 Years | 0 (0.0%) | 0 (0.0%) |
| 85 Years and over | 0 (0.0%) | 1 (0.4%) |
| Total | 205 (100.0%) | 248 (100.0%) |
Families and Households in Horntown
Median Family Size in Horntown
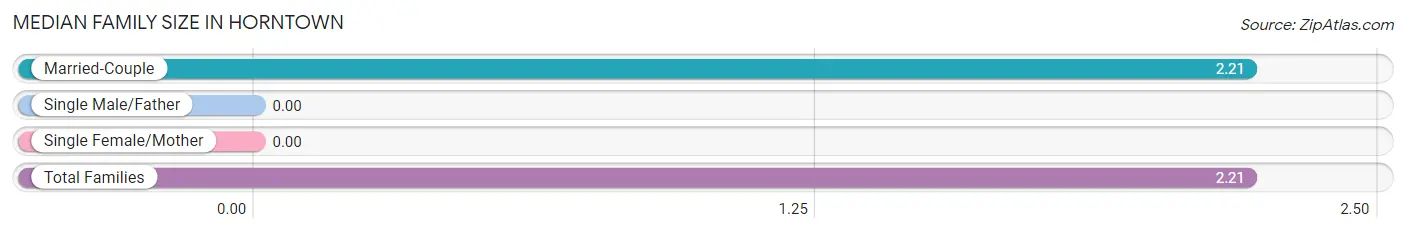
| Family Type | # Families | Family Size |
| Married-Couple | 190 (100.0%) | 2.21 |
| Single Male/Father | 0 (0.0%) | - |
| Single Female/Mother | 0 (0.0%) | - |
| Total Families | 190 (100.0%) | 2.21 |
Median Household Size in Horntown
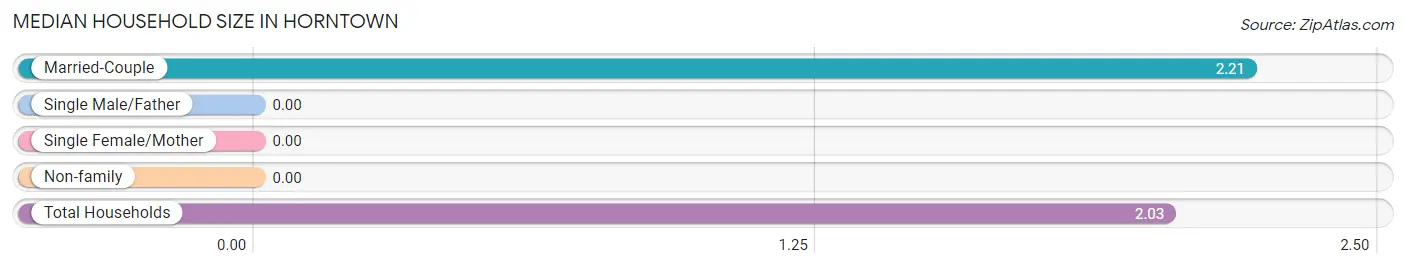
| Household Type | # Households | Household Size |
| Married-Couple | 190 (85.6%) | 2.21 |
| Single Male/Father | 0 (0.0%) | - |
| Single Female/Mother | 0 (0.0%) | - |
| Non-family | 32 (14.4%) | - |
| Total Households | 222 (100.0%) | 2.03 |
Household Size by Marriage Status in Horntown
Out of a total of 222 households in Horntown, 190 (85.6%) are family households, while 32 (14.4%) are nonfamily households. The most numerous type of family households are 2-person households, comprising 172, and the most common type of nonfamily households are 1-person households, comprising 32.
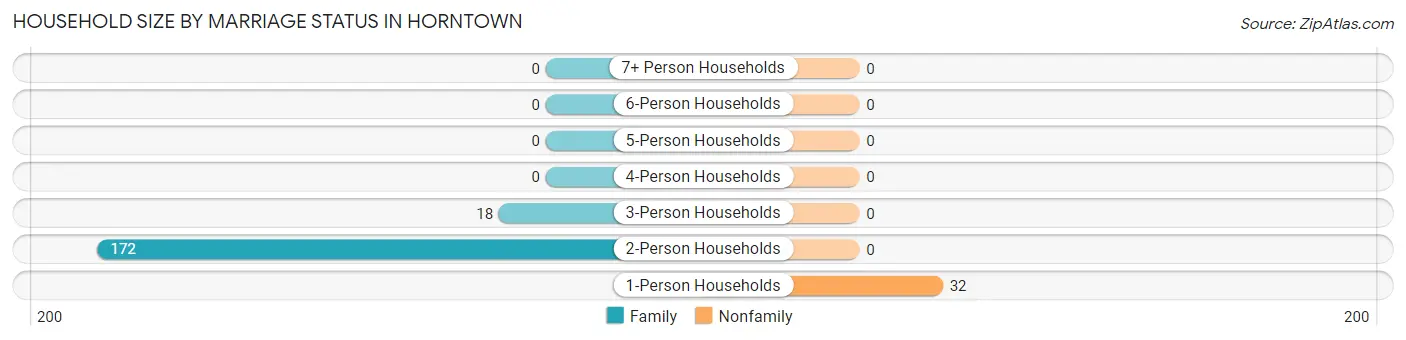
| Household Size | Family Households | Nonfamily Households |
| 1-Person Households | - | 32 (14.4%) |
| 2-Person Households | 172 (77.5%) | 0 (0.0%) |
| 3-Person Households | 18 (8.1%) | 0 (0.0%) |
| 4-Person Households | 0 (0.0%) | 0 (0.0%) |
| 5-Person Households | 0 (0.0%) | 0 (0.0%) |
| 6-Person Households | 0 (0.0%) | 0 (0.0%) |
| 7+ Person Households | 0 (0.0%) | 0 (0.0%) |
| Total | 190 (85.6%) | 32 (14.4%) |
Female Fertility in Horntown
Fertility by Age in Horntown
| Age Bracket | Women with Births | Births / 1,000 Women |
| 15 to 19 years | 0 (0.0%) | 0.0 |
| 20 to 34 years | 0 (0.0%) | 0.0 |
| 35 to 50 years | 0 (0.0%) | 0.0 |
| Total | 0 (0.0%) | 0.0 |
Fertility by Age by Marriage Status in Horntown
| Age Bracket | Married | Unmarried |
| 15 to 19 years | 0 (0.0%) | 0 (0.0%) |
| 20 to 34 years | 0 (0.0%) | 0 (0.0%) |
| 35 to 50 years | 0 (0.0%) | 0 (0.0%) |
| Total | 0 (0.0%) | 0 (0.0%) |
Fertility by Education in Horntown
| Educational Attainment | Women with Births | Births / 1,000 Women |
| Less than High School | 0 (0.0%) | 0.0 |
| High School Diploma | 0 (0.0%) | 0.0 |
| College or Associate's Degree | 0 (0.0%) | 0.0 |
| Bachelor's Degree | 0 (0.0%) | 0.0 |
| Graduate Degree | 0 (0.0%) | 0.0 |
| Total | 0 (0.0%) | 0.0 |
Fertility by Education by Marriage Status in Horntown
| Educational Attainment | Married | Unmarried |
| Less than High School | 0 (0.0%) | 0 (0.0%) |
| High School Diploma | 0 (0.0%) | 0 (0.0%) |
| College or Associate's Degree | 0 (0.0%) | 0 (0.0%) |
| Bachelor's Degree | 0 (0.0%) | 0 (0.0%) |
| Graduate Degree | 0 (0.0%) | 0 (0.0%) |
| Total | 0 (0.0%) | 0 (0.0%) |
Employment Characteristics in Horntown
Employment by Class of Employer in Horntown
Among the 19 employed individuals in Horntown, , and local government employees (19 | 100.0%) make up the most common classes of employment.
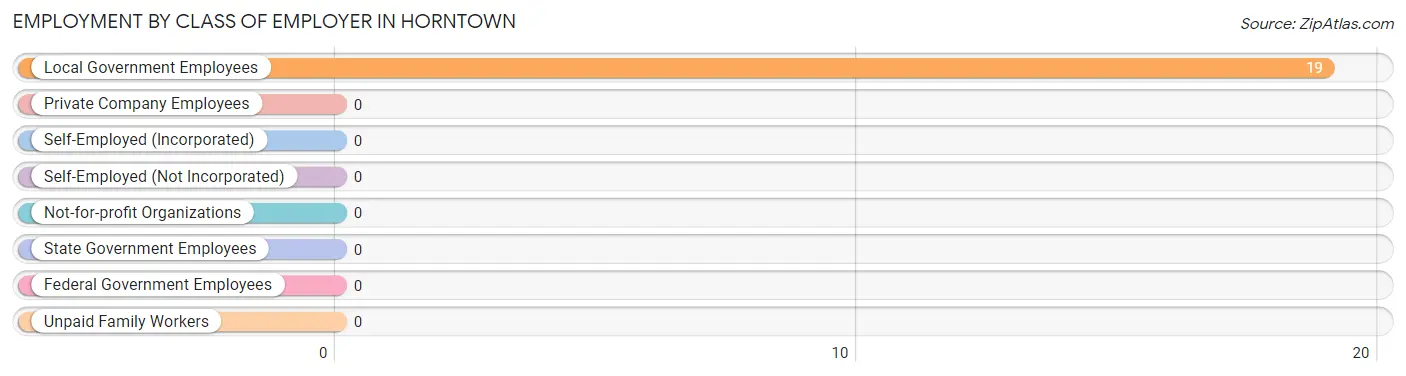
| Employer Class | # Employees | % Employees |
| Private Company Employees | 0 | 0.0% |
| Self-Employed (Incorporated) | 0 | 0.0% |
| Self-Employed (Not Incorporated) | 0 | 0.0% |
| Not-for-profit Organizations | 0 | 0.0% |
| Local Government Employees | 19 | 100.0% |
| State Government Employees | 0 | 0.0% |
| Federal Government Employees | 0 | 0.0% |
| Unpaid Family Workers | 0 | 0.0% |
| Total | 19 | 100.0% |
Employment Status by Age in Horntown
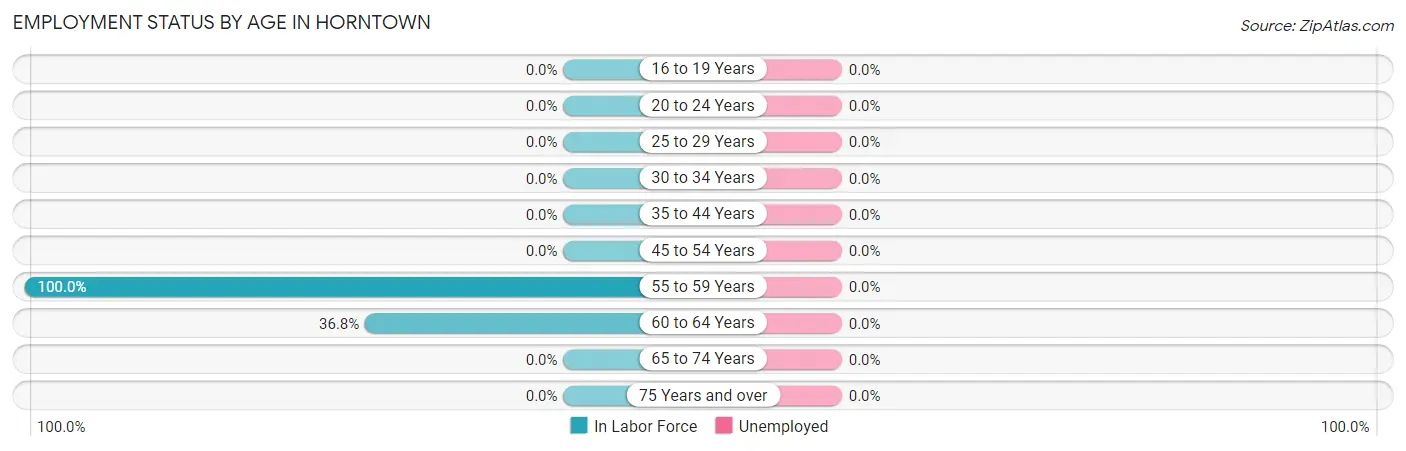
| Age Bracket | In Labor Force | Unemployed |
| 16 to 19 Years | 0 (0.0%) | 0 (0.0%) |
| 20 to 24 Years | 0 (0.0%) | 0 (0.0%) |
| 25 to 29 Years | 0 (0.0%) | 0 (0.0%) |
| 30 to 34 Years | 0 (0.0%) | 0 (0.0%) |
| 35 to 44 Years | 0 (0.0%) | 0 (0.0%) |
| 45 to 54 Years | 0 (0.0%) | 0 (0.0%) |
| 55 to 59 Years | 19 (100.0%) | 0 (0.0%) |
| 60 to 64 Years | 68 (36.8%) | 0 (0.0%) |
| 65 to 74 Years | 0 (0.0%) | 0 (0.0%) |
| 75 Years and over | 0 (0.0%) | 0 (0.0%) |
| Total | 87 (19.2%) | 0 (0.0%) |
Employment Status by Educational Attainment in Horntown
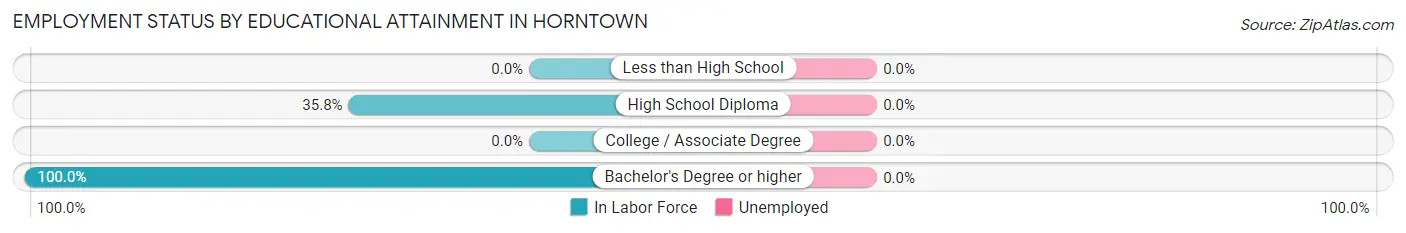
| Educational Attainment | In Labor Force | Unemployed |
| Less than High School | 0 (0.0%) | 0 (0.0%) |
| High School Diploma | 68 (35.8%) | 0 (0.0%) |
| College / Associate Degree | 0 (0.0%) | 0 (0.0%) |
| Bachelor's Degree or higher | 19 (100.0%) | 0 (0.0%) |
| Total | 87 (38.3%) | 0 (0.0%) |
Employment Occupations by Sex in Horntown
Management, Business, Science and Arts Occupations
The most common Management, Business, Science and Arts occupations in Horntown are Health Diagnosing & Treating (19 | 21.8%), and Health Technologists (19 | 21.8%).
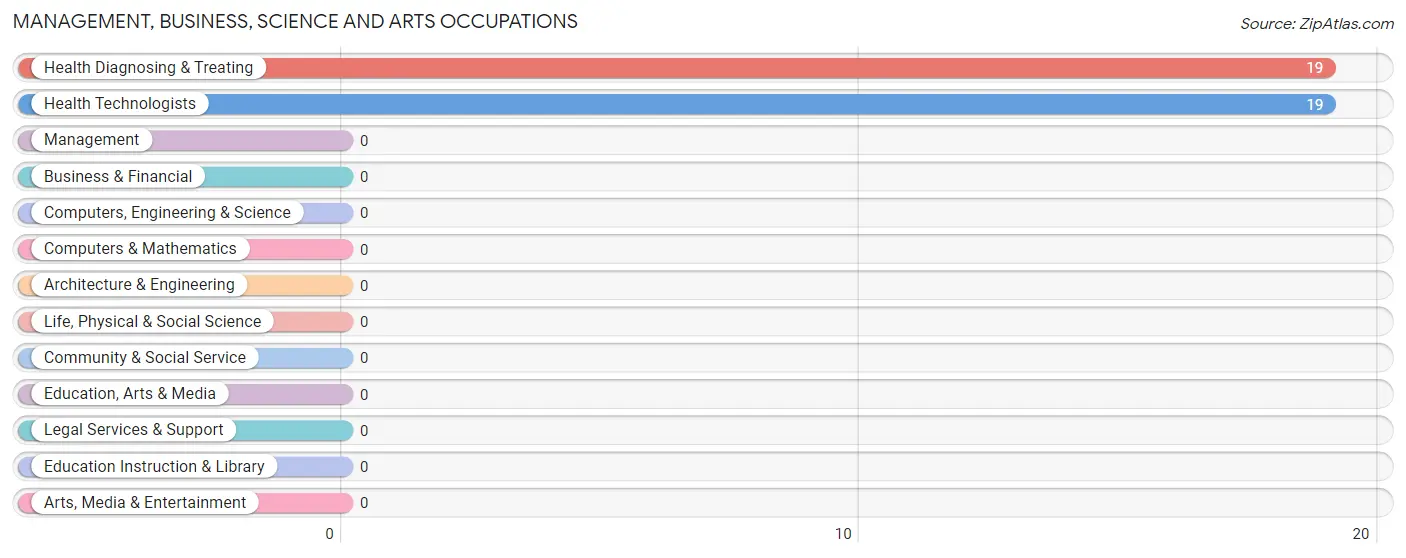
Management, Business, Science and Arts Occupations by Sex
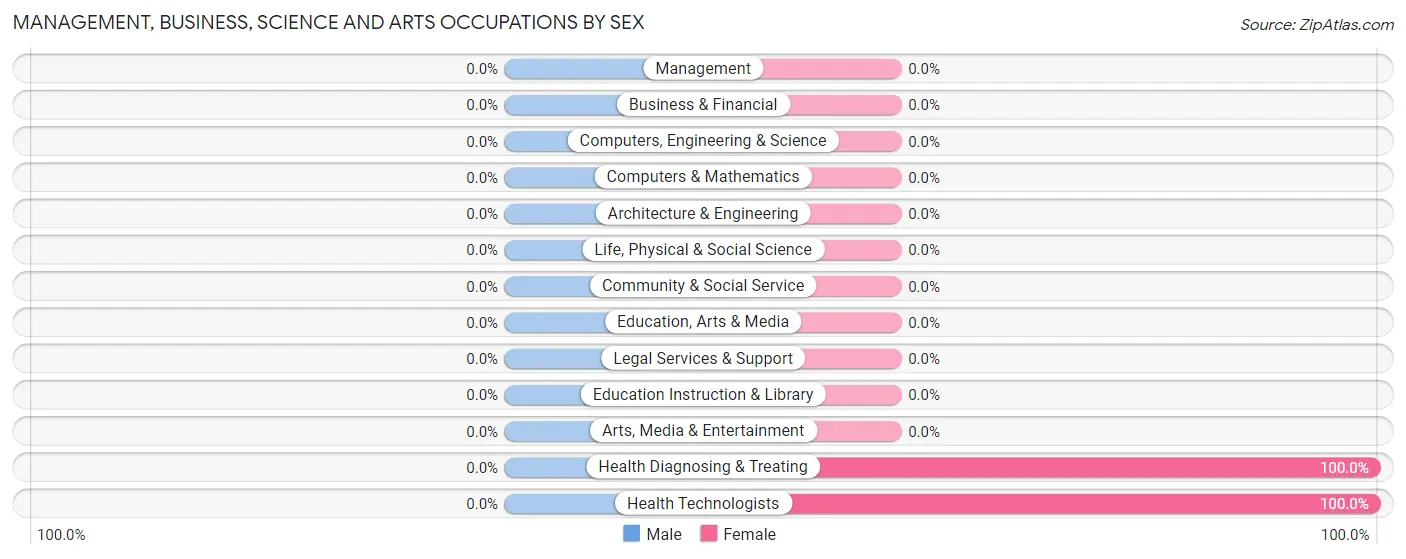
| Occupation | Male | Female |
| Management | 0 (0.0%) | 0 (0.0%) |
| Business & Financial | 0 (0.0%) | 0 (0.0%) |
| Computers, Engineering & Science | 0 (0.0%) | 0 (0.0%) |
| Computers & Mathematics | 0 (0.0%) | 0 (0.0%) |
| Architecture & Engineering | 0 (0.0%) | 0 (0.0%) |
| Life, Physical & Social Science | 0 (0.0%) | 0 (0.0%) |
| Community & Social Service | 0 (0.0%) | 0 (0.0%) |
| Education, Arts & Media | 0 (0.0%) | 0 (0.0%) |
| Legal Services & Support | 0 (0.0%) | 0 (0.0%) |
| Education Instruction & Library | 0 (0.0%) | 0 (0.0%) |
| Arts, Media & Entertainment | 0 (0.0%) | 0 (0.0%) |
| Health Diagnosing & Treating | 0 (0.0%) | 19 (100.0%) |
| Health Technologists | 0 (0.0%) | 19 (100.0%) |
| Total (Category) | 0 (0.0%) | 19 (100.0%) |
| Total (Overall) | 0 (0.0%) | 87 (100.0%) |
Services Occupations
Services Occupations by Sex
| Occupation | Male | Female |
| Healthcare Support | 0 (0.0%) | 0 (0.0%) |
| Security & Protection | 0 (0.0%) | 0 (0.0%) |
| Firefighting & Prevention | 0 (0.0%) | 0 (0.0%) |
| Law Enforcement | 0 (0.0%) | 0 (0.0%) |
| Food Preparation & Serving | 0 (0.0%) | 0 (0.0%) |
| Cleaning & Maintenance | 0 (0.0%) | 0 (0.0%) |
| Personal Care & Service | 0 (0.0%) | 0 (0.0%) |
| Total (Category) | 0 (0.0%) | 0 (0.0%) |
| Total (Overall) | 0 (0.0%) | 87 (100.0%) |
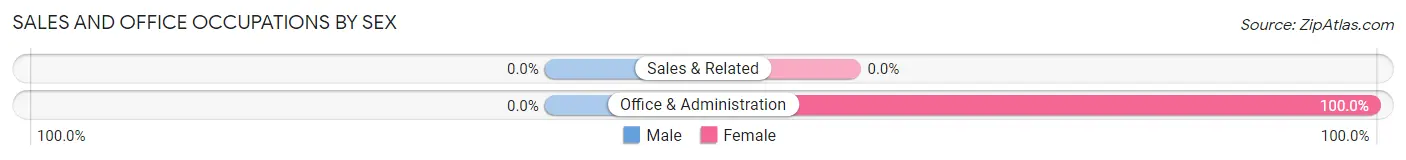
Sales and Office Occupations
The most common Sales and Office occupations in Horntown are , and Office & Administration (68 | 78.2%).
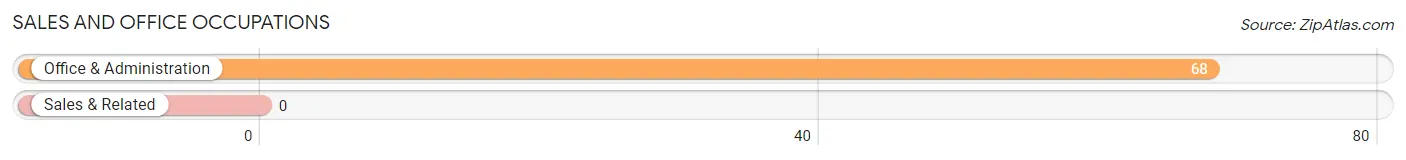
Sales and Office Occupations by Sex
| Occupation | Male | Female |
| Sales & Related | 0 (0.0%) | 0 (0.0%) |
| Office & Administration | 0 (0.0%) | 68 (100.0%) |
| Total (Category) | 0 (0.0%) | 68 (100.0%) |
| Total (Overall) | 0 (0.0%) | 87 (100.0%) |
Natural Resources, Construction and Maintenance Occupations
Natural Resources, Construction and Maintenance Occupations by Sex
| Occupation | Male | Female |
| Farming, Fishing & Forestry | 0 (0.0%) | 0 (0.0%) |
| Construction & Extraction | 0 (0.0%) | 0 (0.0%) |
| Installation, Maintenance & Repair | 0 (0.0%) | 0 (0.0%) |
| Total (Category) | 0 (0.0%) | 0 (0.0%) |
| Total (Overall) | 0 (0.0%) | 87 (100.0%) |
Production, Transportation and Moving Occupations
Production, Transportation and Moving Occupations by Sex
| Occupation | Male | Female |
| Production | 0 (0.0%) | 0 (0.0%) |
| Transportation | 0 (0.0%) | 0 (0.0%) |
| Material Moving | 0 (0.0%) | 0 (0.0%) |
| Total (Category) | 0 (0.0%) | 0 (0.0%) |
| Total (Overall) | 0 (0.0%) | 87 (100.0%) |
Employment Industries by Sex in Horntown
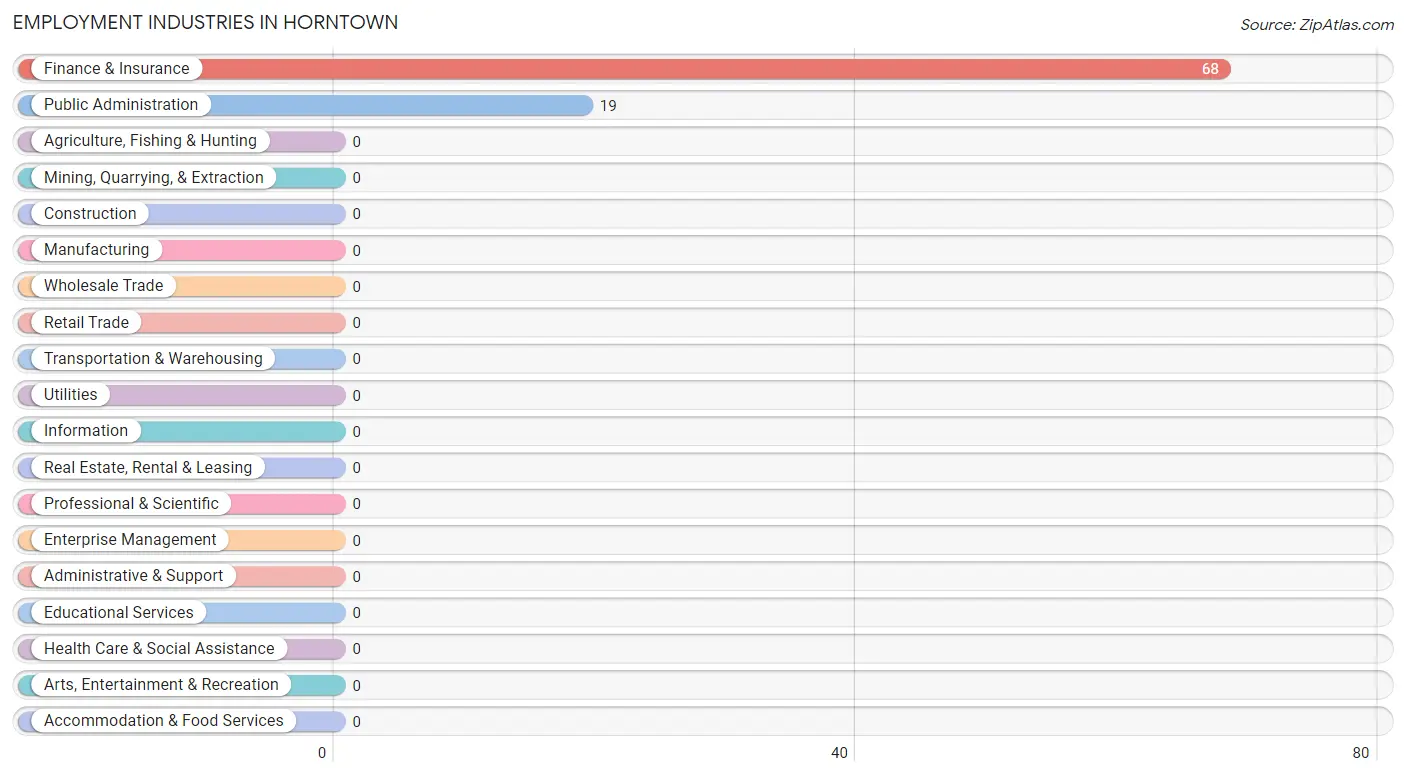
Employment Industries in Horntown
The major employment industries in Horntown include Finance & Insurance (68 | 78.2%), and Public Administration (19 | 21.8%).
Employment Industries by Sex in Horntown
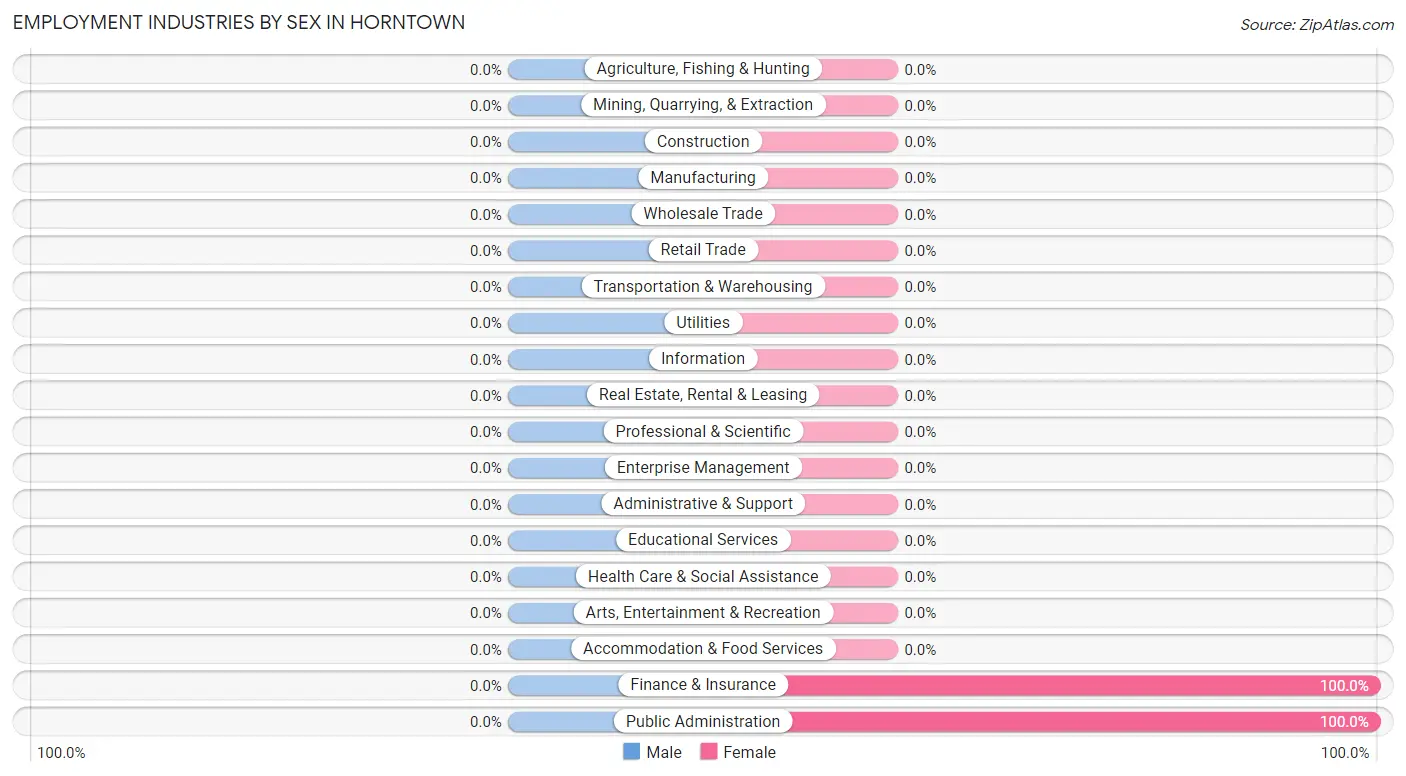
| Industry | Male | Female |
| Agriculture, Fishing & Hunting | 0 (0.0%) | 0 (0.0%) |
| Mining, Quarrying, & Extraction | 0 (0.0%) | 0 (0.0%) |
| Construction | 0 (0.0%) | 0 (0.0%) |
| Manufacturing | 0 (0.0%) | 0 (0.0%) |
| Wholesale Trade | 0 (0.0%) | 0 (0.0%) |
| Retail Trade | 0 (0.0%) | 0 (0.0%) |
| Transportation & Warehousing | 0 (0.0%) | 0 (0.0%) |
| Utilities | 0 (0.0%) | 0 (0.0%) |
| Information | 0 (0.0%) | 0 (0.0%) |
| Finance & Insurance | 0 (0.0%) | 68 (100.0%) |
| Real Estate, Rental & Leasing | 0 (0.0%) | 0 (0.0%) |
| Professional & Scientific | 0 (0.0%) | 0 (0.0%) |
| Enterprise Management | 0 (0.0%) | 0 (0.0%) |
| Administrative & Support | 0 (0.0%) | 0 (0.0%) |
| Educational Services | 0 (0.0%) | 0 (0.0%) |
| Health Care & Social Assistance | 0 (0.0%) | 0 (0.0%) |
| Arts, Entertainment & Recreation | 0 (0.0%) | 0 (0.0%) |
| Accommodation & Food Services | 0 (0.0%) | 0 (0.0%) |
| Public Administration | 0 (0.0%) | 19 (100.0%) |
| Total | 0 (0.0%) | 87 (100.0%) |
Education in Horntown
School Enrollment in Horntown
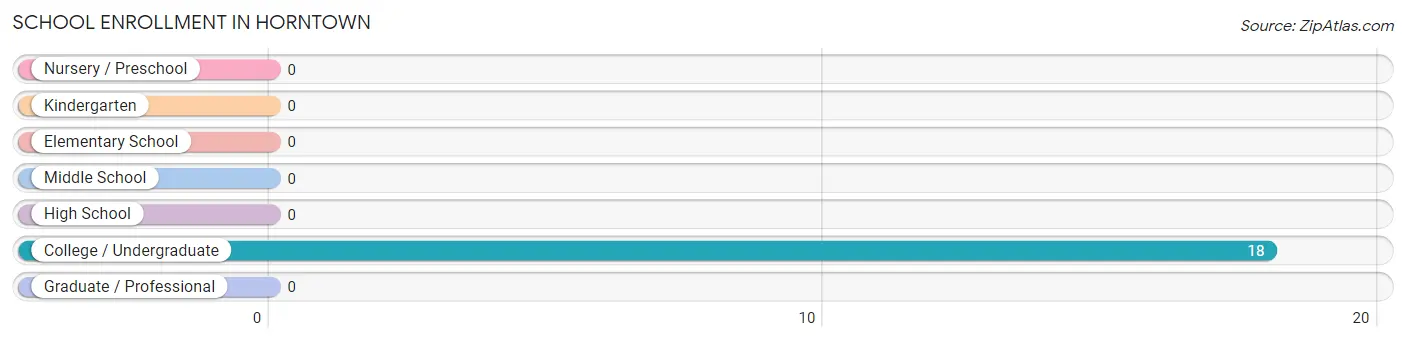
| School Level | # Students | % Students |
| Nursery / Preschool | 0 | 0.0% |
| Kindergarten | 0 | 0.0% |
| Elementary School | 0 | 0.0% |
| Middle School | 0 | 0.0% |
| High School | 0 | 0.0% |
| College / Undergraduate | 18 | 100.0% |
| Graduate / Professional | 0 | 0.0% |
| Total | 18 | 100.0% |
School Enrollment by Age by Funding Source in Horntown
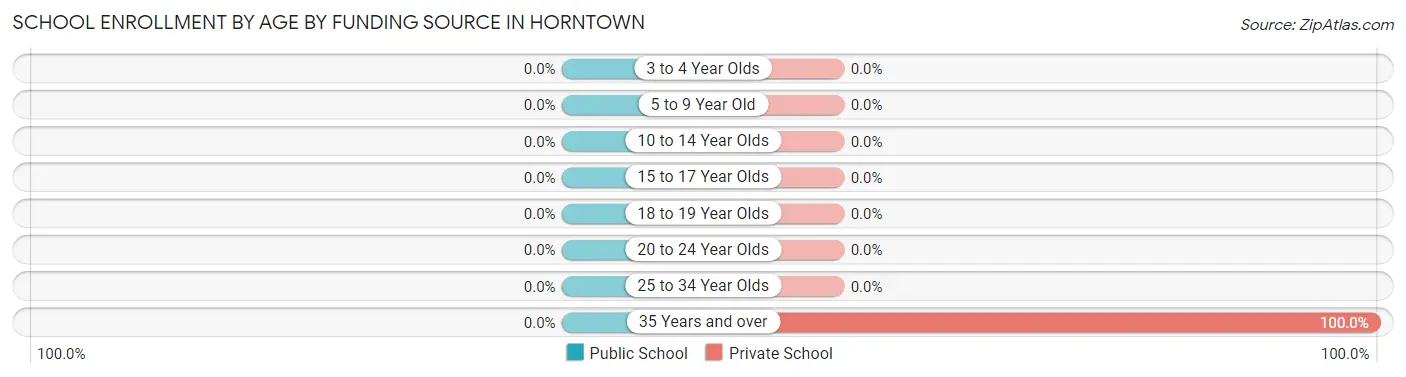
| Age Bracket | Public School | Private School |
| 3 to 4 Year Olds | 0 (0.0%) | 0 (0.0%) |
| 5 to 9 Year Old | 0 (0.0%) | 0 (0.0%) |
| 10 to 14 Year Olds | 0 (0.0%) | 0 (0.0%) |
| 15 to 17 Year Olds | 0 (0.0%) | 0 (0.0%) |
| 18 to 19 Year Olds | 0 (0.0%) | 0 (0.0%) |
| 20 to 24 Year Olds | 0 (0.0%) | 0 (0.0%) |
| 25 to 34 Year Olds | 0 (0.0%) | 0 (0.0%) |
| 35 Years and over | 0 (0.0%) | 18 (100.0%) |
| Total | 0 (0.0%) | 18 (100.0%) |
Educational Attainment by Field of Study in Horntown
Liberal arts & history (75 | 50.7%), business (53 | 35.8%), and science & technology (20 | 13.5%) are the most common fields of study among 148 individuals in Horntown who have obtained a bachelor's degree or higher.
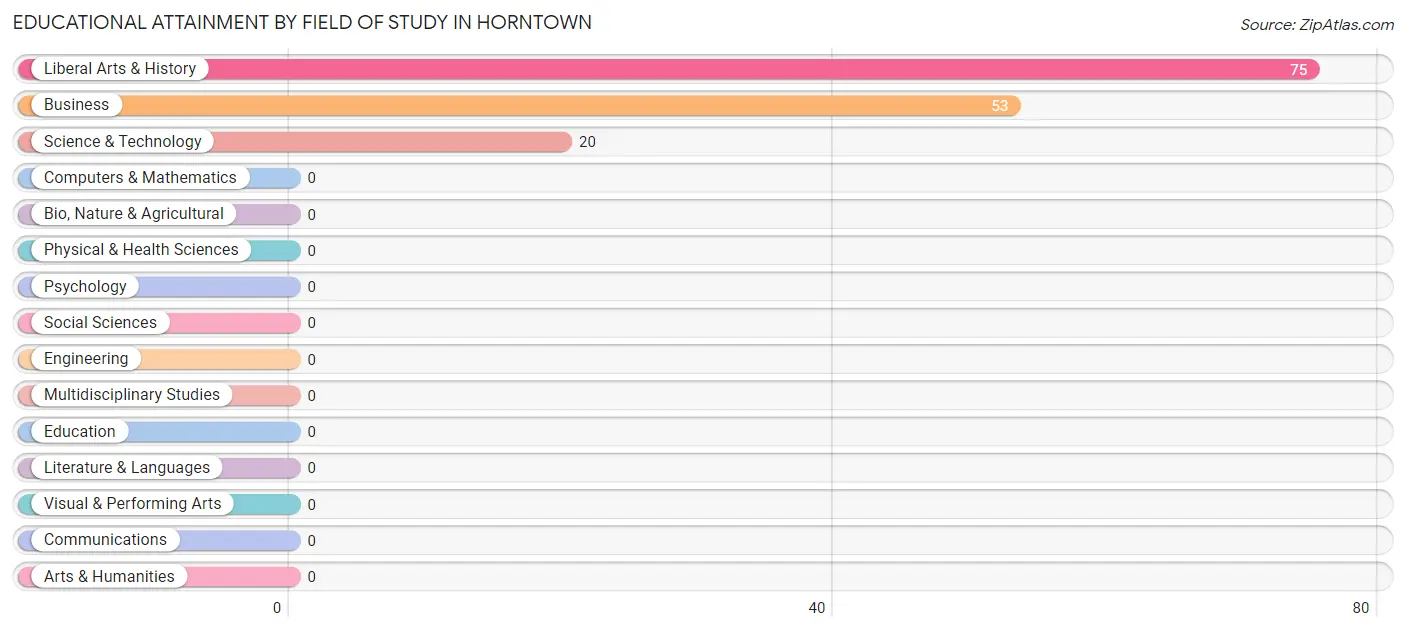
| Field of Study | # Graduates | % Graduates |
| Computers & Mathematics | 0 | 0.0% |
| Bio, Nature & Agricultural | 0 | 0.0% |
| Physical & Health Sciences | 0 | 0.0% |
| Psychology | 0 | 0.0% |
| Social Sciences | 0 | 0.0% |
| Engineering | 0 | 0.0% |
| Multidisciplinary Studies | 0 | 0.0% |
| Science & Technology | 20 | 13.5% |
| Business | 53 | 35.8% |
| Education | 0 | 0.0% |
| Literature & Languages | 0 | 0.0% |
| Liberal Arts & History | 75 | 50.7% |
| Visual & Performing Arts | 0 | 0.0% |
| Communications | 0 | 0.0% |
| Arts & Humanities | 0 | 0.0% |
| Total | 148 | 100.0% |
Transportation & Commute in Horntown
Vehicle Availability by Sex in Horntown
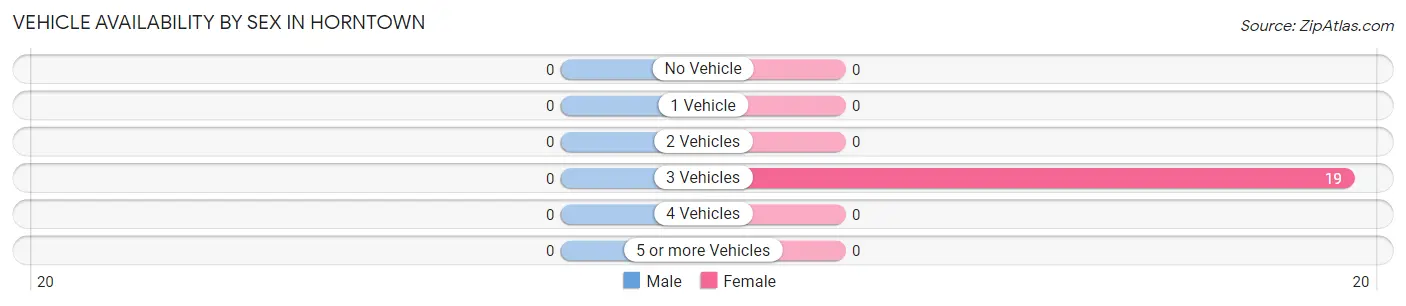
| Vehicles Available | Male | Female |
| No Vehicle | 0 (0.0%) | 0 (0.0%) |
| 1 Vehicle | 0 (0.0%) | 0 (0.0%) |
| 2 Vehicles | 0 (0.0%) | 0 (0.0%) |
| 3 Vehicles | 0 (0.0%) | 19 (100.0%) |
| 4 Vehicles | 0 (0.0%) | 0 (0.0%) |
| 5 or more Vehicles | 0 (0.0%) | 0 (0.0%) |
| Total | 0 (0.0%) | 19 (100.0%) |
Commute Time in Horntown
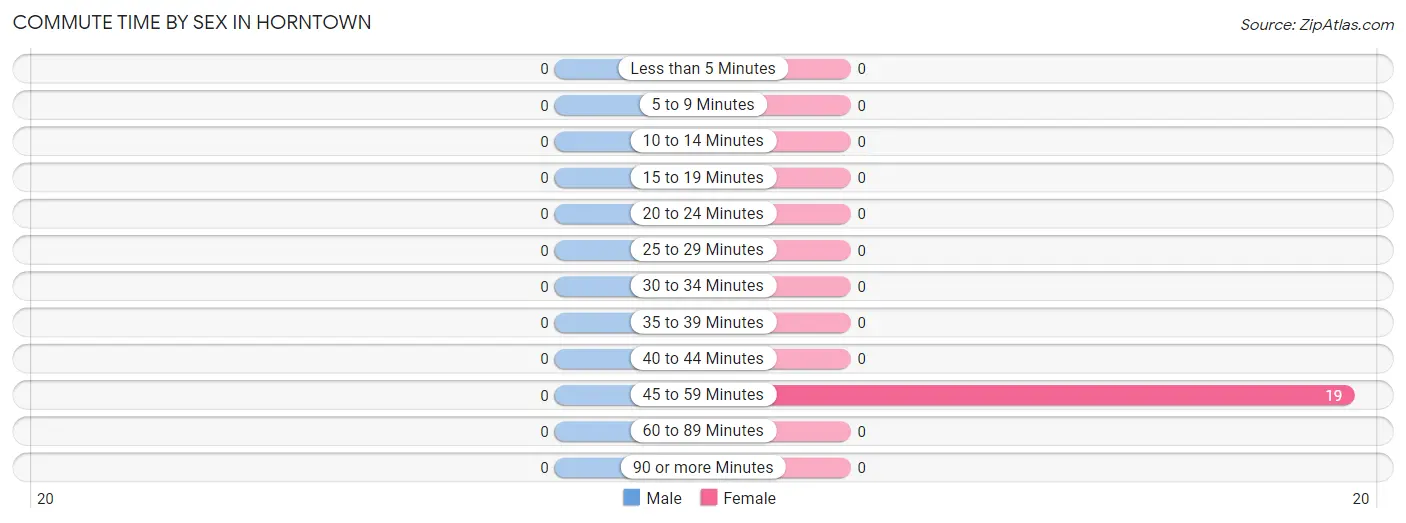
The most frequently occuring commute durations in Horntown are 45 to 59 minutes (19 commuters, 100.0%), less than 5 minutes (0 commuters, 0.0%), and 5 to 9 minutes (0 commuters, 0.0%).
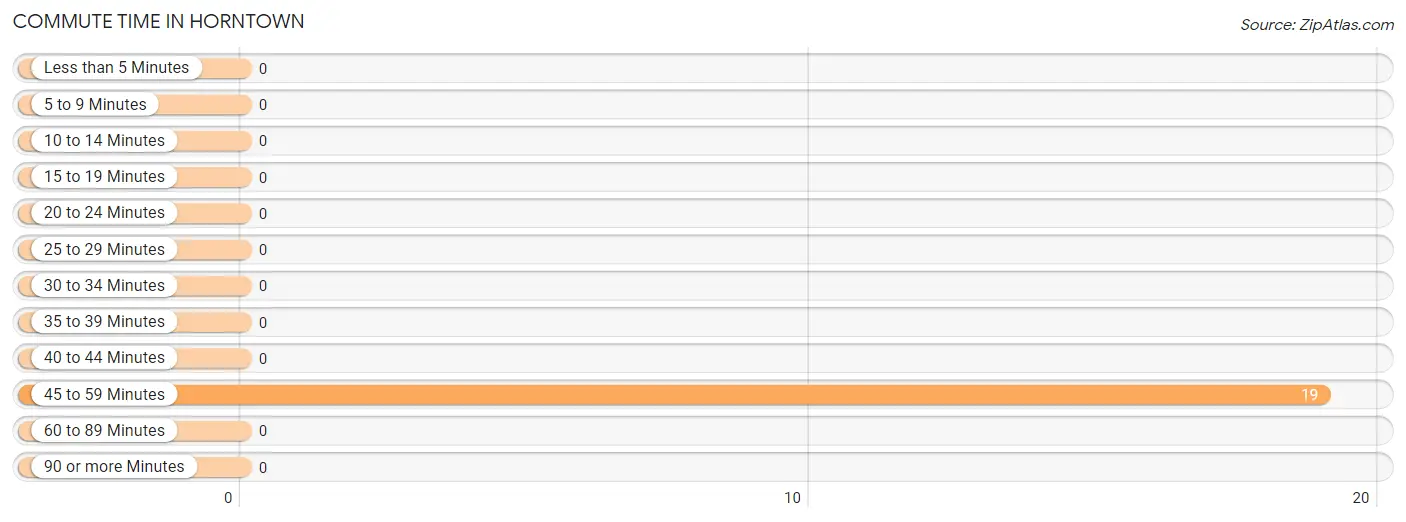
| Commute Time | # Commuters | % Commuters |
| Less than 5 Minutes | 0 | 0.0% |
| 5 to 9 Minutes | 0 | 0.0% |
| 10 to 14 Minutes | 0 | 0.0% |
| 15 to 19 Minutes | 0 | 0.0% |
| 20 to 24 Minutes | 0 | 0.0% |
| 25 to 29 Minutes | 0 | 0.0% |
| 30 to 34 Minutes | 0 | 0.0% |
| 35 to 39 Minutes | 0 | 0.0% |
| 40 to 44 Minutes | 0 | 0.0% |
| 45 to 59 Minutes | 19 | 100.0% |
| 60 to 89 Minutes | 0 | 0.0% |
| 90 or more Minutes | 0 | 0.0% |
Commute Time by Sex in Horntown
| Commute Time | Male | Female |
| Less than 5 Minutes | 0 (0.0%) | 0 (0.0%) |
| 5 to 9 Minutes | 0 (0.0%) | 0 (0.0%) |
| 10 to 14 Minutes | 0 (0.0%) | 0 (0.0%) |
| 15 to 19 Minutes | 0 (0.0%) | 0 (0.0%) |
| 20 to 24 Minutes | 0 (0.0%) | 0 (0.0%) |
| 25 to 29 Minutes | 0 (0.0%) | 0 (0.0%) |
| 30 to 34 Minutes | 0 (0.0%) | 0 (0.0%) |
| 35 to 39 Minutes | 0 (0.0%) | 0 (0.0%) |
| 40 to 44 Minutes | 0 (0.0%) | 0 (0.0%) |
| 45 to 59 Minutes | 0 (0.0%) | 19 (100.0%) |
| 60 to 89 Minutes | 0 (0.0%) | 0 (0.0%) |
| 90 or more Minutes | 0 (0.0%) | 0 (0.0%) |
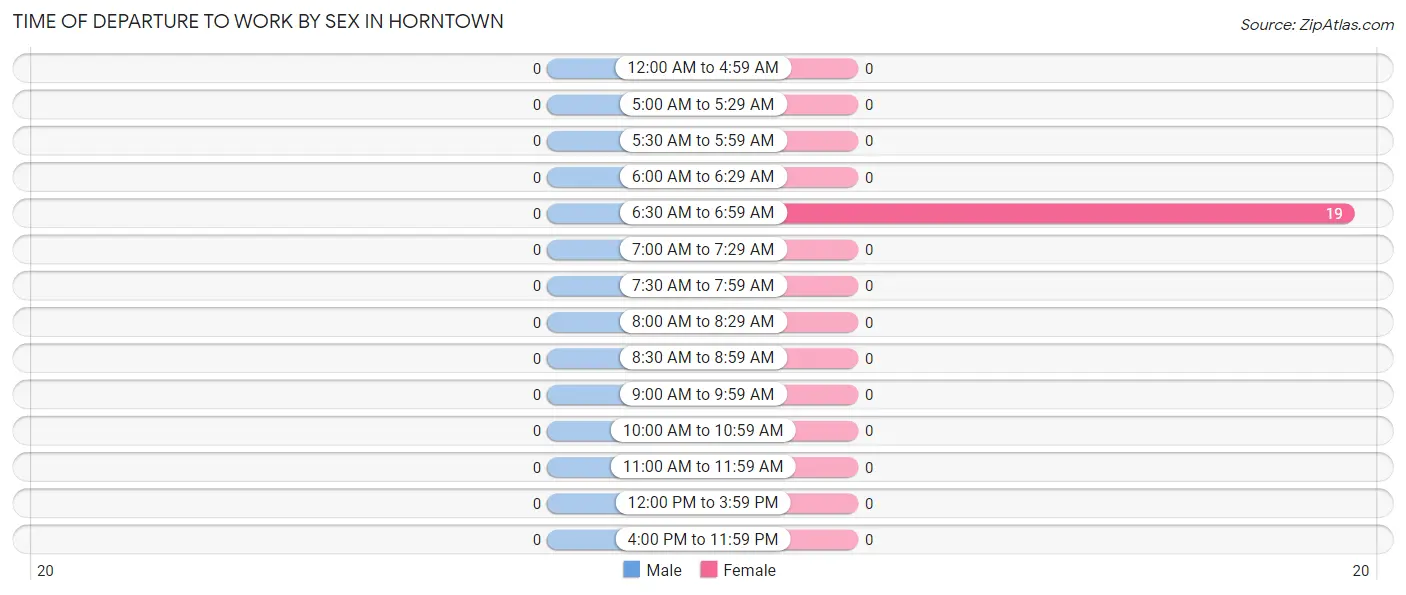
Time of Departure to Work by Sex in Horntown
| Time of Departure | Male | Female |
| 12:00 AM to 4:59 AM | 0 (0.0%) | 0 (0.0%) |
| 5:00 AM to 5:29 AM | 0 (0.0%) | 0 (0.0%) |
| 5:30 AM to 5:59 AM | 0 (0.0%) | 0 (0.0%) |
| 6:00 AM to 6:29 AM | 0 (0.0%) | 0 (0.0%) |
| 6:30 AM to 6:59 AM | 0 (0.0%) | 19 (100.0%) |
| 7:00 AM to 7:29 AM | 0 (0.0%) | 0 (0.0%) |
| 7:30 AM to 7:59 AM | 0 (0.0%) | 0 (0.0%) |
| 8:00 AM to 8:29 AM | 0 (0.0%) | 0 (0.0%) |
| 8:30 AM to 8:59 AM | 0 (0.0%) | 0 (0.0%) |
| 9:00 AM to 9:59 AM | 0 (0.0%) | 0 (0.0%) |
| 10:00 AM to 10:59 AM | 0 (0.0%) | 0 (0.0%) |
| 11:00 AM to 11:59 AM | 0 (0.0%) | 0 (0.0%) |
| 12:00 PM to 3:59 PM | 0 (0.0%) | 0 (0.0%) |
| 4:00 PM to 11:59 PM | 0 (0.0%) | 0 (0.0%) |
| Total | 0 (0.0%) | 19 (100.0%) |
Housing Occupancy in Horntown
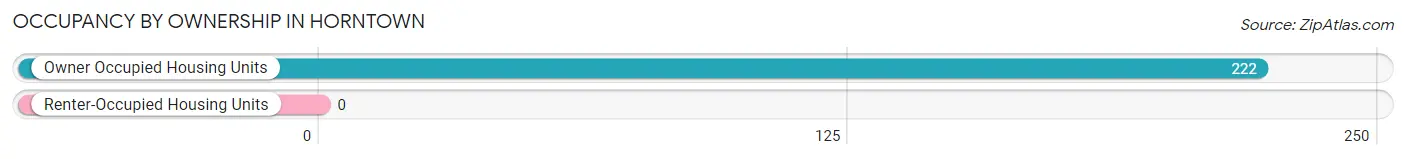
Occupancy by Ownership in Horntown
Of the total 222 dwellings in Horntown, owner-occupied units account for 222 (100.0%), while renter-occupied units make up 0 (0.0%).
| Occupancy | # Housing Units | % Housing Units |
| Owner Occupied Housing Units | 222 | 100.0% |
| Renter-Occupied Housing Units | 0 | 0.0% |
| Total Occupied Housing Units | 222 | 100.0% |
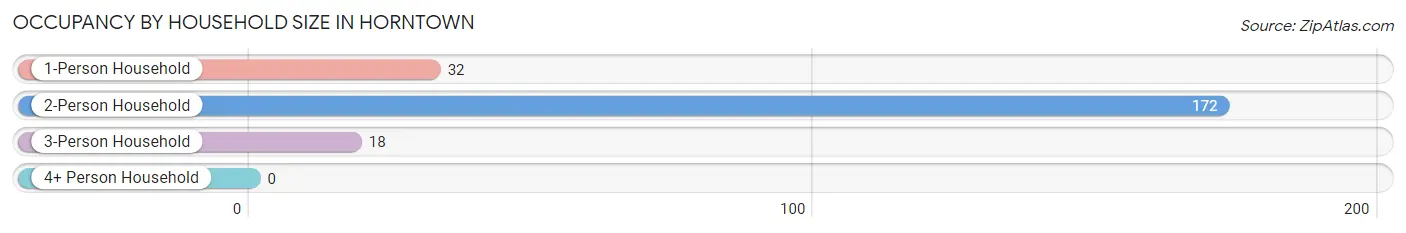
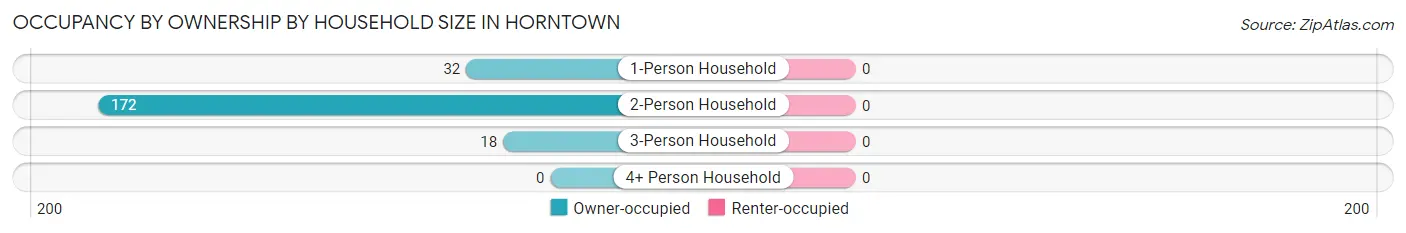
Occupancy by Household Size in Horntown
| Household Size | # Housing Units | % Housing Units |
| 1-Person Household | 32 | 14.4% |
| 2-Person Household | 172 | 77.5% |
| 3-Person Household | 18 | 8.1% |
| 4+ Person Household | 0 | 0.0% |
| Total Housing Units | 222 | 100.0% |
Occupancy by Ownership by Household Size in Horntown
| Household Size | Owner-occupied | Renter-occupied |
| 1-Person Household | 32 (100.0%) | 0 (0.0%) |
| 2-Person Household | 172 (100.0%) | 0 (0.0%) |
| 3-Person Household | 18 (100.0%) | 0 (0.0%) |
| 4+ Person Household | 0 (0.0%) | 0 (0.0%) |
| Total Housing Units | 222 (100.0%) | 0 (0.0%) |
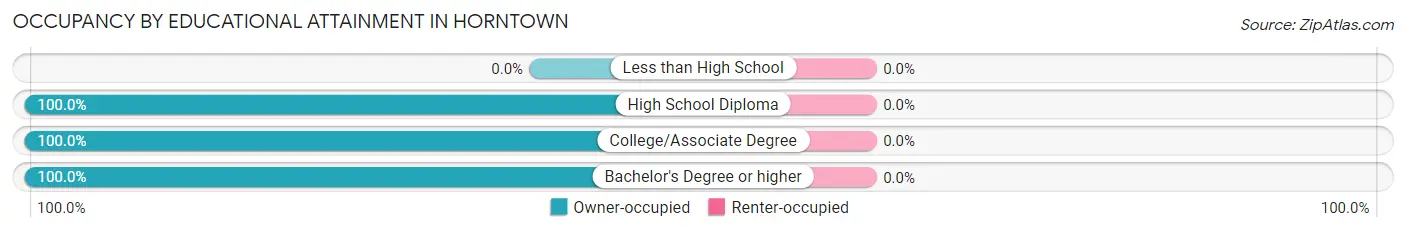
Occupancy by Educational Attainment in Horntown
| Household Size | Owner-occupied | Renter-occupied |
| Less than High School | 0 (0.0%) | 0 (0.0%) |
| High School Diploma | 119 (100.0%) | 0 (0.0%) |
| College/Associate Degree | 50 (100.0%) | 0 (0.0%) |
| Bachelor's Degree or higher | 53 (100.0%) | 0 (0.0%) |
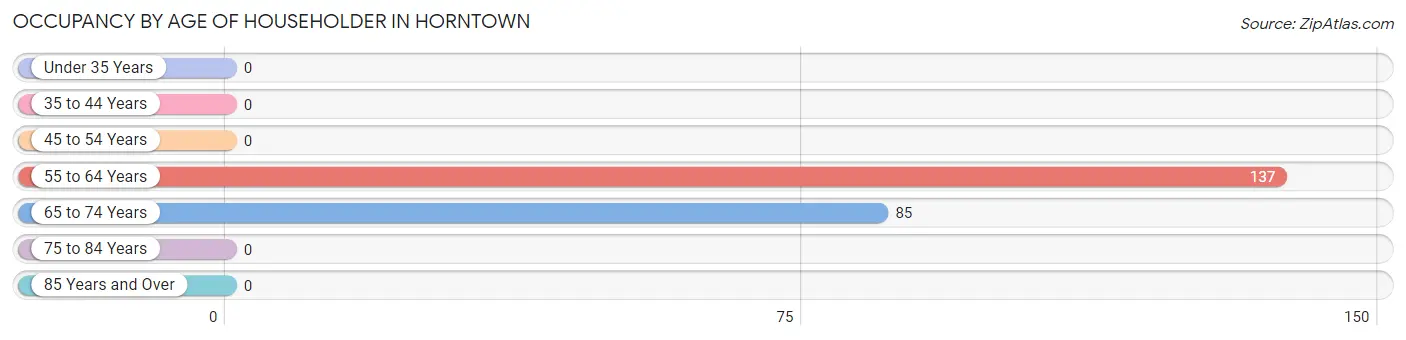
Occupancy by Age of Householder in Horntown
| Age Bracket | # Households | % Households |
| Under 35 Years | 0 | 0.0% |
| 35 to 44 Years | 0 | 0.0% |
| 45 to 54 Years | 0 | 0.0% |
| 55 to 64 Years | 137 | 61.7% |
| 65 to 74 Years | 85 | 38.3% |
| 75 to 84 Years | 0 | 0.0% |
| 85 Years and Over | 0 | 0.0% |
| Total | 222 | 100.0% |
Housing Finances in Horntown
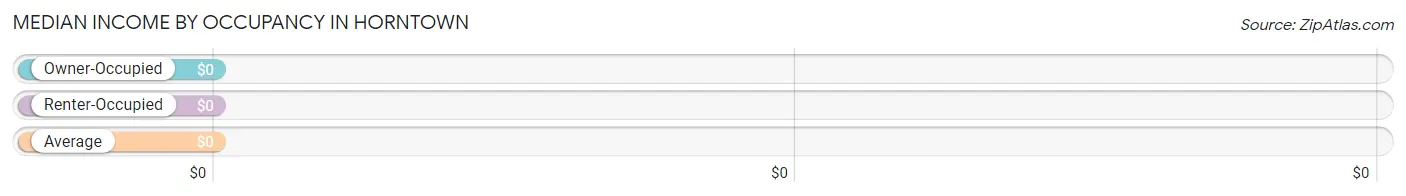
Median Income by Occupancy in Horntown
| Occupancy Type | # Households | Median Income |
| Owner-Occupied | 222 (100.0%) | $0 |
| Renter-Occupied | 0 (0.0%) | $0 |
| Average | 222 (100.0%) | $0 |
Occupancy by Householder Income Bracket in Horntown
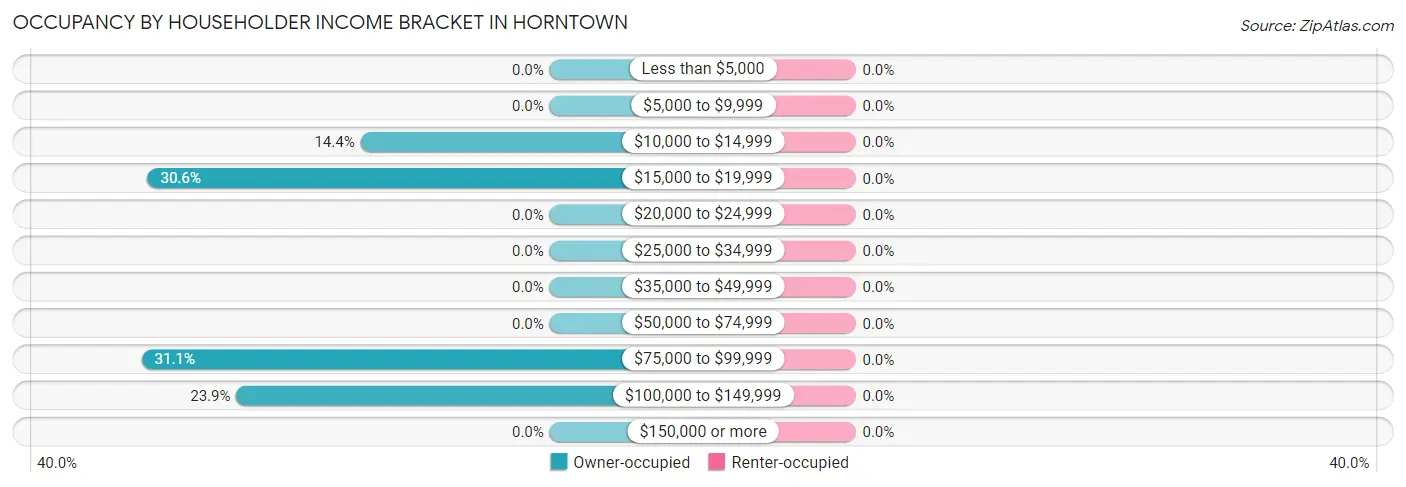
| Income Bracket | Owner-occupied | Renter-occupied |
| Less than $5,000 | 0 (0.0%) | 0 (0.0%) |
| $5,000 to $9,999 | 0 (0.0%) | 0 (0.0%) |
| $10,000 to $14,999 | 32 (14.4%) | 0 (0.0%) |
| $15,000 to $19,999 | 68 (30.6%) | 0 (0.0%) |
| $20,000 to $24,999 | 0 (0.0%) | 0 (0.0%) |
| $25,000 to $34,999 | 0 (0.0%) | 0 (0.0%) |
| $35,000 to $49,999 | 0 (0.0%) | 0 (0.0%) |
| $50,000 to $74,999 | 0 (0.0%) | 0 (0.0%) |
| $75,000 to $99,999 | 69 (31.1%) | 0 (0.0%) |
| $100,000 to $149,999 | 53 (23.9%) | 0 (0.0%) |
| $150,000 or more | 0 (0.0%) | 0 (0.0%) |
| Total | 222 (100.0%) | 0 (0.0%) |
Monthly Housing Cost Tiers in Horntown
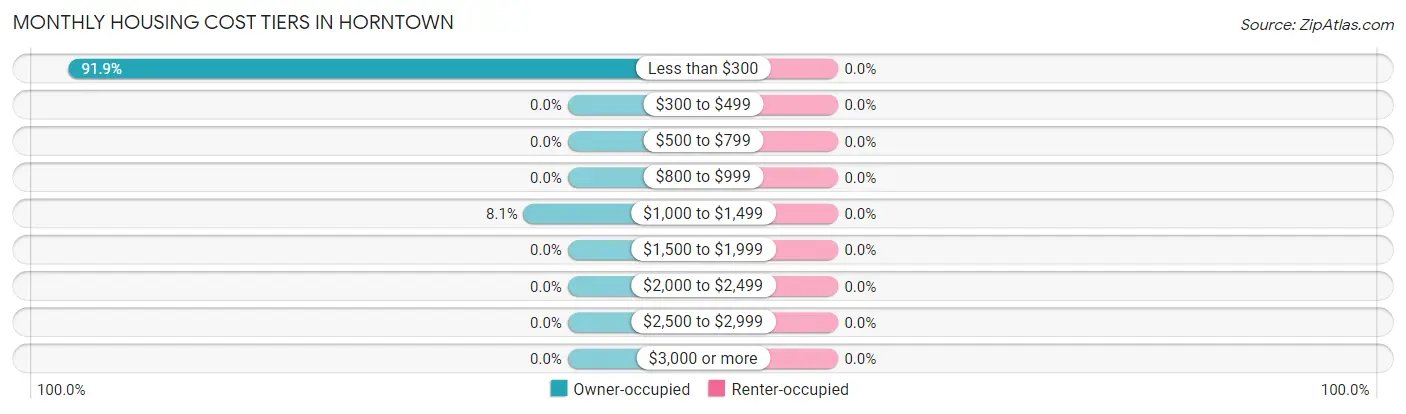
| Monthly Cost | Owner-occupied | Renter-occupied |
| Less than $300 | 204 (91.9%) | 0 (0.0%) |
| $300 to $499 | 0 (0.0%) | 0 (0.0%) |
| $500 to $799 | 0 (0.0%) | 0 (0.0%) |
| $800 to $999 | 0 (0.0%) | 0 (0.0%) |
| $1,000 to $1,499 | 18 (8.1%) | 0 (0.0%) |
| $1,500 to $1,999 | 0 (0.0%) | 0 (0.0%) |
| $2,000 to $2,499 | 0 (0.0%) | 0 (0.0%) |
| $2,500 to $2,999 | 0 (0.0%) | 0 (0.0%) |
| $3,000 or more | 0 (0.0%) | 0 (0.0%) |
| Total | 222 (100.0%) | 0 (0.0%) |
Physical Housing Characteristics in Horntown
Housing Structures in Horntown
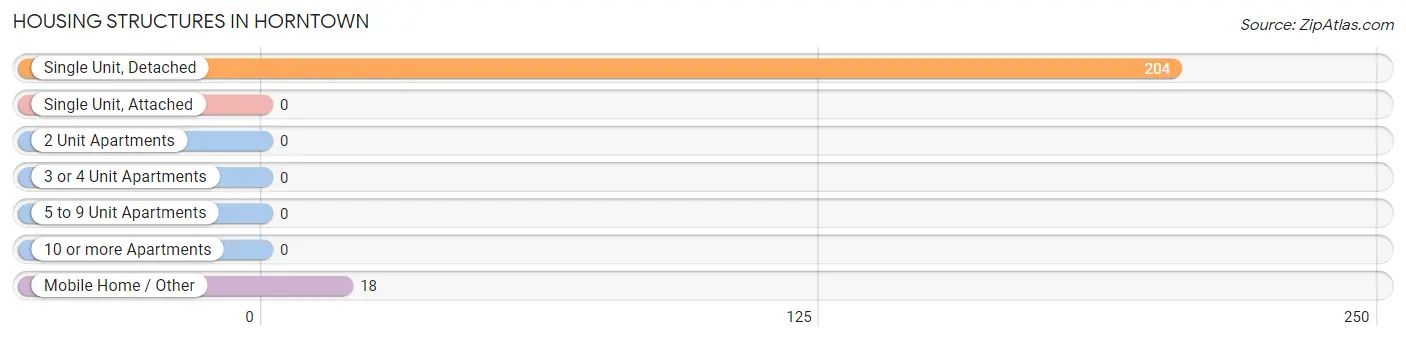
| Structure Type | # Housing Units | % Housing Units |
| Single Unit, Detached | 204 | 91.9% |
| Single Unit, Attached | 0 | 0.0% |
| 2 Unit Apartments | 0 | 0.0% |
| 3 or 4 Unit Apartments | 0 | 0.0% |
| 5 to 9 Unit Apartments | 0 | 0.0% |
| 10 or more Apartments | 0 | 0.0% |
| Mobile Home / Other | 18 | 8.1% |
| Total | 222 | 100.0% |
Housing Structures by Occupancy in Horntown
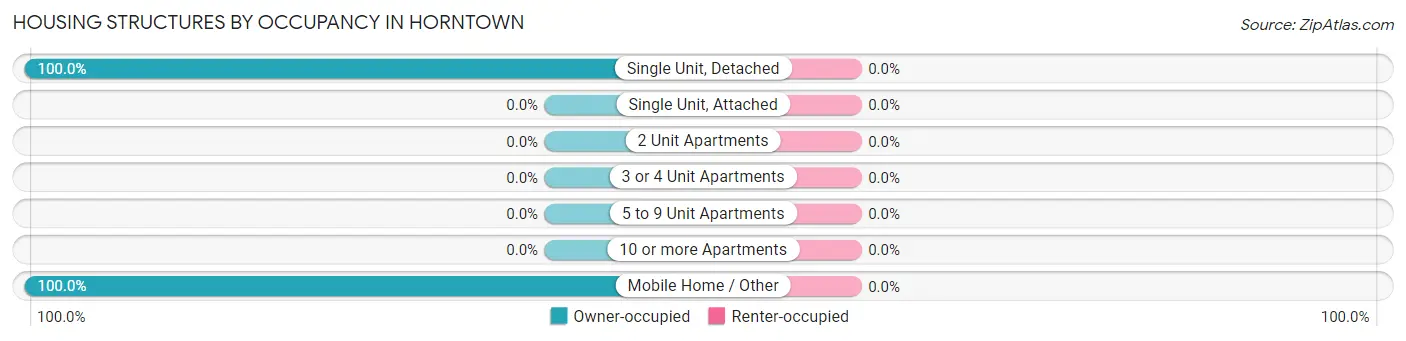
| Structure Type | Owner-occupied | Renter-occupied |
| Single Unit, Detached | 204 (100.0%) | 0 (0.0%) |
| Single Unit, Attached | 0 (0.0%) | 0 (0.0%) |
| 2 Unit Apartments | 0 (0.0%) | 0 (0.0%) |
| 3 or 4 Unit Apartments | 0 (0.0%) | 0 (0.0%) |
| 5 to 9 Unit Apartments | 0 (0.0%) | 0 (0.0%) |
| 10 or more Apartments | 0 (0.0%) | 0 (0.0%) |
| Mobile Home / Other | 18 (100.0%) | 0 (0.0%) |
| Total | 222 (100.0%) | 0 (0.0%) |
Housing Structures by Number of Rooms in Horntown
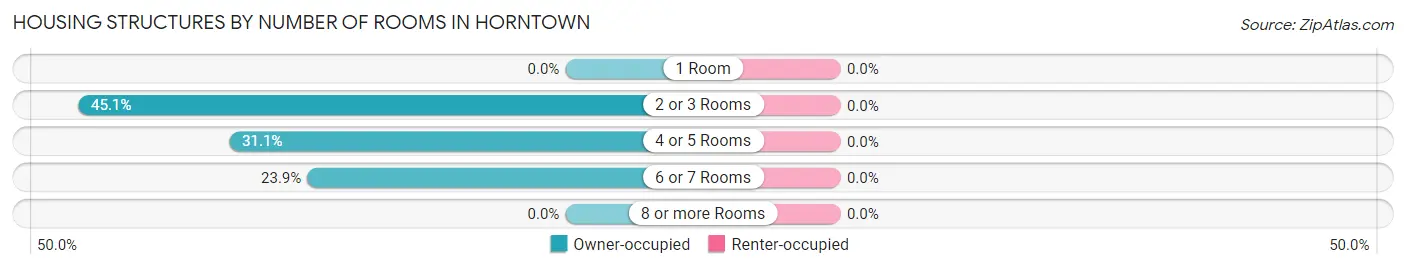
| Number of Rooms | Owner-occupied | Renter-occupied |
| 1 Room | 0 (0.0%) | 0 (0.0%) |
| 2 or 3 Rooms | 100 (45.1%) | 0 (0.0%) |
| 4 or 5 Rooms | 69 (31.1%) | 0 (0.0%) |
| 6 or 7 Rooms | 53 (23.9%) | 0 (0.0%) |
| 8 or more Rooms | 0 (0.0%) | 0 (0.0%) |
| Total | 222 (100.0%) | 0 (0.0%) |
Housing Structure by Heating Type in Horntown
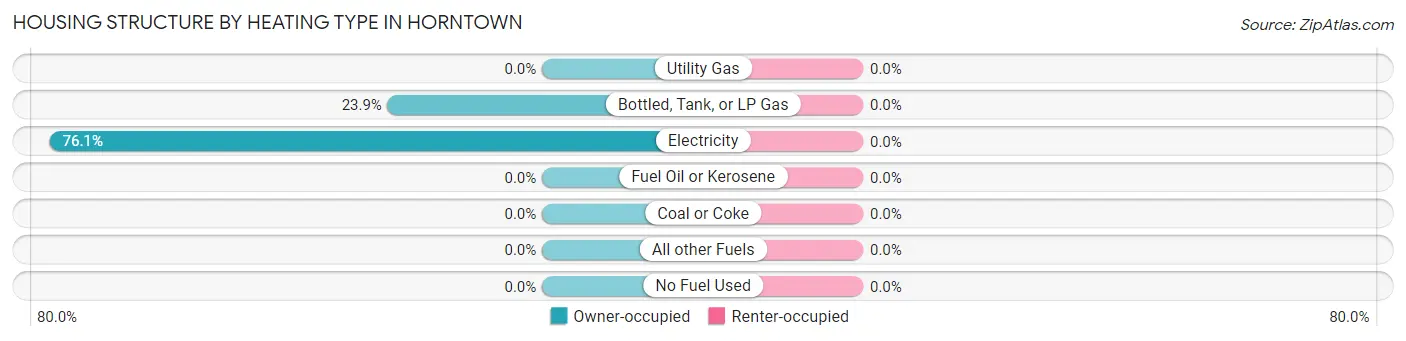
| Heating Type | Owner-occupied | Renter-occupied |
| Utility Gas | 0 (0.0%) | 0 (0.0%) |
| Bottled, Tank, or LP Gas | 53 (23.9%) | 0 (0.0%) |
| Electricity | 169 (76.1%) | 0 (0.0%) |
| Fuel Oil or Kerosene | 0 (0.0%) | 0 (0.0%) |
| Coal or Coke | 0 (0.0%) | 0 (0.0%) |
| All other Fuels | 0 (0.0%) | 0 (0.0%) |
| No Fuel Used | 0 (0.0%) | 0 (0.0%) |
| Total | 222 (100.0%) | 0 (0.0%) |
Household Vehicle Usage in Horntown
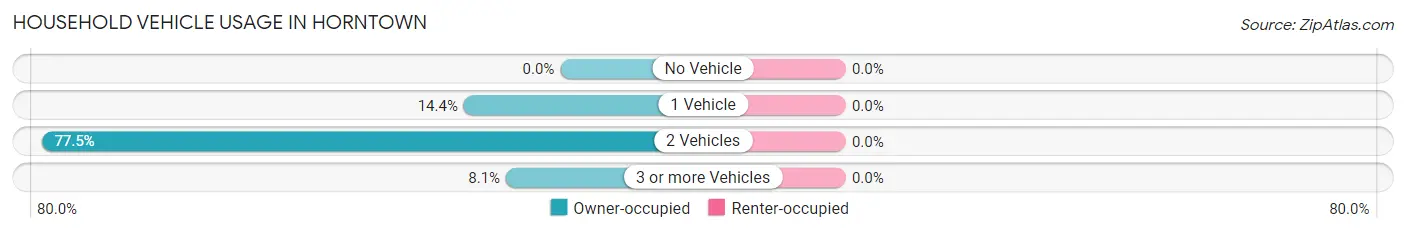
| Vehicles per Household | Owner-occupied | Renter-occupied |
| No Vehicle | 0 (0.0%) | 0 (0.0%) |
| 1 Vehicle | 32 (14.4%) | 0 (0.0%) |
| 2 Vehicles | 172 (77.5%) | 0 (0.0%) |
| 3 or more Vehicles | 18 (8.1%) | 0 (0.0%) |
| Total | 222 (100.0%) | 0 (0.0%) |
Real Estate & Mortgages in Horntown
Real Estate and Mortgage Overview in Horntown
| Characteristic | Without Mortgage | With Mortgage |
| Housing Units | 204 | 18 |
| Median Property Value | $135,300 | $0 |
| Median Household Income | - | - |
| Monthly Housing Costs | $270 | $0 |
| Real Estate Taxes | $629 | $0 |
Property Value by Mortgage Status in Horntown
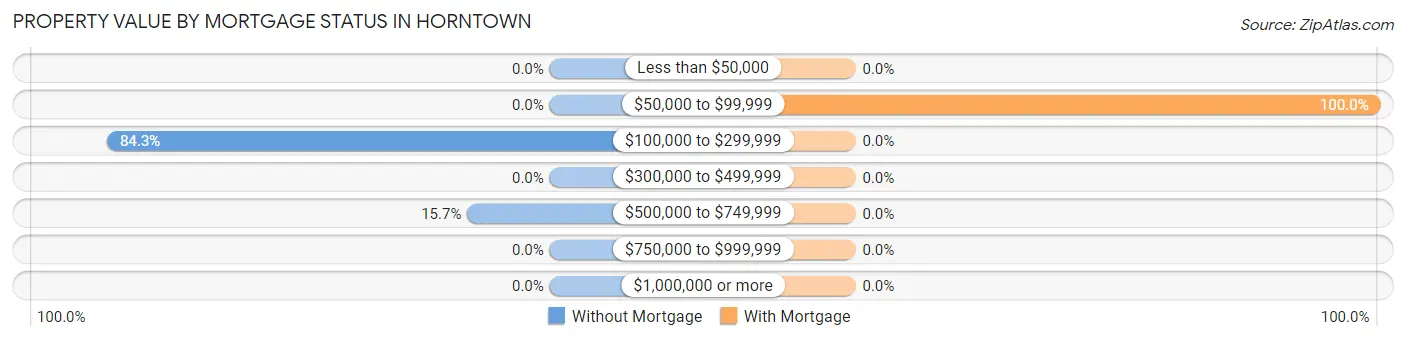
| Property Value | Without Mortgage | With Mortgage |
| Less than $50,000 | 0 (0.0%) | 0 (0.0%) |
| $50,000 to $99,999 | 0 (0.0%) | 18 (100.0%) |
| $100,000 to $299,999 | 172 (84.3%) | 0 (0.0%) |
| $300,000 to $499,999 | 0 (0.0%) | 0 (0.0%) |
| $500,000 to $749,999 | 32 (15.7%) | 0 (0.0%) |
| $750,000 to $999,999 | 0 (0.0%) | 0 (0.0%) |
| $1,000,000 or more | 0 (0.0%) | 0 (0.0%) |
| Total | 204 (100.0%) | 18 (100.0%) |
Household Income by Mortgage Status in Horntown
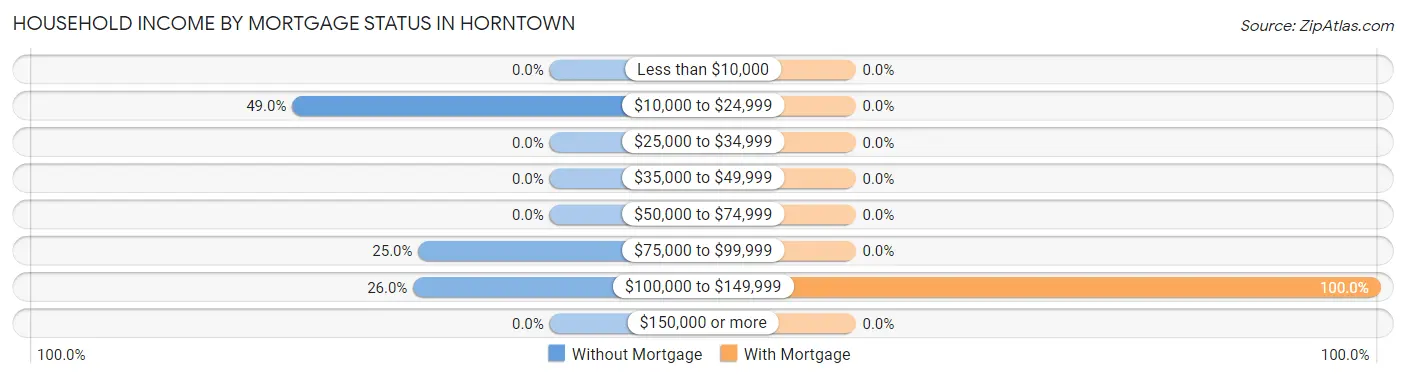
| Household Income | Without Mortgage | With Mortgage |
| Less than $10,000 | 0 (0.0%) | 0 (0.0%) |
| $10,000 to $24,999 | 100 (49.0%) | 0 (0.0%) |
| $25,000 to $34,999 | 0 (0.0%) | 0 (0.0%) |
| $35,000 to $49,999 | 0 (0.0%) | 0 (0.0%) |
| $50,000 to $74,999 | 0 (0.0%) | 0 (0.0%) |
| $75,000 to $99,999 | 51 (25.0%) | 0 (0.0%) |
| $100,000 to $149,999 | 53 (26.0%) | 18 (100.0%) |
| $150,000 or more | 0 (0.0%) | 0 (0.0%) |
| Total | 204 (100.0%) | 18 (100.0%) |
Property Value to Household Income Ratio in Horntown
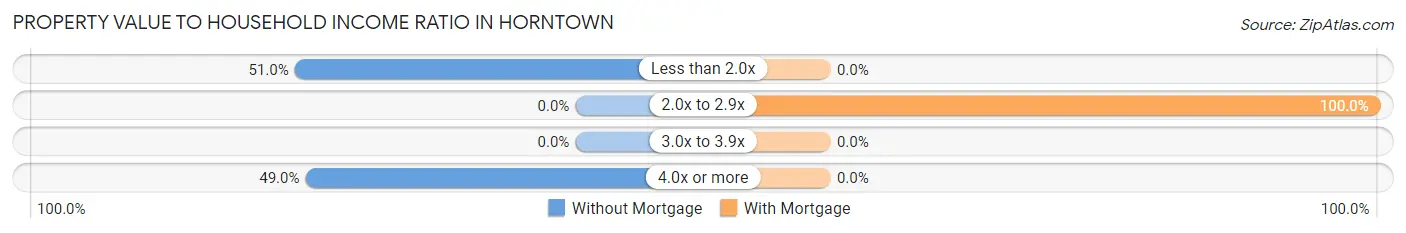
| Value-to-Income Ratio | Without Mortgage | With Mortgage |
| Less than 2.0x | 104 (51.0%) | 0 (0.0%) |
| 2.0x to 2.9x | 0 (0.0%) | 18 (100.0%) |
| 3.0x to 3.9x | 0 (0.0%) | 0 (0.0%) |
| 4.0x or more | 100 (49.0%) | 0 (0.0%) |
| Total | 204 (100.0%) | 18 (100.0%) |
Real Estate Taxes by Mortgage Status in Horntown
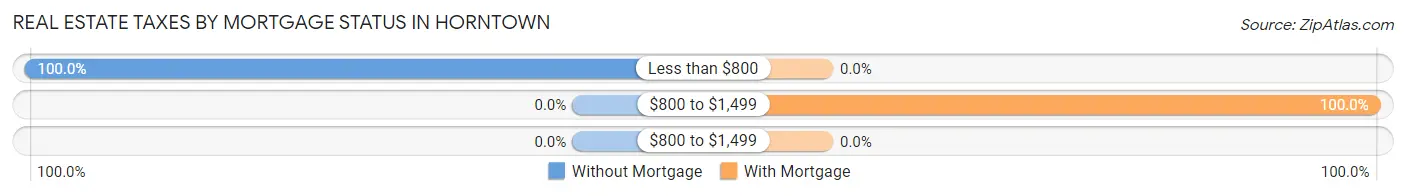
| Property Taxes | Without Mortgage | With Mortgage |
| Less than $800 | 204 (100.0%) | 0 (0.0%) |
| $800 to $1,499 | 0 (0.0%) | 18 (100.0%) |
| $800 to $1,499 | 0 (0.0%) | 0 (0.0%) |
| Total | 204 (100.0%) | 18 (100.0%) |
Health & Disability in Horntown
Health Insurance Coverage by Age in Horntown
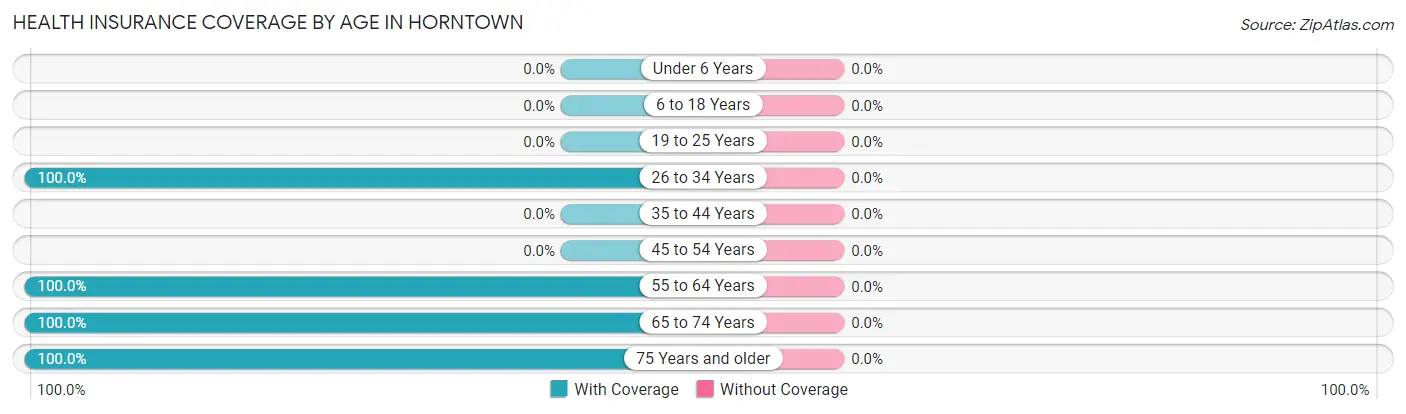
| Age Bracket | With Coverage | Without Coverage |
| Under 6 Years | 0 (0.0%) | 0 (0.0%) |
| 6 to 18 Years | 0 (0.0%) | 0 (0.0%) |
| 19 to 25 Years | 0 (0.0%) | 0 (0.0%) |
| 26 to 34 Years | 23 (100.0%) | 0 (0.0%) |
| 35 to 44 Years | 0 (0.0%) | 0 (0.0%) |
| 45 to 54 Years | 0 (0.0%) | 0 (0.0%) |
| 55 to 64 Years | 204 (100.0%) | 0 (0.0%) |
| 65 to 74 Years | 151 (100.0%) | 0 (0.0%) |
| 75 Years and older | 75 (100.0%) | 0 (0.0%) |
| Total | 453 (100.0%) | 0 (0.0%) |
Health Insurance Coverage by Citizenship Status in Horntown
| Citizenship Status | With Coverage | Without Coverage |
| Native Born | 0 (0.0%) | 0 (0.0%) |
| Foreign Born, Citizen | 0 (0.0%) | 0 (0.0%) |
| Foreign Born, not a Citizen | 0 (0.0%) | 0 (0.0%) |
Health Insurance Coverage by Household Income in Horntown
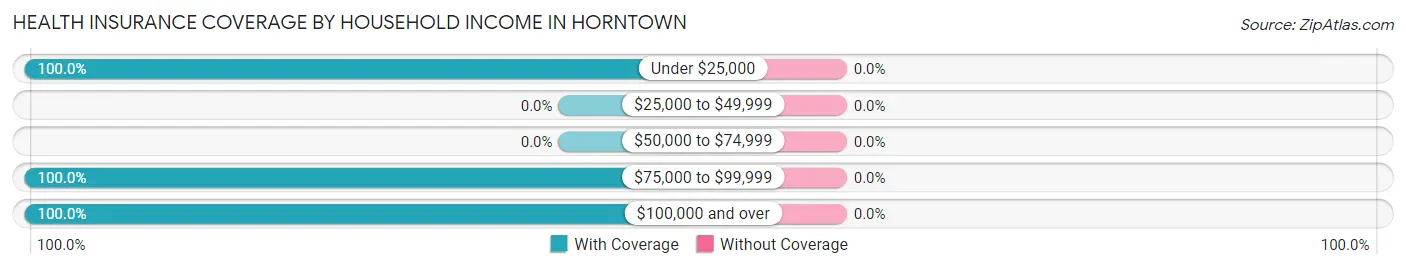
| Household Income | With Coverage | Without Coverage |
| Under $25,000 | 174 (100.0%) | 0 (0.0%) |
| $25,000 to $49,999 | 0 (0.0%) | 0 (0.0%) |
| $50,000 to $74,999 | 0 (0.0%) | 0 (0.0%) |
| $75,000 to $99,999 | 159 (100.0%) | 0 (0.0%) |
| $100,000 and over | 118 (100.0%) | 0 (0.0%) |
Public vs Private Health Insurance Coverage by Age in Horntown
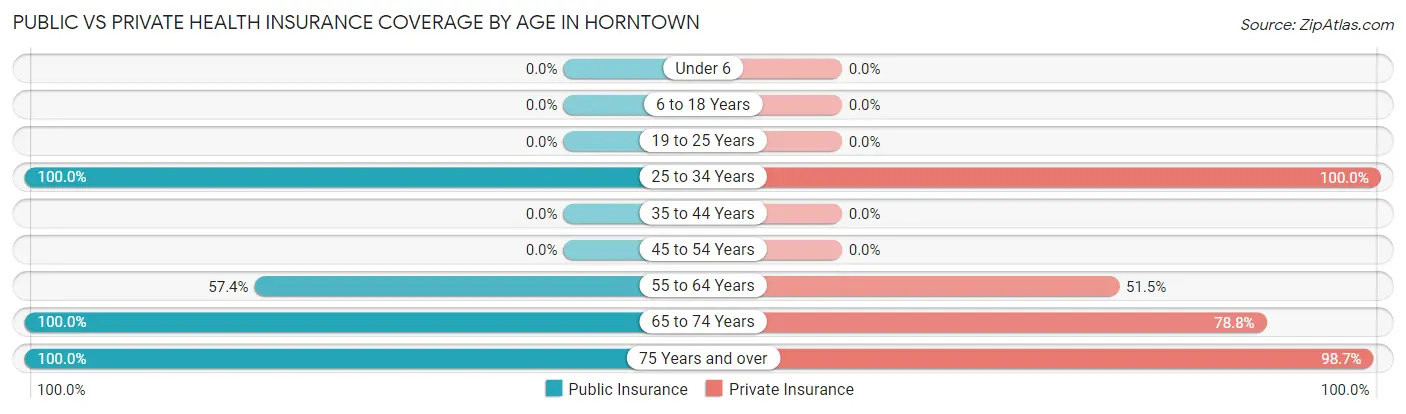
| Age Bracket | Public Insurance | Private Insurance |
| Under 6 | 0 (0.0%) | 0 (0.0%) |
| 6 to 18 Years | 0 (0.0%) | 0 (0.0%) |
| 19 to 25 Years | 0 (0.0%) | 0 (0.0%) |
| 25 to 34 Years | 23 (100.0%) | 23 (100.0%) |
| 35 to 44 Years | 0 (0.0%) | 0 (0.0%) |
| 45 to 54 Years | 0 (0.0%) | 0 (0.0%) |
| 55 to 64 Years | 117 (57.4%) | 105 (51.5%) |
| 65 to 74 Years | 151 (100.0%) | 119 (78.8%) |
| 75 Years and over | 75 (100.0%) | 74 (98.7%) |
| Total | 366 (80.8%) | 321 (70.9%) |
Disability Status by Sex by Age in Horntown
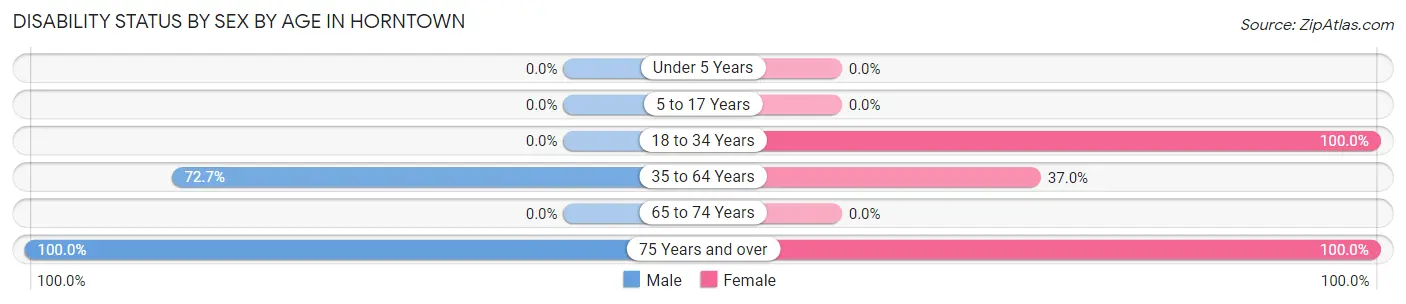
| Age Bracket | Male | Female |
| Under 5 Years | 0 (0.0%) | 0 (0.0%) |
| 5 to 17 Years | 0 (0.0%) | 0 (0.0%) |
| 18 to 34 Years | 0 (0.0%) | 23 (100.0%) |
| 35 to 64 Years | 48 (72.7%) | 51 (37.0%) |
| 65 to 74 Years | 0 (0.0%) | 0 (0.0%) |
| 75 Years and over | 74 (100.0%) | 1 (100.0%) |
Disability Class by Sex by Age in Horntown
Disability Class: Hearing Difficulty
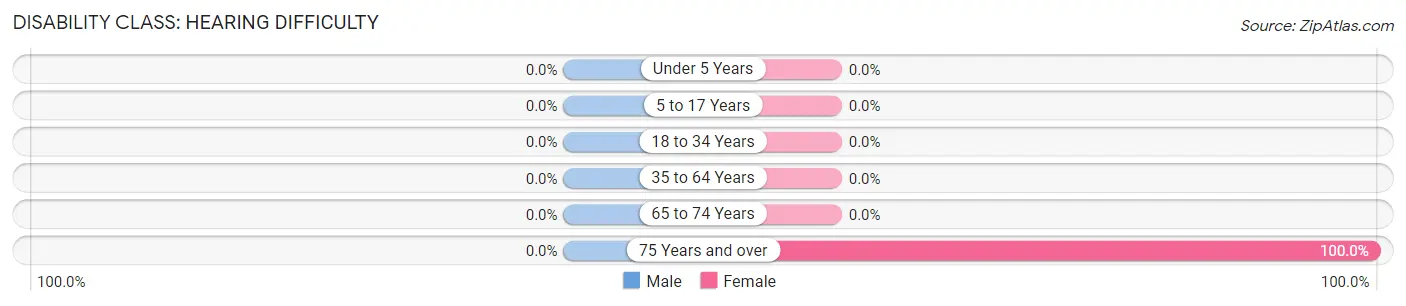
| Age Bracket | Male | Female |
| Under 5 Years | 0 (0.0%) | 0 (0.0%) |
| 5 to 17 Years | 0 (0.0%) | 0 (0.0%) |
| 18 to 34 Years | 0 (0.0%) | 0 (0.0%) |
| 35 to 64 Years | 0 (0.0%) | 0 (0.0%) |
| 65 to 74 Years | 0 (0.0%) | 0 (0.0%) |
| 75 Years and over | 0 (0.0%) | 1 (100.0%) |
Disability Class: Vision Difficulty
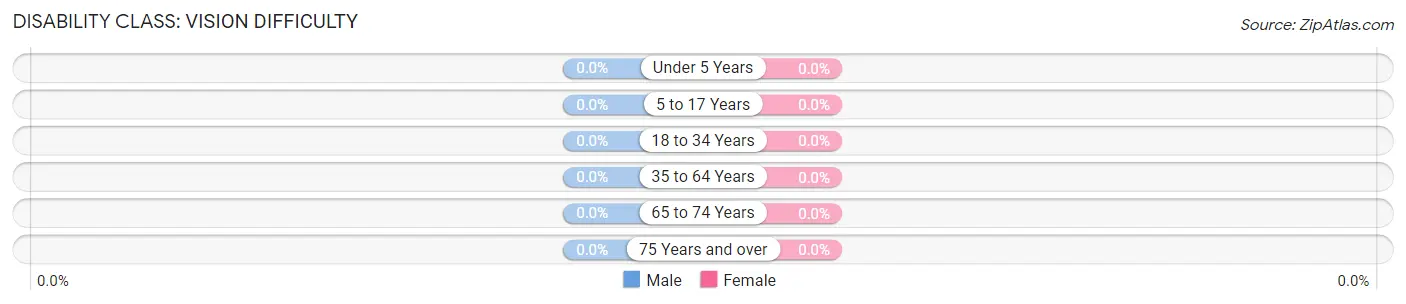
| Age Bracket | Male | Female |
| Under 5 Years | 0 (0.0%) | 0 (0.0%) |
| 5 to 17 Years | 0 (0.0%) | 0 (0.0%) |
| 18 to 34 Years | 0 (0.0%) | 0 (0.0%) |
| 35 to 64 Years | 0 (0.0%) | 0 (0.0%) |
| 65 to 74 Years | 0 (0.0%) | 0 (0.0%) |
| 75 Years and over | 0 (0.0%) | 0 (0.0%) |
Disability Class: Cognitive Difficulty
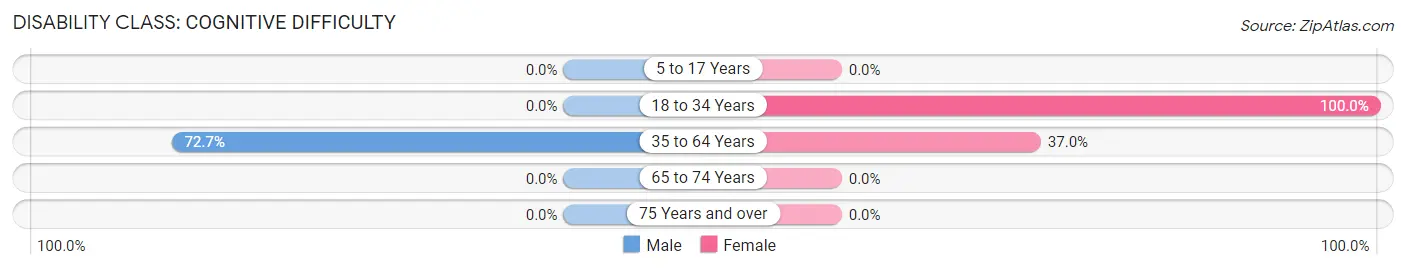
| Age Bracket | Male | Female |
| 5 to 17 Years | 0 (0.0%) | 0 (0.0%) |
| 18 to 34 Years | 0 (0.0%) | 23 (100.0%) |
| 35 to 64 Years | 48 (72.7%) | 51 (37.0%) |
| 65 to 74 Years | 0 (0.0%) | 0 (0.0%) |
| 75 Years and over | 0 (0.0%) | 0 (0.0%) |
Disability Class: Ambulatory Difficulty
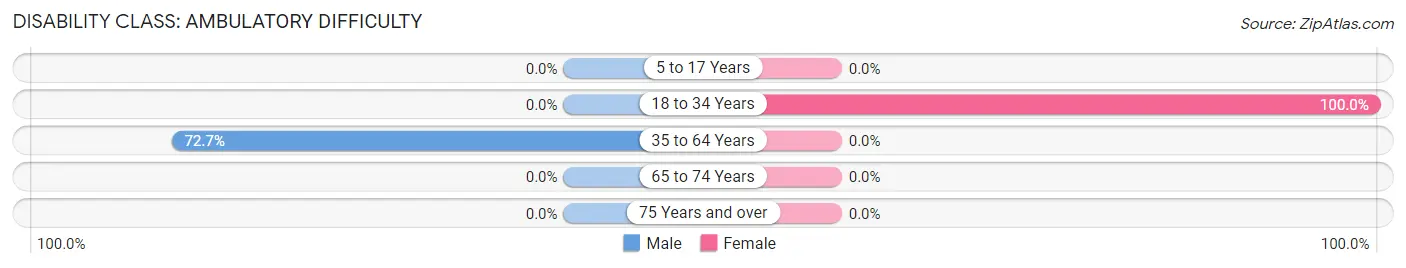
| Age Bracket | Male | Female |
| 5 to 17 Years | 0 (0.0%) | 0 (0.0%) |
| 18 to 34 Years | 0 (0.0%) | 23 (100.0%) |
| 35 to 64 Years | 48 (72.7%) | 0 (0.0%) |
| 65 to 74 Years | 0 (0.0%) | 0 (0.0%) |
| 75 Years and over | 0 (0.0%) | 0 (0.0%) |
Disability Class: Self-Care Difficulty
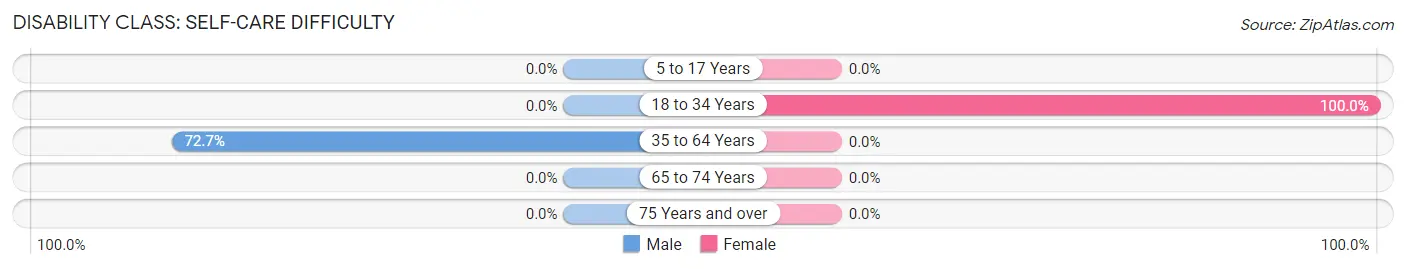
| Age Bracket | Male | Female |
| 5 to 17 Years | 0 (0.0%) | 0 (0.0%) |
| 18 to 34 Years | 0 (0.0%) | 23 (100.0%) |
| 35 to 64 Years | 48 (72.7%) | 0 (0.0%) |
| 65 to 74 Years | 0 (0.0%) | 0 (0.0%) |
| 75 Years and over | 0 (0.0%) | 0 (0.0%) |
Technology Access in Horntown
Computing Device Access in Horntown
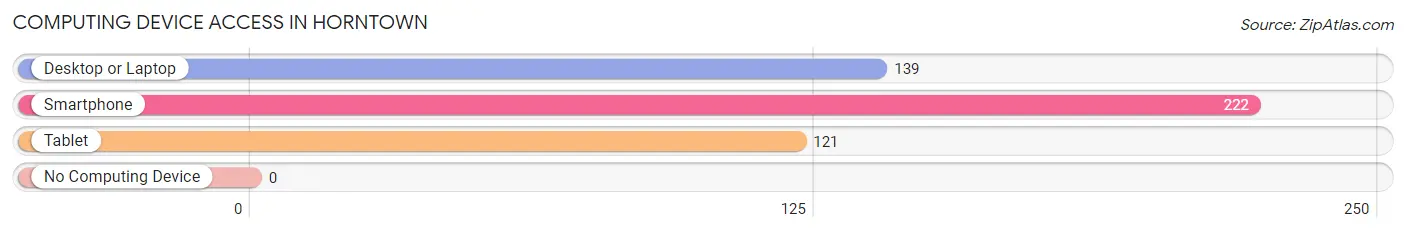
| Device Type | # Households | % Households |
| Desktop or Laptop | 139 | 62.6% |
| Smartphone | 222 | 100.0% |
| Tablet | 121 | 54.5% |
| No Computing Device | 0 | 0.0% |
| Total | 222 | 100.0% |
Internet Access in Horntown
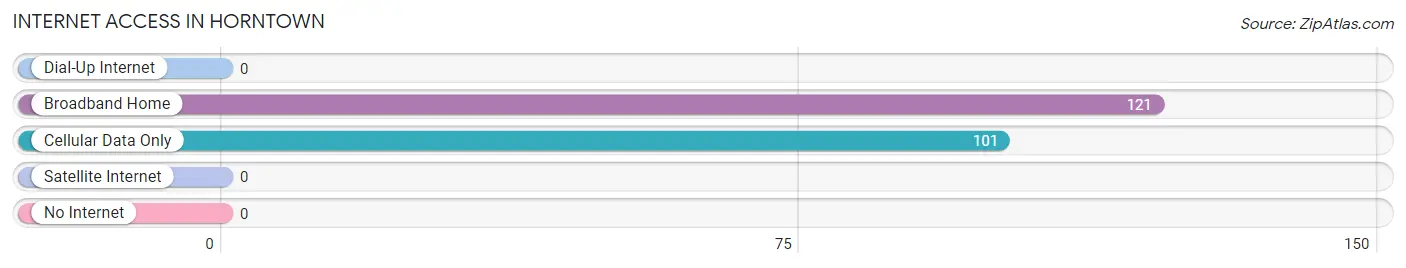
| Internet Type | # Households | % Households |
| Dial-Up Internet | 0 | 0.0% |
| Broadband Home | 121 | 54.5% |
| Cellular Data Only | 101 | 45.5% |
| Satellite Internet | 0 | 0.0% |
| No Internet | 0 | 0.0% |
| Total | 222 | 100.0% |
Horntown Summary
Hornetown is a small unincorporated community located in Accomack County, Virginia. It is situated on the Eastern Shore of Virginia, approximately 20 miles south of the Maryland border. The population of Hornetown was estimated to be around 200 people in 2000.
History
Hornetown was first settled in the early 1700s by English colonists. The town was named after the hornet, a type of wasp that is native to the area. The town was originally a farming community, with the main crops being corn, wheat, and tobacco. In the late 1800s, the town began to grow as a commercial center, with a post office, general store, and a few other businesses.
In the early 1900s, the town was home to a number of oyster shucking houses, which provided employment for many of the town’s residents. The oyster industry was a major part of the local economy until the mid-1900s, when the industry began to decline.
Geography
Hornetown is located on the Eastern Shore of Virginia, approximately 20 miles south of the Maryland border. The town is situated on a peninsula, with the Chesapeake Bay to the east and the Atlantic Ocean to the south. The town is surrounded by wetlands and marshlands, which provide a habitat for a variety of wildlife.
The town is located in a temperate climate, with mild winters and hot, humid summers. The average annual temperature is around 60 degrees Fahrenheit. The average annual precipitation is around 40 inches.
Economy
The economy of Hornetown is largely based on agriculture and fishing. The town is home to a number of farms, which produce a variety of crops, including corn, wheat, and soybeans. The town is also home to a number of seafood processing plants, which process and package oysters, clams, and other seafood for sale.
The town is also home to a number of small businesses, including a general store, a post office, and a few restaurants. The town is also home to a number of bed and breakfasts, which provide lodging for visitors to the area.
Demographics
The population of Hornetown was estimated to be around 200 people in 2000. The town is predominantly white, with a small African American population. The median household income in the town is around $30,000. The town has a high rate of poverty, with around 25% of the population living below the poverty line.
Hornetown is a small, rural community with a rich history and a unique culture. The town is home to a number of farms and seafood processing plants, which provide employment for many of the town’s residents. The town is also home to a number of small businesses, which provide goods and services to the local community. The town is a popular destination for visitors to the Eastern Shore of Virginia, with its beautiful scenery and unique culture.
Common Questions
What is Per Capita Income in Horntown?
Per Capita income in Horntown is $31,609.
What is the Median Family Income in Horntown?
Median Family Income in Horntown is $83,824.
What is Inequality or Gini Index in Horntown?
Inequality or Gini Index in Horntown is 0.37.
What is the Total Population of Horntown?
Total Population of Horntown is 453.
What is the Total Male Population of Horntown?
Total Male Population of Horntown is 205.
What is the Total Female Population of Horntown?
Total Female Population of Horntown is 248.
What is the Ratio of Males per 100 Females in Horntown?
There are 82.66 Males per 100 Females in Horntown.
What is the Ratio of Females per 100 Males in Horntown?
There are 120.98 Females per 100 Males in Horntown.
What is the Median Population Age in Horntown?
Median Population Age in Horntown is 64.0 Years.
What is the Average Family Size in Horntown
Average Family Size in Horntown is 2.2 People.
What is the Average Household Size in Horntown
Average Household Size in Horntown is 2.0 People.
How Large is the Labor Force in Horntown?
There are 87 People in the Labor Forcein in Horntown.
What is the Percentage of People in the Labor Force in Horntown?
19.2% of People are in the Labor Force in Horntown.