Rustburg, VA Map & Demographics
Rustburg Map
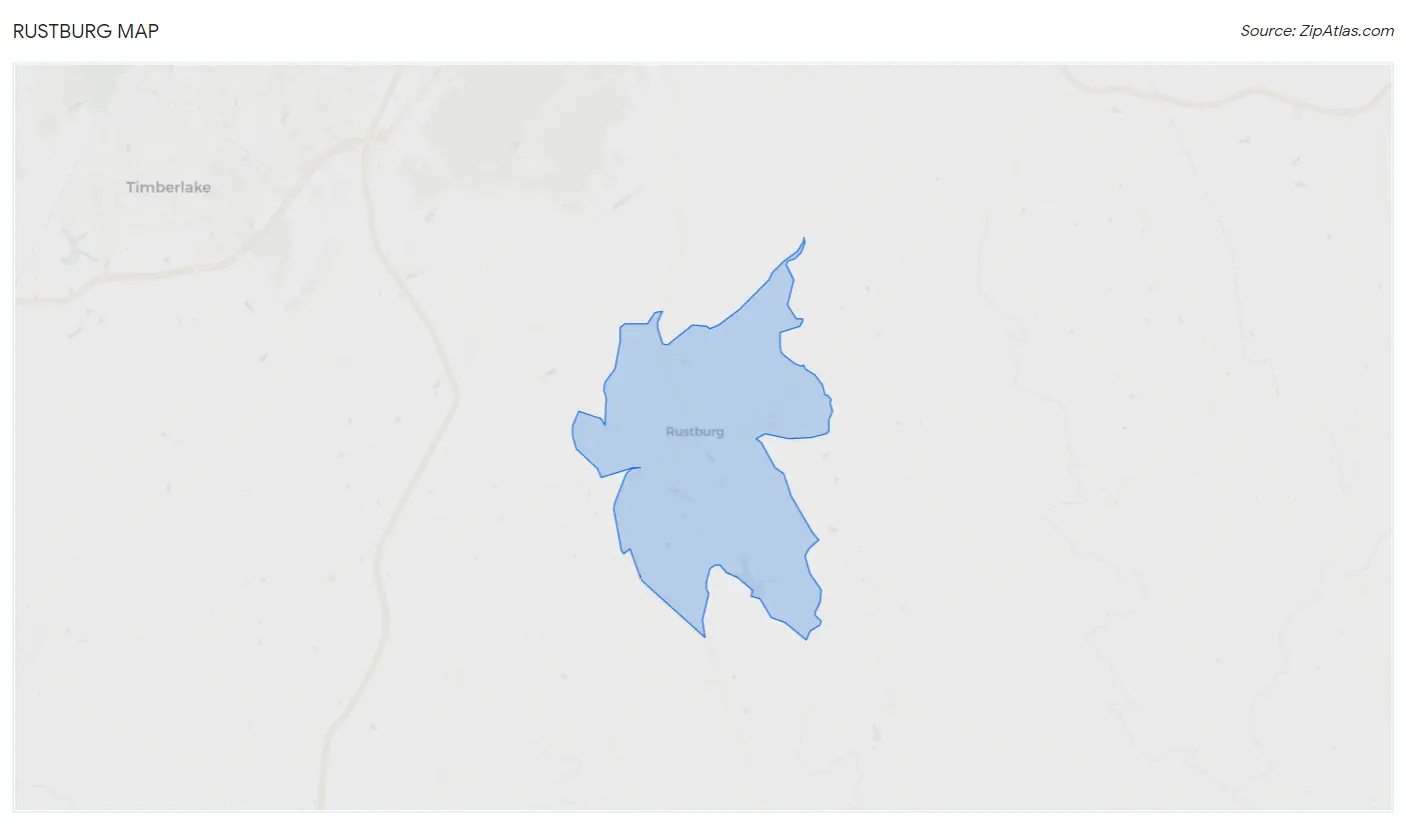
Rustburg Overview
$28,793
PER CAPITA INCOME
$51,875
AVG FAMILY INCOME
$67,612
AVG HOUSEHOLD INCOME
35.6%
WAGE / INCOME GAP [ % ]
64.4¢/ $1
WAGE / INCOME GAP [ $ ]
0.43
INEQUALITY / GINI INDEX
1,610
TOTAL POPULATION
1,003
MALE POPULATION
607
FEMALE POPULATION
165.24
MALES / 100 FEMALES
60.52
FEMALES / 100 MALES
40.3
MEDIAN AGE
2.9
AVG FAMILY SIZE
2.2
AVG HOUSEHOLD SIZE
804
LABOR FORCE [ PEOPLE ]
59.5%
PERCENT IN LABOR FORCE
9.8%
UNEMPLOYMENT RATE
Rustburg Zip Codes
Rustburg Area Codes
Income in Rustburg
Income Overview in Rustburg
Per Capita Income in Rustburg is $28,793, while median incomes of families and households are $51,875 and $67,612 respectively.
| Characteristic | Number | Measure |
| Per Capita Income | 1,610 | $28,793 |
| Median Family Income | 351 | $51,875 |
| Mean Family Income | 351 | $74,144 |
| Median Household Income | 678 | $67,612 |
| Mean Household Income | 678 | $65,122 |
| Income Deficit | 351 | $0 |
| Wage / Income Gap (%) | 1,610 | 35.65% |
| Wage / Income Gap ($) | 1,610 | 64.35¢ per $1 |
| Gini / Inequality Index | 1,610 | 0.43 |
Earnings by Sex in Rustburg
Average Earnings in Rustburg are $34,516, $50,180 for men and $32,292 for women, a difference of 35.6%.
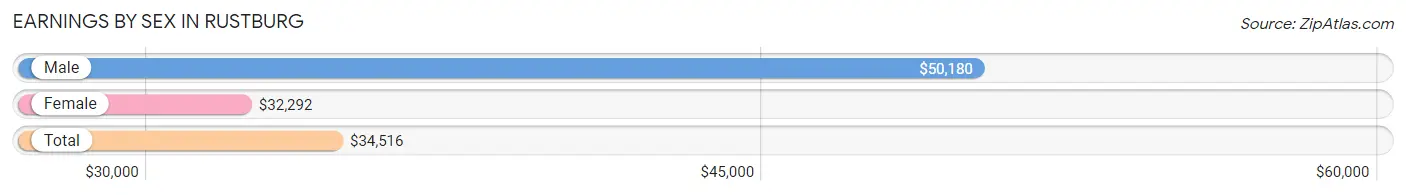
| Sex | Number | Average Earnings |
| Male | 515 (64.5%) | $50,180 |
| Female | 284 (35.5%) | $32,292 |
| Total | 799 (100.0%) | $34,516 |
Earnings by Sex by Income Bracket in Rustburg
The most common earnings brackets in Rustburg are $50,000 to $54,999 for men (201 | 39.0%) and $30,000 to $34,999 for women (89 | 31.3%).
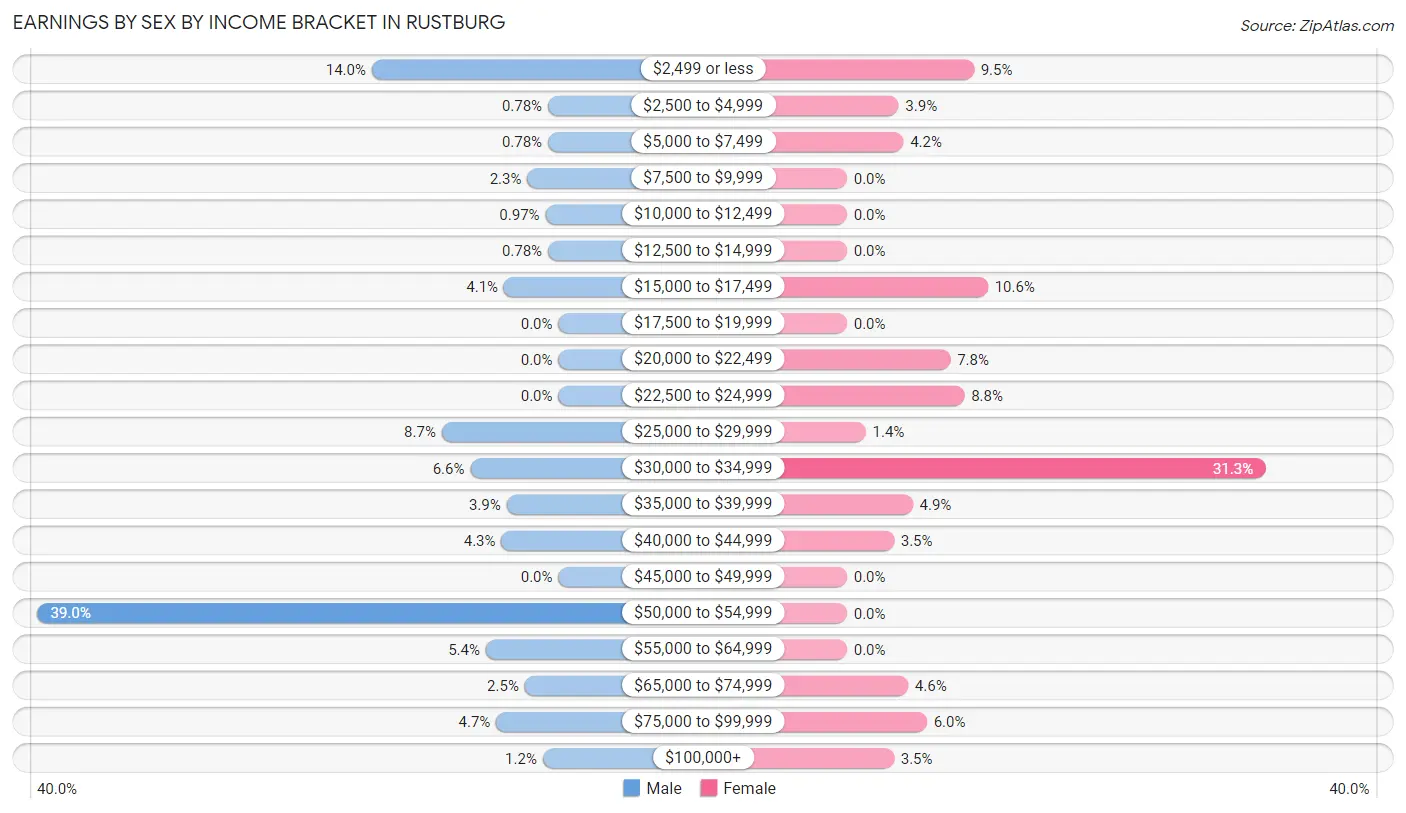
| Income | Male | Female |
| $2,499 or less | 72 (14.0%) | 27 (9.5%) |
| $2,500 to $4,999 | 4 (0.8%) | 11 (3.9%) |
| $5,000 to $7,499 | 4 (0.8%) | 12 (4.2%) |
| $7,500 to $9,999 | 12 (2.3%) | 0 (0.0%) |
| $10,000 to $12,499 | 5 (1.0%) | 0 (0.0%) |
| $12,500 to $14,999 | 4 (0.8%) | 0 (0.0%) |
| $15,000 to $17,499 | 21 (4.1%) | 30 (10.6%) |
| $17,500 to $19,999 | 0 (0.0%) | 0 (0.0%) |
| $20,000 to $22,499 | 0 (0.0%) | 22 (7.7%) |
| $22,500 to $24,999 | 0 (0.0%) | 25 (8.8%) |
| $25,000 to $29,999 | 45 (8.7%) | 4 (1.4%) |
| $30,000 to $34,999 | 34 (6.6%) | 89 (31.3%) |
| $35,000 to $39,999 | 20 (3.9%) | 14 (4.9%) |
| $40,000 to $44,999 | 22 (4.3%) | 10 (3.5%) |
| $45,000 to $49,999 | 0 (0.0%) | 0 (0.0%) |
| $50,000 to $54,999 | 201 (39.0%) | 0 (0.0%) |
| $55,000 to $64,999 | 28 (5.4%) | 0 (0.0%) |
| $65,000 to $74,999 | 13 (2.5%) | 13 (4.6%) |
| $75,000 to $99,999 | 24 (4.7%) | 17 (6.0%) |
| $100,000+ | 6 (1.2%) | 10 (3.5%) |
| Total | 515 (100.0%) | 284 (100.0%) |
Earnings by Sex by Educational Attainment in Rustburg
Average earnings in Rustburg are $50,479 for men and $32,922 for women, a difference of 34.8%. Men with an educational attainment of high school diploma enjoy the highest average annual earnings of $33,382, while those with high school diploma education earn the least with $33,382. Women with an educational attainment of graduate degree earn the most with the average annual earnings of $90,500, while those with college or associate's degree education have the smallest earnings of $32,566.
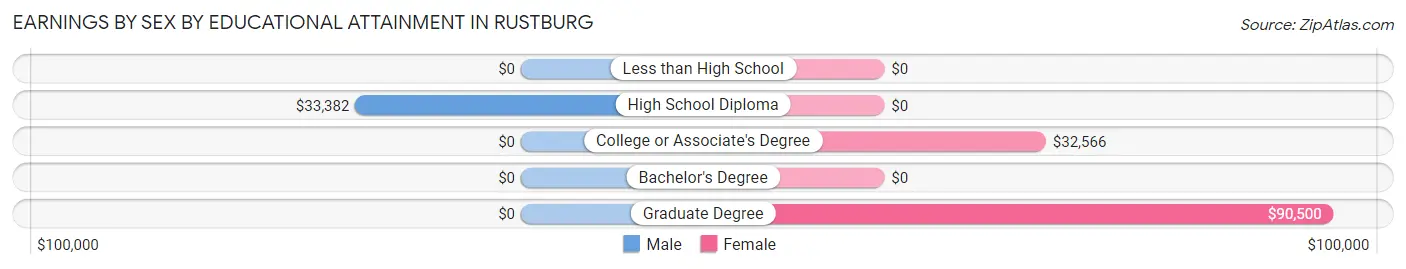
| Educational Attainment | Male Income | Female Income |
| Less than High School | - | - |
| High School Diploma | $33,382 | $0 |
| College or Associate's Degree | - | - |
| Bachelor's Degree | - | - |
| Graduate Degree | - | - |
| Total | $50,479 | $32,922 |
Family Income in Rustburg
Family Income Brackets in Rustburg
According to the Rustburg family income data, there are 65 families falling into the less than $10,000 income range, which is the most common income bracket and makes up 18.5% of all families.
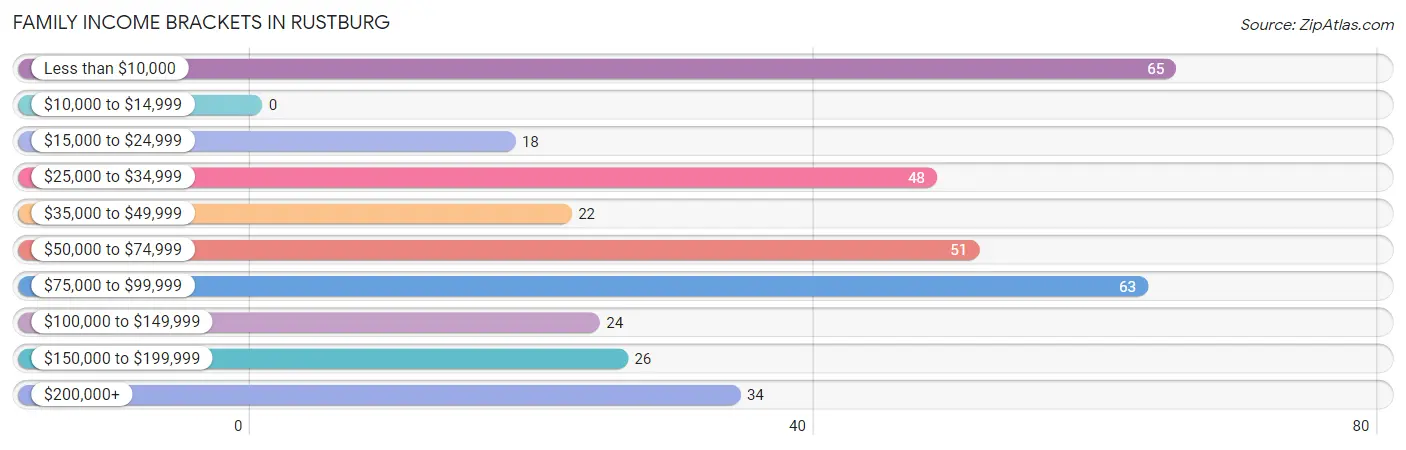
| Income Bracket | # Families | % Families |
| Less than $10,000 | 65 | 18.5% |
| $10,000 to $14,999 | 0 | 0.0% |
| $15,000 to $24,999 | 18 | 5.1% |
| $25,000 to $34,999 | 48 | 13.7% |
| $35,000 to $49,999 | 22 | 6.3% |
| $50,000 to $74,999 | 51 | 14.5% |
| $75,000 to $99,999 | 63 | 17.9% |
| $100,000 to $149,999 | 24 | 6.8% |
| $150,000 to $199,999 | 26 | 7.4% |
| $200,000+ | 34 | 9.7% |
Family Income by Famaliy Size in Rustburg
2-person families (157 | 44.7%) account for the highest median family income in Rustburg with $58,036 per family, while 2-person families (157 | 44.7%) have the highest median income of $29,018 per family member.
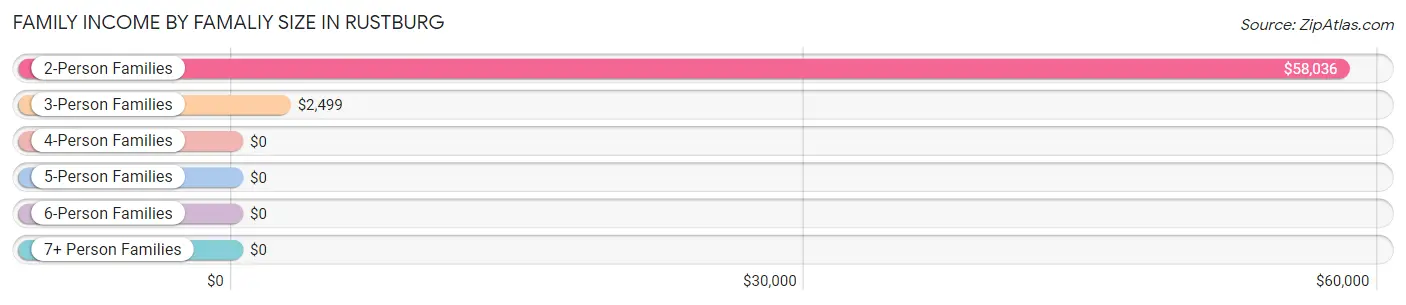
| Income Bracket | # Families | Median Income |
| 2-Person Families | 157 (44.7%) | $58,036 |
| 3-Person Families | 109 (31.0%) | $2,499 |
| 4-Person Families | 85 (24.2%) | $0 |
| 5-Person Families | 0 (0.0%) | $0 |
| 6-Person Families | 0 (0.0%) | $0 |
| 7+ Person Families | 0 (0.0%) | $0 |
| Total | 351 (100.0%) | $51,875 |
Family Income by Number of Earners in Rustburg
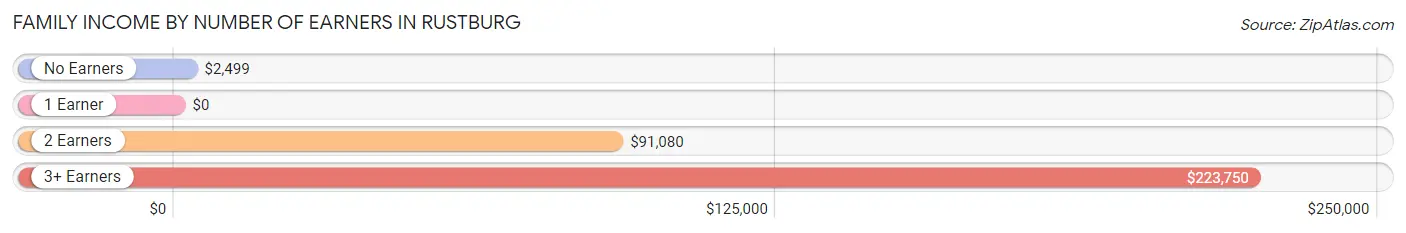
| Number of Earners | # Families | Median Income |
| No Earners | 117 (33.3%) | $2,499 |
| 1 Earner | 123 (35.0%) | $0 |
| 2 Earners | 77 (21.9%) | $91,080 |
| 3+ Earners | 34 (9.7%) | $223,750 |
| Total | 351 (100.0%) | $51,875 |
Household Income in Rustburg
Household Income Brackets in Rustburg
With 252 households falling in the category, the $50,000 to $74,999 income range is the most frequent in Rustburg, accounting for 37.2% of all households. In contrast, only 26 households (3.8%) fall into the $150,000 to $199,999 income bracket, making it the least populous group.
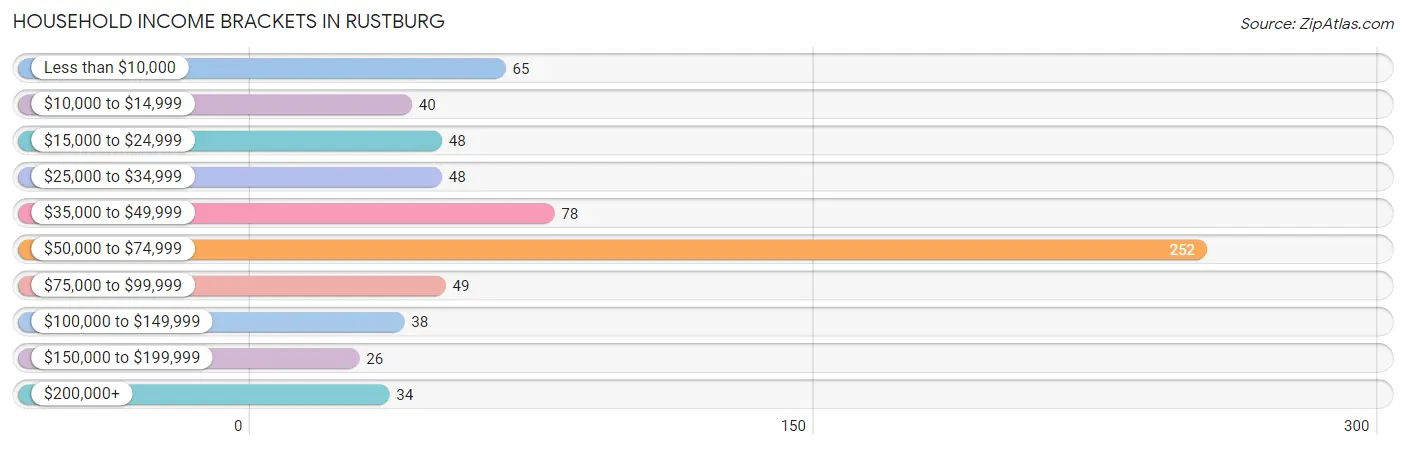
| Income Bracket | # Households | % Households |
| Less than $10,000 | 65 | 9.6% |
| $10,000 to $14,999 | 40 | 5.9% |
| $15,000 to $24,999 | 48 | 7.1% |
| $25,000 to $34,999 | 48 | 7.1% |
| $35,000 to $49,999 | 78 | 11.5% |
| $50,000 to $74,999 | 252 | 37.2% |
| $75,000 to $99,999 | 49 | 7.2% |
| $100,000 to $149,999 | 38 | 5.6% |
| $150,000 to $199,999 | 26 | 3.8% |
| $200,000+ | 34 | 5.0% |
Household Income by Householder Age in Rustburg
The median household income in Rustburg is $67,612, with the highest median household income of $68,912 found in the 45 to 64 years age bracket for the primary householder. A total of 301 households (44.4%) fall into this category. Meanwhile, the 15 to 24 years age bracket for the primary householder has the lowest median household income of $0, with 8 households (1.2%) in this group.
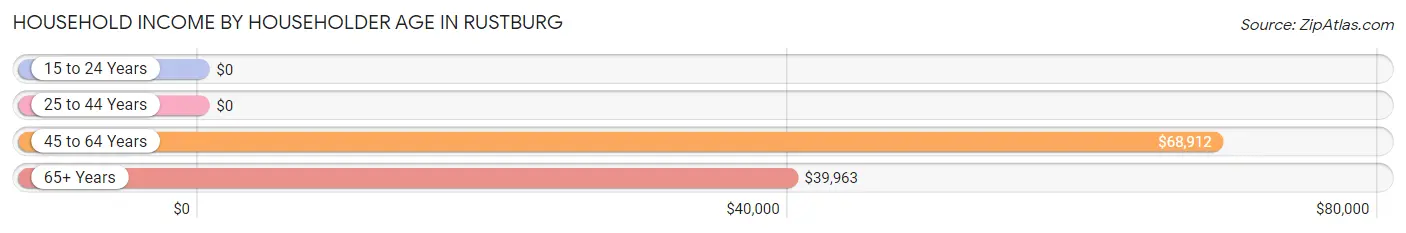
| Income Bracket | # Households | Median Income |
| 15 to 24 Years | 8 (1.2%) | $0 |
| 25 to 44 Years | 172 (25.4%) | $0 |
| 45 to 64 Years | 301 (44.4%) | $68,912 |
| 65+ Years | 197 (29.1%) | $39,963 |
| Total | 678 (100.0%) | $67,612 |
Poverty in Rustburg
Income Below Poverty by Sex and Age in Rustburg
With 22.9% poverty level for males and 26.7% for females among the residents of Rustburg, 25 to 34 year old males and under 5 year old females are the most vulnerable to poverty, with 65 males (60.2%) and 47 females (65.3%) in their respective age groups living below the poverty level.
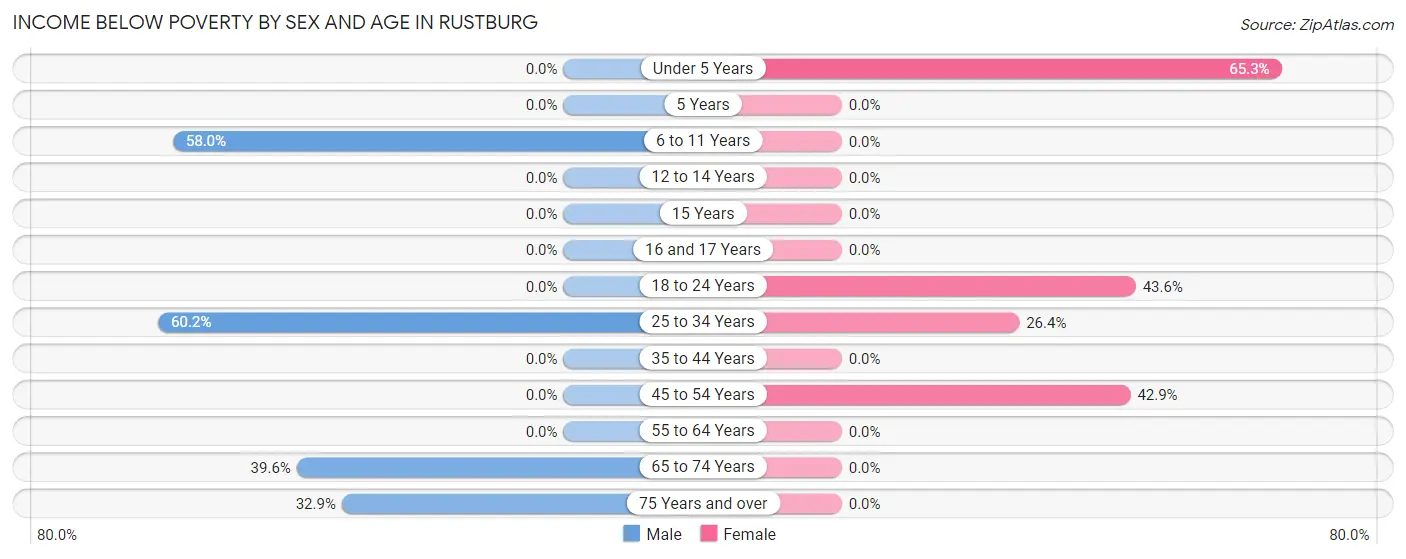
| Age Bracket | Male | Female |
| Under 5 Years | 0 (0.0%) | 47 (65.3%) |
| 5 Years | 0 (0.0%) | 0 (0.0%) |
| 6 to 11 Years | 69 (58.0%) | 0 (0.0%) |
| 12 to 14 Years | 0 (0.0%) | 0 (0.0%) |
| 15 Years | 0 (0.0%) | 0 (0.0%) |
| 16 and 17 Years | 0 (0.0%) | 0 (0.0%) |
| 18 to 24 Years | 0 (0.0%) | 48 (43.6%) |
| 25 to 34 Years | 65 (60.2%) | 39 (26.4%) |
| 35 to 44 Years | 0 (0.0%) | 0 (0.0%) |
| 45 to 54 Years | 0 (0.0%) | 27 (42.9%) |
| 55 to 64 Years | 0 (0.0%) | 0 (0.0%) |
| 65 to 74 Years | 40 (39.6%) | 0 (0.0%) |
| 75 Years and over | 26 (32.9%) | 0 (0.0%) |
| Total | 200 (22.9%) | 161 (26.7%) |
Income Above Poverty by Sex and Age in Rustburg
According to the poverty statistics in Rustburg, males aged under 5 years and females aged 12 to 14 years are the age groups that are most secure financially, with 100.0% of males and 100.0% of females in these age groups living above the poverty line.
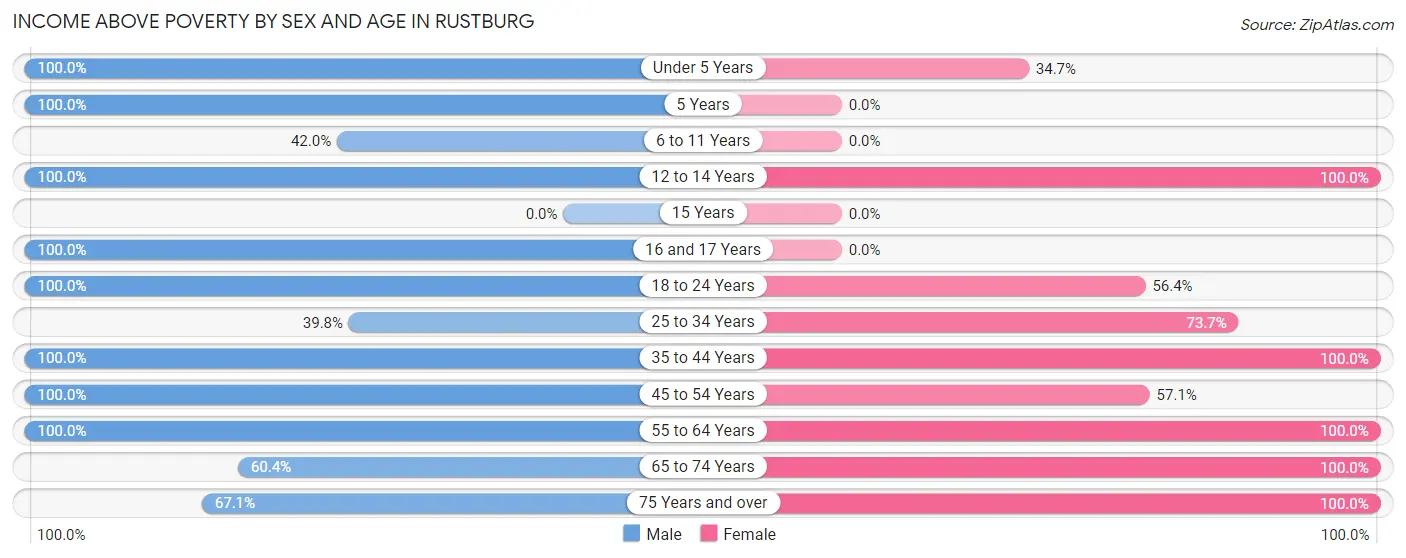
| Age Bracket | Male | Female |
| Under 5 Years | 7 (100.0%) | 25 (34.7%) |
| 5 Years | 38 (100.0%) | 0 (0.0%) |
| 6 to 11 Years | 50 (42.0%) | 0 (0.0%) |
| 12 to 14 Years | 8 (100.0%) | 15 (100.0%) |
| 15 Years | 0 (0.0%) | 0 (0.0%) |
| 16 and 17 Years | 10 (100.0%) | 0 (0.0%) |
| 18 to 24 Years | 22 (100.0%) | 62 (56.4%) |
| 25 to 34 Years | 43 (39.8%) | 109 (73.7%) |
| 35 to 44 Years | 78 (100.0%) | 25 (100.0%) |
| 45 to 54 Years | 28 (100.0%) | 36 (57.1%) |
| 55 to 64 Years | 277 (100.0%) | 110 (100.0%) |
| 65 to 74 Years | 61 (60.4%) | 37 (100.0%) |
| 75 Years and over | 53 (67.1%) | 23 (100.0%) |
| Total | 675 (77.1%) | 442 (73.3%) |
Income Below Poverty Among Married-Couple Families in Rustburg
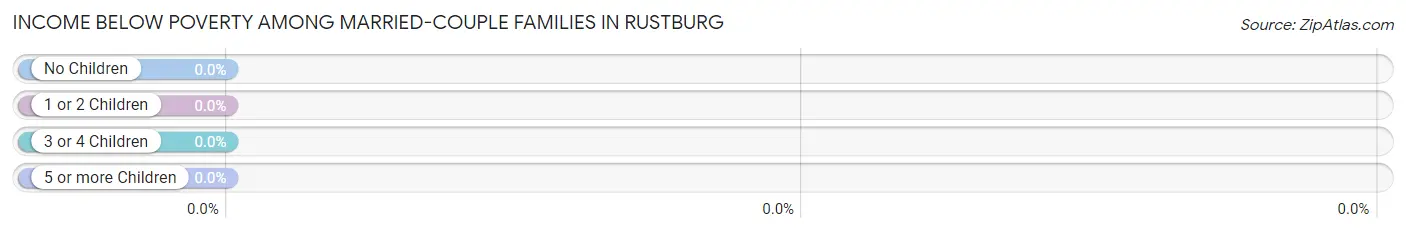
| Children | Above Poverty | Below Poverty |
| No Children | 133 (100.0%) | 0 (0.0%) |
| 1 or 2 Children | 95 (100.0%) | 0 (0.0%) |
| 3 or 4 Children | 0 (0.0%) | 0 (0.0%) |
| 5 or more Children | 0 (0.0%) | 0 (0.0%) |
| Total | 228 (100.0%) | 0 (0.0%) |
Income Below Poverty Among Single-Parent Households in Rustburg
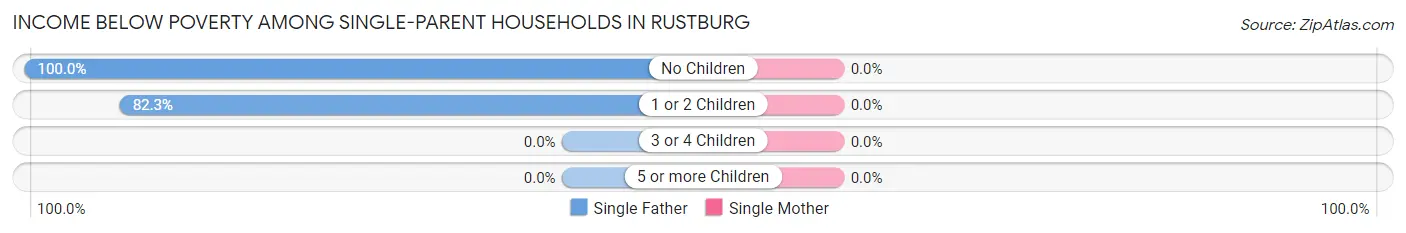
| Children | Single Father | Single Mother |
| No Children | 18 (100.0%) | 0 (0.0%) |
| 1 or 2 Children | 65 (82.3%) | 0 (0.0%) |
| 3 or 4 Children | 0 (0.0%) | 0 (0.0%) |
| 5 or more Children | 0 (0.0%) | 0 (0.0%) |
| Total | 83 (85.6%) | 0 (0.0%) |
Income Below Poverty Among Married-Couple vs Single-Parent Households in Rustburg
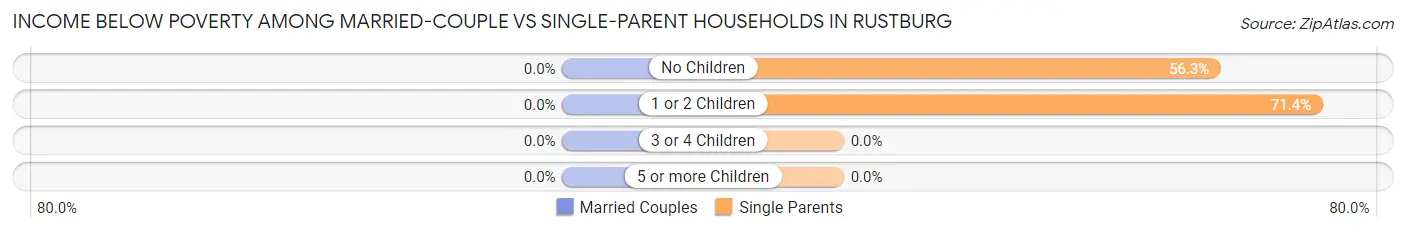
| Children | Married-Couple Families | Single-Parent Households |
| No Children | 0 (0.0%) | 18 (56.2%) |
| 1 or 2 Children | 0 (0.0%) | 65 (71.4%) |
| 3 or 4 Children | 0 (0.0%) | 0 (0.0%) |
| 5 or more Children | 0 (0.0%) | 0 (0.0%) |
| Total | 0 (0.0%) | 83 (67.5%) |
Race in Rustburg
The most populous races in Rustburg are White / Caucasian (1,461 | 90.7%), Black / African American (141 | 8.8%), and Hispanic or Latino (9 | 0.6%).
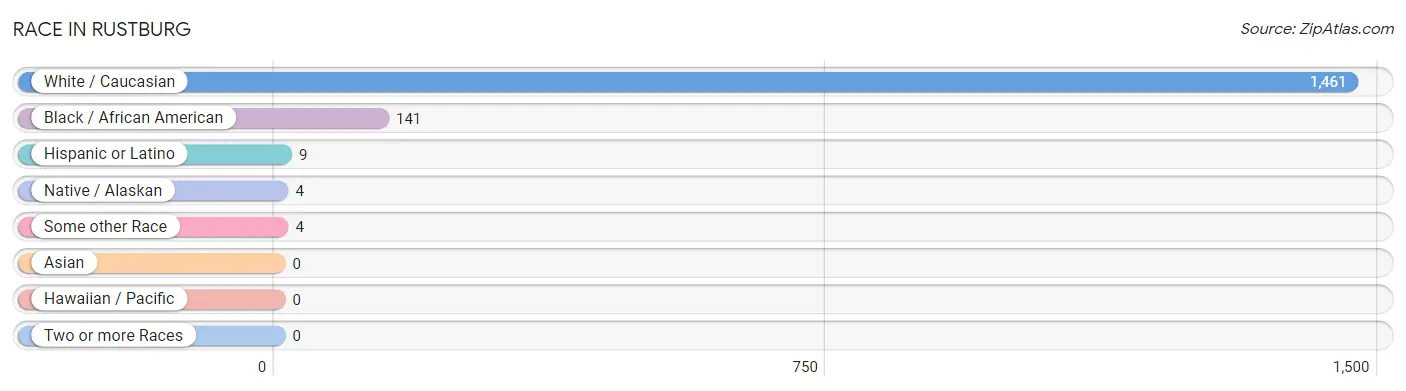
| Race | # Population | % Population |
| Asian | 0 | 0.0% |
| Black / African American | 141 | 8.8% |
| Hawaiian / Pacific | 0 | 0.0% |
| Hispanic or Latino | 9 | 0.6% |
| Native / Alaskan | 4 | 0.3% |
| White / Caucasian | 1,461 | 90.7% |
| Two or more Races | 0 | 0.0% |
| Some other Race | 4 | 0.3% |
| Total | 1,610 | 100.0% |
Ancestry in Rustburg
The most populous ancestries reported in Rustburg are Irish (570 | 35.4%), American (204 | 12.7%), Canadian (201 | 12.5%), English (158 | 9.8%), and German (94 | 5.8%), together accounting for 76.2% of all Rustburg residents.
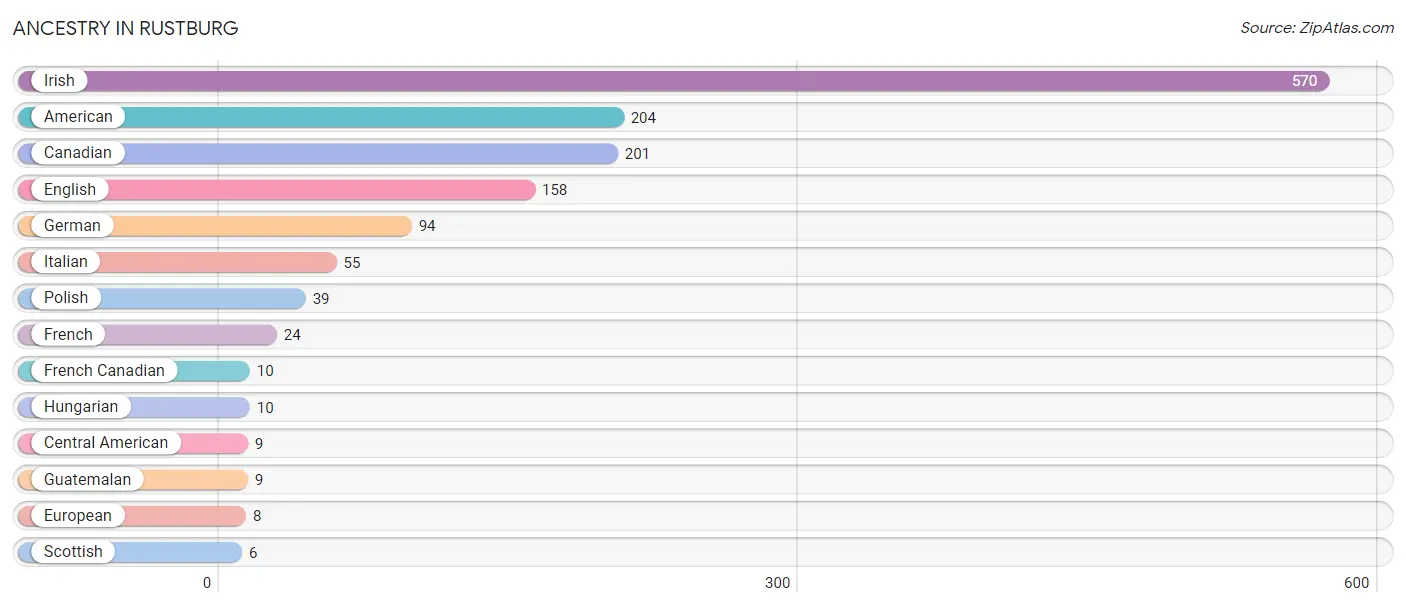
| Ancestry | # Population | % Population |
| American | 204 | 12.7% |
| Canadian | 201 | 12.5% |
| Central American | 9 | 0.6% |
| English | 158 | 9.8% |
| European | 8 | 0.5% |
| French | 24 | 1.5% |
| French Canadian | 10 | 0.6% |
| German | 94 | 5.8% |
| Guatemalan | 9 | 0.6% |
| Hungarian | 10 | 0.6% |
| Irish | 570 | 35.4% |
| Italian | 55 | 3.4% |
| Polish | 39 | 2.4% |
| Scottish | 6 | 0.4% | View All 14 Rows |
Immigrants in Rustburg
The most numerous immigrant groups reported in Rustburg came from Central America (9 | 0.6%), Guatemala (9 | 0.6%), and Latin America (9 | 0.6%), together accounting for 1.7% of all Rustburg residents.
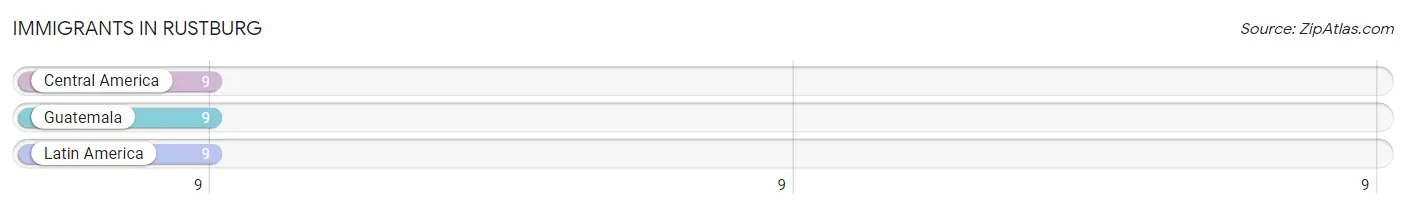
| Immigration Origin | # Population | % Population |
| Central America | 9 | 0.6% |
| Guatemala | 9 | 0.6% |
| Latin America | 9 | 0.6% | View All 3 Rows |
Sex and Age in Rustburg
Sex and Age in Rustburg
The most populous age groups in Rustburg are 60 to 64 Years (235 | 23.4%) for men and 25 to 29 Years (109 | 18.0%) for women.
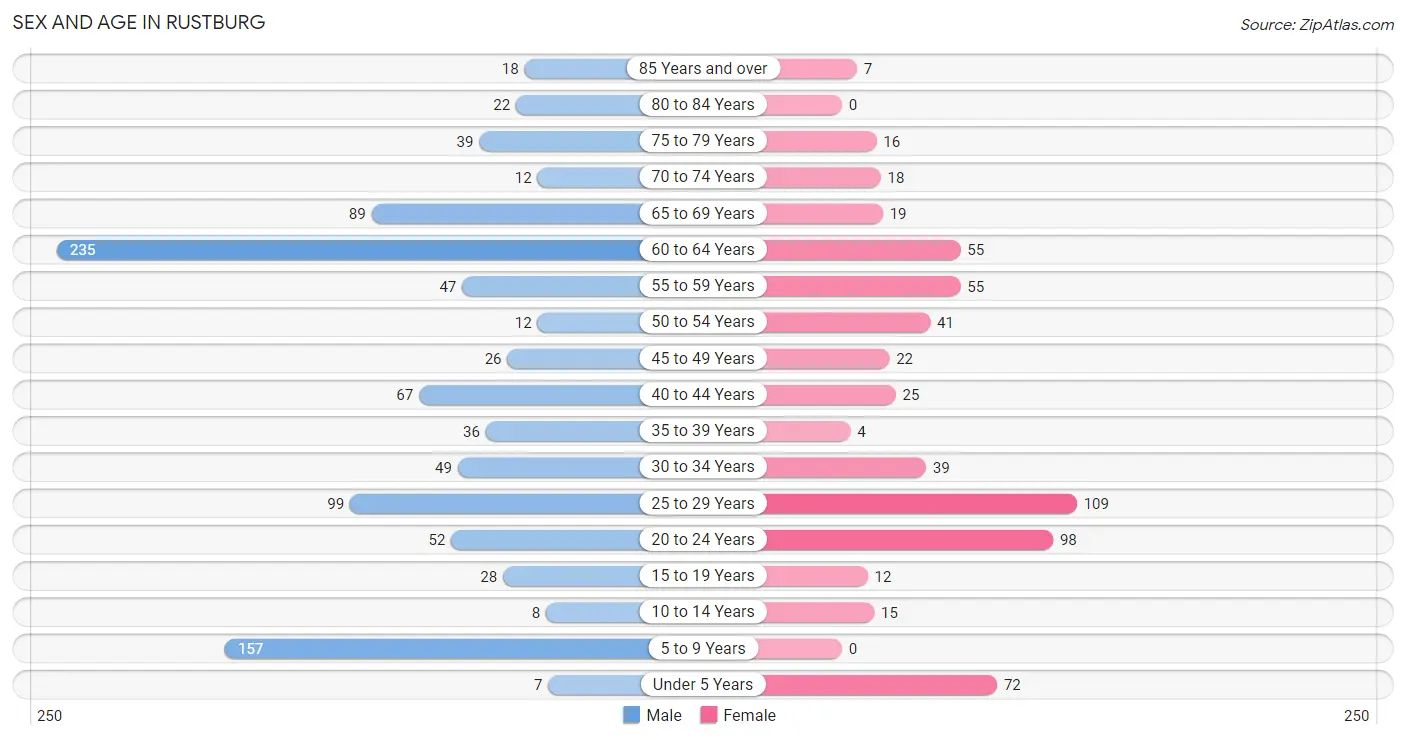
| Age Bracket | Male | Female |
| Under 5 Years | 7 (0.7%) | 72 (11.9%) |
| 5 to 9 Years | 157 (15.7%) | 0 (0.0%) |
| 10 to 14 Years | 8 (0.8%) | 15 (2.5%) |
| 15 to 19 Years | 28 (2.8%) | 12 (2.0%) |
| 20 to 24 Years | 52 (5.2%) | 98 (16.1%) |
| 25 to 29 Years | 99 (9.9%) | 109 (18.0%) |
| 30 to 34 Years | 49 (4.9%) | 39 (6.4%) |
| 35 to 39 Years | 36 (3.6%) | 4 (0.7%) |
| 40 to 44 Years | 67 (6.7%) | 25 (4.1%) |
| 45 to 49 Years | 26 (2.6%) | 22 (3.6%) |
| 50 to 54 Years | 12 (1.2%) | 41 (6.8%) |
| 55 to 59 Years | 47 (4.7%) | 55 (9.1%) |
| 60 to 64 Years | 235 (23.4%) | 55 (9.1%) |
| 65 to 69 Years | 89 (8.9%) | 19 (3.1%) |
| 70 to 74 Years | 12 (1.2%) | 18 (3.0%) |
| 75 to 79 Years | 39 (3.9%) | 16 (2.6%) |
| 80 to 84 Years | 22 (2.2%) | 0 (0.0%) |
| 85 Years and over | 18 (1.8%) | 7 (1.1%) |
| Total | 1,003 (100.0%) | 607 (100.0%) |
Families and Households in Rustburg
Median Family Size in Rustburg
The median family size in Rustburg is 2.90 persons per family, with single female/mother families (26 | 7.4%) accounting for the largest median family size of 3.73 persons per family. On the other hand, single male/father families (97 | 27.6%) represent the smallest median family size with 2.73 persons per family.
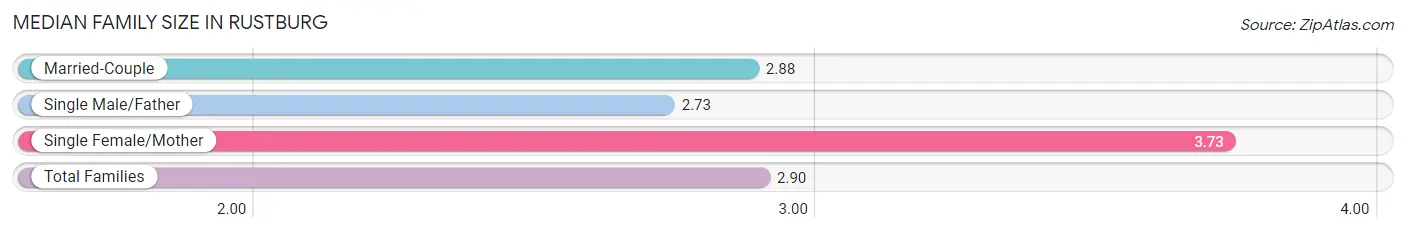
| Family Type | # Families | Family Size |
| Married-Couple | 228 (65.0%) | 2.88 |
| Single Male/Father | 97 (27.6%) | 2.73 |
| Single Female/Mother | 26 (7.4%) | 3.73 |
| Total Families | 351 (100.0%) | 2.90 |
Median Household Size in Rustburg
The median household size in Rustburg is 2.18 persons per household, with single male/father households (97 | 14.3%) accounting for the largest median household size of 3.85 persons per household. non-family households (327 | 48.2%) represent the smallest median household size with 1.02 persons per household.
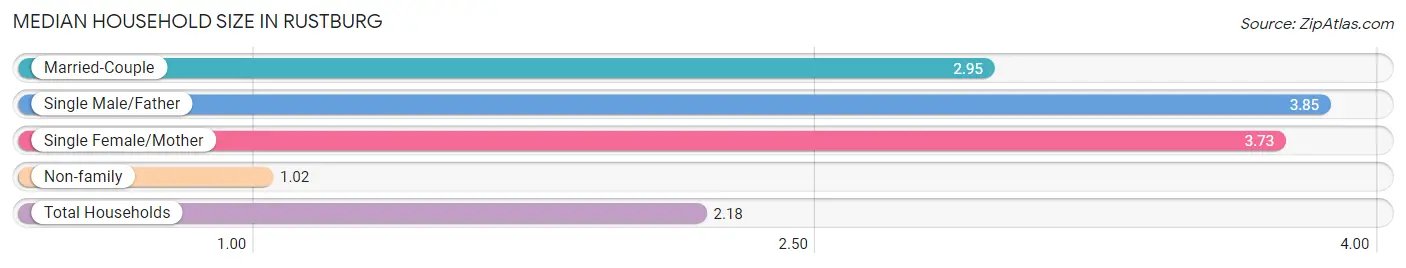
| Household Type | # Households | Household Size |
| Married-Couple | 228 (33.6%) | 2.95 |
| Single Male/Father | 97 (14.3%) | 3.85 |
| Single Female/Mother | 26 (3.8%) | 3.73 |
| Non-family | 327 (48.2%) | 1.02 |
| Total Households | 678 (100.0%) | 2.18 |
Household Size by Marriage Status in Rustburg
Out of a total of 678 households in Rustburg, 351 (51.8%) are family households, while 327 (48.2%) are nonfamily households. The most numerous type of family households are 4-person households, comprising 176, and the most common type of nonfamily households are 1-person households, comprising 320.
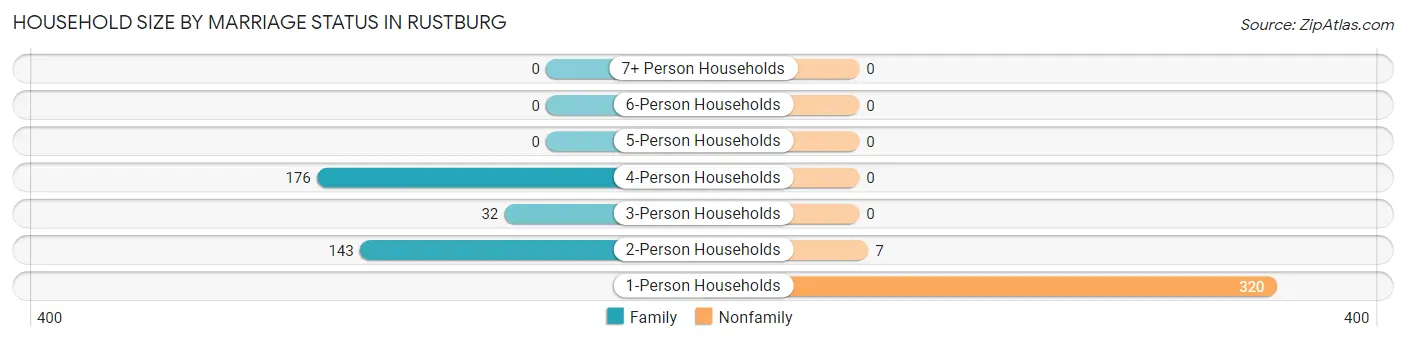
| Household Size | Family Households | Nonfamily Households |
| 1-Person Households | - | 320 (47.2%) |
| 2-Person Households | 143 (21.1%) | 7 (1.0%) |
| 3-Person Households | 32 (4.7%) | 0 (0.0%) |
| 4-Person Households | 176 (26.0%) | 0 (0.0%) |
| 5-Person Households | 0 (0.0%) | 0 (0.0%) |
| 6-Person Households | 0 (0.0%) | 0 (0.0%) |
| 7+ Person Households | 0 (0.0%) | 0 (0.0%) |
| Total | 351 (51.8%) | 327 (48.2%) |
Female Fertility in Rustburg
Fertility by Age in Rustburg
Average fertility rate in Rustburg is 414.0 births per 1,000 women. Women in the age bracket of 20 to 34 years have the highest fertility rate with 520.0 births per 1,000 women. Women in the age bracket of 20 to 34 years acount for 100.0% of all women with births.
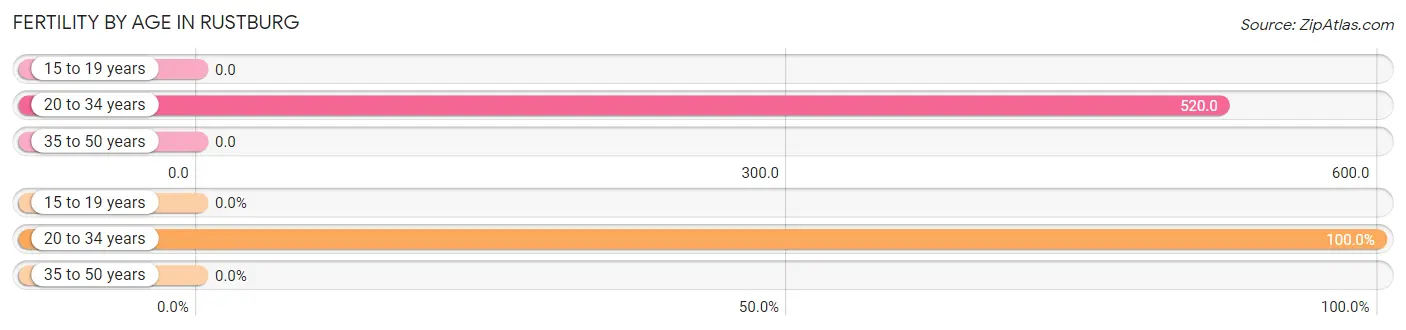
| Age Bracket | Women with Births | Births / 1,000 Women |
| 15 to 19 years | 0 (0.0%) | 0.0 |
| 20 to 34 years | 128 (100.0%) | 520.0 |
| 35 to 50 years | 0 (0.0%) | 0.0 |
| Total | 128 (100.0%) | 414.0 |
Fertility by Age by Marriage Status in Rustburg
32.0% of women with births (128) in Rustburg are married. The highest percentage of unmarried women with births falls into 20 to 34 years age bracket with 68.0% of them unmarried at the time of birth, while the lowest percentage of unmarried women with births belong to 20 to 34 years age bracket with 68.0% of them unmarried.
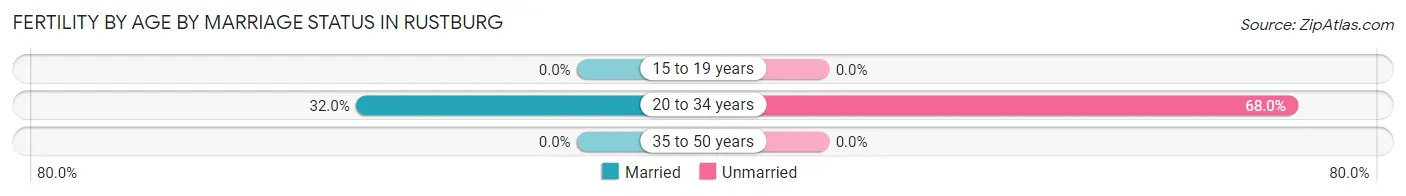
| Age Bracket | Married | Unmarried |
| 15 to 19 years | 0 (0.0%) | 0 (0.0%) |
| 20 to 34 years | 41 (32.0%) | 87 (68.0%) |
| 35 to 50 years | 0 (0.0%) | 0 (0.0%) |
| Total | 41 (32.0%) | 87 (68.0%) |
Fertility by Education in Rustburg
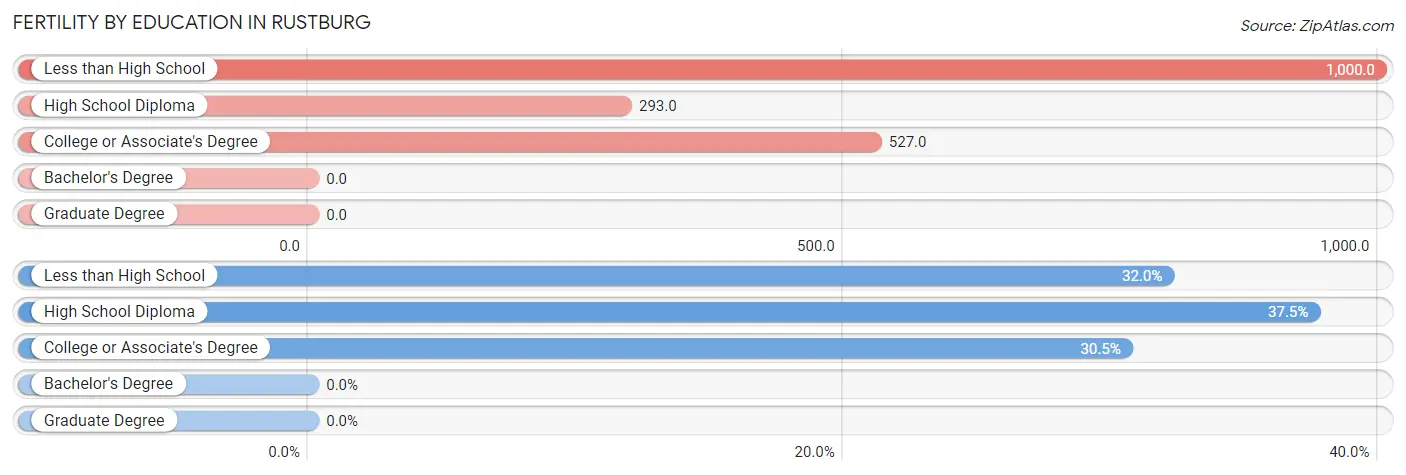
| Educational Attainment | Women with Births | Births / 1,000 Women |
| Less than High School | 41 (32.0%) | 1,000.0 |
| High School Diploma | 48 (37.5%) | 293.0 |
| College or Associate's Degree | 39 (30.5%) | 527.0 |
| Bachelor's Degree | 0 (0.0%) | 0.0 |
| Graduate Degree | 0 (0.0%) | 0.0 |
| Total | 128 (100.0%) | 414.0 |
Fertility by Education by Marriage Status in Rustburg
68.0% of women with births in Rustburg are unmarried. Women with the educational attainment of less than high school are most likely to be married with 100.0% of them married at childbirth, while women with the educational attainment of high school diploma are least likely to be married with 100.0% of them unmarried at childbirth.
| Educational Attainment | Married | Unmarried |
| Less than High School | 41 (100.0%) | 0 (0.0%) |
| High School Diploma | 0 (0.0%) | 48 (100.0%) |
| College or Associate's Degree | 0 (0.0%) | 39 (100.0%) |
| Bachelor's Degree | 0 (0.0%) | 0 (0.0%) |
| Graduate Degree | 0 (0.0%) | 0 (0.0%) |
| Total | 41 (32.0%) | 87 (68.0%) |
Employment Characteristics in Rustburg
Employment by Class of Employer in Rustburg
Among the 704 employed individuals in Rustburg, private company employees (370 | 52.6%), not-for-profit organizations (227 | 32.2%), and local government employees (70 | 9.9%) make up the most common classes of employment.
| Employer Class | # Employees | % Employees |
| Private Company Employees | 370 | 52.6% |
| Self-Employed (Incorporated) | 27 | 3.8% |
| Self-Employed (Not Incorporated) | 0 | 0.0% |
| Not-for-profit Organizations | 227 | 32.2% |
| Local Government Employees | 70 | 9.9% |
| State Government Employees | 0 | 0.0% |
| Federal Government Employees | 10 | 1.4% |
| Unpaid Family Workers | 0 | 0.0% |
| Total | 704 | 100.0% |
Employment Status by Age in Rustburg
According to the labor force statistics for Rustburg, out of the total population over 16 years of age (1,351), 59.5% or 804 individuals are in the labor force, with 9.8% or 79 of them unemployed. The age group with the highest labor force participation rate is 45 to 54 years, with 90.1% or 91 individuals in the labor force. Within the labor force, the 25 to 29 years age range has the highest percentage of unemployed individuals, with 43.6% or 65 of them being unemployed.
| Age Bracket | In Labor Force | Unemployed |
| 16 to 19 Years | 12 (30.0%) | 0 (0.0%) |
| 20 to 24 Years | 52 (34.7%) | 0 (0.0%) |
| 25 to 29 Years | 149 (71.6%) | 65 (43.6%) |
| 30 to 34 Years | 27 (30.7%) | 0 (0.0%) |
| 35 to 44 Years | 103 (78.0%) | 14 (13.6%) |
| 45 to 54 Years | 91 (90.1%) | 0 (0.0%) |
| 55 to 59 Years | 85 (83.3%) | 0 (0.0%) |
| 60 to 64 Years | 232 (80.0%) | 0 (0.0%) |
| 65 to 74 Years | 53 (38.4%) | 0 (0.0%) |
| 75 Years and over | 0 (0.0%) | 0 (0.0%) |
| Total | 804 (59.5%) | 79 (9.8%) |
Employment Status by Educational Attainment in Rustburg
According to labor force statistics for Rustburg, 74.6% of individuals (687) out of the total population between 25 and 64 years of age (921) are in the labor force, with 11.5% or 79 of them being unemployed. The group with the highest labor force participation rate are those with the educational attainment of bachelor's degree or higher, with 96.5% or 273 individuals in the labor force. Within the labor force, individuals with college / associate degree education have the highest percentage of unemployment, with 43.3% or 65 of them being unemployed.
| Educational Attainment | In Labor Force | Unemployed |
| Less than High School | 41 (47.7%) | 0 (0.0%) |
| High School Diploma | 223 (67.0%) | 0 (0.0%) |
| College / Associate Degree | 150 (68.5%) | 95 (43.3%) |
| Bachelor's Degree or higher | 273 (96.5%) | 14 (5.1%) |
| Total | 687 (74.6%) | 106 (11.5%) |
Employment Occupations by Sex in Rustburg
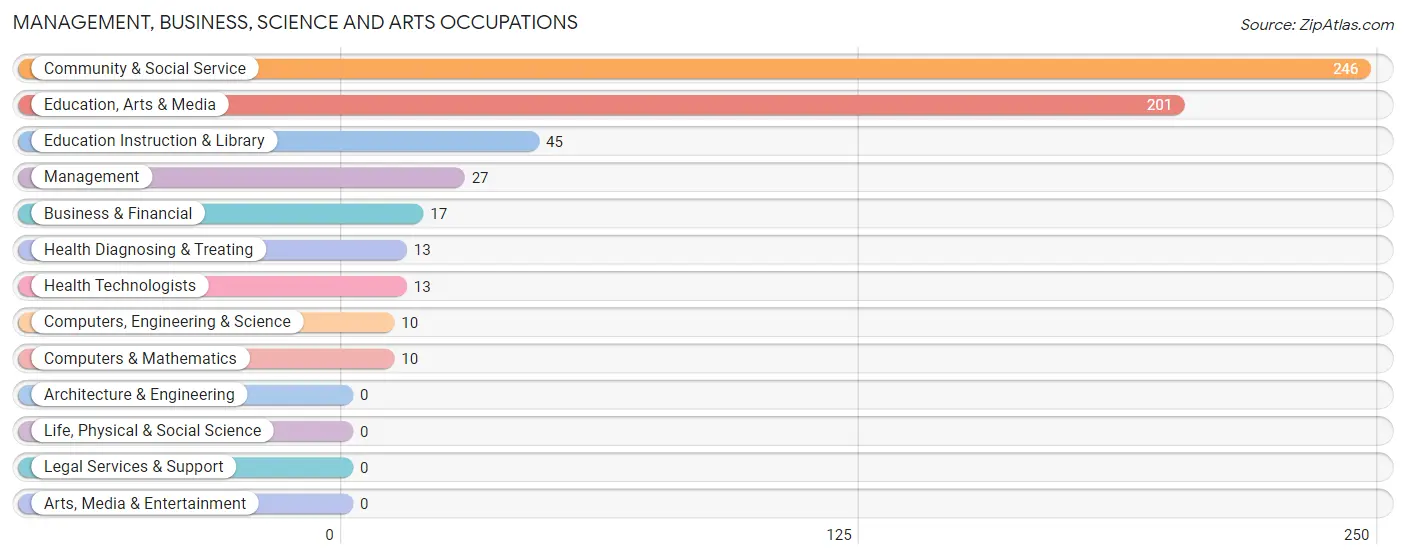
Management, Business, Science and Arts Occupations
The most common Management, Business, Science and Arts occupations in Rustburg are Community & Social Service (246 | 33.9%), Education, Arts & Media (201 | 27.7%), Education Instruction & Library (45 | 6.2%), Management (27 | 3.7%), and Business & Financial (17 | 2.3%).
Management, Business, Science and Arts Occupations by Sex
Within the Management, Business, Science and Arts occupations in Rustburg, the most male-oriented occupations are Education, Arts & Media (100.0%), Community & Social Service (81.7%), and Management (74.1%), while the most female-oriented occupations are Computers, Engineering & Science (100.0%), Computers & Mathematics (100.0%), and Education Instruction & Library (100.0%).
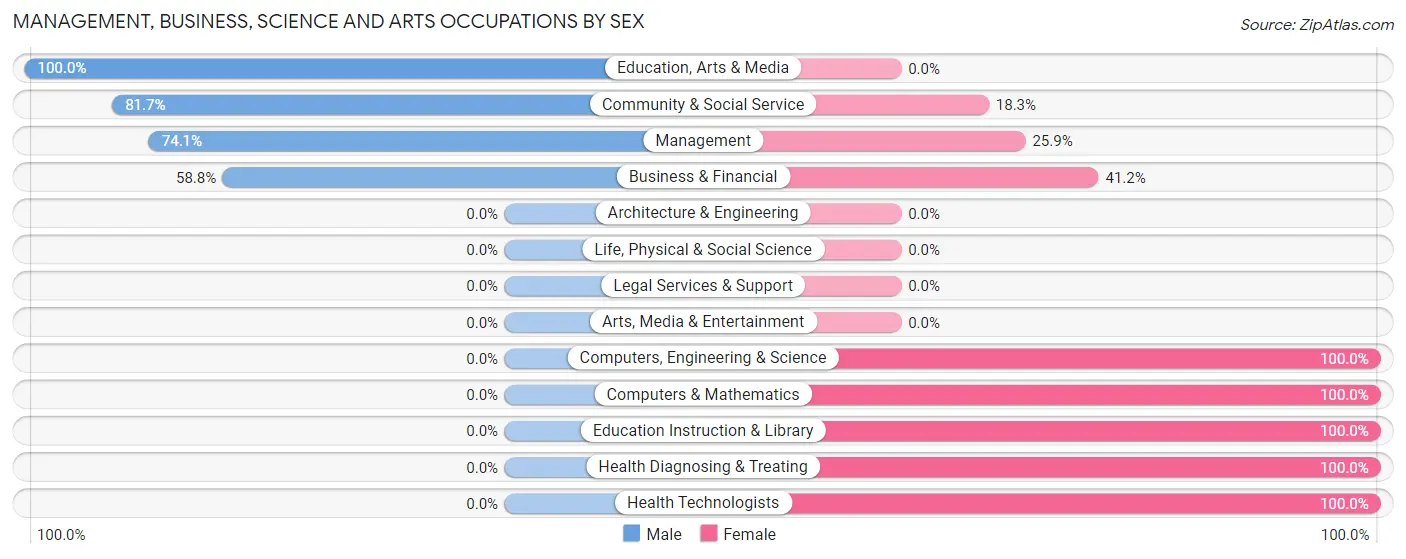
| Occupation | Male | Female |
| Management | 20 (74.1%) | 7 (25.9%) |
| Business & Financial | 10 (58.8%) | 7 (41.2%) |
| Computers, Engineering & Science | 0 (0.0%) | 10 (100.0%) |
| Computers & Mathematics | 0 (0.0%) | 10 (100.0%) |
| Architecture & Engineering | 0 (0.0%) | 0 (0.0%) |
| Life, Physical & Social Science | 0 (0.0%) | 0 (0.0%) |
| Community & Social Service | 201 (81.7%) | 45 (18.3%) |
| Education, Arts & Media | 201 (100.0%) | 0 (0.0%) |
| Legal Services & Support | 0 (0.0%) | 0 (0.0%) |
| Education Instruction & Library | 0 (0.0%) | 45 (100.0%) |
| Arts, Media & Entertainment | 0 (0.0%) | 0 (0.0%) |
| Health Diagnosing & Treating | 0 (0.0%) | 13 (100.0%) |
| Health Technologists | 0 (0.0%) | 13 (100.0%) |
| Total (Category) | 231 (73.8%) | 82 (26.2%) |
| Total (Overall) | 455 (62.8%) | 270 (37.2%) |
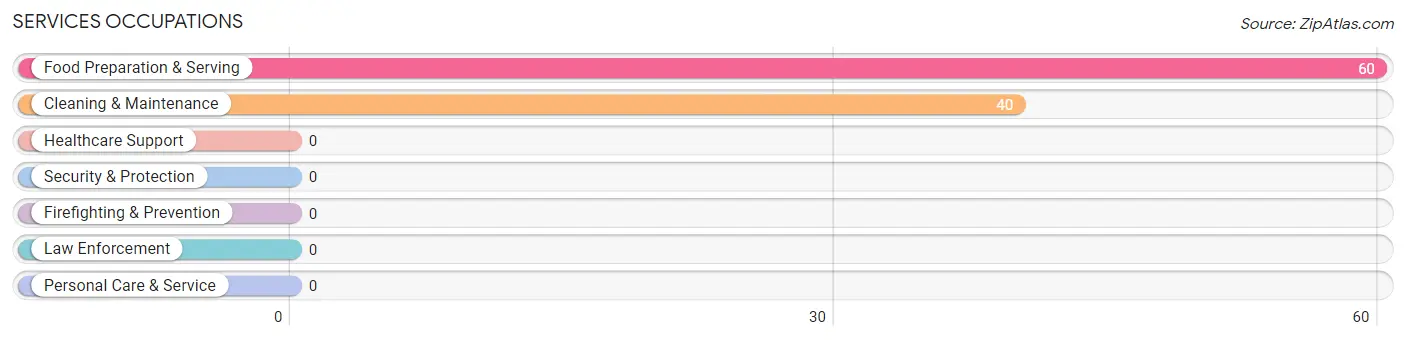
Services Occupations
The most common Services occupations in Rustburg are Food Preparation & Serving (60 | 8.3%), and Cleaning & Maintenance (40 | 5.5%).
Services Occupations by Sex
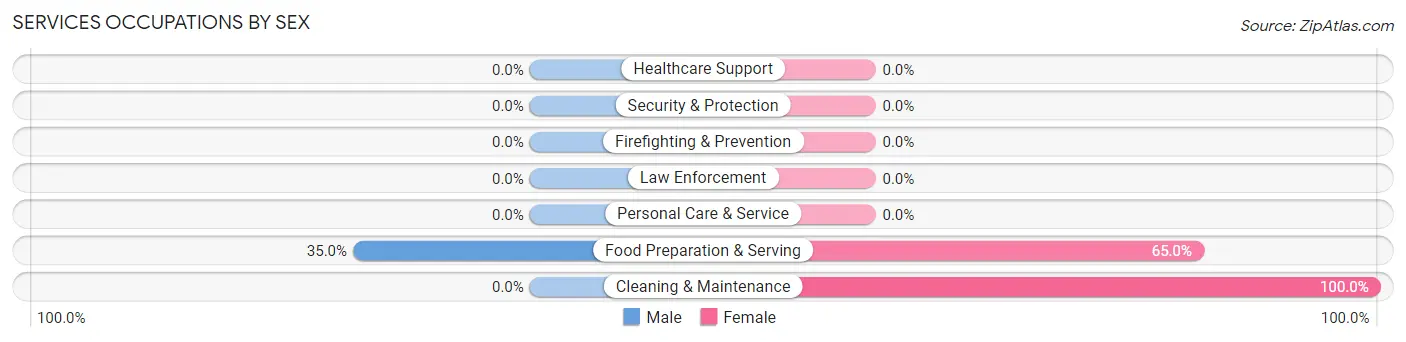
| Occupation | Male | Female |
| Healthcare Support | 0 (0.0%) | 0 (0.0%) |
| Security & Protection | 0 (0.0%) | 0 (0.0%) |
| Firefighting & Prevention | 0 (0.0%) | 0 (0.0%) |
| Law Enforcement | 0 (0.0%) | 0 (0.0%) |
| Food Preparation & Serving | 21 (35.0%) | 39 (65.0%) |
| Cleaning & Maintenance | 0 (0.0%) | 40 (100.0%) |
| Personal Care & Service | 0 (0.0%) | 0 (0.0%) |
| Total (Category) | 21 (21.0%) | 79 (79.0%) |
| Total (Overall) | 455 (62.8%) | 270 (37.2%) |
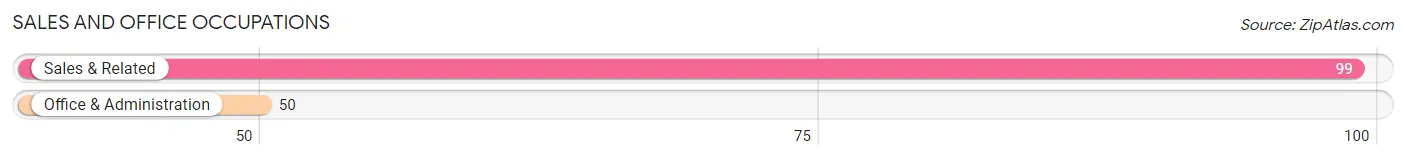
Sales and Office Occupations
The most common Sales and Office occupations in Rustburg are Sales & Related (99 | 13.7%), and Office & Administration (50 | 6.9%).
Sales and Office Occupations by Sex
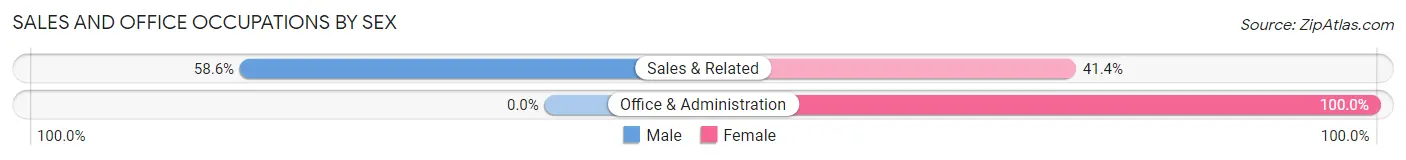
| Occupation | Male | Female |
| Sales & Related | 58 (58.6%) | 41 (41.4%) |
| Office & Administration | 0 (0.0%) | 50 (100.0%) |
| Total (Category) | 58 (38.9%) | 91 (61.1%) |
| Total (Overall) | 455 (62.8%) | 270 (37.2%) |
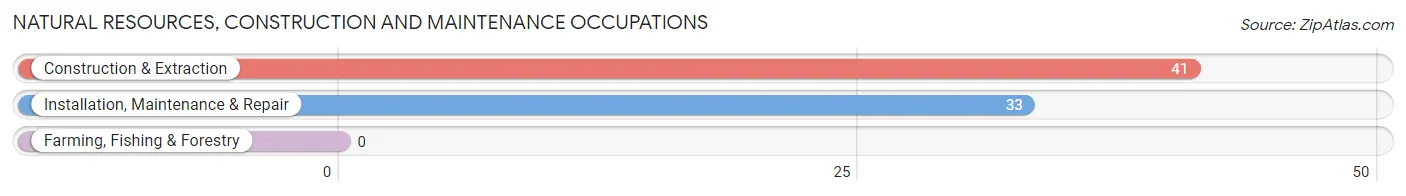
Natural Resources, Construction and Maintenance Occupations
The most common Natural Resources, Construction and Maintenance occupations in Rustburg are Construction & Extraction (41 | 5.7%), and Installation, Maintenance & Repair (33 | 4.5%).
Natural Resources, Construction and Maintenance Occupations by Sex
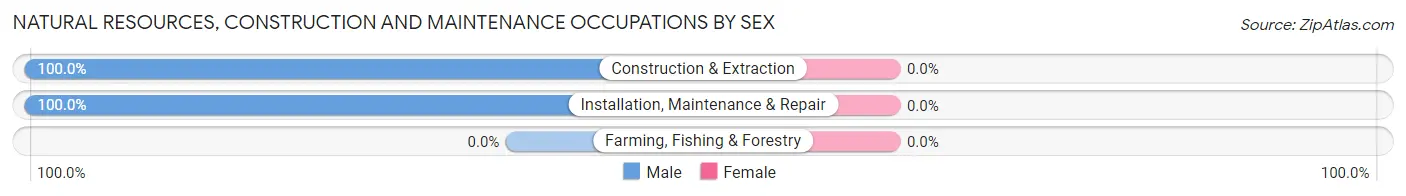
| Occupation | Male | Female |
| Farming, Fishing & Forestry | 0 (0.0%) | 0 (0.0%) |
| Construction & Extraction | 41 (100.0%) | 0 (0.0%) |
| Installation, Maintenance & Repair | 33 (100.0%) | 0 (0.0%) |
| Total (Category) | 74 (100.0%) | 0 (0.0%) |
| Total (Overall) | 455 (62.8%) | 270 (37.2%) |
Production, Transportation and Moving Occupations
The most common Production, Transportation and Moving occupations in Rustburg are Production (43 | 5.9%), Material Moving (25 | 3.5%), and Transportation (21 | 2.9%).
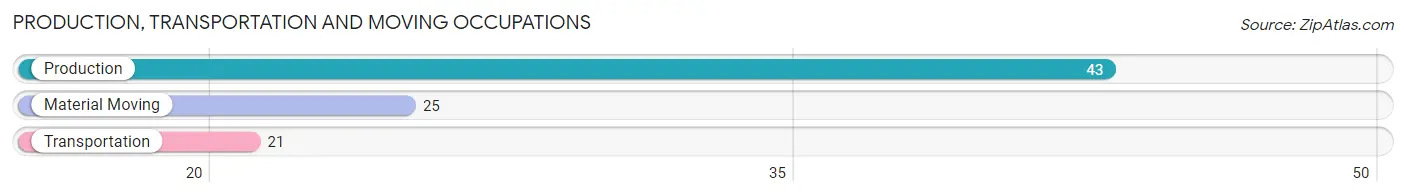
Production, Transportation and Moving Occupations by Sex
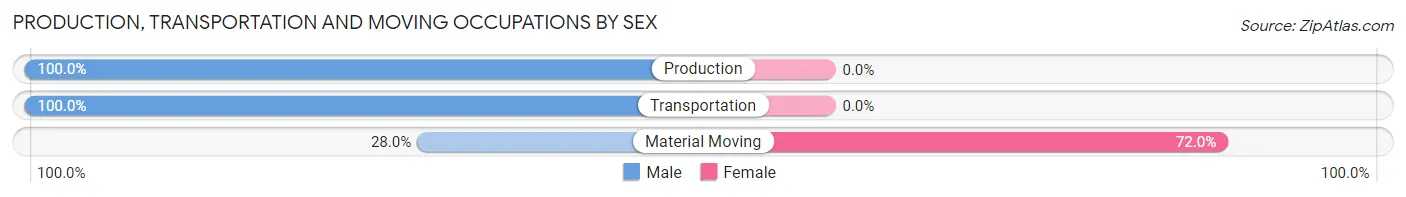
| Occupation | Male | Female |
| Production | 43 (100.0%) | 0 (0.0%) |
| Transportation | 21 (100.0%) | 0 (0.0%) |
| Material Moving | 7 (28.0%) | 18 (72.0%) |
| Total (Category) | 71 (79.8%) | 18 (20.2%) |
| Total (Overall) | 455 (62.8%) | 270 (37.2%) |
Employment Industries by Sex in Rustburg
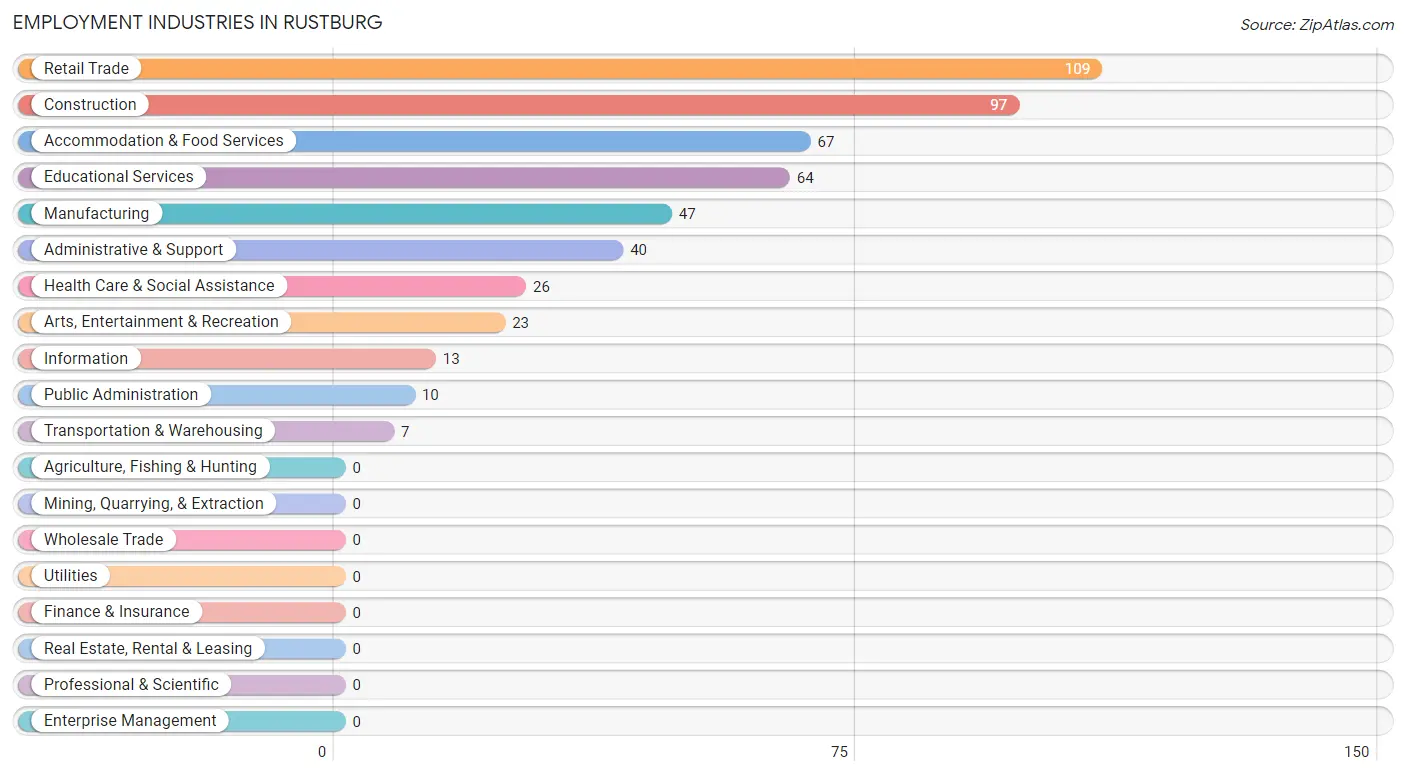
Employment Industries in Rustburg
The major employment industries in Rustburg include Retail Trade (109 | 15.0%), Construction (97 | 13.4%), Accommodation & Food Services (67 | 9.2%), Educational Services (64 | 8.8%), and Manufacturing (47 | 6.5%).
Employment Industries by Sex in Rustburg
The Rustburg industries that see more men than women are Transportation & Warehousing (100.0%), Construction (87.6%), and Retail Trade (72.5%), whereas the industries that tend to have a higher number of women are Information (100.0%), Administrative & Support (100.0%), and Educational Services (100.0%).
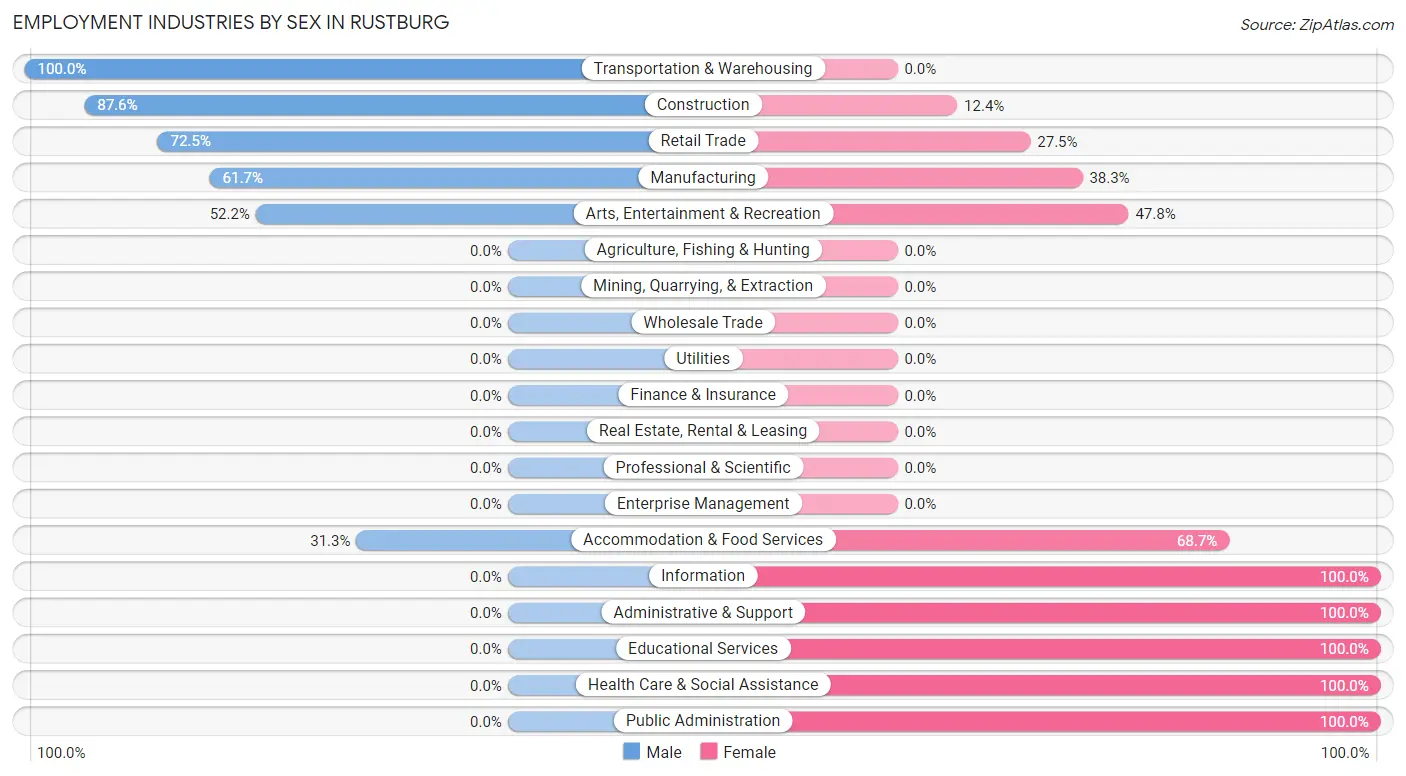
| Industry | Male | Female |
| Agriculture, Fishing & Hunting | 0 (0.0%) | 0 (0.0%) |
| Mining, Quarrying, & Extraction | 0 (0.0%) | 0 (0.0%) |
| Construction | 85 (87.6%) | 12 (12.4%) |
| Manufacturing | 29 (61.7%) | 18 (38.3%) |
| Wholesale Trade | 0 (0.0%) | 0 (0.0%) |
| Retail Trade | 79 (72.5%) | 30 (27.5%) |
| Transportation & Warehousing | 7 (100.0%) | 0 (0.0%) |
| Utilities | 0 (0.0%) | 0 (0.0%) |
| Information | 0 (0.0%) | 13 (100.0%) |
| Finance & Insurance | 0 (0.0%) | 0 (0.0%) |
| Real Estate, Rental & Leasing | 0 (0.0%) | 0 (0.0%) |
| Professional & Scientific | 0 (0.0%) | 0 (0.0%) |
| Enterprise Management | 0 (0.0%) | 0 (0.0%) |
| Administrative & Support | 0 (0.0%) | 40 (100.0%) |
| Educational Services | 0 (0.0%) | 64 (100.0%) |
| Health Care & Social Assistance | 0 (0.0%) | 26 (100.0%) |
| Arts, Entertainment & Recreation | 12 (52.2%) | 11 (47.8%) |
| Accommodation & Food Services | 21 (31.3%) | 46 (68.7%) |
| Public Administration | 0 (0.0%) | 10 (100.0%) |
| Total | 455 (62.8%) | 270 (37.2%) |
Education in Rustburg
School Enrollment in Rustburg
The most common levels of schooling among the 337 students in Rustburg are college / undergraduate (137 | 40.6%), elementary school (119 | 35.3%), and kindergarten (38 | 11.3%).
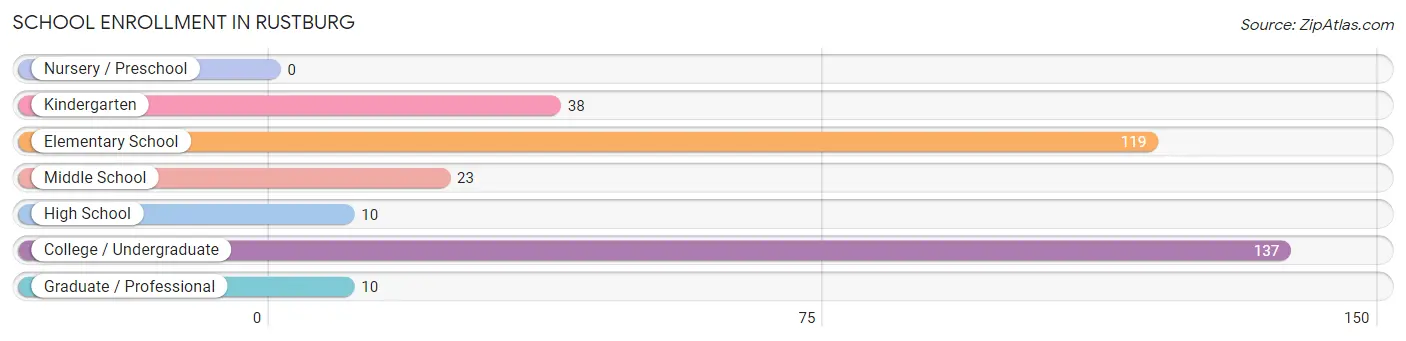
| School Level | # Students | % Students |
| Nursery / Preschool | 0 | 0.0% |
| Kindergarten | 38 | 11.3% |
| Elementary School | 119 | 35.3% |
| Middle School | 23 | 6.8% |
| High School | 10 | 3.0% |
| College / Undergraduate | 137 | 40.6% |
| Graduate / Professional | 10 | 3.0% |
| Total | 337 | 100.0% |
School Enrollment by Age by Funding Source in Rustburg
Out of a total of 337 students who are enrolled in schools in Rustburg, 21 (6.2%) attend a private institution, while the remaining 316 (93.8%) are enrolled in public schools. The age group of 20 to 24 year olds has the highest likelihood of being enrolled in private schools, with 11 (18.6% in the age bracket) enrolled. Conversely, the age group of 5 to 9 year old has the lowest likelihood of being enrolled in a private school, with 157 (100.0% in the age bracket) attending a public institution.
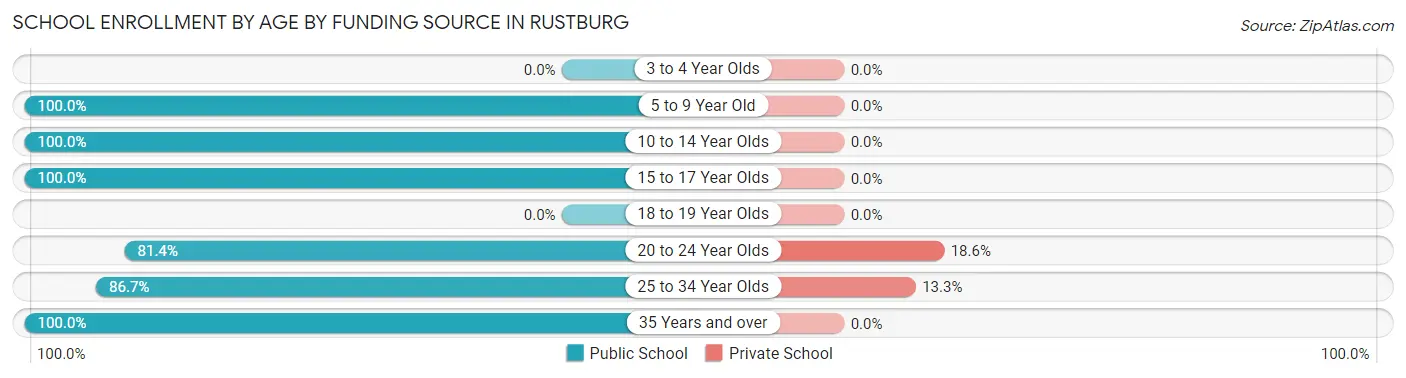
| Age Bracket | Public School | Private School |
| 3 to 4 Year Olds | 0 (0.0%) | 0 (0.0%) |
| 5 to 9 Year Old | 157 (100.0%) | 0 (0.0%) |
| 10 to 14 Year Olds | 23 (100.0%) | 0 (0.0%) |
| 15 to 17 Year Olds | 10 (100.0%) | 0 (0.0%) |
| 18 to 19 Year Olds | 0 (0.0%) | 0 (0.0%) |
| 20 to 24 Year Olds | 48 (81.4%) | 11 (18.6%) |
| 25 to 34 Year Olds | 65 (86.7%) | 10 (13.3%) |
| 35 Years and over | 13 (100.0%) | 0 (0.0%) |
| Total | 316 (93.8%) | 21 (6.2%) |
Educational Attainment by Field of Study in Rustburg
Liberal arts & history (211 | 57.0%), business (39 | 10.5%), social sciences (36 | 9.7%), education (31 | 8.4%), and science & technology (20 | 5.4%) are the most common fields of study among 370 individuals in Rustburg who have obtained a bachelor's degree or higher.
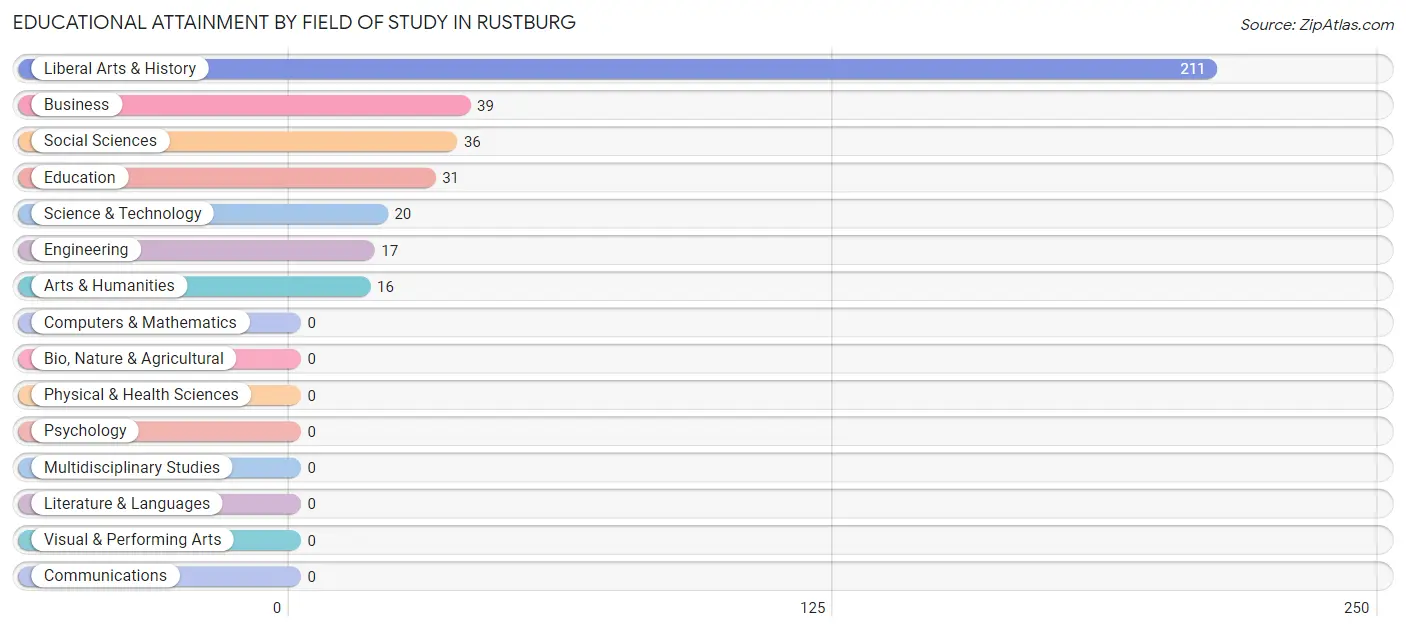
| Field of Study | # Graduates | % Graduates |
| Computers & Mathematics | 0 | 0.0% |
| Bio, Nature & Agricultural | 0 | 0.0% |
| Physical & Health Sciences | 0 | 0.0% |
| Psychology | 0 | 0.0% |
| Social Sciences | 36 | 9.7% |
| Engineering | 17 | 4.6% |
| Multidisciplinary Studies | 0 | 0.0% |
| Science & Technology | 20 | 5.4% |
| Business | 39 | 10.5% |
| Education | 31 | 8.4% |
| Literature & Languages | 0 | 0.0% |
| Liberal Arts & History | 211 | 57.0% |
| Visual & Performing Arts | 0 | 0.0% |
| Communications | 0 | 0.0% |
| Arts & Humanities | 16 | 4.3% |
| Total | 370 | 100.0% |
Transportation & Commute in Rustburg
Vehicle Availability by Sex in Rustburg
The most prevalent vehicle ownership categories in Rustburg are males with 1 vehicle (201, accounting for 46.3%) and females with 1 vehicle (57, making up 74.4%).
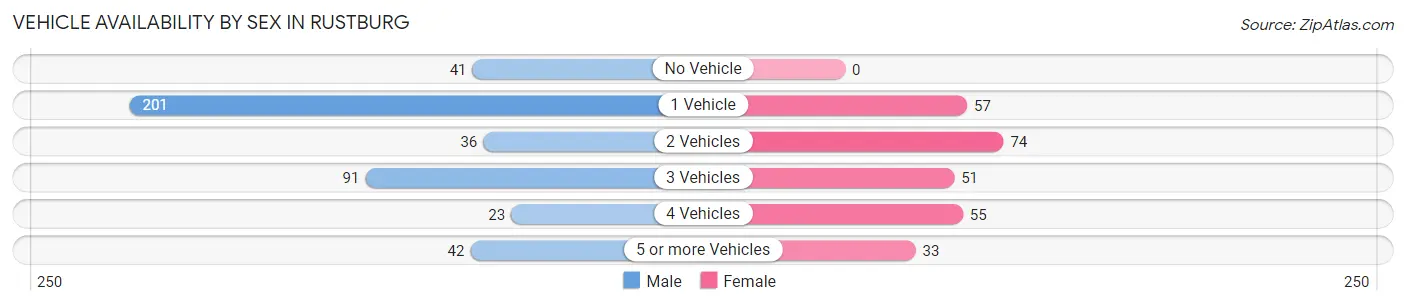
| Vehicles Available | Male | Female |
| No Vehicle | 41 (9.5%) | 0 (0.0%) |
| 1 Vehicle | 201 (46.3%) | 57 (21.1%) |
| 2 Vehicles | 36 (8.3%) | 74 (27.4%) |
| 3 Vehicles | 91 (21.0%) | 51 (18.9%) |
| 4 Vehicles | 23 (5.3%) | 55 (20.4%) |
| 5 or more Vehicles | 42 (9.7%) | 33 (12.2%) |
| Total | 434 (100.0%) | 270 (100.0%) |
Commute Time in Rustburg
The most frequently occuring commute durations in Rustburg are less than 5 minutes (214 commuters, 32.3%), 30 to 34 minutes (136 commuters, 20.5%), and 20 to 24 minutes (92 commuters, 13.9%).
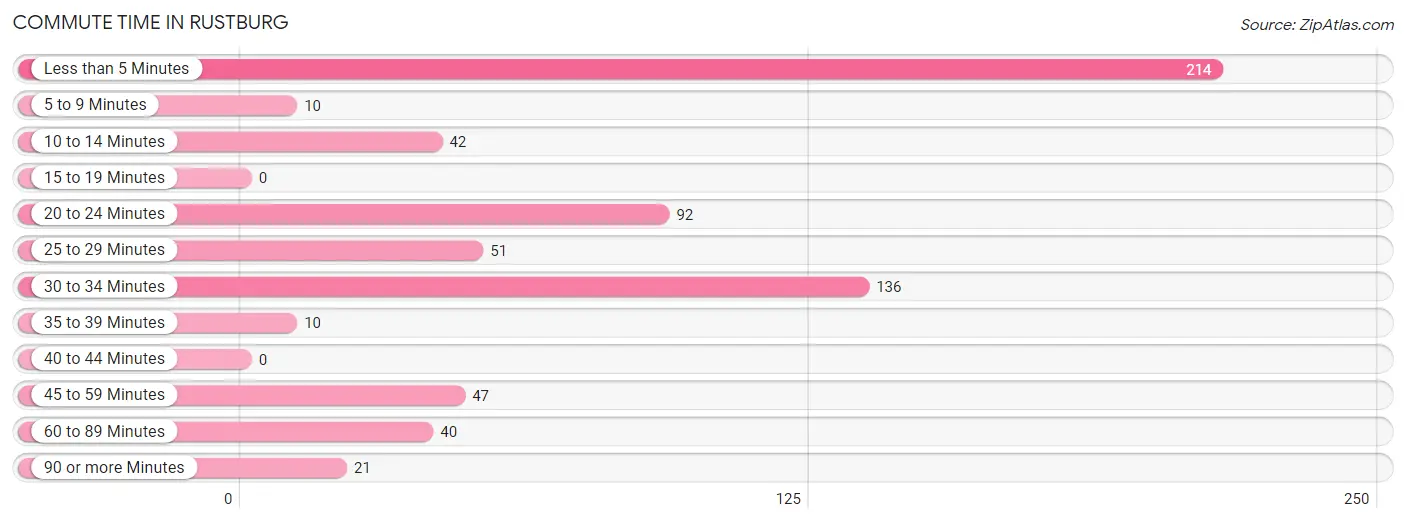
| Commute Time | # Commuters | % Commuters |
| Less than 5 Minutes | 214 | 32.3% |
| 5 to 9 Minutes | 10 | 1.5% |
| 10 to 14 Minutes | 42 | 6.3% |
| 15 to 19 Minutes | 0 | 0.0% |
| 20 to 24 Minutes | 92 | 13.9% |
| 25 to 29 Minutes | 51 | 7.7% |
| 30 to 34 Minutes | 136 | 20.5% |
| 35 to 39 Minutes | 10 | 1.5% |
| 40 to 44 Minutes | 0 | 0.0% |
| 45 to 59 Minutes | 47 | 7.1% |
| 60 to 89 Minutes | 40 | 6.0% |
| 90 or more Minutes | 21 | 3.2% |
Commute Time by Sex in Rustburg
The most common commute times in Rustburg are less than 5 minutes (201 commuters, 47.6%) for males and 20 to 24 minutes (71 commuters, 29.5%) for females.
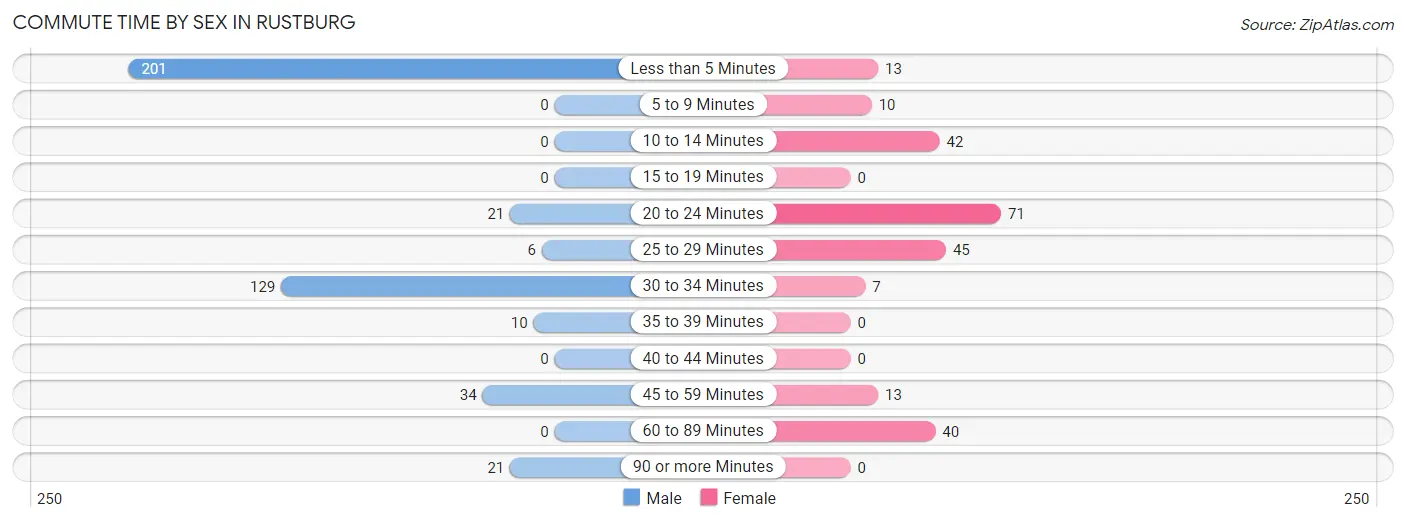
| Commute Time | Male | Female |
| Less than 5 Minutes | 201 (47.6%) | 13 (5.4%) |
| 5 to 9 Minutes | 0 (0.0%) | 10 (4.2%) |
| 10 to 14 Minutes | 0 (0.0%) | 42 (17.4%) |
| 15 to 19 Minutes | 0 (0.0%) | 0 (0.0%) |
| 20 to 24 Minutes | 21 (5.0%) | 71 (29.5%) |
| 25 to 29 Minutes | 6 (1.4%) | 45 (18.7%) |
| 30 to 34 Minutes | 129 (30.6%) | 7 (2.9%) |
| 35 to 39 Minutes | 10 (2.4%) | 0 (0.0%) |
| 40 to 44 Minutes | 0 (0.0%) | 0 (0.0%) |
| 45 to 59 Minutes | 34 (8.1%) | 13 (5.4%) |
| 60 to 89 Minutes | 0 (0.0%) | 40 (16.6%) |
| 90 or more Minutes | 21 (5.0%) | 0 (0.0%) |
Time of Departure to Work by Sex in Rustburg
The most frequent times of departure to work in Rustburg are 8:00 AM to 8:29 AM (263, 62.3%) for males and 9:00 AM to 9:59 AM (52, 21.6%) for females.
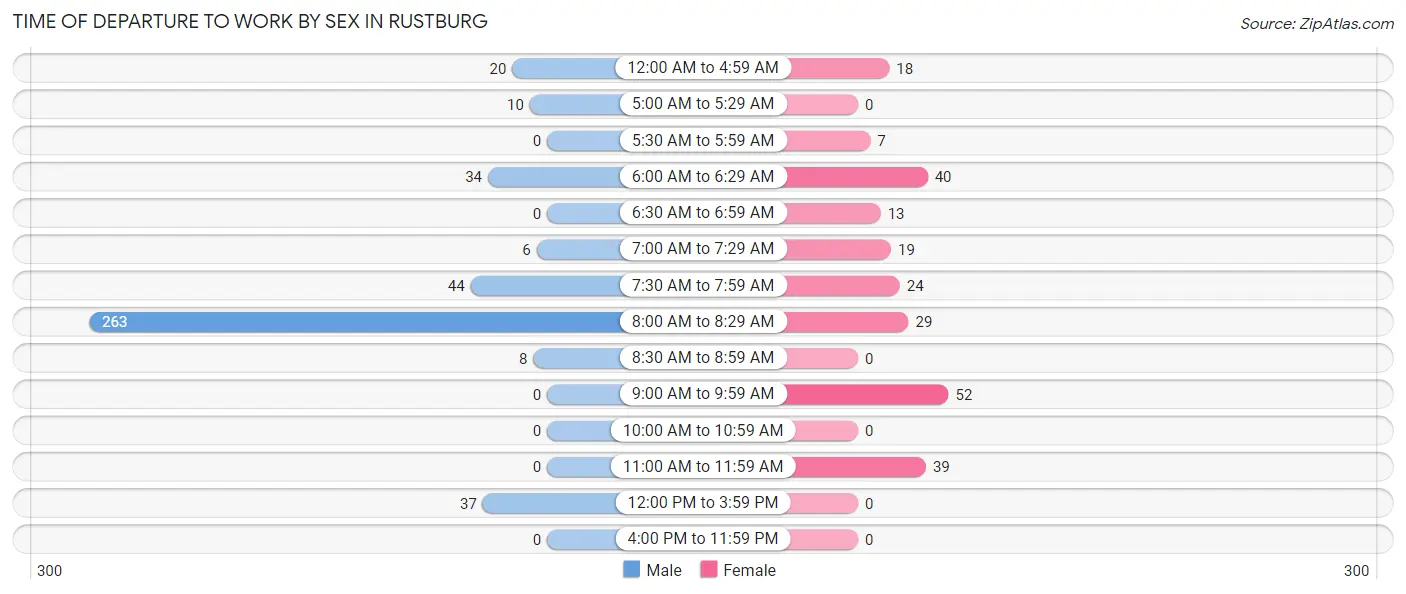
| Time of Departure | Male | Female |
| 12:00 AM to 4:59 AM | 20 (4.7%) | 18 (7.5%) |
| 5:00 AM to 5:29 AM | 10 (2.4%) | 0 (0.0%) |
| 5:30 AM to 5:59 AM | 0 (0.0%) | 7 (2.9%) |
| 6:00 AM to 6:29 AM | 34 (8.1%) | 40 (16.6%) |
| 6:30 AM to 6:59 AM | 0 (0.0%) | 13 (5.4%) |
| 7:00 AM to 7:29 AM | 6 (1.4%) | 19 (7.9%) |
| 7:30 AM to 7:59 AM | 44 (10.4%) | 24 (10.0%) |
| 8:00 AM to 8:29 AM | 263 (62.3%) | 29 (12.0%) |
| 8:30 AM to 8:59 AM | 8 (1.9%) | 0 (0.0%) |
| 9:00 AM to 9:59 AM | 0 (0.0%) | 52 (21.6%) |
| 10:00 AM to 10:59 AM | 0 (0.0%) | 0 (0.0%) |
| 11:00 AM to 11:59 AM | 0 (0.0%) | 39 (16.2%) |
| 12:00 PM to 3:59 PM | 37 (8.8%) | 0 (0.0%) |
| 4:00 PM to 11:59 PM | 0 (0.0%) | 0 (0.0%) |
| Total | 422 (100.0%) | 241 (100.0%) |
Housing Occupancy in Rustburg
Occupancy by Ownership in Rustburg
Of the total 678 dwellings in Rustburg, owner-occupied units account for 251 (37.0%), while renter-occupied units make up 427 (63.0%).
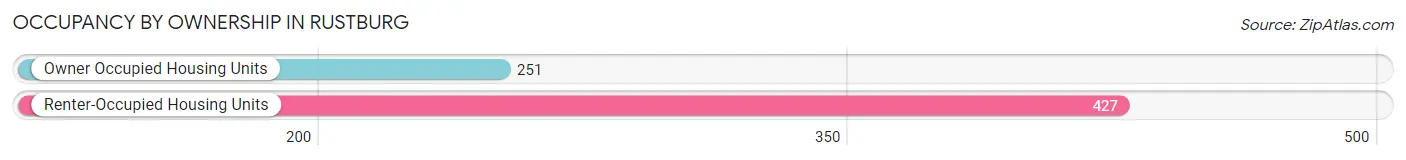
| Occupancy | # Housing Units | % Housing Units |
| Owner Occupied Housing Units | 251 | 37.0% |
| Renter-Occupied Housing Units | 427 | 63.0% |
| Total Occupied Housing Units | 678 | 100.0% |
Occupancy by Household Size in Rustburg
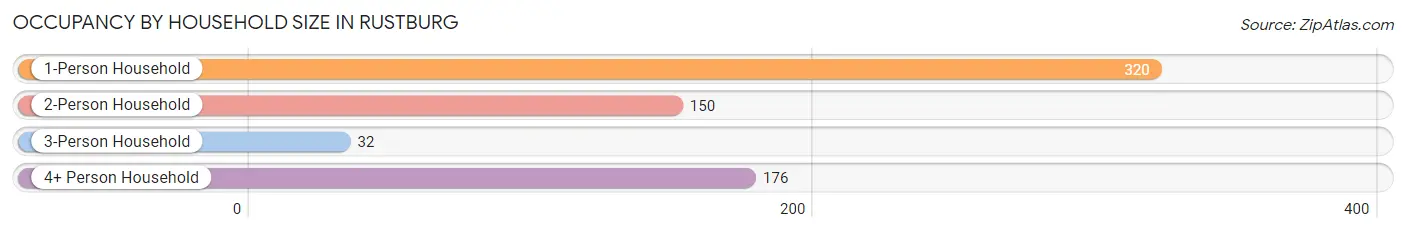
| Household Size | # Housing Units | % Housing Units |
| 1-Person Household | 320 | 47.2% |
| 2-Person Household | 150 | 22.1% |
| 3-Person Household | 32 | 4.7% |
| 4+ Person Household | 176 | 26.0% |
| Total Housing Units | 678 | 100.0% |
Occupancy by Ownership by Household Size in Rustburg
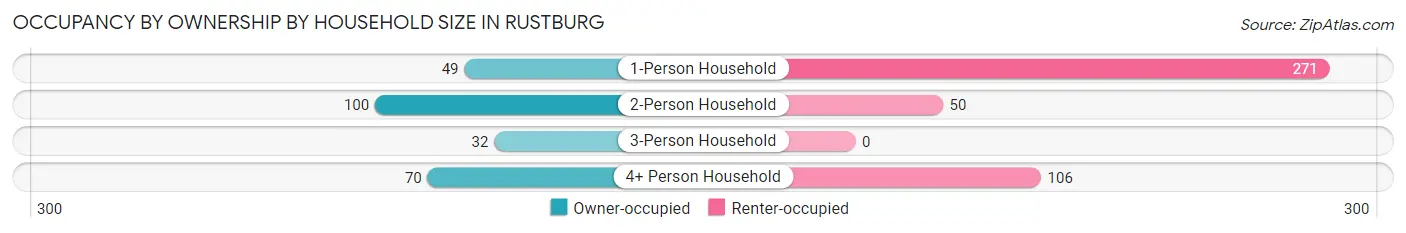
| Household Size | Owner-occupied | Renter-occupied |
| 1-Person Household | 49 (15.3%) | 271 (84.7%) |
| 2-Person Household | 100 (66.7%) | 50 (33.3%) |
| 3-Person Household | 32 (100.0%) | 0 (0.0%) |
| 4+ Person Household | 70 (39.8%) | 106 (60.2%) |
| Total Housing Units | 251 (37.0%) | 427 (63.0%) |
Occupancy by Educational Attainment in Rustburg
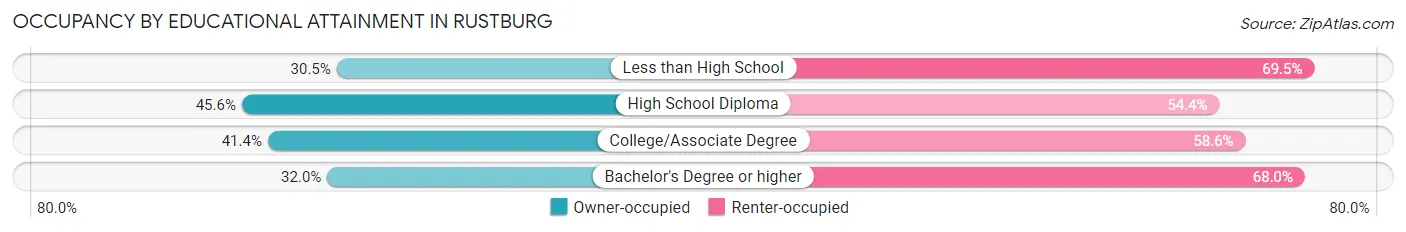
| Household Size | Owner-occupied | Renter-occupied |
| Less than High School | 18 (30.5%) | 41 (69.5%) |
| High School Diploma | 82 (45.6%) | 98 (54.4%) |
| College/Associate Degree | 46 (41.4%) | 65 (58.6%) |
| Bachelor's Degree or higher | 105 (32.0%) | 223 (68.0%) |
Occupancy by Age of Householder in Rustburg
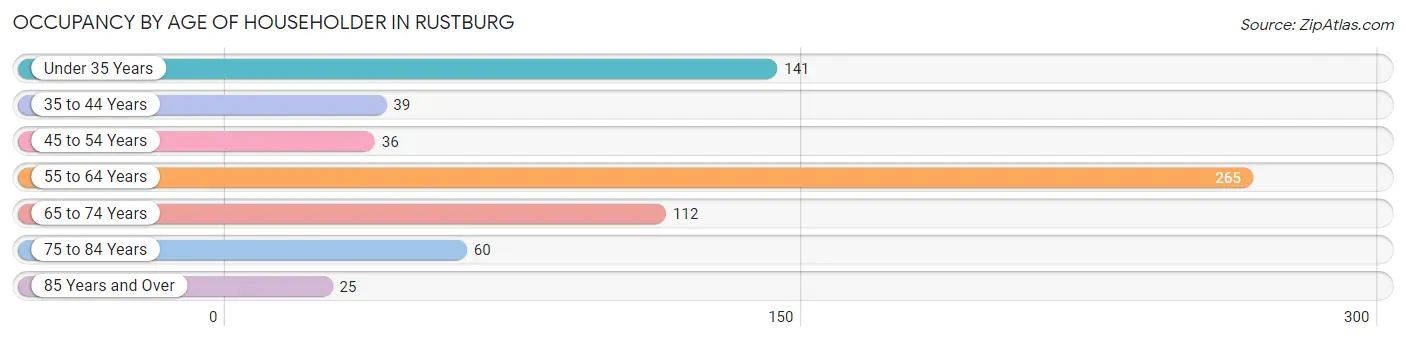
| Age Bracket | # Households | % Households |
| Under 35 Years | 141 | 20.8% |
| 35 to 44 Years | 39 | 5.8% |
| 45 to 54 Years | 36 | 5.3% |
| 55 to 64 Years | 265 | 39.1% |
| 65 to 74 Years | 112 | 16.5% |
| 75 to 84 Years | 60 | 8.8% |
| 85 Years and Over | 25 | 3.7% |
| Total | 678 | 100.0% |
Housing Finances in Rustburg
Median Income by Occupancy in Rustburg
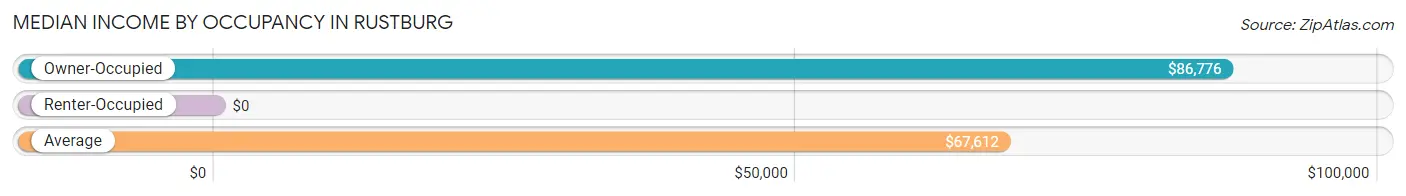
| Occupancy Type | # Households | Median Income |
| Owner-Occupied | 251 (37.0%) | $86,776 |
| Renter-Occupied | 427 (63.0%) | $0 |
| Average | 678 (100.0%) | $67,612 |
Occupancy by Householder Income Bracket in Rustburg
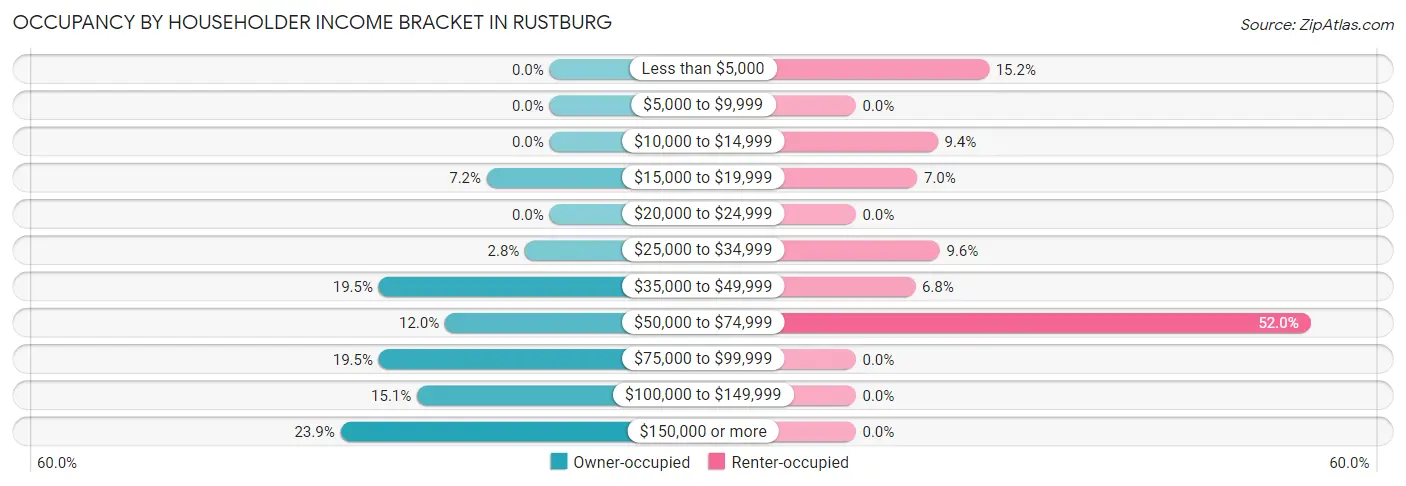
| Income Bracket | Owner-occupied | Renter-occupied |
| Less than $5,000 | 0 (0.0%) | 65 (15.2%) |
| $5,000 to $9,999 | 0 (0.0%) | 0 (0.0%) |
| $10,000 to $14,999 | 0 (0.0%) | 40 (9.4%) |
| $15,000 to $19,999 | 18 (7.2%) | 30 (7.0%) |
| $20,000 to $24,999 | 0 (0.0%) | 0 (0.0%) |
| $25,000 to $34,999 | 7 (2.8%) | 41 (9.6%) |
| $35,000 to $49,999 | 49 (19.5%) | 29 (6.8%) |
| $50,000 to $74,999 | 30 (11.9%) | 222 (52.0%) |
| $75,000 to $99,999 | 49 (19.5%) | 0 (0.0%) |
| $100,000 to $149,999 | 38 (15.1%) | 0 (0.0%) |
| $150,000 or more | 60 (23.9%) | 0 (0.0%) |
| Total | 251 (100.0%) | 427 (100.0%) |
Monthly Housing Cost Tiers in Rustburg
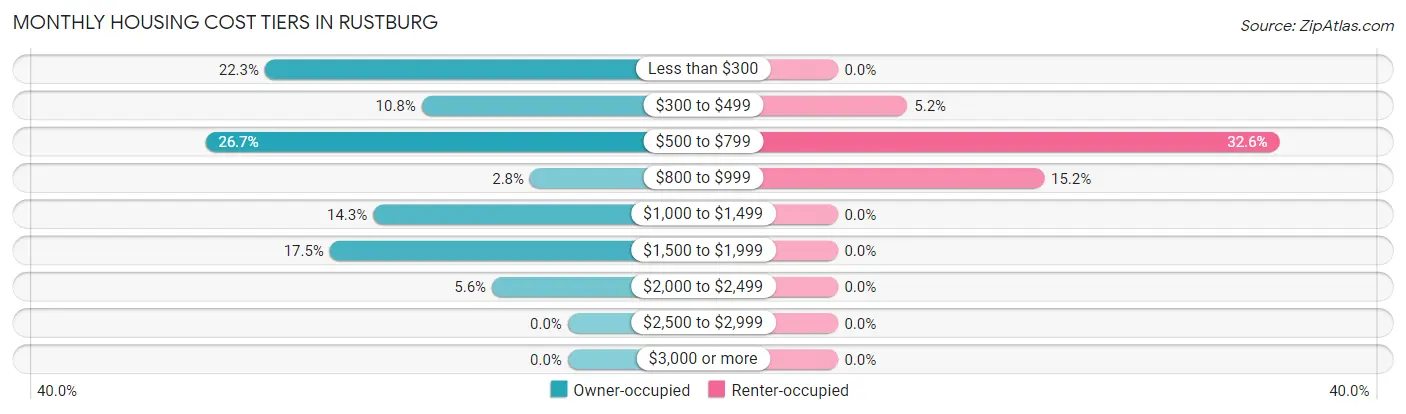
| Monthly Cost | Owner-occupied | Renter-occupied |
| Less than $300 | 56 (22.3%) | 0 (0.0%) |
| $300 to $499 | 27 (10.8%) | 22 (5.1%) |
| $500 to $799 | 67 (26.7%) | 139 (32.6%) |
| $800 to $999 | 7 (2.8%) | 65 (15.2%) |
| $1,000 to $1,499 | 36 (14.3%) | 0 (0.0%) |
| $1,500 to $1,999 | 44 (17.5%) | 0 (0.0%) |
| $2,000 to $2,499 | 14 (5.6%) | 0 (0.0%) |
| $2,500 to $2,999 | 0 (0.0%) | 0 (0.0%) |
| $3,000 or more | 0 (0.0%) | 0 (0.0%) |
| Total | 251 (100.0%) | 427 (100.0%) |
Physical Housing Characteristics in Rustburg
Housing Structures in Rustburg
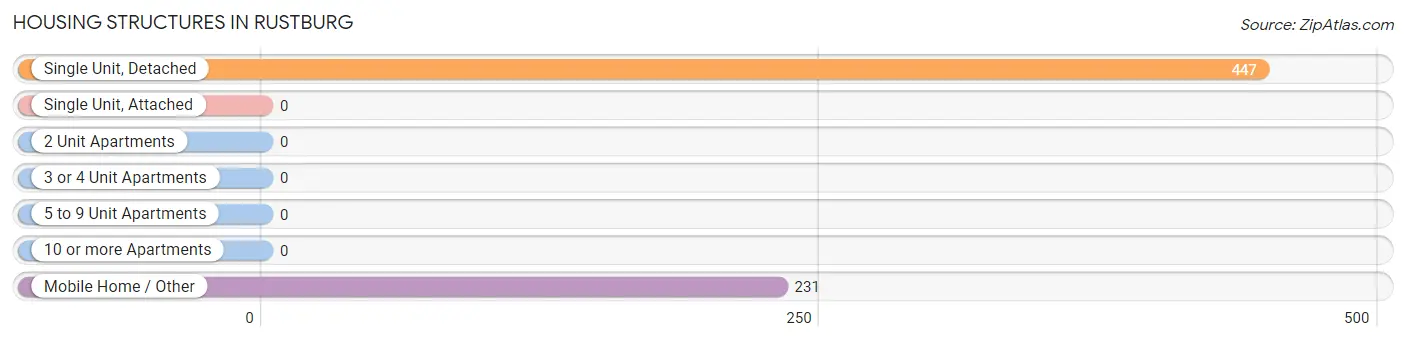
| Structure Type | # Housing Units | % Housing Units |
| Single Unit, Detached | 447 | 65.9% |
| Single Unit, Attached | 0 | 0.0% |
| 2 Unit Apartments | 0 | 0.0% |
| 3 or 4 Unit Apartments | 0 | 0.0% |
| 5 to 9 Unit Apartments | 0 | 0.0% |
| 10 or more Apartments | 0 | 0.0% |
| Mobile Home / Other | 231 | 34.1% |
| Total | 678 | 100.0% |
Housing Structures by Occupancy in Rustburg
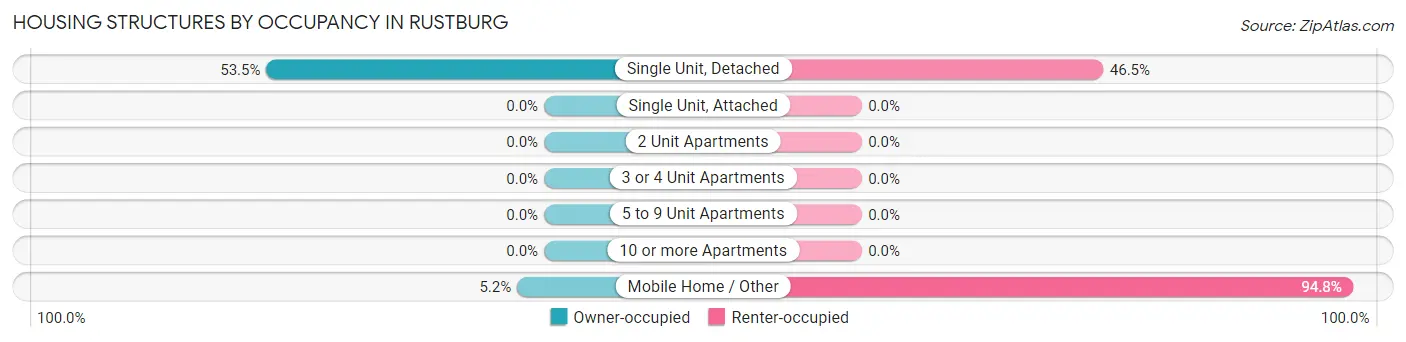
| Structure Type | Owner-occupied | Renter-occupied |
| Single Unit, Detached | 239 (53.5%) | 208 (46.5%) |
| Single Unit, Attached | 0 (0.0%) | 0 (0.0%) |
| 2 Unit Apartments | 0 (0.0%) | 0 (0.0%) |
| 3 or 4 Unit Apartments | 0 (0.0%) | 0 (0.0%) |
| 5 to 9 Unit Apartments | 0 (0.0%) | 0 (0.0%) |
| 10 or more Apartments | 0 (0.0%) | 0 (0.0%) |
| Mobile Home / Other | 12 (5.2%) | 219 (94.8%) |
| Total | 251 (37.0%) | 427 (63.0%) |
Housing Structures by Number of Rooms in Rustburg
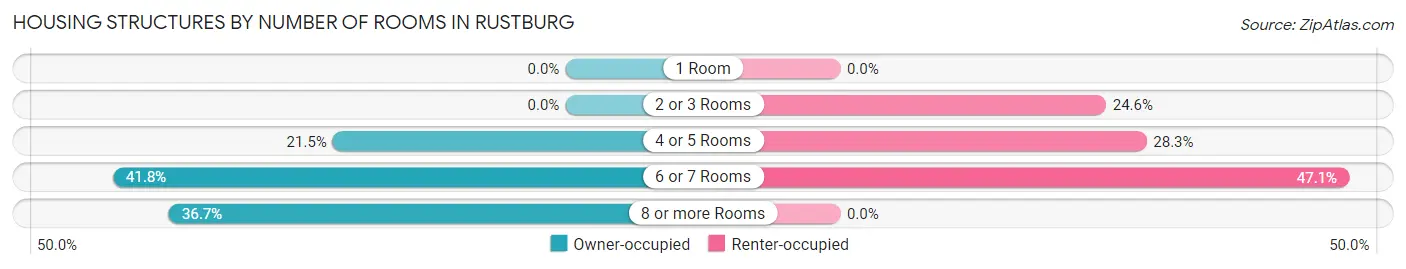
| Number of Rooms | Owner-occupied | Renter-occupied |
| 1 Room | 0 (0.0%) | 0 (0.0%) |
| 2 or 3 Rooms | 0 (0.0%) | 105 (24.6%) |
| 4 or 5 Rooms | 54 (21.5%) | 121 (28.3%) |
| 6 or 7 Rooms | 105 (41.8%) | 201 (47.1%) |
| 8 or more Rooms | 92 (36.6%) | 0 (0.0%) |
| Total | 251 (100.0%) | 427 (100.0%) |
Housing Structure by Heating Type in Rustburg
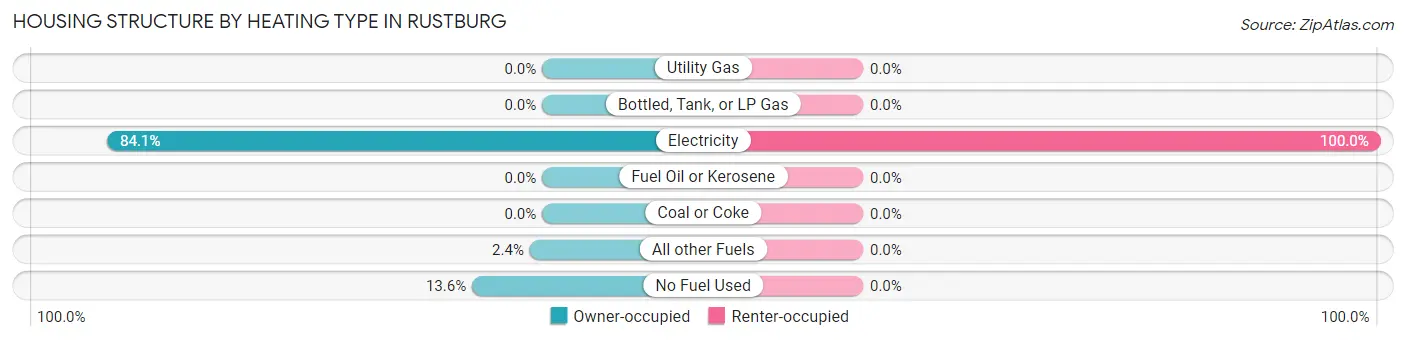
| Heating Type | Owner-occupied | Renter-occupied |
| Utility Gas | 0 (0.0%) | 0 (0.0%) |
| Bottled, Tank, or LP Gas | 0 (0.0%) | 0 (0.0%) |
| Electricity | 211 (84.1%) | 427 (100.0%) |
| Fuel Oil or Kerosene | 0 (0.0%) | 0 (0.0%) |
| Coal or Coke | 0 (0.0%) | 0 (0.0%) |
| All other Fuels | 6 (2.4%) | 0 (0.0%) |
| No Fuel Used | 34 (13.6%) | 0 (0.0%) |
| Total | 251 (100.0%) | 427 (100.0%) |
Household Vehicle Usage in Rustburg
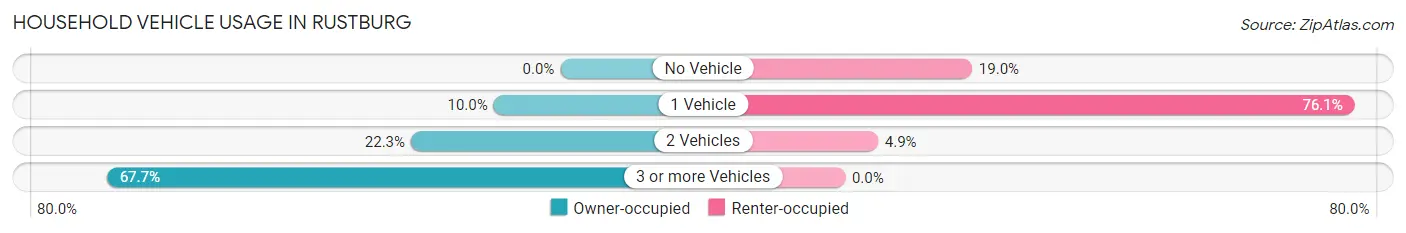
| Vehicles per Household | Owner-occupied | Renter-occupied |
| No Vehicle | 0 (0.0%) | 81 (19.0%) |
| 1 Vehicle | 25 (10.0%) | 325 (76.1%) |
| 2 Vehicles | 56 (22.3%) | 21 (4.9%) |
| 3 or more Vehicles | 170 (67.7%) | 0 (0.0%) |
| Total | 251 (100.0%) | 427 (100.0%) |
Real Estate & Mortgages in Rustburg
Real Estate and Mortgage Overview in Rustburg
| Characteristic | Without Mortgage | With Mortgage |
| Housing Units | 108 | 143 |
| Median Property Value | $140,400 | $335,100 |
| Median Household Income | $85,658 | $32 |
| Monthly Housing Costs | $297 | $0 |
| Real Estate Taxes | $913 | $0 |
Property Value by Mortgage Status in Rustburg
| Property Value | Without Mortgage | With Mortgage |
| Less than $50,000 | 12 (11.1%) | 0 (0.0%) |
| $50,000 to $99,999 | 8 (7.4%) | 34 (23.8%) |
| $100,000 to $299,999 | 71 (65.7%) | 14 (9.8%) |
| $300,000 to $499,999 | 7 (6.5%) | 81 (56.6%) |
| $500,000 to $749,999 | 10 (9.3%) | 14 (9.8%) |
| $750,000 to $999,999 | 0 (0.0%) | 0 (0.0%) |
| $1,000,000 or more | 0 (0.0%) | 0 (0.0%) |
| Total | 108 (100.0%) | 143 (100.0%) |
Household Income by Mortgage Status in Rustburg
| Household Income | Without Mortgage | With Mortgage |
| Less than $10,000 | 0 (0.0%) | 0 (0.0%) |
| $10,000 to $24,999 | 18 (16.7%) | 0 (0.0%) |
| $25,000 to $34,999 | 7 (6.5%) | 0 (0.0%) |
| $35,000 to $49,999 | 8 (7.4%) | 0 (0.0%) |
| $50,000 to $74,999 | 16 (14.8%) | 41 (28.7%) |
| $75,000 to $99,999 | 19 (17.6%) | 14 (9.8%) |
| $100,000 to $149,999 | 12 (11.1%) | 30 (21.0%) |
| $150,000 or more | 28 (25.9%) | 26 (18.2%) |
| Total | 108 (100.0%) | 143 (100.0%) |
Property Value to Household Income Ratio in Rustburg
| Value-to-Income Ratio | Without Mortgage | With Mortgage |
| Less than 2.0x | 49 (45.4%) | 90,966 (63,612.6%) |
| 2.0x to 2.9x | 18 (16.7%) | 19 (13.3%) |
| 3.0x to 3.9x | 0 (0.0%) | 47 (32.9%) |
| 4.0x or more | 41 (38.0%) | 48 (33.6%) |
| Total | 108 (100.0%) | 143 (100.0%) |
Real Estate Taxes by Mortgage Status in Rustburg
| Property Taxes | Without Mortgage | With Mortgage |
| Less than $800 | 37 (34.3%) | 0 (0.0%) |
| $800 to $1,499 | 54 (50.0%) | 34 (23.8%) |
| $800 to $1,499 | 17 (15.7%) | 61 (42.7%) |
| Total | 108 (100.0%) | 143 (100.0%) |
Health & Disability in Rustburg
Health Insurance Coverage by Age in Rustburg
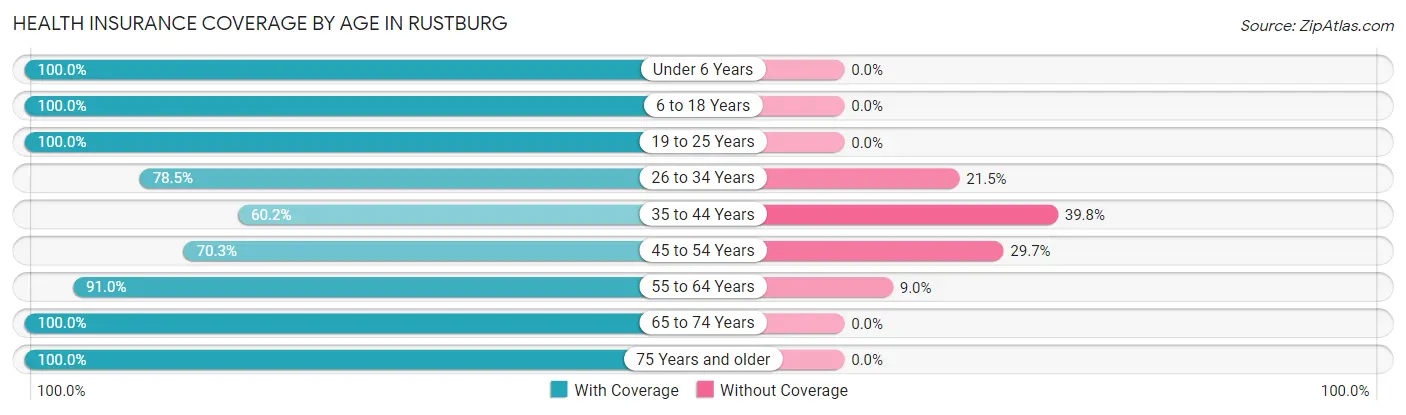
| Age Bracket | With Coverage | Without Coverage |
| Under 6 Years | 117 (100.0%) | 0 (0.0%) |
| 6 to 18 Years | 164 (100.0%) | 0 (0.0%) |
| 19 to 25 Years | 185 (100.0%) | 0 (0.0%) |
| 26 to 34 Years | 150 (78.5%) | 41 (21.5%) |
| 35 to 44 Years | 62 (60.2%) | 41 (39.8%) |
| 45 to 54 Years | 64 (70.3%) | 27 (29.7%) |
| 55 to 64 Years | 352 (91.0%) | 35 (9.0%) |
| 65 to 74 Years | 138 (100.0%) | 0 (0.0%) |
| 75 Years and older | 102 (100.0%) | 0 (0.0%) |
| Total | 1,334 (90.3%) | 144 (9.7%) |
Health Insurance Coverage by Citizenship Status in Rustburg
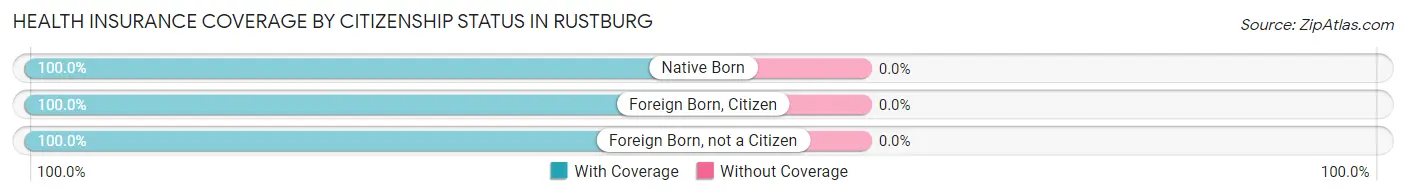
| Citizenship Status | With Coverage | Without Coverage |
| Native Born | 117 (100.0%) | 0 (0.0%) |
| Foreign Born, Citizen | 164 (100.0%) | 0 (0.0%) |
| Foreign Born, not a Citizen | 185 (100.0%) | 0 (0.0%) |
Health Insurance Coverage by Household Income in Rustburg
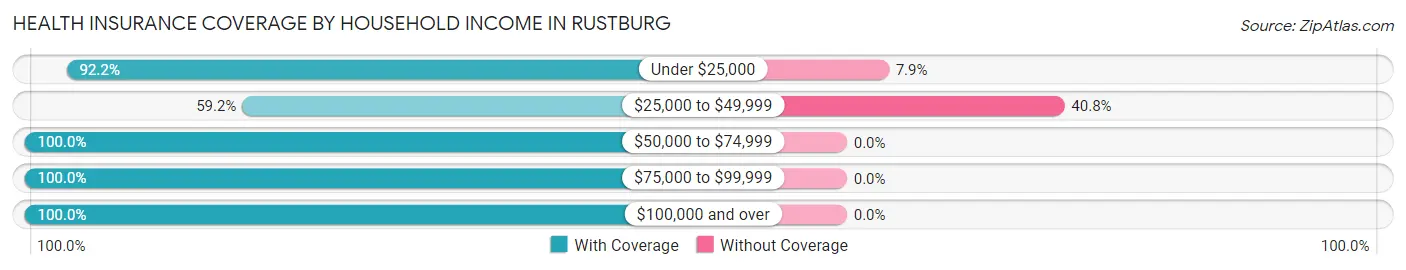
| Household Income | With Coverage | Without Coverage |
| Under $25,000 | 317 (92.1%) | 27 (7.9%) |
| $25,000 to $49,999 | 170 (59.2%) | 117 (40.8%) |
| $50,000 to $74,999 | 342 (100.0%) | 0 (0.0%) |
| $75,000 to $99,999 | 127 (100.0%) | 0 (0.0%) |
| $100,000 and over | 378 (100.0%) | 0 (0.0%) |
Public vs Private Health Insurance Coverage by Age in Rustburg
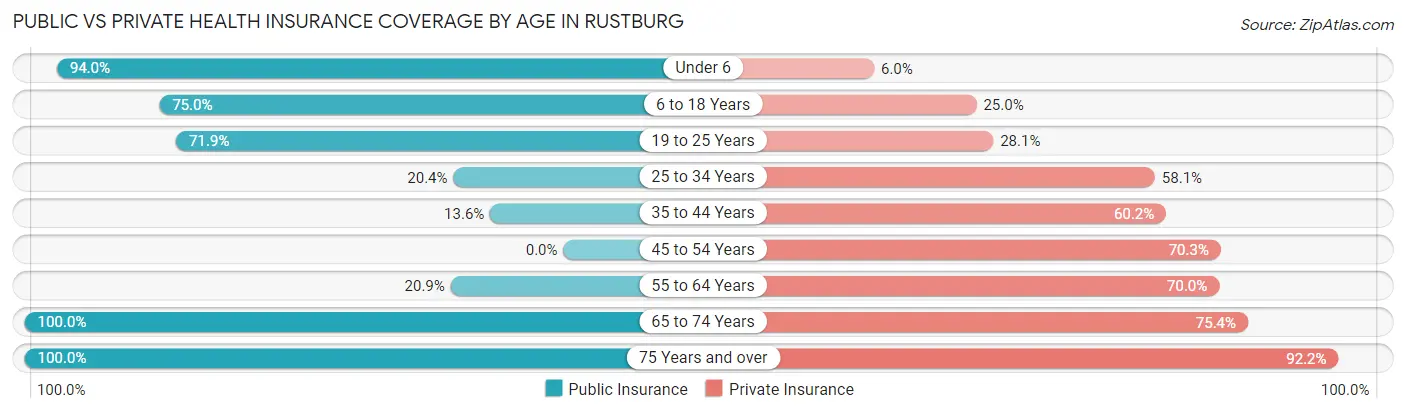
| Age Bracket | Public Insurance | Private Insurance |
| Under 6 | 110 (94.0%) | 7 (6.0%) |
| 6 to 18 Years | 123 (75.0%) | 41 (25.0%) |
| 19 to 25 Years | 133 (71.9%) | 52 (28.1%) |
| 25 to 34 Years | 39 (20.4%) | 111 (58.1%) |
| 35 to 44 Years | 14 (13.6%) | 62 (60.2%) |
| 45 to 54 Years | 0 (0.0%) | 64 (70.3%) |
| 55 to 64 Years | 81 (20.9%) | 271 (70.0%) |
| 65 to 74 Years | 138 (100.0%) | 104 (75.4%) |
| 75 Years and over | 102 (100.0%) | 94 (92.2%) |
| Total | 740 (50.1%) | 806 (54.5%) |
Disability Status by Sex by Age in Rustburg
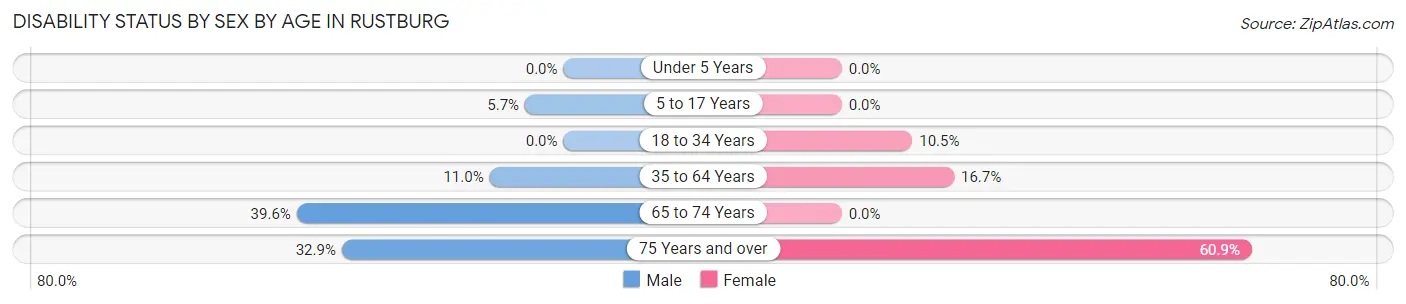
| Age Bracket | Male | Female |
| Under 5 Years | 0 (0.0%) | 0 (0.0%) |
| 5 to 17 Years | 10 (5.7%) | 0 (0.0%) |
| 18 to 34 Years | 0 (0.0%) | 27 (10.5%) |
| 35 to 64 Years | 42 (11.0%) | 33 (16.7%) |
| 65 to 74 Years | 40 (39.6%) | 0 (0.0%) |
| 75 Years and over | 26 (32.9%) | 14 (60.9%) |
Disability Class by Sex by Age in Rustburg
Disability Class: Hearing Difficulty
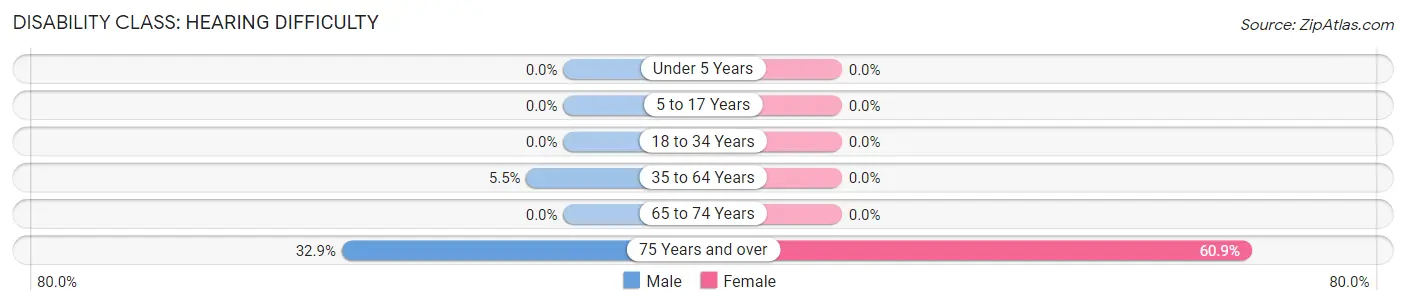
| Age Bracket | Male | Female |
| Under 5 Years | 0 (0.0%) | 0 (0.0%) |
| 5 to 17 Years | 0 (0.0%) | 0 (0.0%) |
| 18 to 34 Years | 0 (0.0%) | 0 (0.0%) |
| 35 to 64 Years | 21 (5.5%) | 0 (0.0%) |
| 65 to 74 Years | 0 (0.0%) | 0 (0.0%) |
| 75 Years and over | 26 (32.9%) | 14 (60.9%) |
Disability Class: Vision Difficulty
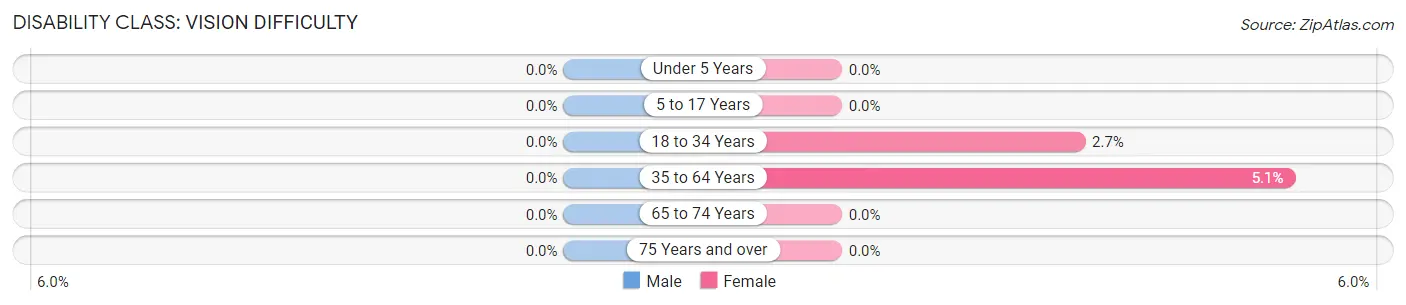
| Age Bracket | Male | Female |
| Under 5 Years | 0 (0.0%) | 0 (0.0%) |
| 5 to 17 Years | 0 (0.0%) | 0 (0.0%) |
| 18 to 34 Years | 0 (0.0%) | 7 (2.7%) |
| 35 to 64 Years | 0 (0.0%) | 10 (5.1%) |
| 65 to 74 Years | 0 (0.0%) | 0 (0.0%) |
| 75 Years and over | 0 (0.0%) | 0 (0.0%) |
Disability Class: Cognitive Difficulty
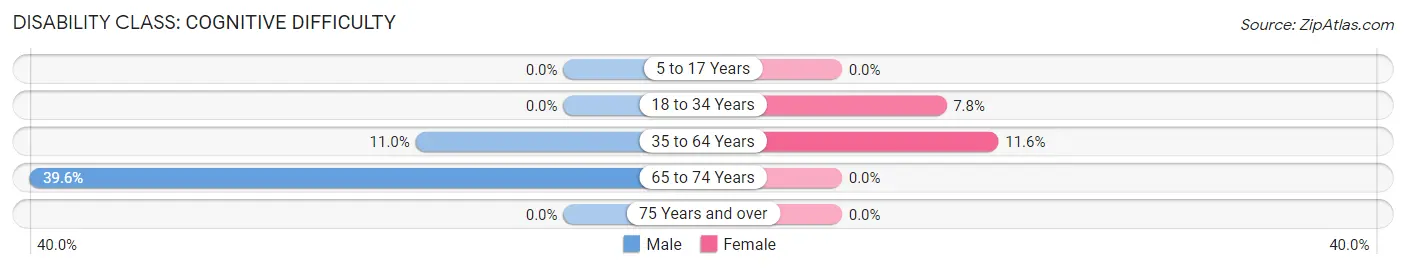
| Age Bracket | Male | Female |
| 5 to 17 Years | 0 (0.0%) | 0 (0.0%) |
| 18 to 34 Years | 0 (0.0%) | 20 (7.7%) |
| 35 to 64 Years | 42 (11.0%) | 23 (11.6%) |
| 65 to 74 Years | 40 (39.6%) | 0 (0.0%) |
| 75 Years and over | 0 (0.0%) | 0 (0.0%) |
Disability Class: Ambulatory Difficulty
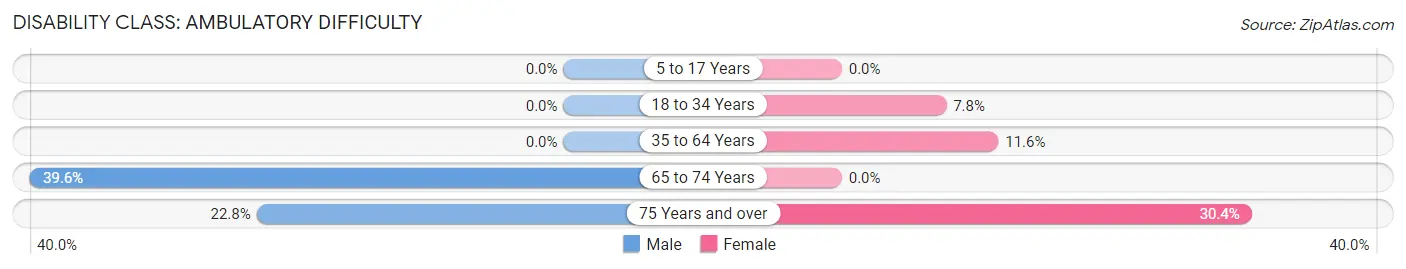
| Age Bracket | Male | Female |
| 5 to 17 Years | 0 (0.0%) | 0 (0.0%) |
| 18 to 34 Years | 0 (0.0%) | 20 (7.7%) |
| 35 to 64 Years | 0 (0.0%) | 23 (11.6%) |
| 65 to 74 Years | 40 (39.6%) | 0 (0.0%) |
| 75 Years and over | 18 (22.8%) | 7 (30.4%) |
Disability Class: Self-Care Difficulty
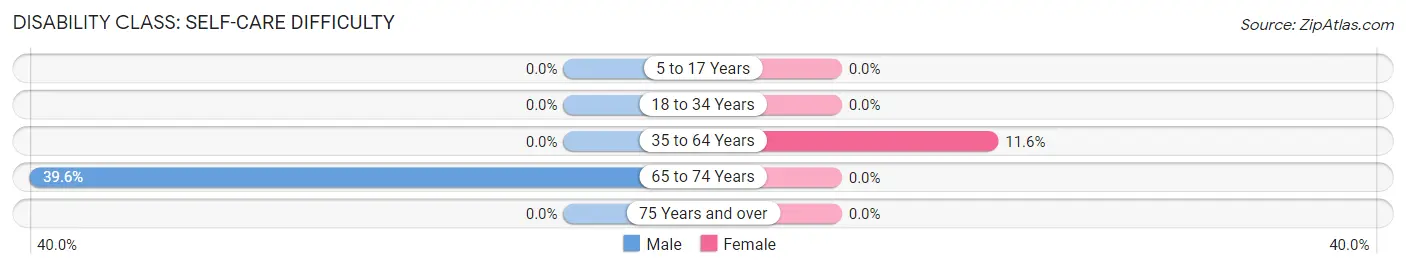
| Age Bracket | Male | Female |
| 5 to 17 Years | 0 (0.0%) | 0 (0.0%) |
| 18 to 34 Years | 0 (0.0%) | 0 (0.0%) |
| 35 to 64 Years | 0 (0.0%) | 23 (11.6%) |
| 65 to 74 Years | 40 (39.6%) | 0 (0.0%) |
| 75 Years and over | 0 (0.0%) | 0 (0.0%) |
Technology Access in Rustburg
Computing Device Access in Rustburg
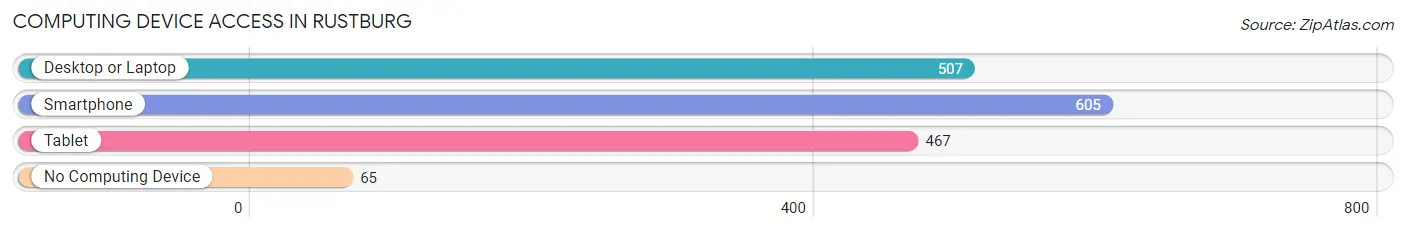
| Device Type | # Households | % Households |
| Desktop or Laptop | 507 | 74.8% |
| Smartphone | 605 | 89.2% |
| Tablet | 467 | 68.9% |
| No Computing Device | 65 | 9.6% |
| Total | 678 | 100.0% |
Internet Access in Rustburg
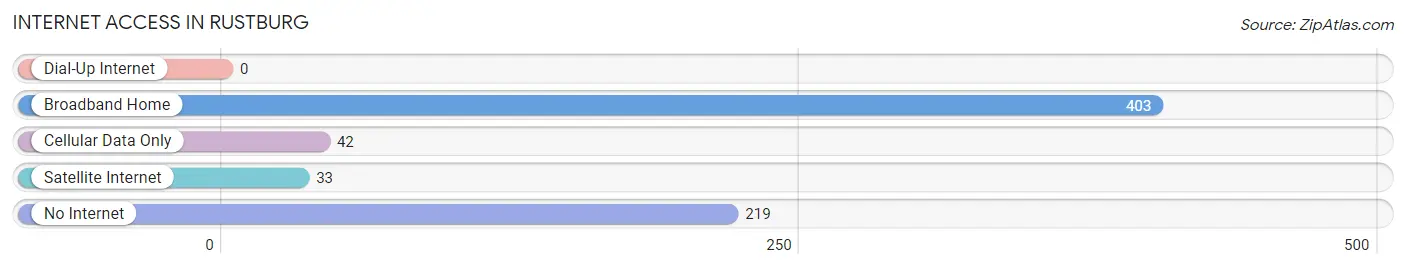
| Internet Type | # Households | % Households |
| Dial-Up Internet | 0 | 0.0% |
| Broadband Home | 403 | 59.4% |
| Cellular Data Only | 42 | 6.2% |
| Satellite Internet | 33 | 4.9% |
| No Internet | 219 | 32.3% |
| Total | 678 | 100.0% |
Rustburg Summary
Rustburg is a small town located in Campbell County, Virginia. It is situated in the foothills of the Blue Ridge Mountains, about 25 miles south of Lynchburg. The town was founded in 1790 and has a population of approximately 1,500 people.
History
The town of Rustburg was founded in 1790 by William Rust, a Revolutionary War veteran. He purchased the land from the Campbell family and named the town after himself. Rustburg was originally a farming community, but it soon became a center for the production of tobacco and other agricultural products. The town was also home to several mills, including a grist mill, a saw mill, and a woolen mill.
In the late 19th century, the town began to experience a period of growth and development. The railroad arrived in 1881, and the town was incorporated in 1883. The railroad brought new businesses and industries to the area, and the town began to grow.
In the early 20th century, Rustburg became a popular tourist destination. The town was home to several resorts, including the Rustburg Inn and the Rustburg Hotel. The town also had a movie theater, a bowling alley, and a golf course.
Geography
Rustburg is located in the foothills of the Blue Ridge Mountains in Campbell County, Virginia. The town is situated on the banks of the James River, and is surrounded by rolling hills and forests. The town is located about 25 miles south of Lynchburg and about 50 miles north of Roanoke.
The climate in Rustburg is mild and temperate. Summers are warm and humid, while winters are cold and snowy. The average annual temperature is around 55 degrees Fahrenheit.
Economy
The economy of Rustburg is largely based on agriculture and tourism. The town is home to several farms, which produce a variety of crops, including corn, soybeans, wheat, and tobacco. The town is also home to several wineries, which produce a variety of wines.
Tourism is an important part of the local economy. The town is home to several resorts, including the Rustburg Inn and the Rustburg Hotel. The town also has a movie theater, a bowling alley, and a golf course.
Demographics
As of the 2010 census, the population of Rustburg was 1,500. The racial makeup of the town was 95.3% White, 2.7% African American, 0.3% Native American, 0.3% Asian, and 1.3% from other races. The median household income was $37,500, and the median family income was $45,000.
Conclusion
Rustburg is a small town located in Campbell County, Virginia. It was founded in 1790 and has a population of approximately 1,500 people. The town is situated in the foothills of the Blue Ridge Mountains and is surrounded by rolling hills and forests. The economy of Rustburg is largely based on agriculture and tourism. The town is home to several farms, wineries, resorts, and other businesses. The racial makeup of the town is predominantly White, with a small percentage of African American, Native American, and Asian residents.
Common Questions
What is Per Capita Income in Rustburg?
Per Capita income in Rustburg is $28,793.
What is the Median Family Income in Rustburg?
Median Family Income in Rustburg is $51,875.
What is the Median Household income in Rustburg?
Median Household Income in Rustburg is $67,612.
What is Income or Wage Gap in Rustburg?
Income or Wage Gap in Rustburg is 35.6%.
Women in Rustburg earn 64.4 cents for every dollar earned by a man.
What is Inequality or Gini Index in Rustburg?
Inequality or Gini Index in Rustburg is 0.43.
What is the Total Population of Rustburg?
Total Population of Rustburg is 1,610.
What is the Total Male Population of Rustburg?
Total Male Population of Rustburg is 1,003.
What is the Total Female Population of Rustburg?
Total Female Population of Rustburg is 607.
What is the Ratio of Males per 100 Females in Rustburg?
There are 165.24 Males per 100 Females in Rustburg.
What is the Ratio of Females per 100 Males in Rustburg?
There are 60.52 Females per 100 Males in Rustburg.
What is the Median Population Age in Rustburg?
Median Population Age in Rustburg is 40.3 Years.
What is the Average Family Size in Rustburg
Average Family Size in Rustburg is 2.9 People.
What is the Average Household Size in Rustburg
Average Household Size in Rustburg is 2.2 People.
How Large is the Labor Force in Rustburg?
There are 804 People in the Labor Forcein in Rustburg.
What is the Percentage of People in the Labor Force in Rustburg?
59.5% of People are in the Labor Force in Rustburg.
What is the Unemployment Rate in Rustburg?
Unemployment Rate in Rustburg is 9.8%.