Gwynn, VA Map & Demographics
Gwynn Map
Gwynn Overview
$45,863
PER CAPITA INCOME
$89,028
AVG FAMILY INCOME
$89,009
AVG HOUSEHOLD INCOME
42.2%
WAGE / INCOME GAP [ % ]
57.8¢/ $1
WAGE / INCOME GAP [ $ ]
0.26
INEQUALITY / GINI INDEX
639
TOTAL POPULATION
296
MALE POPULATION
343
FEMALE POPULATION
86.30
MALES / 100 FEMALES
115.88
FEMALES / 100 MALES
52.6
MEDIAN AGE
2.9
AVG FAMILY SIZE
2.1
AVG HOUSEHOLD SIZE
293
LABOR FORCE [ PEOPLE ]
45.9%
PERCENT IN LABOR FORCE
Gwynn Zip Codes
Gwynn Area Codes
Income in Gwynn
Income Overview in Gwynn
Per Capita Income in Gwynn is $45,863, while median incomes of families and households are $89,028 and $89,009 respectively.
| Characteristic | Number | Measure |
| Per Capita Income | 639 | $45,863 |
| Median Family Income | 173 | $89,028 |
| Mean Family Income | 173 | $106,275 |
| Median Household Income | 310 | $89,009 |
| Mean Household Income | 310 | $93,373 |
| Income Deficit | 173 | $0 |
| Wage / Income Gap (%) | 639 | 42.23% |
| Wage / Income Gap ($) | 639 | 57.77¢ per $1 |
| Gini / Inequality Index | 639 | 0.26 |
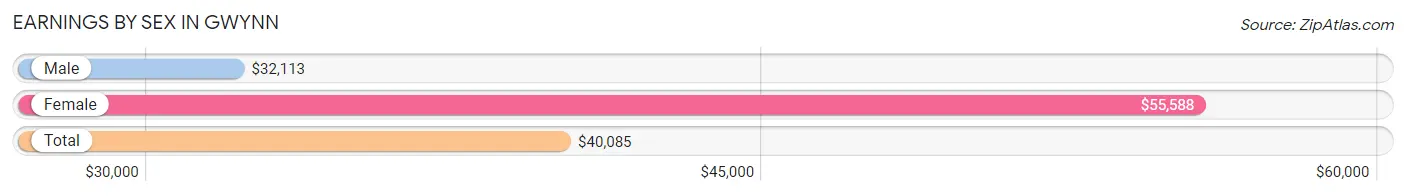
Earnings by Sex in Gwynn
Average Earnings in Gwynn are $40,085, $32,113 for men and $55,588 for women, a difference of 42.2%.
| Sex | Number | Average Earnings |
| Male | 199 (59.1%) | $32,113 |
| Female | 138 (40.9%) | $55,588 |
| Total | 337 (100.0%) | $40,085 |
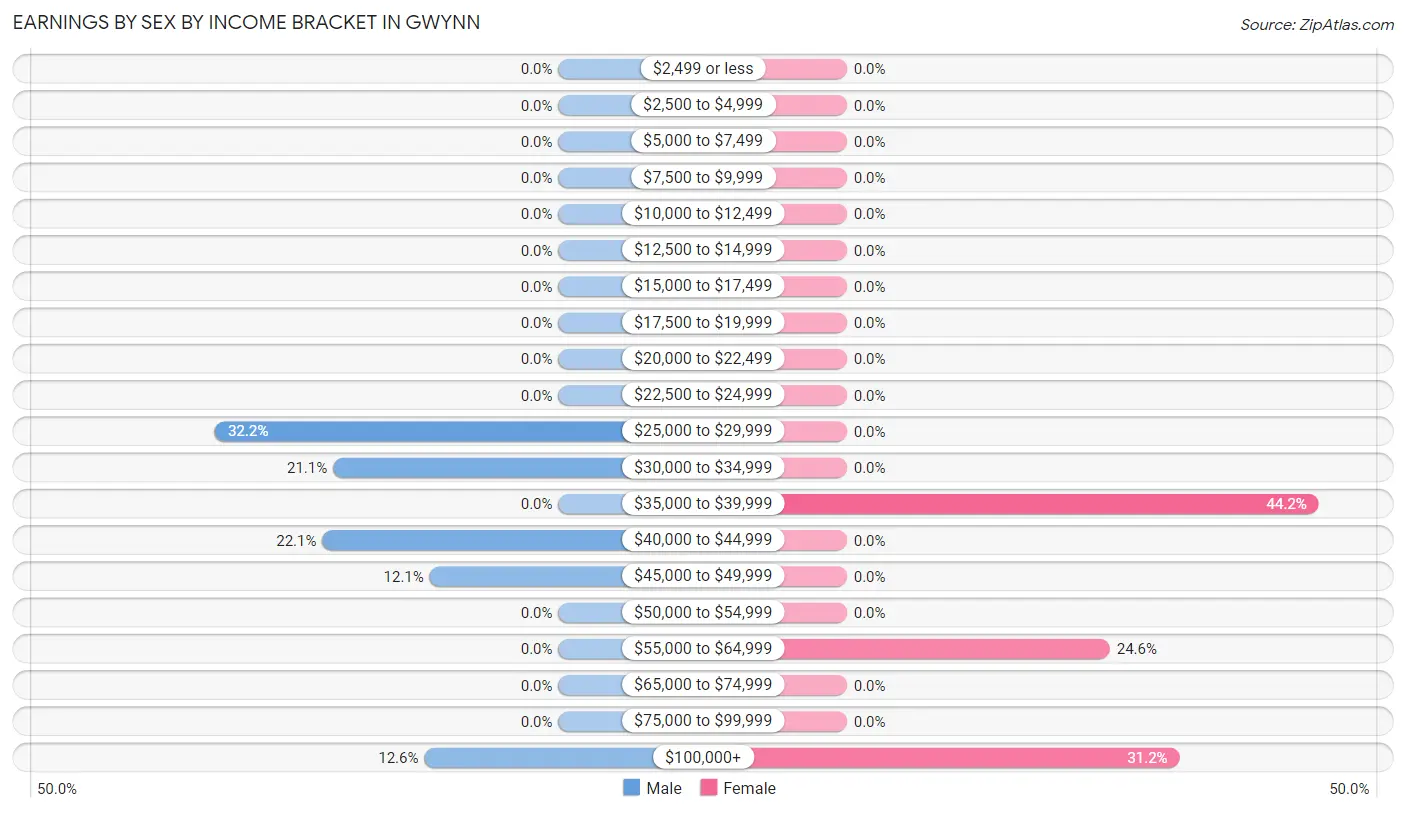
Earnings by Sex by Income Bracket in Gwynn
The most common earnings brackets in Gwynn are $25,000 to $29,999 for men (64 | 32.2%) and $35,000 to $39,999 for women (61 | 44.2%).
| Income | Male | Female |
| $2,499 or less | 0 (0.0%) | 0 (0.0%) |
| $2,500 to $4,999 | 0 (0.0%) | 0 (0.0%) |
| $5,000 to $7,499 | 0 (0.0%) | 0 (0.0%) |
| $7,500 to $9,999 | 0 (0.0%) | 0 (0.0%) |
| $10,000 to $12,499 | 0 (0.0%) | 0 (0.0%) |
| $12,500 to $14,999 | 0 (0.0%) | 0 (0.0%) |
| $15,000 to $17,499 | 0 (0.0%) | 0 (0.0%) |
| $17,500 to $19,999 | 0 (0.0%) | 0 (0.0%) |
| $20,000 to $22,499 | 0 (0.0%) | 0 (0.0%) |
| $22,500 to $24,999 | 0 (0.0%) | 0 (0.0%) |
| $25,000 to $29,999 | 64 (32.2%) | 0 (0.0%) |
| $30,000 to $34,999 | 42 (21.1%) | 0 (0.0%) |
| $35,000 to $39,999 | 0 (0.0%) | 61 (44.2%) |
| $40,000 to $44,999 | 44 (22.1%) | 0 (0.0%) |
| $45,000 to $49,999 | 24 (12.1%) | 0 (0.0%) |
| $50,000 to $54,999 | 0 (0.0%) | 0 (0.0%) |
| $55,000 to $64,999 | 0 (0.0%) | 34 (24.6%) |
| $65,000 to $74,999 | 0 (0.0%) | 0 (0.0%) |
| $75,000 to $99,999 | 0 (0.0%) | 0 (0.0%) |
| $100,000+ | 25 (12.6%) | 43 (31.2%) |
| Total | 199 (100.0%) | 138 (100.0%) |
Earnings by Sex by Educational Attainment in Gwynn
| Educational Attainment | Male Income | Female Income |
| Less than High School | - | - |
| High School Diploma | - | - |
| College or Associate's Degree | - | - |
| Bachelor's Degree | - | - |
| Graduate Degree | - | - |
| Total | $32,113 | $55,588 |
Family Income in Gwynn
Family Income Brackets in Gwynn
According to the Gwynn family income data, there are 106 families falling into the $75,000 to $99,999 income range, which is the most common income bracket and makes up 61.3% of all families.
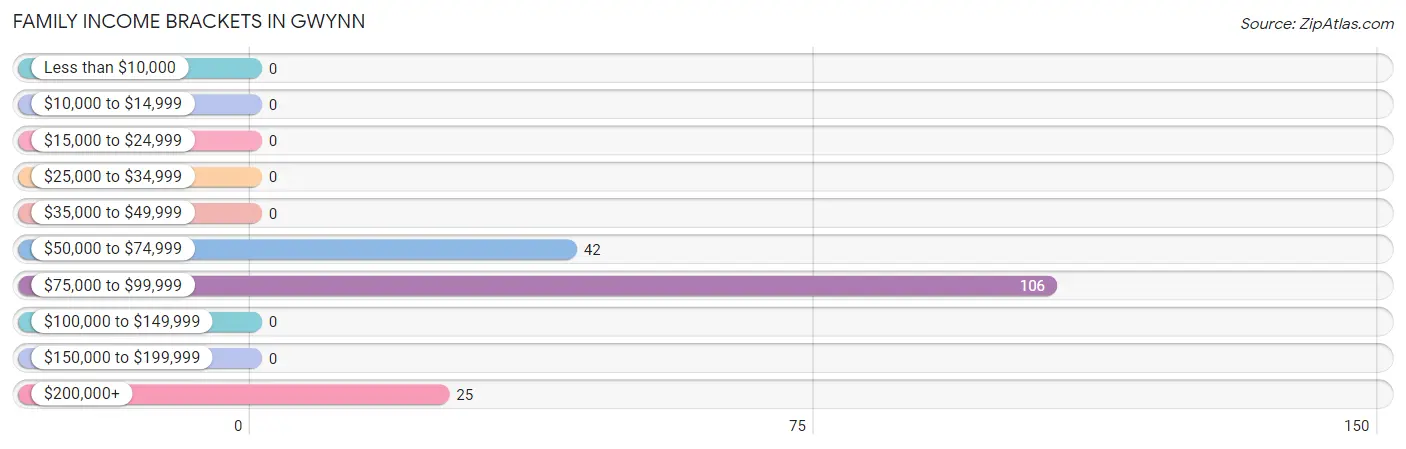
| Income Bracket | # Families | % Families |
| Less than $10,000 | 0 | 0.0% |
| $10,000 to $14,999 | 0 | 0.0% |
| $15,000 to $24,999 | 0 | 0.0% |
| $25,000 to $34,999 | 0 | 0.0% |
| $35,000 to $49,999 | 0 | 0.0% |
| $50,000 to $74,999 | 42 | 24.3% |
| $75,000 to $99,999 | 106 | 61.3% |
| $100,000 to $149,999 | 0 | 0.0% |
| $150,000 to $199,999 | 0 | 0.0% |
| $200,000+ | 25 | 14.5% |
Family Income by Famaliy Size in Gwynn
2-person families (131 | 75.7%) account for the highest median family income in Gwynn with $97,699 per family, while 2-person families (131 | 75.7%) have the highest median income of $48,850 per family member.
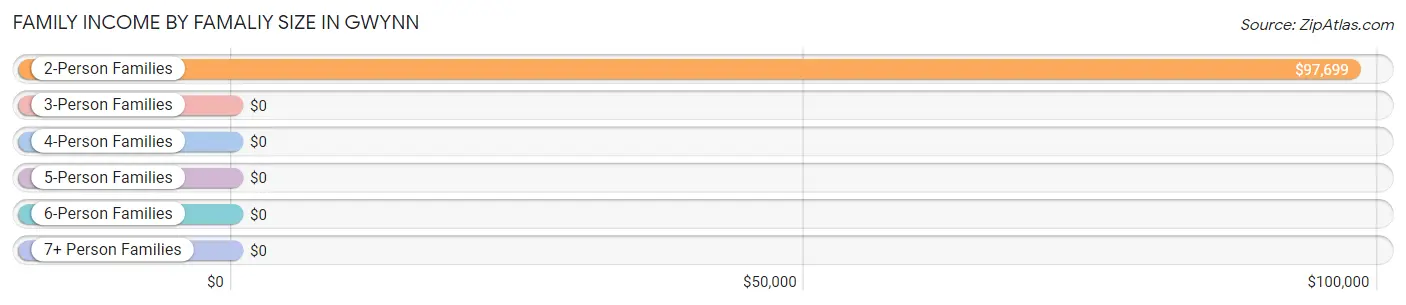
| Income Bracket | # Families | Median Income |
| 2-Person Families | 131 (75.7%) | $97,699 |
| 3-Person Families | 42 (24.3%) | $0 |
| 4-Person Families | 0 (0.0%) | $0 |
| 5-Person Families | 0 (0.0%) | $0 |
| 6-Person Families | 0 (0.0%) | $0 |
| 7+ Person Families | 0 (0.0%) | $0 |
| Total | 173 (100.0%) | $89,028 |
Family Income by Number of Earners in Gwynn
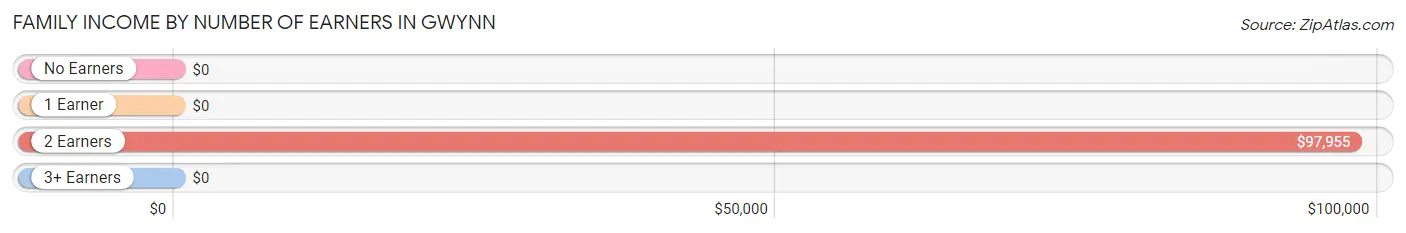
| Number of Earners | # Families | Median Income |
| No Earners | 51 (29.5%) | $0 |
| 1 Earner | 0 (0.0%) | $0 |
| 2 Earners | 122 (70.5%) | $97,955 |
| 3+ Earners | 0 (0.0%) | $0 |
| Total | 173 (100.0%) | $89,028 |
Household Income in Gwynn
Household Income Brackets in Gwynn
With 114 households falling in the category, the $75,000 to $99,999 income range is the most frequent in Gwynn, accounting for 36.8% of all households.
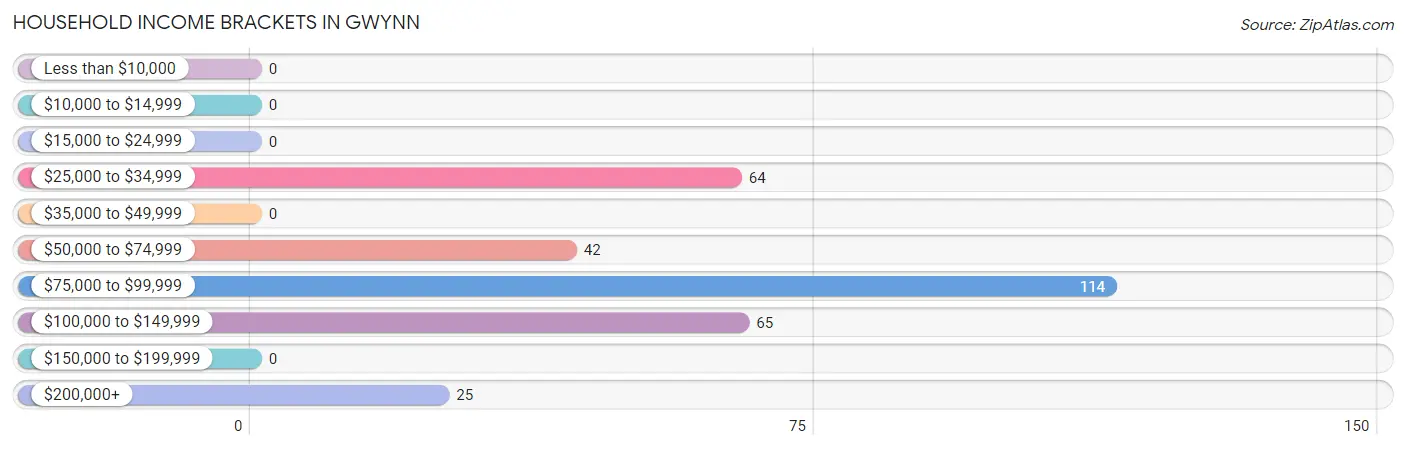
| Income Bracket | # Households | % Households |
| Less than $10,000 | 0 | 0.0% |
| $10,000 to $14,999 | 0 | 0.0% |
| $15,000 to $24,999 | 0 | 0.0% |
| $25,000 to $34,999 | 64 | 20.6% |
| $35,000 to $49,999 | 0 | 0.0% |
| $50,000 to $74,999 | 42 | 13.5% |
| $75,000 to $99,999 | 114 | 36.8% |
| $100,000 to $149,999 | 65 | 21.0% |
| $150,000 to $199,999 | 0 | 0.0% |
| $200,000+ | 25 | 8.1% |
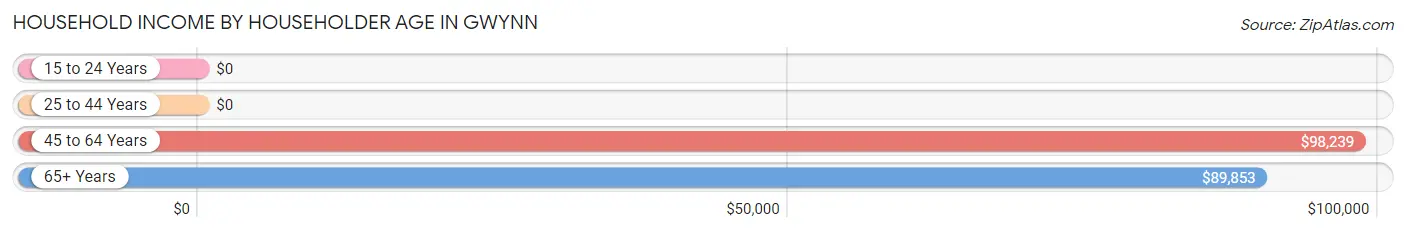
Household Income by Householder Age in Gwynn
The median household income in Gwynn is $89,009, with the highest median household income of $98,239 found in the 45 to 64 years age bracket for the primary householder. A total of 148 households (47.7%) fall into this category.
| Income Bracket | # Households | Median Income |
| 15 to 24 Years | 0 (0.0%) | $0 |
| 25 to 44 Years | 64 (20.6%) | $0 |
| 45 to 64 Years | 148 (47.7%) | $98,239 |
| 65+ Years | 98 (31.6%) | $89,853 |
| Total | 310 (100.0%) | $89,009 |
Poverty in Gwynn
Income Below Poverty by Sex and Age in Gwynn
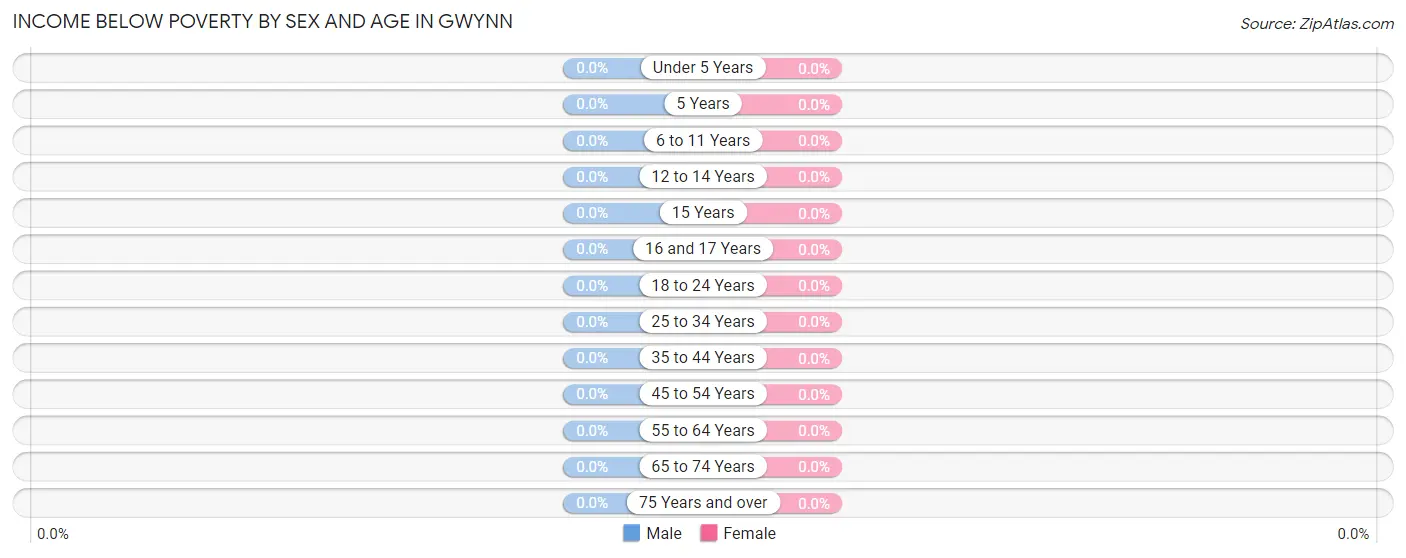
| Age Bracket | Male | Female |
| Under 5 Years | 0 (0.0%) | 0 (0.0%) |
| 5 Years | 0 (0.0%) | 0 (0.0%) |
| 6 to 11 Years | 0 (0.0%) | 0 (0.0%) |
| 12 to 14 Years | 0 (0.0%) | 0 (0.0%) |
| 15 Years | 0 (0.0%) | 0 (0.0%) |
| 16 and 17 Years | 0 (0.0%) | 0 (0.0%) |
| 18 to 24 Years | 0 (0.0%) | 0 (0.0%) |
| 25 to 34 Years | 0 (0.0%) | 0 (0.0%) |
| 35 to 44 Years | 0 (0.0%) | 0 (0.0%) |
| 45 to 54 Years | 0 (0.0%) | 0 (0.0%) |
| 55 to 64 Years | 0 (0.0%) | 0 (0.0%) |
| 65 to 74 Years | 0 (0.0%) | 0 (0.0%) |
| 75 Years and over | 0 (0.0%) | 0 (0.0%) |
| Total | 0 (0.0%) | 0 (0.0%) |
Income Above Poverty by Sex and Age in Gwynn
According to the poverty statistics in Gwynn, males aged 35 to 44 years and females aged 18 to 24 years are the age groups that are most secure financially, with 100.0% of males and 100.0% of females in these age groups living above the poverty line.
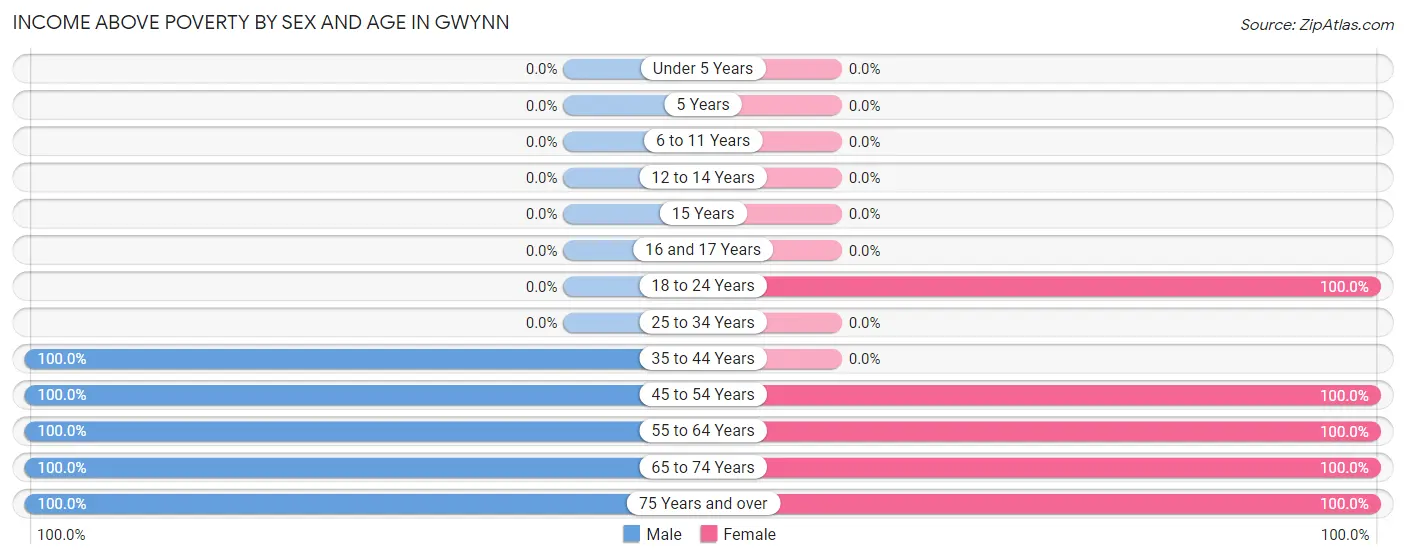
| Age Bracket | Male | Female |
| Under 5 Years | 0 (0.0%) | 0 (0.0%) |
| 5 Years | 0 (0.0%) | 0 (0.0%) |
| 6 to 11 Years | 0 (0.0%) | 0 (0.0%) |
| 12 to 14 Years | 0 (0.0%) | 0 (0.0%) |
| 15 Years | 0 (0.0%) | 0 (0.0%) |
| 16 and 17 Years | 0 (0.0%) | 0 (0.0%) |
| 18 to 24 Years | 0 (0.0%) | 141 (100.0%) |
| 25 to 34 Years | 0 (0.0%) | 0 (0.0%) |
| 35 to 44 Years | 64 (100.0%) | 0 (0.0%) |
| 45 to 54 Years | 91 (100.0%) | 79 (100.0%) |
| 55 to 64 Years | 44 (100.0%) | 67 (100.0%) |
| 65 to 74 Years | 63 (100.0%) | 17 (100.0%) |
| 75 Years and over | 34 (100.0%) | 39 (100.0%) |
| Total | 296 (100.0%) | 343 (100.0%) |
Income Below Poverty Among Married-Couple Families in Gwynn
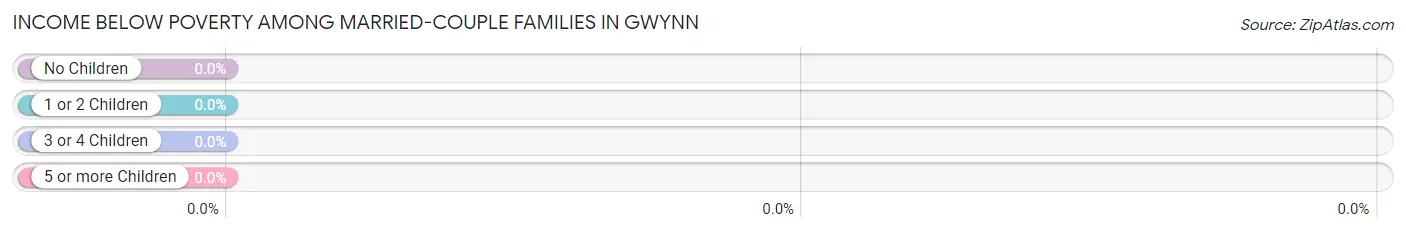
| Children | Above Poverty | Below Poverty |
| No Children | 173 (100.0%) | 0 (0.0%) |
| 1 or 2 Children | 0 (0.0%) | 0 (0.0%) |
| 3 or 4 Children | 0 (0.0%) | 0 (0.0%) |
| 5 or more Children | 0 (0.0%) | 0 (0.0%) |
| Total | 173 (100.0%) | 0 (0.0%) |
Income Below Poverty Among Single-Parent Households in Gwynn
| Children | Single Father | Single Mother |
| No Children | 0 (0.0%) | 0 (0.0%) |
| 1 or 2 Children | 0 (0.0%) | 0 (0.0%) |
| 3 or 4 Children | 0 (0.0%) | 0 (0.0%) |
| 5 or more Children | 0 (0.0%) | 0 (0.0%) |
| Total | 0 (0.0%) | 0 (0.0%) |
Income Below Poverty Among Married-Couple vs Single-Parent Households in Gwynn
| Children | Married-Couple Families | Single-Parent Households |
| No Children | 0 (0.0%) | 0 (0.0%) |
| 1 or 2 Children | 0 (0.0%) | 0 (0.0%) |
| 3 or 4 Children | 0 (0.0%) | 0 (0.0%) |
| 5 or more Children | 0 (0.0%) | 0 (0.0%) |
| Total | 0 (0.0%) | 0 (0.0%) |
Race in Gwynn
The most populous races in Gwynn are White / Caucasian (604 | 94.5%), and Two or more Races (35 | 5.5%).
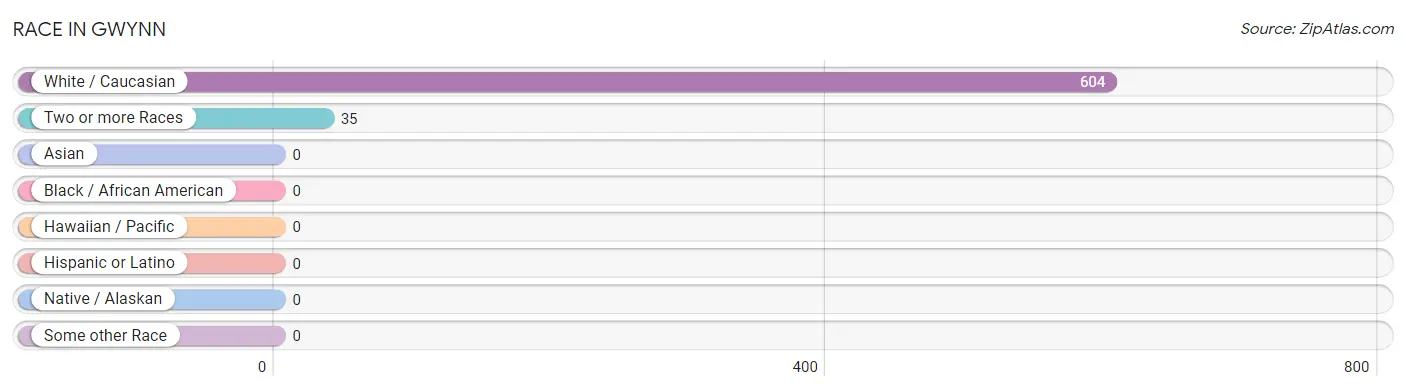
| Race | # Population | % Population |
| Asian | 0 | 0.0% |
| Black / African American | 0 | 0.0% |
| Hawaiian / Pacific | 0 | 0.0% |
| Hispanic or Latino | 0 | 0.0% |
| Native / Alaskan | 0 | 0.0% |
| White / Caucasian | 604 | 94.5% |
| Two or more Races | 35 | 5.5% |
| Some other Race | 0 | 0.0% |
| Total | 639 | 100.0% |
Ancestry in Gwynn
The most populous ancestries reported in Gwynn are American (141 | 22.1%), German (106 | 16.6%), Irish (94 | 14.7%), English (93 | 14.5%), and Polish (64 | 10.0%), together accounting for 77.9% of all Gwynn residents.
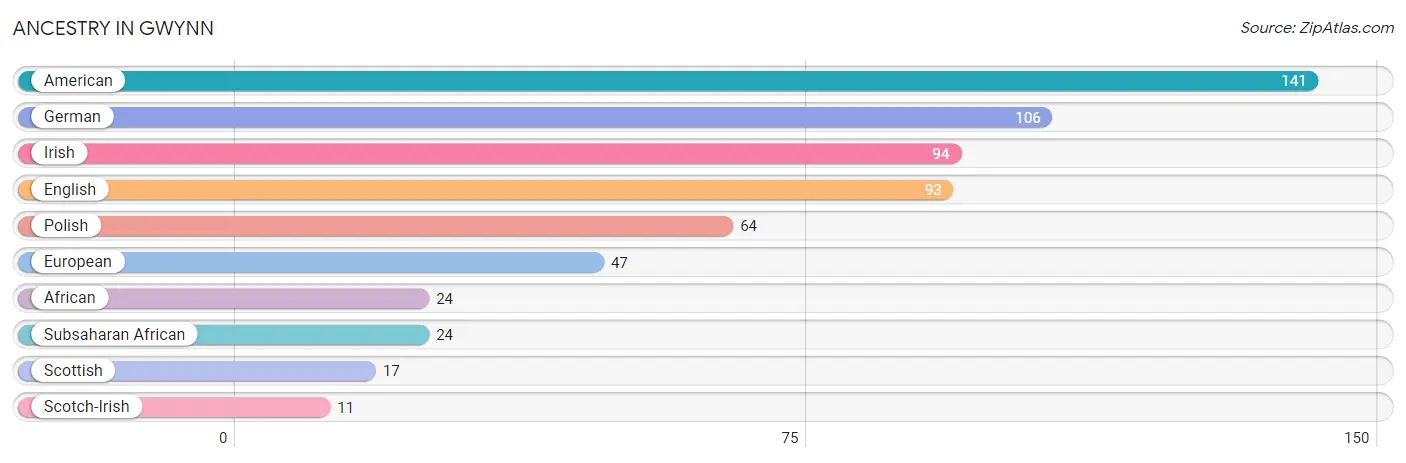
| Ancestry | # Population | % Population |
| African | 24 | 3.8% |
| American | 141 | 22.1% |
| English | 93 | 14.5% |
| European | 47 | 7.4% |
| German | 106 | 16.6% |
| Irish | 94 | 14.7% |
| Polish | 64 | 10.0% |
| Scotch-Irish | 11 | 1.7% |
| Scottish | 17 | 2.7% |
| Subsaharan African | 24 | 3.8% | View All 10 Rows |
Immigrants in Gwynn

| Immigration Origin | # Population | % Population | View All 0 Rows |
Sex and Age in Gwynn
Sex and Age in Gwynn
The most populous age groups in Gwynn are 50 to 54 Years (91 | 30.7%) for men and 20 to 24 Years (141 | 41.1%) for women.
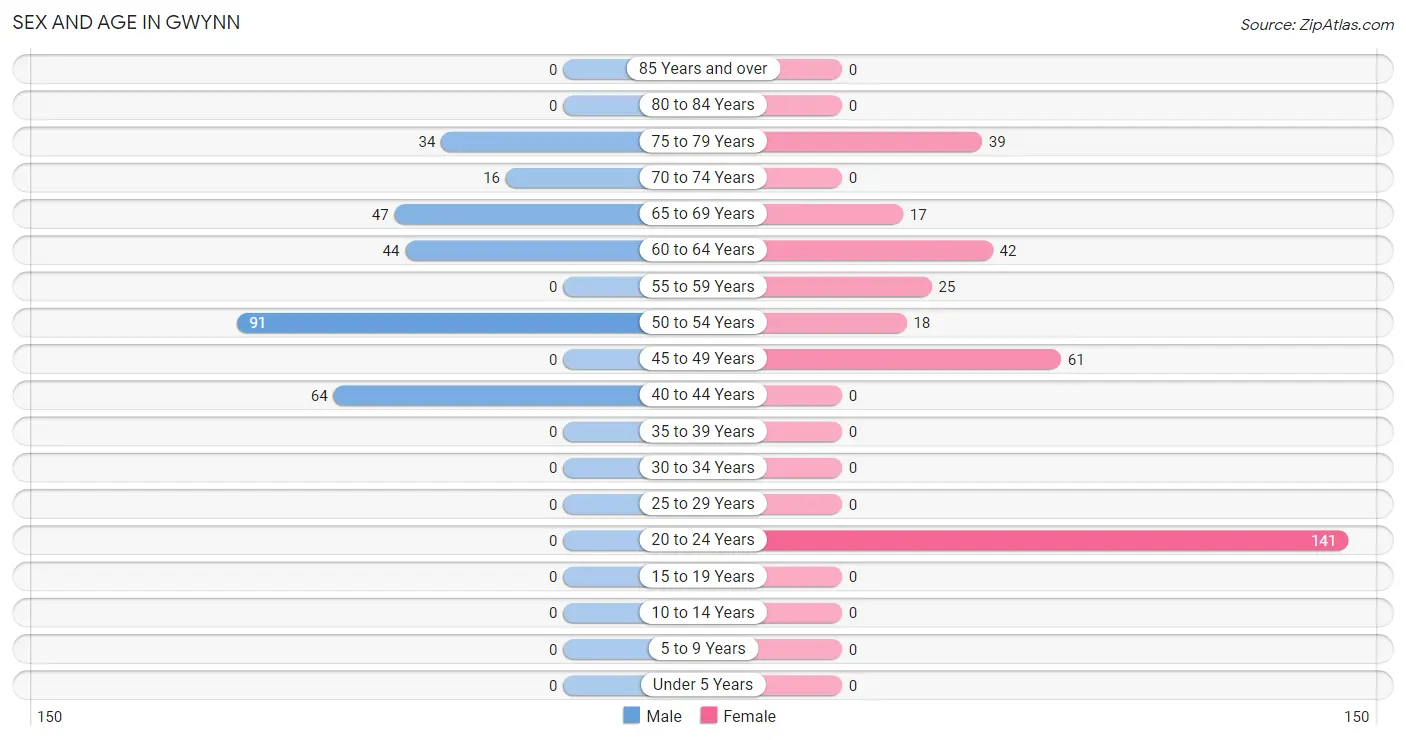
| Age Bracket | Male | Female |
| Under 5 Years | 0 (0.0%) | 0 (0.0%) |
| 5 to 9 Years | 0 (0.0%) | 0 (0.0%) |
| 10 to 14 Years | 0 (0.0%) | 0 (0.0%) |
| 15 to 19 Years | 0 (0.0%) | 0 (0.0%) |
| 20 to 24 Years | 0 (0.0%) | 141 (41.1%) |
| 25 to 29 Years | 0 (0.0%) | 0 (0.0%) |
| 30 to 34 Years | 0 (0.0%) | 0 (0.0%) |
| 35 to 39 Years | 0 (0.0%) | 0 (0.0%) |
| 40 to 44 Years | 64 (21.6%) | 0 (0.0%) |
| 45 to 49 Years | 0 (0.0%) | 61 (17.8%) |
| 50 to 54 Years | 91 (30.7%) | 18 (5.2%) |
| 55 to 59 Years | 0 (0.0%) | 25 (7.3%) |
| 60 to 64 Years | 44 (14.9%) | 42 (12.2%) |
| 65 to 69 Years | 47 (15.9%) | 17 (5.0%) |
| 70 to 74 Years | 16 (5.4%) | 0 (0.0%) |
| 75 to 79 Years | 34 (11.5%) | 39 (11.4%) |
| 80 to 84 Years | 0 (0.0%) | 0 (0.0%) |
| 85 Years and over | 0 (0.0%) | 0 (0.0%) |
| Total | 296 (100.0%) | 343 (100.0%) |
Families and Households in Gwynn
Median Family Size in Gwynn
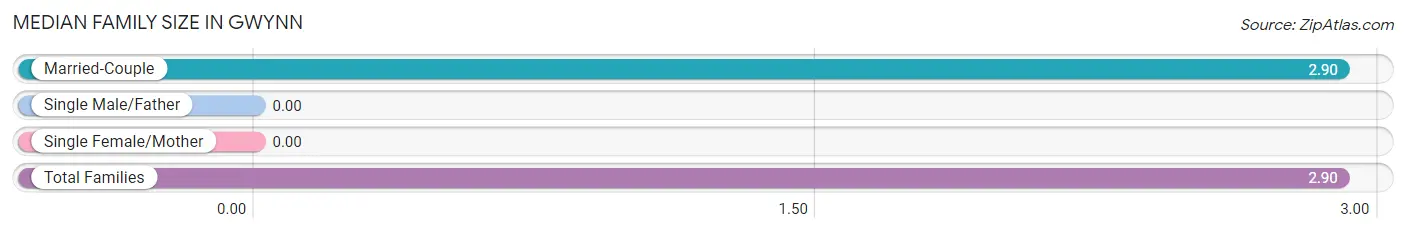
| Family Type | # Families | Family Size |
| Married-Couple | 173 (100.0%) | 2.90 |
| Single Male/Father | 0 (0.0%) | - |
| Single Female/Mother | 0 (0.0%) | - |
| Total Families | 173 (100.0%) | 2.90 |
Median Household Size in Gwynn
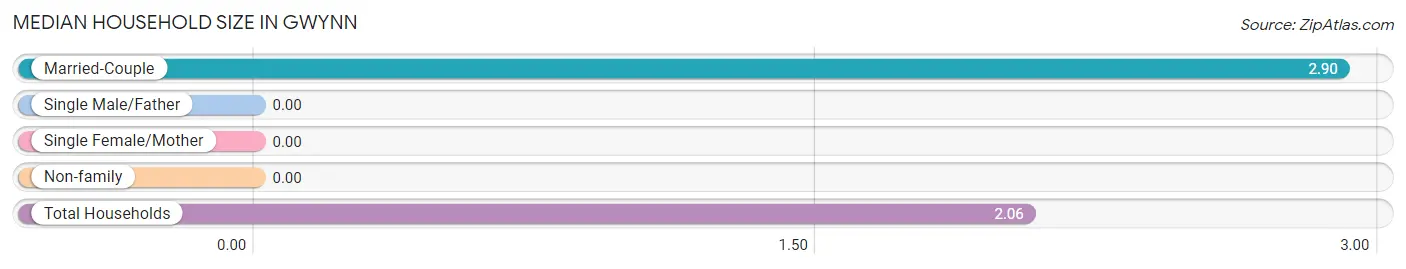
| Household Type | # Households | Household Size |
| Married-Couple | 173 (55.8%) | 2.90 |
| Single Male/Father | 0 (0.0%) | - |
| Single Female/Mother | 0 (0.0%) | - |
| Non-family | 137 (44.2%) | - |
| Total Households | 310 (100.0%) | 2.06 |
Household Size by Marriage Status in Gwynn
Out of a total of 310 households in Gwynn, 173 (55.8%) are family households, while 137 (44.2%) are nonfamily households. The most numerous type of family households are 2-person households, comprising 131, and the most common type of nonfamily households are 1-person households, comprising 137.
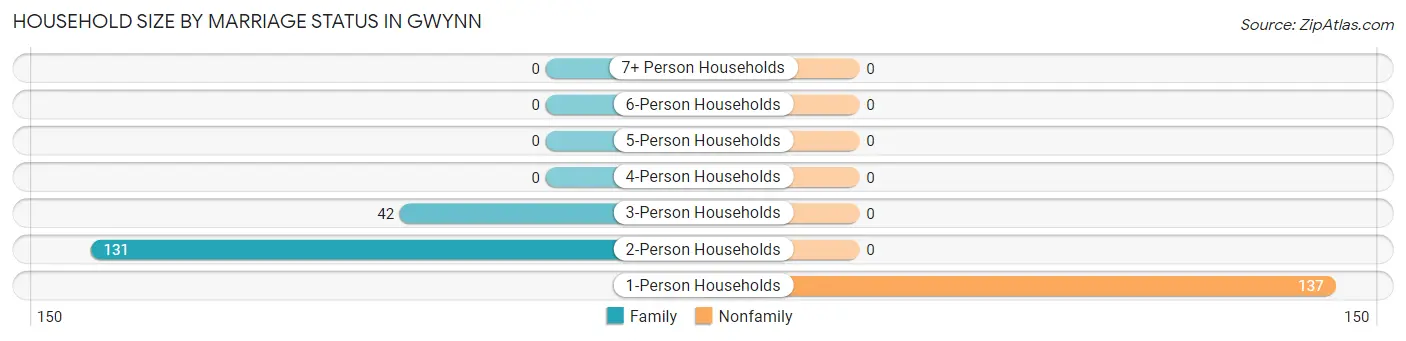
| Household Size | Family Households | Nonfamily Households |
| 1-Person Households | - | 137 (44.2%) |
| 2-Person Households | 131 (42.3%) | 0 (0.0%) |
| 3-Person Households | 42 (13.6%) | 0 (0.0%) |
| 4-Person Households | 0 (0.0%) | 0 (0.0%) |
| 5-Person Households | 0 (0.0%) | 0 (0.0%) |
| 6-Person Households | 0 (0.0%) | 0 (0.0%) |
| 7+ Person Households | 0 (0.0%) | 0 (0.0%) |
| Total | 173 (55.8%) | 137 (44.2%) |
Female Fertility in Gwynn
Fertility by Age in Gwynn
| Age Bracket | Women with Births | Births / 1,000 Women |
| 15 to 19 years | 0 (0.0%) | 0.0 |
| 20 to 34 years | 0 (0.0%) | 0.0 |
| 35 to 50 years | 0 (0.0%) | 0.0 |
| Total | 0 (0.0%) | 0.0 |
Fertility by Age by Marriage Status in Gwynn
| Age Bracket | Married | Unmarried |
| 15 to 19 years | 0 (0.0%) | 0 (0.0%) |
| 20 to 34 years | 0 (0.0%) | 0 (0.0%) |
| 35 to 50 years | 0 (0.0%) | 0 (0.0%) |
| Total | 0 (0.0%) | 0 (0.0%) |
Fertility by Education in Gwynn
| Educational Attainment | Women with Births | Births / 1,000 Women |
| Less than High School | 0 (0.0%) | 0.0 |
| High School Diploma | 0 (0.0%) | 0.0 |
| College or Associate's Degree | 0 (0.0%) | 0.0 |
| Bachelor's Degree | 0 (0.0%) | 0.0 |
| Graduate Degree | 0 (0.0%) | 0.0 |
| Total | 0 (0.0%) | 0.0 |
Fertility by Education by Marriage Status in Gwynn
| Educational Attainment | Married | Unmarried |
| Less than High School | 0 (0.0%) | 0 (0.0%) |
| High School Diploma | 0 (0.0%) | 0 (0.0%) |
| College or Associate's Degree | 0 (0.0%) | 0 (0.0%) |
| Bachelor's Degree | 0 (0.0%) | 0 (0.0%) |
| Graduate Degree | 0 (0.0%) | 0 (0.0%) |
| Total | 0 (0.0%) | 0 (0.0%) |
Employment Characteristics in Gwynn
Employment by Class of Employer in Gwynn
Among the 293 employed individuals in Gwynn, self-employed (not incorporated) (106 | 36.2%), private company employees (99 | 33.8%), and local government employees (59 | 20.1%) make up the most common classes of employment.
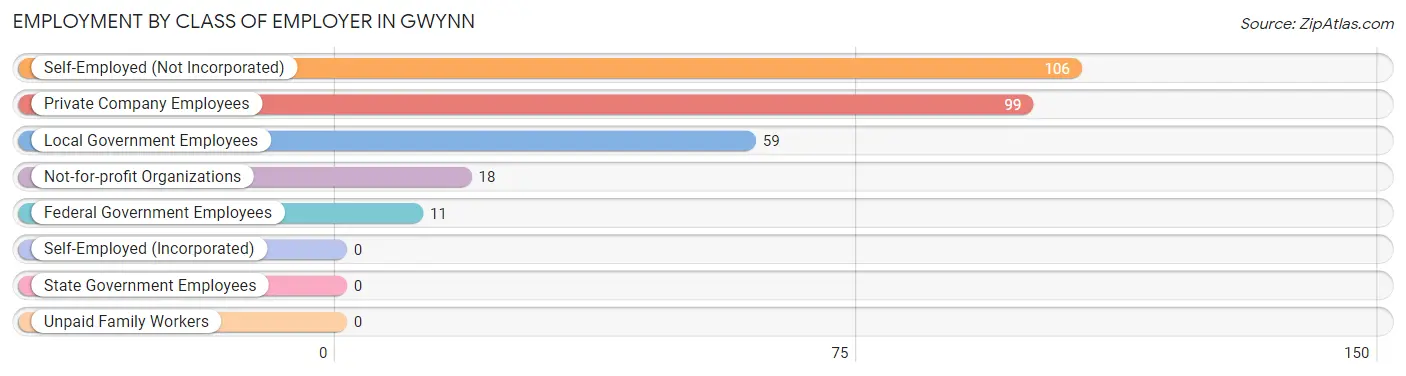
| Employer Class | # Employees | % Employees |
| Private Company Employees | 99 | 33.8% |
| Self-Employed (Incorporated) | 0 | 0.0% |
| Self-Employed (Not Incorporated) | 106 | 36.2% |
| Not-for-profit Organizations | 18 | 6.1% |
| Local Government Employees | 59 | 20.1% |
| State Government Employees | 0 | 0.0% |
| Federal Government Employees | 11 | 3.7% |
| Unpaid Family Workers | 0 | 0.0% |
| Total | 293 | 100.0% |
Employment Status by Age in Gwynn
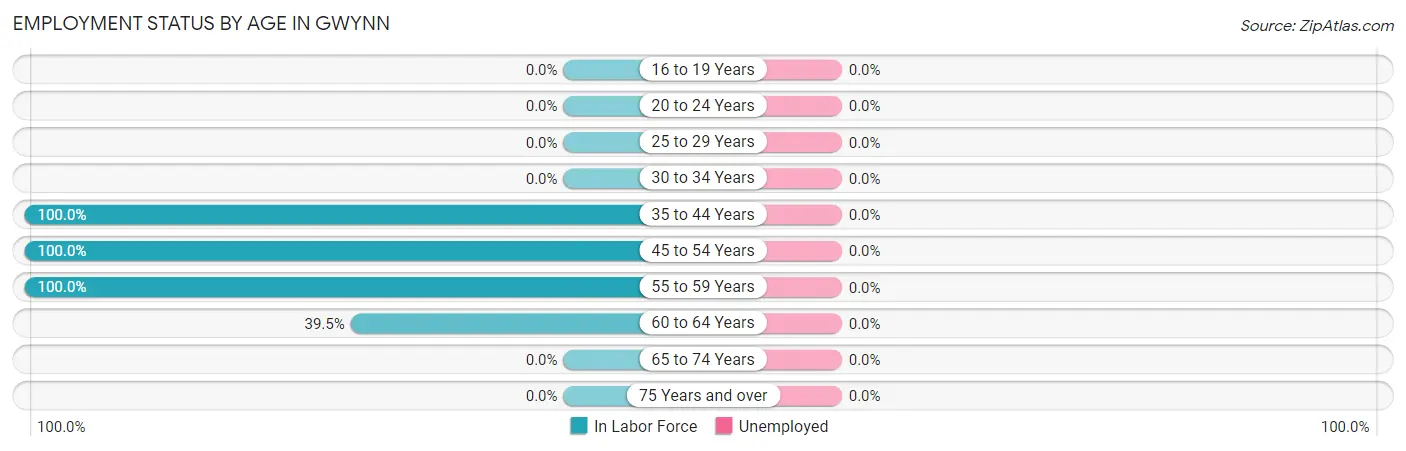
| Age Bracket | In Labor Force | Unemployed |
| 16 to 19 Years | 0 (0.0%) | 0 (0.0%) |
| 20 to 24 Years | 0 (0.0%) | 0 (0.0%) |
| 25 to 29 Years | 0 (0.0%) | 0 (0.0%) |
| 30 to 34 Years | 0 (0.0%) | 0 (0.0%) |
| 35 to 44 Years | 64 (100.0%) | 0 (0.0%) |
| 45 to 54 Years | 170 (100.0%) | 0 (0.0%) |
| 55 to 59 Years | 25 (100.0%) | 0 (0.0%) |
| 60 to 64 Years | 34 (39.5%) | 0 (0.0%) |
| 65 to 74 Years | 0 (0.0%) | 0 (0.0%) |
| 75 Years and over | 0 (0.0%) | 0 (0.0%) |
| Total | 293 (45.9%) | 0 (0.0%) |
Employment Status by Educational Attainment in Gwynn
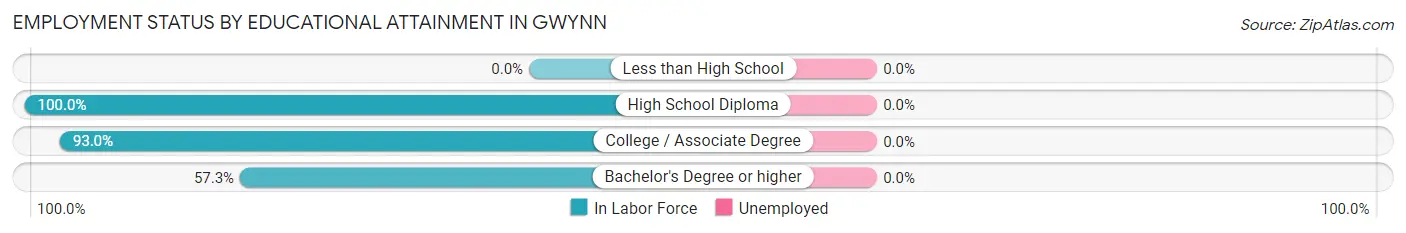
| Educational Attainment | In Labor Force | Unemployed |
| Less than High School | 0 (0.0%) | 0 (0.0%) |
| High School Diploma | 128 (100.0%) | 0 (0.0%) |
| College / Associate Degree | 106 (93.0%) | 0 (0.0%) |
| Bachelor's Degree or higher | 59 (57.3%) | 0 (0.0%) |
| Total | 293 (84.9%) | 0 (0.0%) |
Employment Occupations by Sex in Gwynn
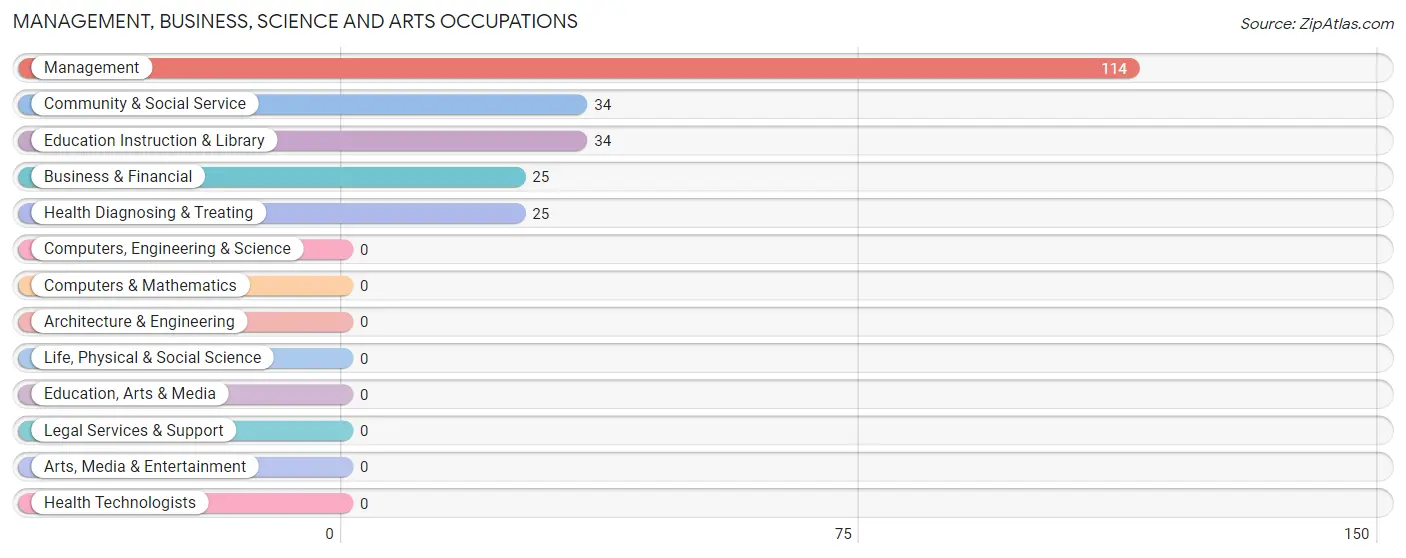
Management, Business, Science and Arts Occupations
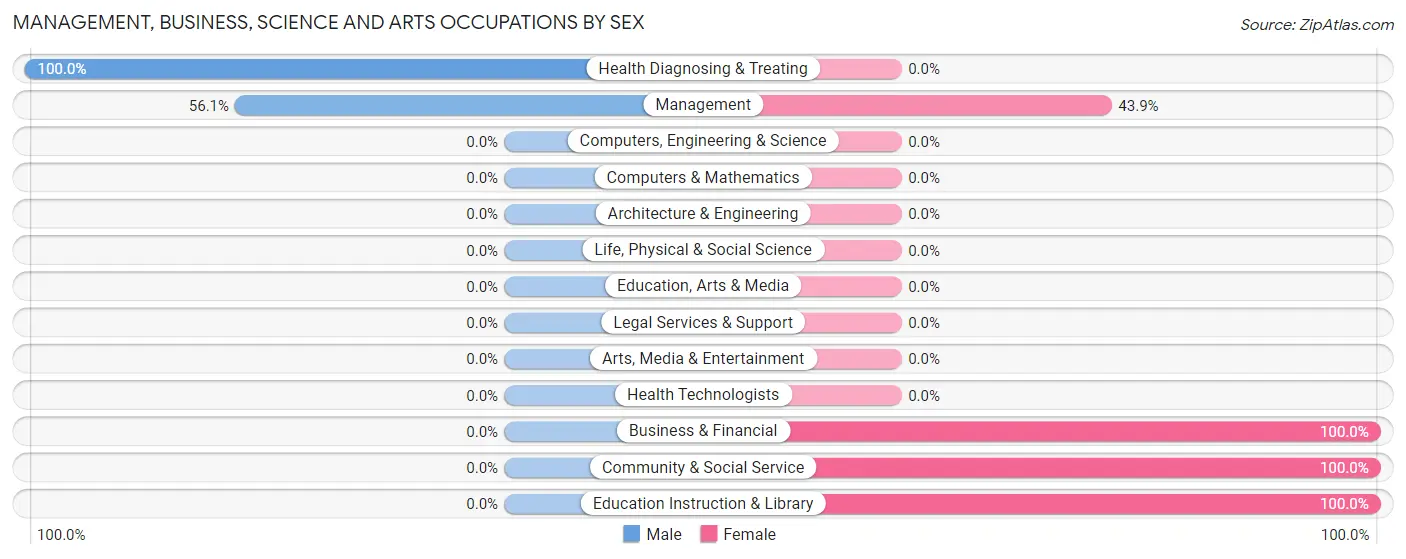
The most common Management, Business, Science and Arts occupations in Gwynn are Management (114 | 38.9%), Community & Social Service (34 | 11.6%), Education Instruction & Library (34 | 11.6%), Business & Financial (25 | 8.5%), and Health Diagnosing & Treating (25 | 8.5%).
Management, Business, Science and Arts Occupations by Sex
Within the Management, Business, Science and Arts occupations in Gwynn, the most male-oriented occupations are Health Diagnosing & Treating (100.0%), and Management (56.1%), while the most female-oriented occupations are Business & Financial (100.0%), Community & Social Service (100.0%), and Education Instruction & Library (100.0%).
| Occupation | Male | Female |
| Management | 64 (56.1%) | 50 (43.9%) |
| Business & Financial | 0 (0.0%) | 25 (100.0%) |
| Computers, Engineering & Science | 0 (0.0%) | 0 (0.0%) |
| Computers & Mathematics | 0 (0.0%) | 0 (0.0%) |
| Architecture & Engineering | 0 (0.0%) | 0 (0.0%) |
| Life, Physical & Social Science | 0 (0.0%) | 0 (0.0%) |
| Community & Social Service | 0 (0.0%) | 34 (100.0%) |
| Education, Arts & Media | 0 (0.0%) | 0 (0.0%) |
| Legal Services & Support | 0 (0.0%) | 0 (0.0%) |
| Education Instruction & Library | 0 (0.0%) | 34 (100.0%) |
| Arts, Media & Entertainment | 0 (0.0%) | 0 (0.0%) |
| Health Diagnosing & Treating | 25 (100.0%) | 0 (0.0%) |
| Health Technologists | 0 (0.0%) | 0 (0.0%) |
| Total (Category) | 89 (45.0%) | 109 (55.0%) |
| Total (Overall) | 155 (52.9%) | 138 (47.1%) |
Services Occupations
Services Occupations by Sex
| Occupation | Male | Female |
| Healthcare Support | 0 (0.0%) | 0 (0.0%) |
| Security & Protection | 0 (0.0%) | 0 (0.0%) |
| Firefighting & Prevention | 0 (0.0%) | 0 (0.0%) |
| Law Enforcement | 0 (0.0%) | 0 (0.0%) |
| Food Preparation & Serving | 0 (0.0%) | 0 (0.0%) |
| Cleaning & Maintenance | 0 (0.0%) | 0 (0.0%) |
| Personal Care & Service | 0 (0.0%) | 0 (0.0%) |
| Total (Category) | 0 (0.0%) | 0 (0.0%) |
| Total (Overall) | 155 (52.9%) | 138 (47.1%) |
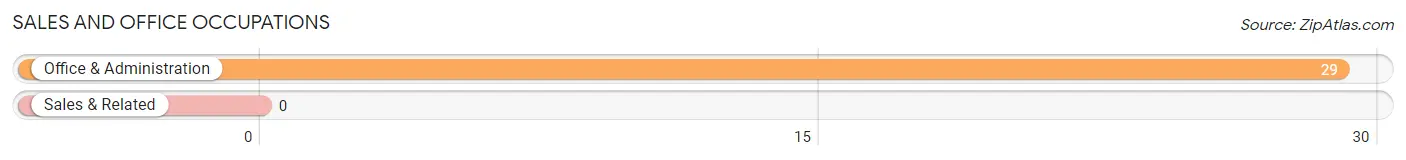
Sales and Office Occupations
The most common Sales and Office occupations in Gwynn are , and Office & Administration (29 | 9.9%).
Sales and Office Occupations by Sex
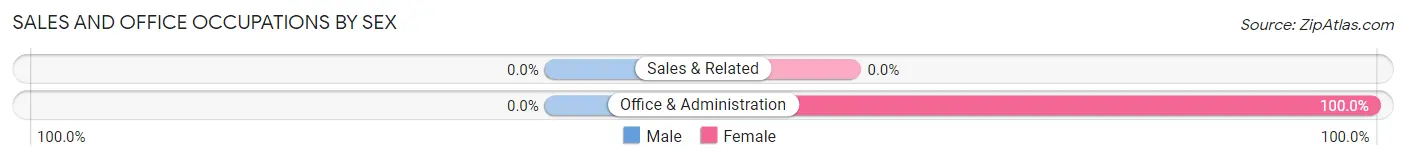
| Occupation | Male | Female |
| Sales & Related | 0 (0.0%) | 0 (0.0%) |
| Office & Administration | 0 (0.0%) | 29 (100.0%) |
| Total (Category) | 0 (0.0%) | 29 (100.0%) |
| Total (Overall) | 155 (52.9%) | 138 (47.1%) |
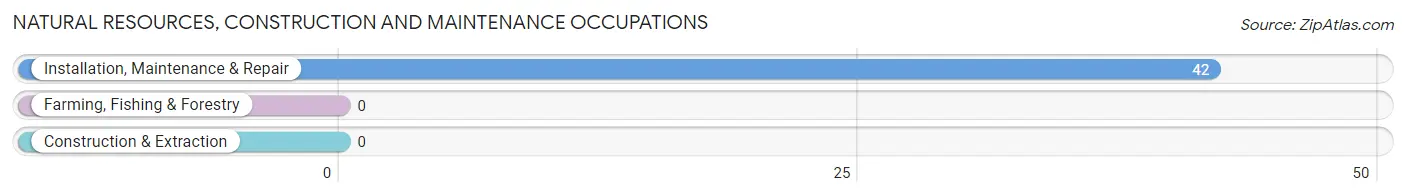
Natural Resources, Construction and Maintenance Occupations
The most common Natural Resources, Construction and Maintenance occupations in Gwynn are , and Installation, Maintenance & Repair (42 | 14.3%).
Natural Resources, Construction and Maintenance Occupations by Sex
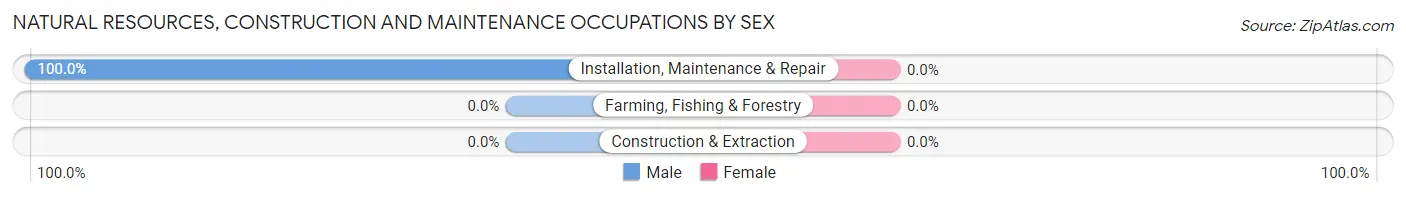
| Occupation | Male | Female |
| Farming, Fishing & Forestry | 0 (0.0%) | 0 (0.0%) |
| Construction & Extraction | 0 (0.0%) | 0 (0.0%) |
| Installation, Maintenance & Repair | 42 (100.0%) | 0 (0.0%) |
| Total (Category) | 42 (100.0%) | 0 (0.0%) |
| Total (Overall) | 155 (52.9%) | 138 (47.1%) |
Production, Transportation and Moving Occupations
The most common Production, Transportation and Moving occupations in Gwynn are , and Transportation (24 | 8.2%).
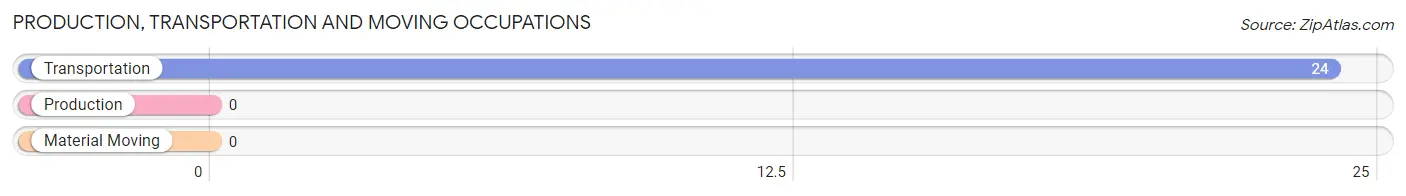
Production, Transportation and Moving Occupations by Sex
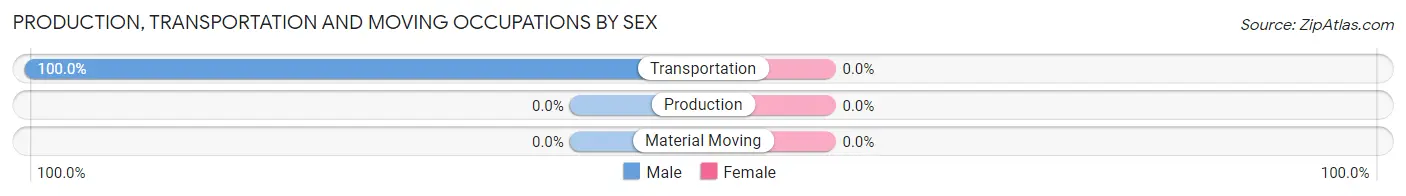
| Occupation | Male | Female |
| Production | 0 (0.0%) | 0 (0.0%) |
| Transportation | 24 (100.0%) | 0 (0.0%) |
| Material Moving | 0 (0.0%) | 0 (0.0%) |
| Total (Category) | 24 (100.0%) | 0 (0.0%) |
| Total (Overall) | 155 (52.9%) | 138 (47.1%) |
Employment Industries by Sex in Gwynn
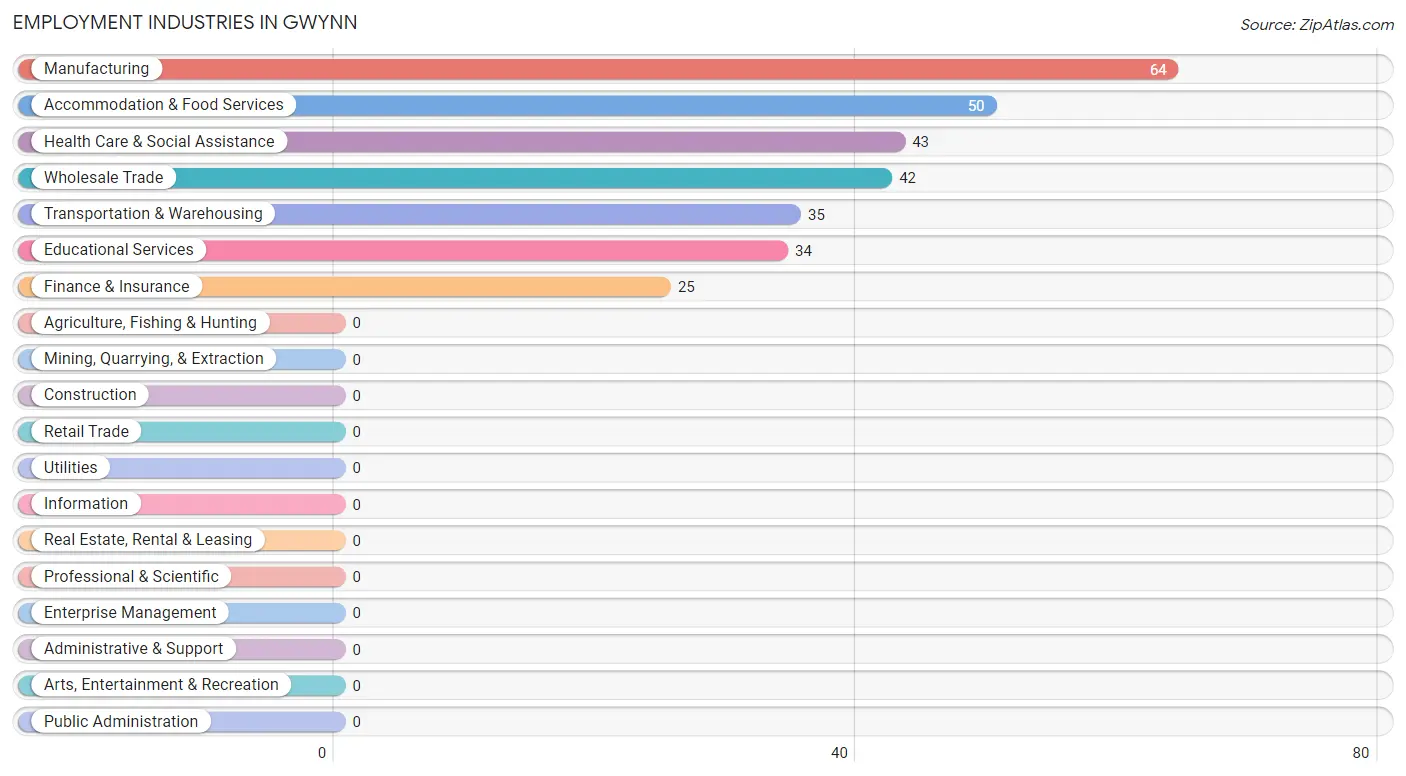
Employment Industries in Gwynn
The major employment industries in Gwynn include Manufacturing (64 | 21.8%), Accommodation & Food Services (50 | 17.1%), Health Care & Social Assistance (43 | 14.7%), Wholesale Trade (42 | 14.3%), and Transportation & Warehousing (35 | 11.9%).
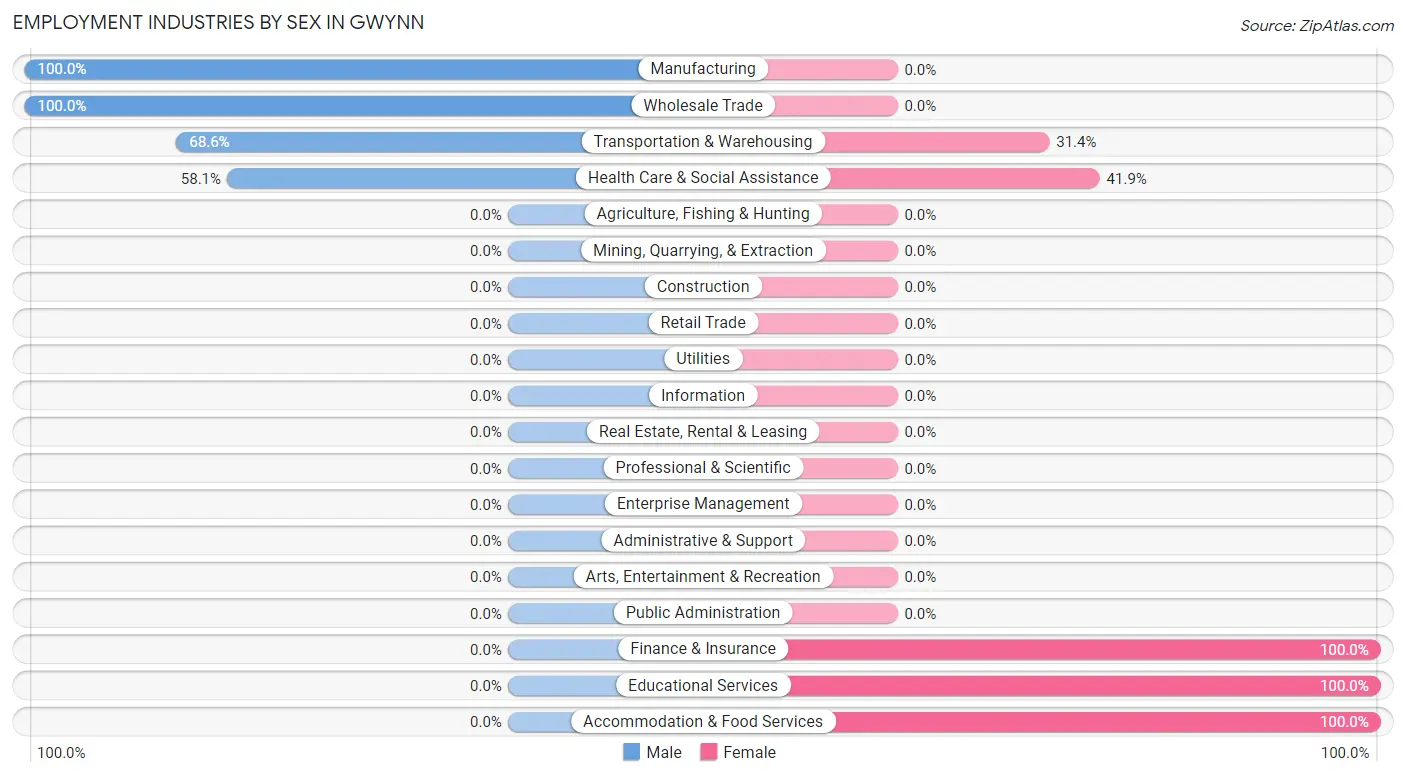
Employment Industries by Sex in Gwynn
The Gwynn industries that see more men than women are Manufacturing (100.0%), Wholesale Trade (100.0%), and Transportation & Warehousing (68.6%), whereas the industries that tend to have a higher number of women are Finance & Insurance (100.0%), Educational Services (100.0%), and Accommodation & Food Services (100.0%).
| Industry | Male | Female |
| Agriculture, Fishing & Hunting | 0 (0.0%) | 0 (0.0%) |
| Mining, Quarrying, & Extraction | 0 (0.0%) | 0 (0.0%) |
| Construction | 0 (0.0%) | 0 (0.0%) |
| Manufacturing | 64 (100.0%) | 0 (0.0%) |
| Wholesale Trade | 42 (100.0%) | 0 (0.0%) |
| Retail Trade | 0 (0.0%) | 0 (0.0%) |
| Transportation & Warehousing | 24 (68.6%) | 11 (31.4%) |
| Utilities | 0 (0.0%) | 0 (0.0%) |
| Information | 0 (0.0%) | 0 (0.0%) |
| Finance & Insurance | 0 (0.0%) | 25 (100.0%) |
| Real Estate, Rental & Leasing | 0 (0.0%) | 0 (0.0%) |
| Professional & Scientific | 0 (0.0%) | 0 (0.0%) |
| Enterprise Management | 0 (0.0%) | 0 (0.0%) |
| Administrative & Support | 0 (0.0%) | 0 (0.0%) |
| Educational Services | 0 (0.0%) | 34 (100.0%) |
| Health Care & Social Assistance | 25 (58.1%) | 18 (41.9%) |
| Arts, Entertainment & Recreation | 0 (0.0%) | 0 (0.0%) |
| Accommodation & Food Services | 0 (0.0%) | 50 (100.0%) |
| Public Administration | 0 (0.0%) | 0 (0.0%) |
| Total | 155 (52.9%) | 138 (47.1%) |
Education in Gwynn
School Enrollment in Gwynn
| School Level | # Students | % Students |
| Nursery / Preschool | 0 | 0.0% |
| Kindergarten | 0 | 0.0% |
| Elementary School | 0 | 0.0% |
| Middle School | 0 | 0.0% |
| High School | 0 | 0.0% |
| College / Undergraduate | 0 | 0.0% |
| Graduate / Professional | 0 | 0.0% |
| Total | 0 | 0.0% |
School Enrollment by Age by Funding Source in Gwynn

| Age Bracket | Public School | Private School |
| 3 to 4 Year Olds | 0 (0.0%) | 0 (0.0%) |
| 5 to 9 Year Old | 0 (0.0%) | 0 (0.0%) |
| 10 to 14 Year Olds | 0 (0.0%) | 0 (0.0%) |
| 15 to 17 Year Olds | 0 (0.0%) | 0 (0.0%) |
| 18 to 19 Year Olds | 0 (0.0%) | 0 (0.0%) |
| 20 to 24 Year Olds | 0 (0.0%) | 0 (0.0%) |
| 25 to 34 Year Olds | 0 (0.0%) | 0 (0.0%) |
| 35 Years and over | 0 (0.0%) | 0 (0.0%) |
| Total | 0 (0.0%) | 0 (0.0%) |
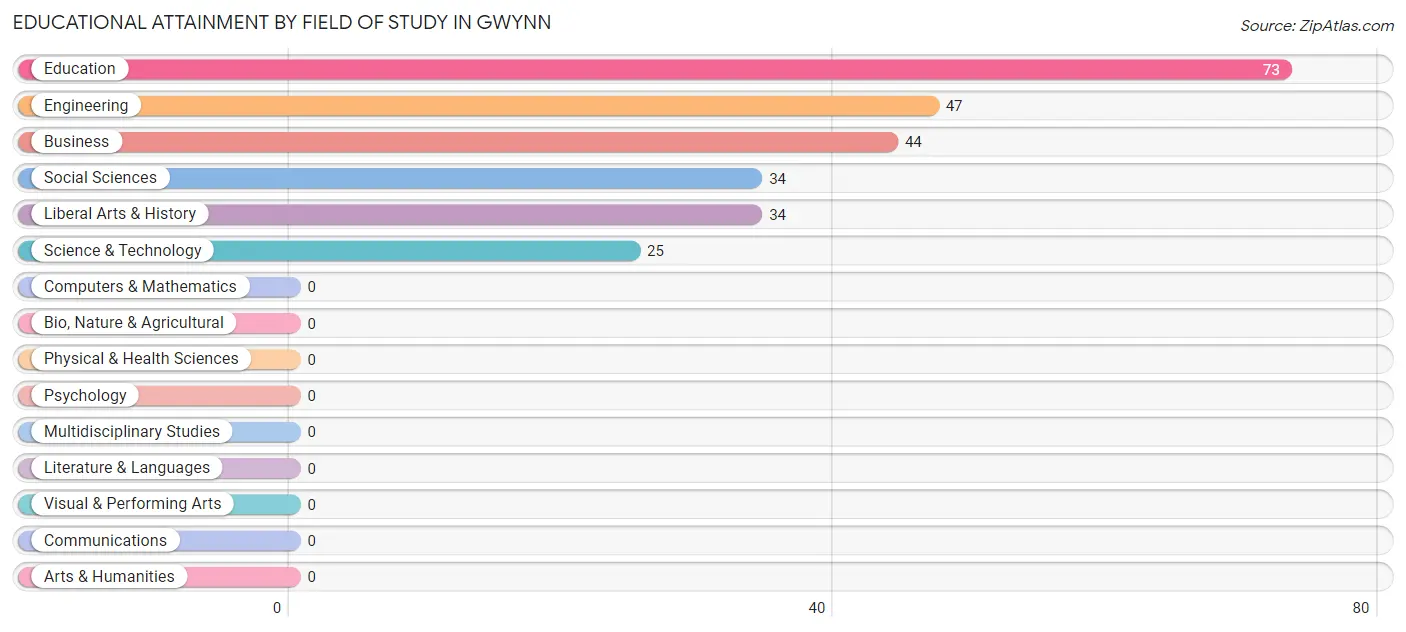
Educational Attainment by Field of Study in Gwynn
Education (73 | 28.4%), engineering (47 | 18.3%), business (44 | 17.1%), social sciences (34 | 13.2%), and liberal arts & history (34 | 13.2%) are the most common fields of study among 257 individuals in Gwynn who have obtained a bachelor's degree or higher.
| Field of Study | # Graduates | % Graduates |
| Computers & Mathematics | 0 | 0.0% |
| Bio, Nature & Agricultural | 0 | 0.0% |
| Physical & Health Sciences | 0 | 0.0% |
| Psychology | 0 | 0.0% |
| Social Sciences | 34 | 13.2% |
| Engineering | 47 | 18.3% |
| Multidisciplinary Studies | 0 | 0.0% |
| Science & Technology | 25 | 9.7% |
| Business | 44 | 17.1% |
| Education | 73 | 28.4% |
| Literature & Languages | 0 | 0.0% |
| Liberal Arts & History | 34 | 13.2% |
| Visual & Performing Arts | 0 | 0.0% |
| Communications | 0 | 0.0% |
| Arts & Humanities | 0 | 0.0% |
| Total | 257 | 100.0% |
Transportation & Commute in Gwynn
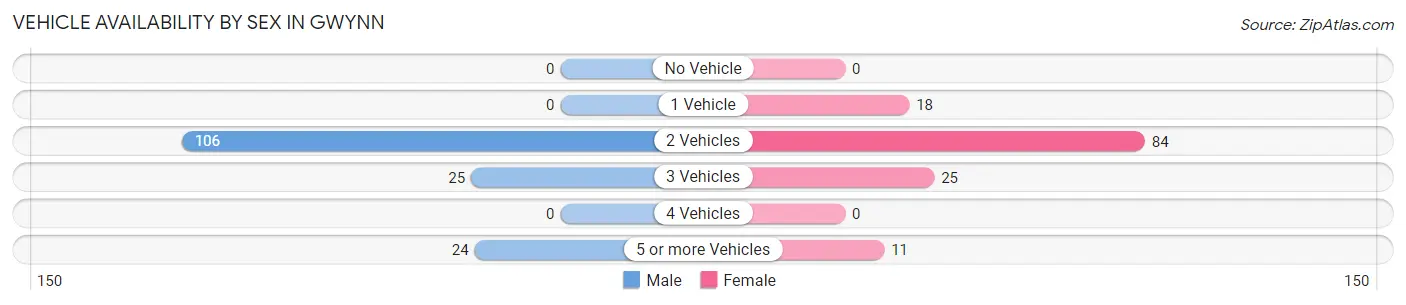
Vehicle Availability by Sex in Gwynn
The most prevalent vehicle ownership categories in Gwynn are males with 2 vehicles (106, accounting for 68.4%) and females with 2 vehicles (84, making up 76.8%).
| Vehicles Available | Male | Female |
| No Vehicle | 0 (0.0%) | 0 (0.0%) |
| 1 Vehicle | 0 (0.0%) | 18 (13.0%) |
| 2 Vehicles | 106 (68.4%) | 84 (60.9%) |
| 3 Vehicles | 25 (16.1%) | 25 (18.1%) |
| 4 Vehicles | 0 (0.0%) | 0 (0.0%) |
| 5 or more Vehicles | 24 (15.5%) | 11 (8.0%) |
| Total | 155 (100.0%) | 138 (100.0%) |
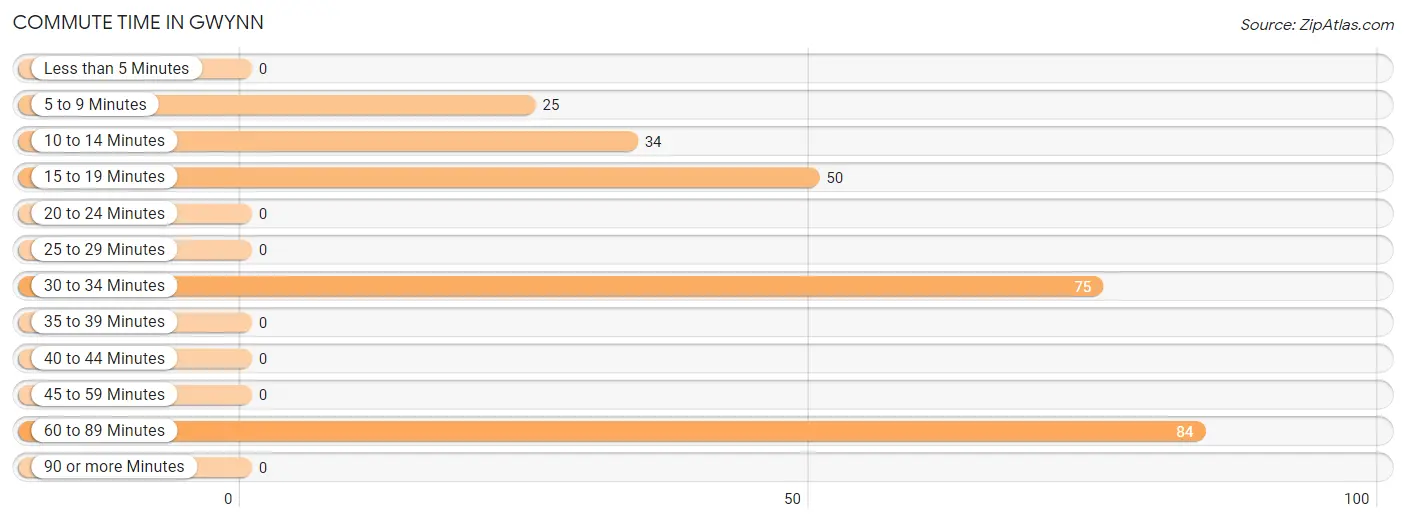
Commute Time in Gwynn
The most frequently occuring commute durations in Gwynn are 60 to 89 minutes (84 commuters, 31.3%), 30 to 34 minutes (75 commuters, 28.0%), and 15 to 19 minutes (50 commuters, 18.7%).
| Commute Time | # Commuters | % Commuters |
| Less than 5 Minutes | 0 | 0.0% |
| 5 to 9 Minutes | 25 | 9.3% |
| 10 to 14 Minutes | 34 | 12.7% |
| 15 to 19 Minutes | 50 | 18.7% |
| 20 to 24 Minutes | 0 | 0.0% |
| 25 to 29 Minutes | 0 | 0.0% |
| 30 to 34 Minutes | 75 | 28.0% |
| 35 to 39 Minutes | 0 | 0.0% |
| 40 to 44 Minutes | 0 | 0.0% |
| 45 to 59 Minutes | 0 | 0.0% |
| 60 to 89 Minutes | 84 | 31.3% |
| 90 or more Minutes | 0 | 0.0% |
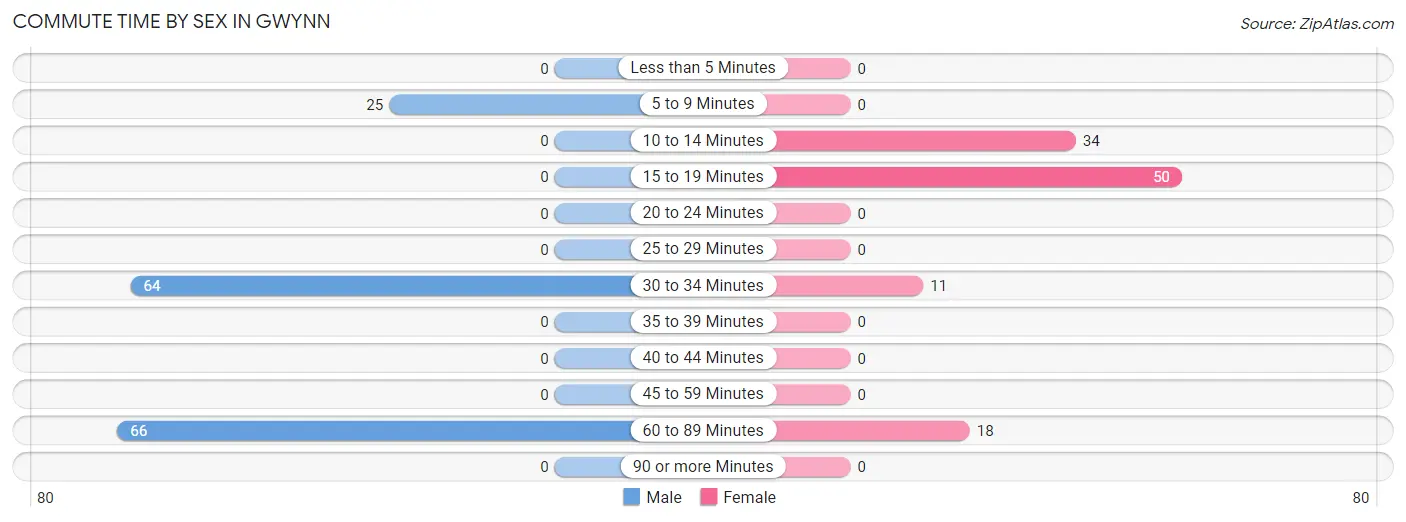
Commute Time by Sex in Gwynn
The most common commute times in Gwynn are 60 to 89 minutes (66 commuters, 42.6%) for males and 15 to 19 minutes (50 commuters, 44.3%) for females.
| Commute Time | Male | Female |
| Less than 5 Minutes | 0 (0.0%) | 0 (0.0%) |
| 5 to 9 Minutes | 25 (16.1%) | 0 (0.0%) |
| 10 to 14 Minutes | 0 (0.0%) | 34 (30.1%) |
| 15 to 19 Minutes | 0 (0.0%) | 50 (44.3%) |
| 20 to 24 Minutes | 0 (0.0%) | 0 (0.0%) |
| 25 to 29 Minutes | 0 (0.0%) | 0 (0.0%) |
| 30 to 34 Minutes | 64 (41.3%) | 11 (9.7%) |
| 35 to 39 Minutes | 0 (0.0%) | 0 (0.0%) |
| 40 to 44 Minutes | 0 (0.0%) | 0 (0.0%) |
| 45 to 59 Minutes | 0 (0.0%) | 0 (0.0%) |
| 60 to 89 Minutes | 66 (42.6%) | 18 (15.9%) |
| 90 or more Minutes | 0 (0.0%) | 0 (0.0%) |
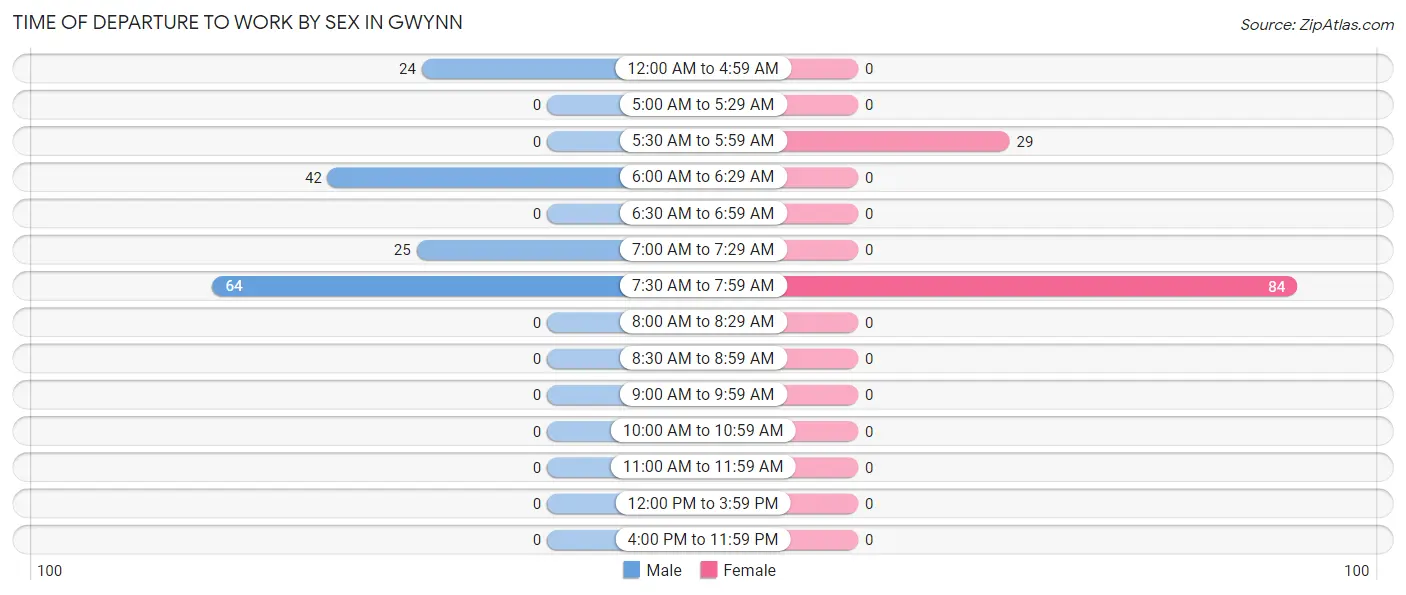
Time of Departure to Work by Sex in Gwynn
The most frequent times of departure to work in Gwynn are 7:30 AM to 7:59 AM (64, 41.3%) for males and 7:30 AM to 7:59 AM (84, 74.3%) for females.
| Time of Departure | Male | Female |
| 12:00 AM to 4:59 AM | 24 (15.5%) | 0 (0.0%) |
| 5:00 AM to 5:29 AM | 0 (0.0%) | 0 (0.0%) |
| 5:30 AM to 5:59 AM | 0 (0.0%) | 29 (25.7%) |
| 6:00 AM to 6:29 AM | 42 (27.1%) | 0 (0.0%) |
| 6:30 AM to 6:59 AM | 0 (0.0%) | 0 (0.0%) |
| 7:00 AM to 7:29 AM | 25 (16.1%) | 0 (0.0%) |
| 7:30 AM to 7:59 AM | 64 (41.3%) | 84 (74.3%) |
| 8:00 AM to 8:29 AM | 0 (0.0%) | 0 (0.0%) |
| 8:30 AM to 8:59 AM | 0 (0.0%) | 0 (0.0%) |
| 9:00 AM to 9:59 AM | 0 (0.0%) | 0 (0.0%) |
| 10:00 AM to 10:59 AM | 0 (0.0%) | 0 (0.0%) |
| 11:00 AM to 11:59 AM | 0 (0.0%) | 0 (0.0%) |
| 12:00 PM to 3:59 PM | 0 (0.0%) | 0 (0.0%) |
| 4:00 PM to 11:59 PM | 0 (0.0%) | 0 (0.0%) |
| Total | 155 (100.0%) | 113 (100.0%) |
Housing Occupancy in Gwynn
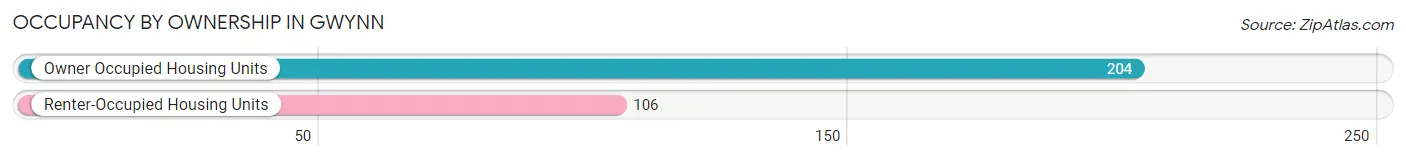
Occupancy by Ownership in Gwynn
Of the total 310 dwellings in Gwynn, owner-occupied units account for 204 (65.8%), while renter-occupied units make up 106 (34.2%).
| Occupancy | # Housing Units | % Housing Units |
| Owner Occupied Housing Units | 204 | 65.8% |
| Renter-Occupied Housing Units | 106 | 34.2% |
| Total Occupied Housing Units | 310 | 100.0% |
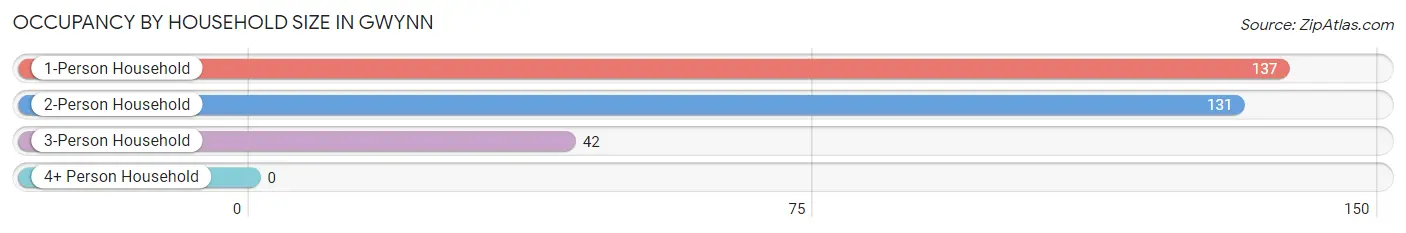
Occupancy by Household Size in Gwynn
| Household Size | # Housing Units | % Housing Units |
| 1-Person Household | 137 | 44.2% |
| 2-Person Household | 131 | 42.3% |
| 3-Person Household | 42 | 13.6% |
| 4+ Person Household | 0 | 0.0% |
| Total Housing Units | 310 | 100.0% |
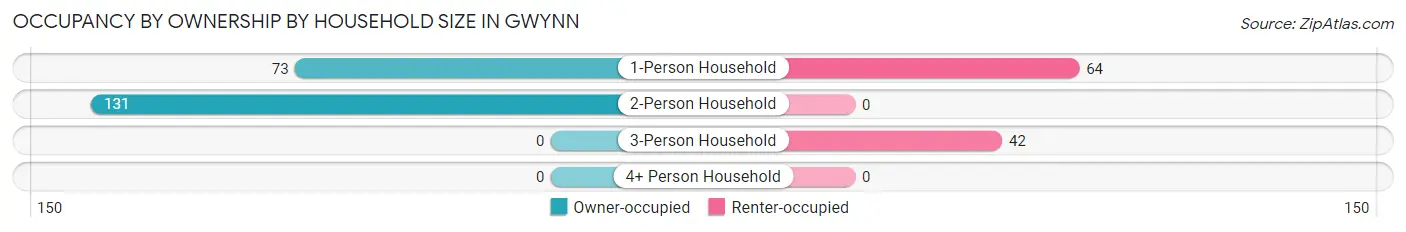
Occupancy by Ownership by Household Size in Gwynn
| Household Size | Owner-occupied | Renter-occupied |
| 1-Person Household | 73 (53.3%) | 64 (46.7%) |
| 2-Person Household | 131 (100.0%) | 0 (0.0%) |
| 3-Person Household | 0 (0.0%) | 42 (100.0%) |
| 4+ Person Household | 0 (0.0%) | 0 (0.0%) |
| Total Housing Units | 204 (65.8%) | 106 (34.2%) |
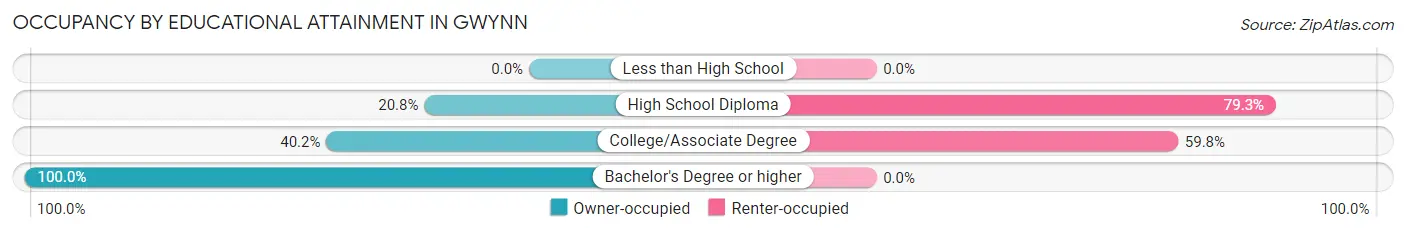
Occupancy by Educational Attainment in Gwynn
| Household Size | Owner-occupied | Renter-occupied |
| Less than High School | 0 (0.0%) | 0 (0.0%) |
| High School Diploma | 11 (20.7%) | 42 (79.2%) |
| College/Associate Degree | 43 (40.2%) | 64 (59.8%) |
| Bachelor's Degree or higher | 150 (100.0%) | 0 (0.0%) |
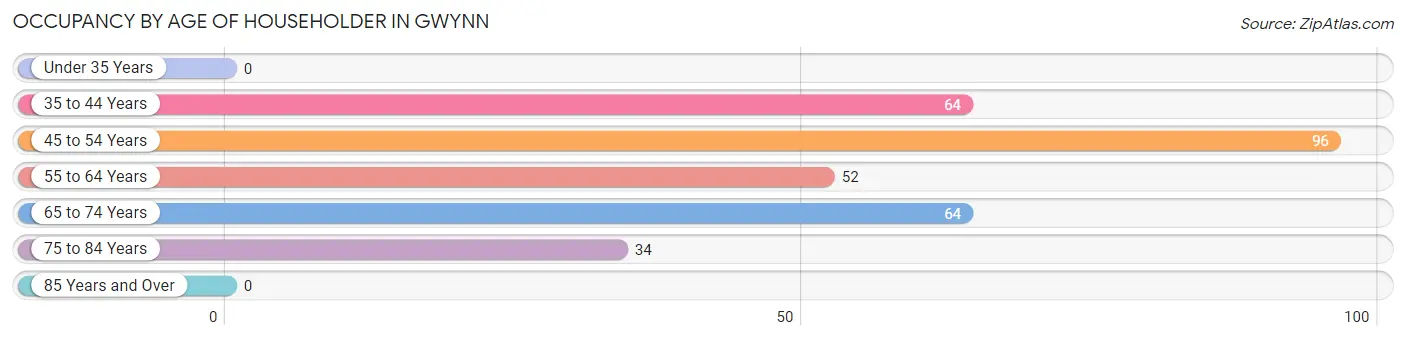
Occupancy by Age of Householder in Gwynn
| Age Bracket | # Households | % Households |
| Under 35 Years | 0 | 0.0% |
| 35 to 44 Years | 64 | 20.6% |
| 45 to 54 Years | 96 | 31.0% |
| 55 to 64 Years | 52 | 16.8% |
| 65 to 74 Years | 64 | 20.6% |
| 75 to 84 Years | 34 | 11.0% |
| 85 Years and Over | 0 | 0.0% |
| Total | 310 | 100.0% |
Housing Finances in Gwynn
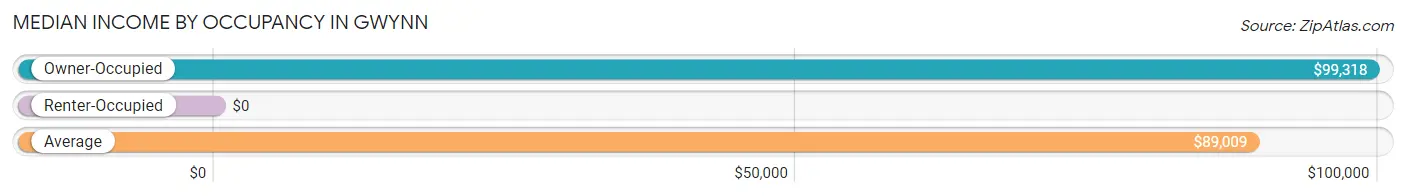
Median Income by Occupancy in Gwynn
| Occupancy Type | # Households | Median Income |
| Owner-Occupied | 204 (65.8%) | $99,318 |
| Renter-Occupied | 106 (34.2%) | $0 |
| Average | 310 (100.0%) | $89,009 |
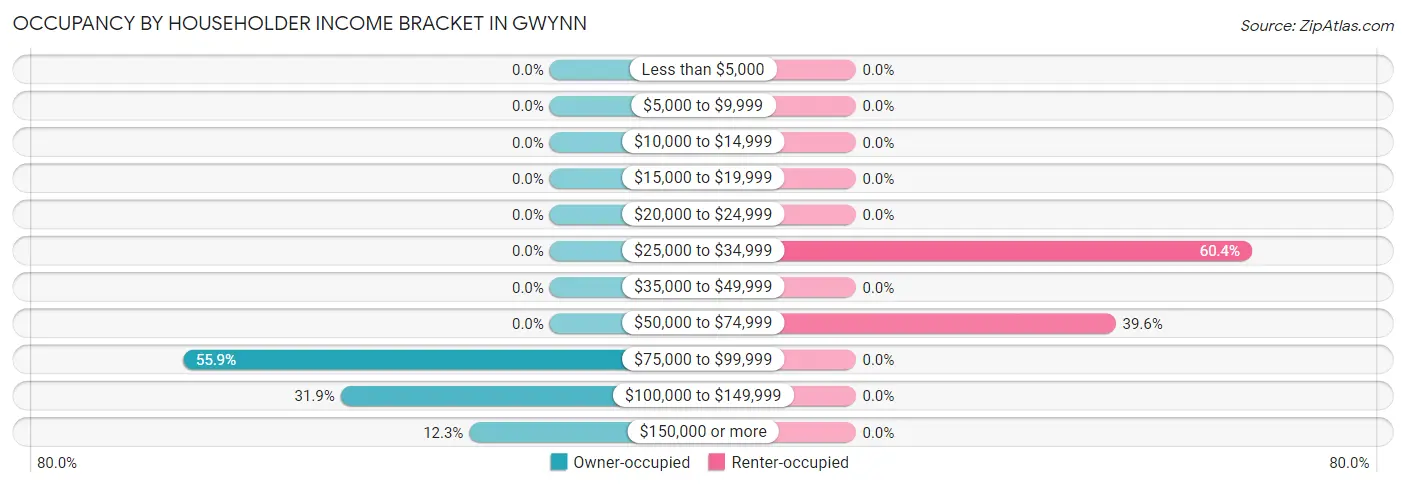
Occupancy by Householder Income Bracket in Gwynn
| Income Bracket | Owner-occupied | Renter-occupied |
| Less than $5,000 | 0 (0.0%) | 0 (0.0%) |
| $5,000 to $9,999 | 0 (0.0%) | 0 (0.0%) |
| $10,000 to $14,999 | 0 (0.0%) | 0 (0.0%) |
| $15,000 to $19,999 | 0 (0.0%) | 0 (0.0%) |
| $20,000 to $24,999 | 0 (0.0%) | 0 (0.0%) |
| $25,000 to $34,999 | 0 (0.0%) | 64 (60.4%) |
| $35,000 to $49,999 | 0 (0.0%) | 0 (0.0%) |
| $50,000 to $74,999 | 0 (0.0%) | 42 (39.6%) |
| $75,000 to $99,999 | 114 (55.9%) | 0 (0.0%) |
| $100,000 to $149,999 | 65 (31.9%) | 0 (0.0%) |
| $150,000 or more | 25 (12.2%) | 0 (0.0%) |
| Total | 204 (100.0%) | 106 (100.0%) |
Monthly Housing Cost Tiers in Gwynn
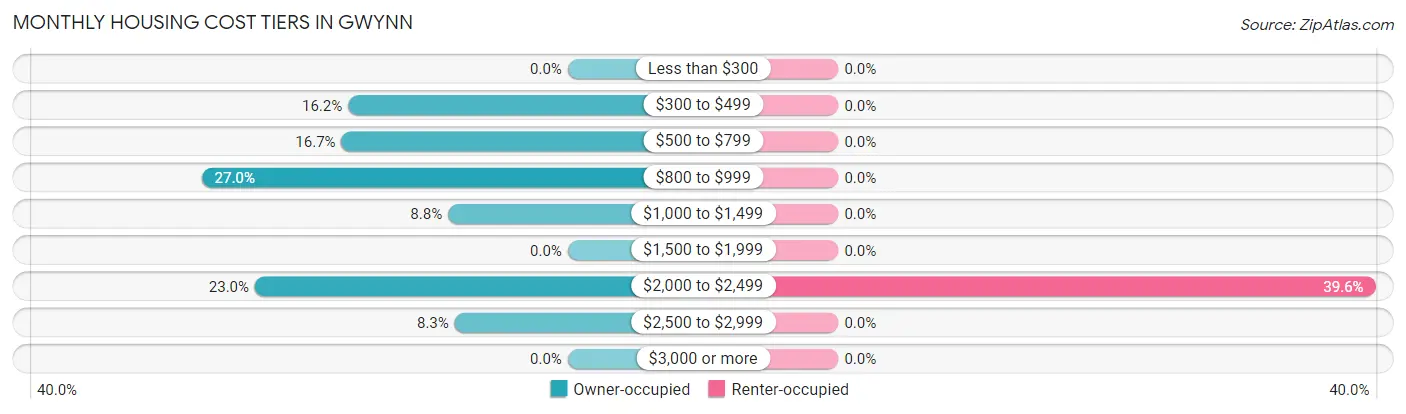
| Monthly Cost | Owner-occupied | Renter-occupied |
| Less than $300 | 0 (0.0%) | 0 (0.0%) |
| $300 to $499 | 33 (16.2%) | 0 (0.0%) |
| $500 to $799 | 34 (16.7%) | 0 (0.0%) |
| $800 to $999 | 55 (27.0%) | 0 (0.0%) |
| $1,000 to $1,499 | 18 (8.8%) | 0 (0.0%) |
| $1,500 to $1,999 | 0 (0.0%) | 0 (0.0%) |
| $2,000 to $2,499 | 47 (23.0%) | 42 (39.6%) |
| $2,500 to $2,999 | 17 (8.3%) | 0 (0.0%) |
| $3,000 or more | 0 (0.0%) | 0 (0.0%) |
| Total | 204 (100.0%) | 106 (100.0%) |
Physical Housing Characteristics in Gwynn
Housing Structures in Gwynn
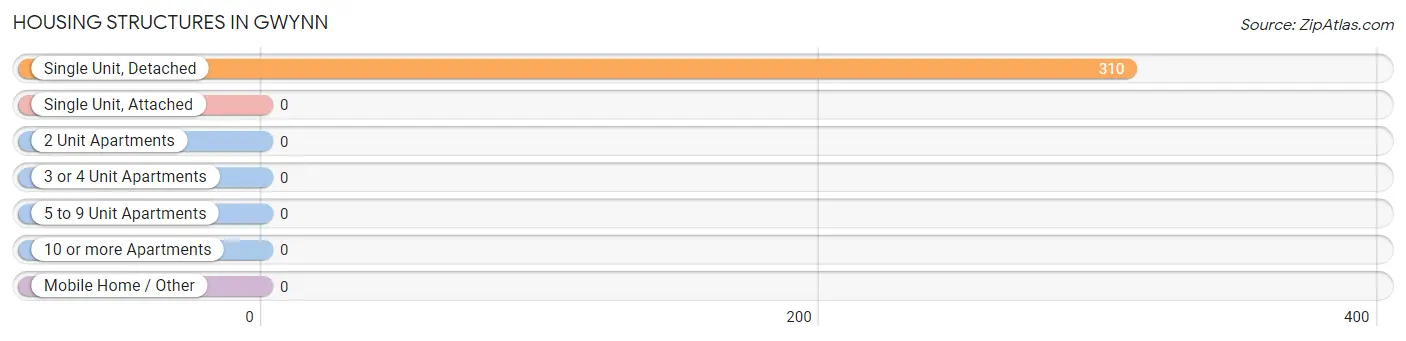
| Structure Type | # Housing Units | % Housing Units |
| Single Unit, Detached | 310 | 100.0% |
| Single Unit, Attached | 0 | 0.0% |
| 2 Unit Apartments | 0 | 0.0% |
| 3 or 4 Unit Apartments | 0 | 0.0% |
| 5 to 9 Unit Apartments | 0 | 0.0% |
| 10 or more Apartments | 0 | 0.0% |
| Mobile Home / Other | 0 | 0.0% |
| Total | 310 | 100.0% |
Housing Structures by Occupancy in Gwynn
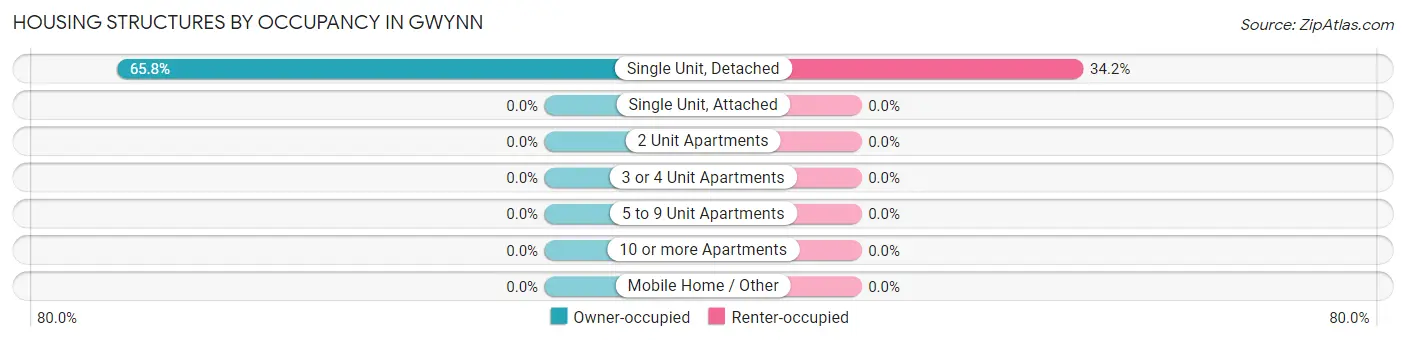
| Structure Type | Owner-occupied | Renter-occupied |
| Single Unit, Detached | 204 (65.8%) | 106 (34.2%) |
| Single Unit, Attached | 0 (0.0%) | 0 (0.0%) |
| 2 Unit Apartments | 0 (0.0%) | 0 (0.0%) |
| 3 or 4 Unit Apartments | 0 (0.0%) | 0 (0.0%) |
| 5 to 9 Unit Apartments | 0 (0.0%) | 0 (0.0%) |
| 10 or more Apartments | 0 (0.0%) | 0 (0.0%) |
| Mobile Home / Other | 0 (0.0%) | 0 (0.0%) |
| Total | 204 (65.8%) | 106 (34.2%) |
Housing Structures by Number of Rooms in Gwynn
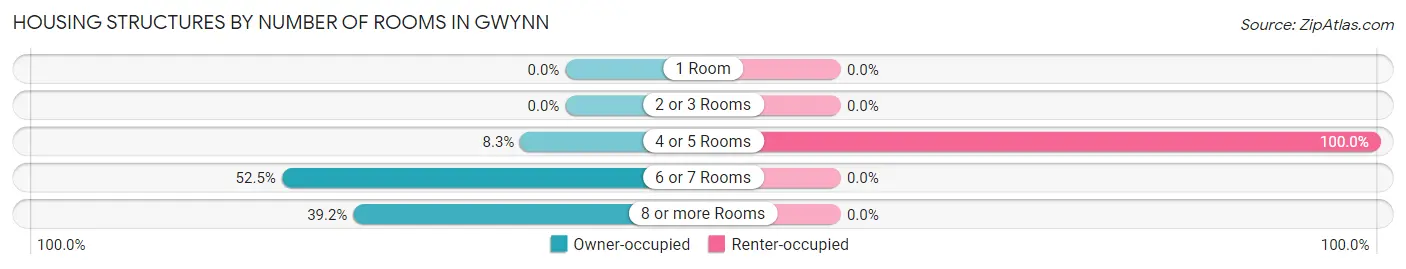
| Number of Rooms | Owner-occupied | Renter-occupied |
| 1 Room | 0 (0.0%) | 0 (0.0%) |
| 2 or 3 Rooms | 0 (0.0%) | 0 (0.0%) |
| 4 or 5 Rooms | 17 (8.3%) | 106 (100.0%) |
| 6 or 7 Rooms | 107 (52.4%) | 0 (0.0%) |
| 8 or more Rooms | 80 (39.2%) | 0 (0.0%) |
| Total | 204 (100.0%) | 106 (100.0%) |
Housing Structure by Heating Type in Gwynn
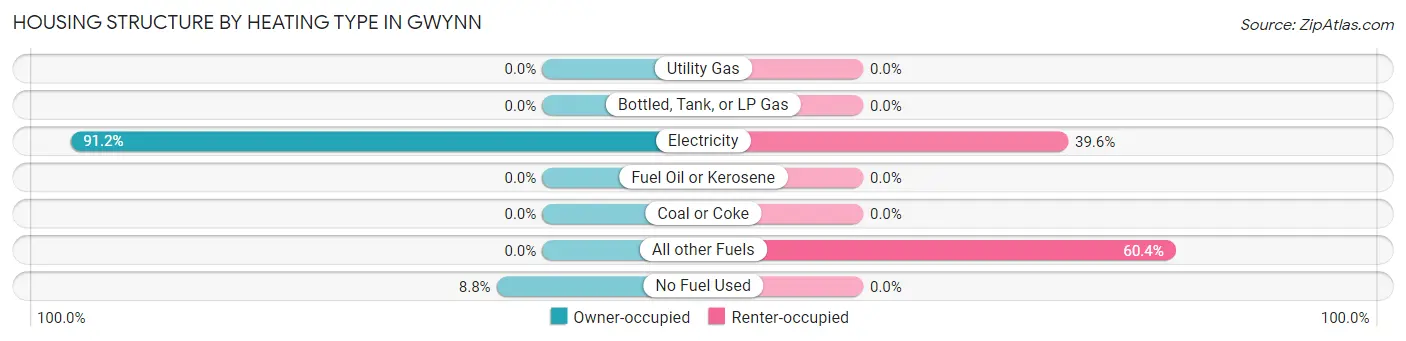
| Heating Type | Owner-occupied | Renter-occupied |
| Utility Gas | 0 (0.0%) | 0 (0.0%) |
| Bottled, Tank, or LP Gas | 0 (0.0%) | 0 (0.0%) |
| Electricity | 186 (91.2%) | 42 (39.6%) |
| Fuel Oil or Kerosene | 0 (0.0%) | 0 (0.0%) |
| Coal or Coke | 0 (0.0%) | 0 (0.0%) |
| All other Fuels | 0 (0.0%) | 64 (60.4%) |
| No Fuel Used | 18 (8.8%) | 0 (0.0%) |
| Total | 204 (100.0%) | 106 (100.0%) |
Household Vehicle Usage in Gwynn
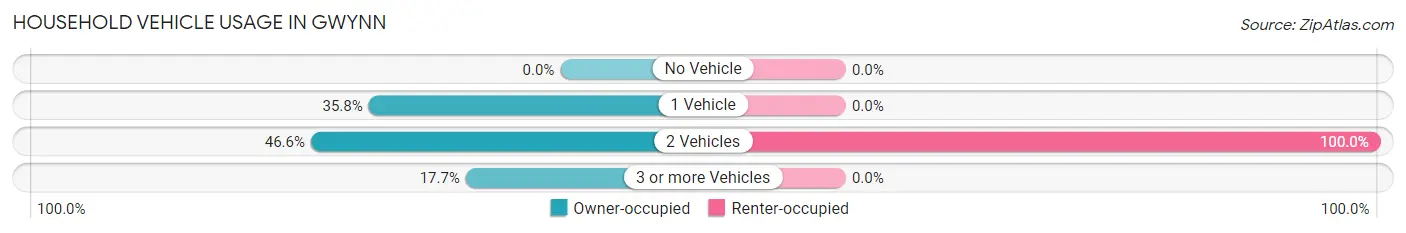
| Vehicles per Household | Owner-occupied | Renter-occupied |
| No Vehicle | 0 (0.0%) | 0 (0.0%) |
| 1 Vehicle | 73 (35.8%) | 0 (0.0%) |
| 2 Vehicles | 95 (46.6%) | 106 (100.0%) |
| 3 or more Vehicles | 36 (17.6%) | 0 (0.0%) |
| Total | 204 (100.0%) | 106 (100.0%) |
Real Estate & Mortgages in Gwynn
Real Estate and Mortgage Overview in Gwynn
| Characteristic | Without Mortgage | With Mortgage |
| Housing Units | 111 | 93 |
| Median Property Value | $366,200 | $568,400 |
| Median Household Income | $98,267 | $0 |
| Monthly Housing Costs | $566 | $0 |
| Real Estate Taxes | - | - |
Property Value by Mortgage Status in Gwynn
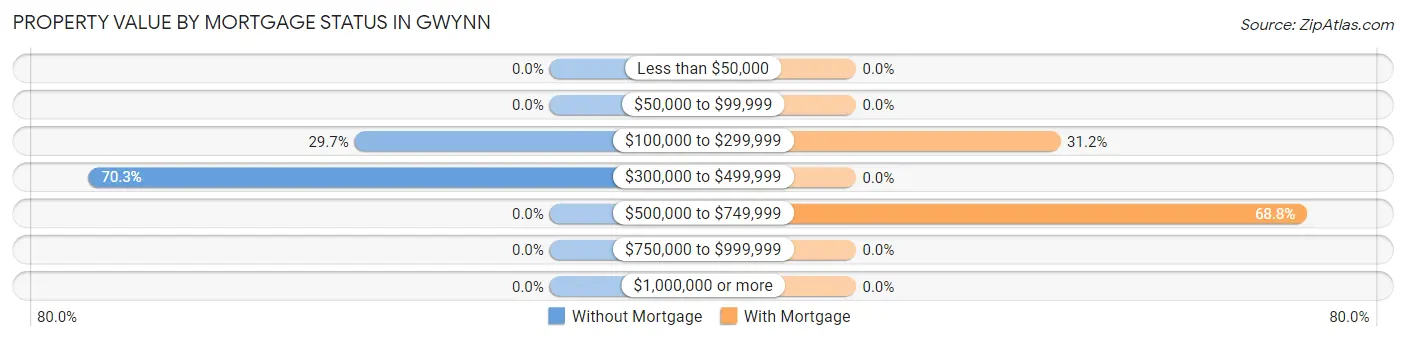
| Property Value | Without Mortgage | With Mortgage |
| Less than $50,000 | 0 (0.0%) | 0 (0.0%) |
| $50,000 to $99,999 | 0 (0.0%) | 0 (0.0%) |
| $100,000 to $299,999 | 33 (29.7%) | 29 (31.2%) |
| $300,000 to $499,999 | 78 (70.3%) | 0 (0.0%) |
| $500,000 to $749,999 | 0 (0.0%) | 64 (68.8%) |
| $750,000 to $999,999 | 0 (0.0%) | 0 (0.0%) |
| $1,000,000 or more | 0 (0.0%) | 0 (0.0%) |
| Total | 111 (100.0%) | 93 (100.0%) |
Household Income by Mortgage Status in Gwynn
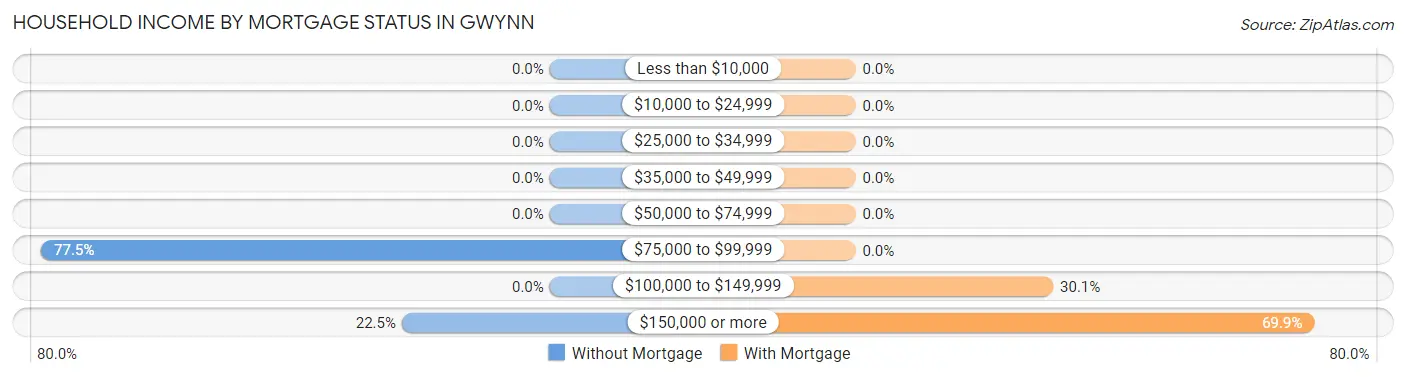
| Household Income | Without Mortgage | With Mortgage |
| Less than $10,000 | 0 (0.0%) | 0 (0.0%) |
| $10,000 to $24,999 | 0 (0.0%) | 0 (0.0%) |
| $25,000 to $34,999 | 0 (0.0%) | 0 (0.0%) |
| $35,000 to $49,999 | 0 (0.0%) | 0 (0.0%) |
| $50,000 to $74,999 | 0 (0.0%) | 0 (0.0%) |
| $75,000 to $99,999 | 86 (77.5%) | 0 (0.0%) |
| $100,000 to $149,999 | 0 (0.0%) | 28 (30.1%) |
| $150,000 or more | 25 (22.5%) | 65 (69.9%) |
| Total | 111 (100.0%) | 93 (100.0%) |
Property Value to Household Income Ratio in Gwynn
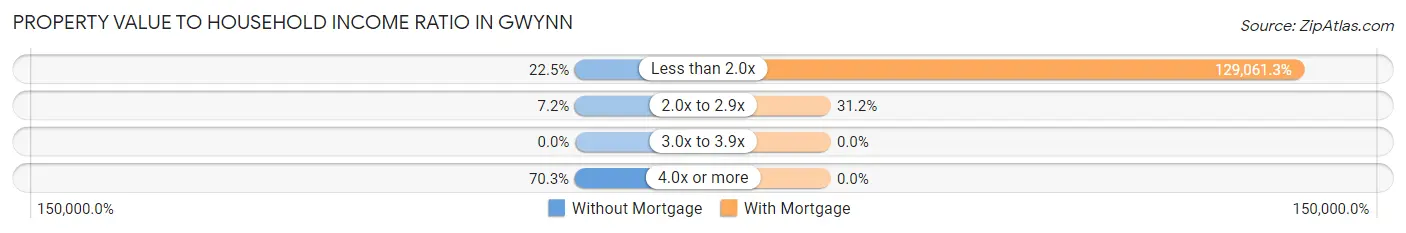
| Value-to-Income Ratio | Without Mortgage | With Mortgage |
| Less than 2.0x | 25 (22.5%) | 120,027 (129,061.3%) |
| 2.0x to 2.9x | 8 (7.2%) | 29 (31.2%) |
| 3.0x to 3.9x | 0 (0.0%) | 0 (0.0%) |
| 4.0x or more | 78 (70.3%) | 0 (0.0%) |
| Total | 111 (100.0%) | 93 (100.0%) |
Real Estate Taxes by Mortgage Status in Gwynn
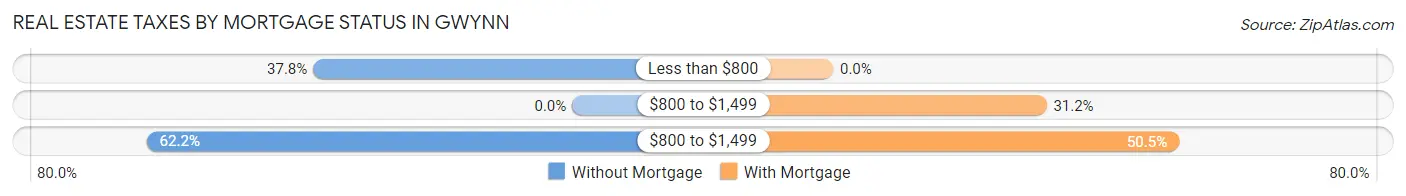
| Property Taxes | Without Mortgage | With Mortgage |
| Less than $800 | 42 (37.8%) | 0 (0.0%) |
| $800 to $1,499 | 0 (0.0%) | 29 (31.2%) |
| $800 to $1,499 | 69 (62.2%) | 47 (50.5%) |
| Total | 111 (100.0%) | 93 (100.0%) |
Health & Disability in Gwynn
Health Insurance Coverage by Age in Gwynn
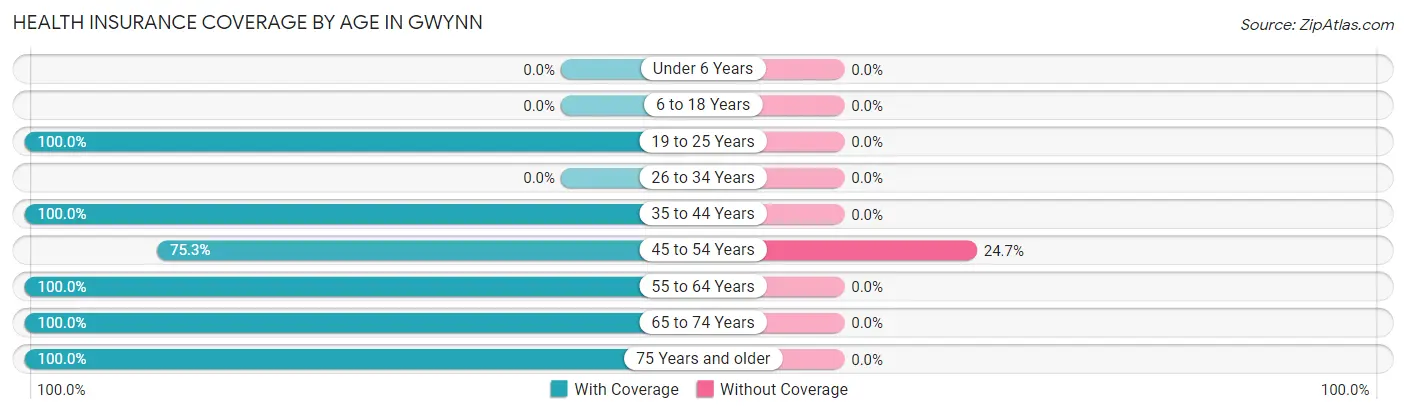
| Age Bracket | With Coverage | Without Coverage |
| Under 6 Years | 0 (0.0%) | 0 (0.0%) |
| 6 to 18 Years | 0 (0.0%) | 0 (0.0%) |
| 19 to 25 Years | 141 (100.0%) | 0 (0.0%) |
| 26 to 34 Years | 0 (0.0%) | 0 (0.0%) |
| 35 to 44 Years | 64 (100.0%) | 0 (0.0%) |
| 45 to 54 Years | 128 (75.3%) | 42 (24.7%) |
| 55 to 64 Years | 111 (100.0%) | 0 (0.0%) |
| 65 to 74 Years | 80 (100.0%) | 0 (0.0%) |
| 75 Years and older | 73 (100.0%) | 0 (0.0%) |
| Total | 597 (93.4%) | 42 (6.6%) |
Health Insurance Coverage by Citizenship Status in Gwynn
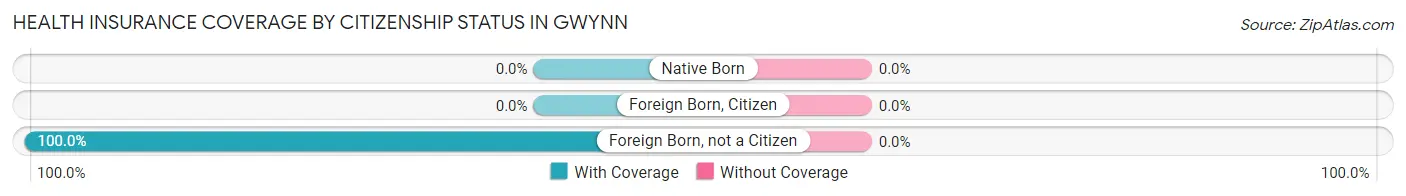
| Citizenship Status | With Coverage | Without Coverage |
| Native Born | 0 (0.0%) | 0 (0.0%) |
| Foreign Born, Citizen | 0 (0.0%) | 0 (0.0%) |
| Foreign Born, not a Citizen | 141 (100.0%) | 0 (0.0%) |
Health Insurance Coverage by Household Income in Gwynn
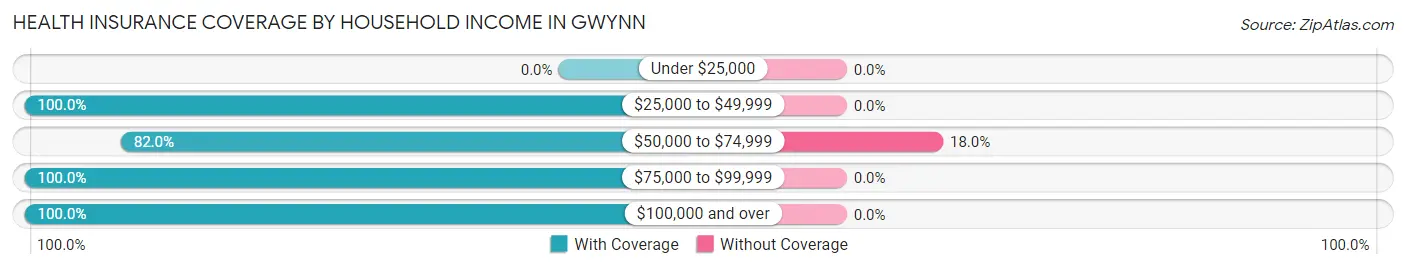
| Household Income | With Coverage | Without Coverage |
| Under $25,000 | 0 (0.0%) | 0 (0.0%) |
| $25,000 to $49,999 | 64 (100.0%) | 0 (0.0%) |
| $50,000 to $74,999 | 191 (82.0%) | 42 (18.0%) |
| $75,000 to $99,999 | 227 (100.0%) | 0 (0.0%) |
| $100,000 and over | 115 (100.0%) | 0 (0.0%) |
Public vs Private Health Insurance Coverage by Age in Gwynn
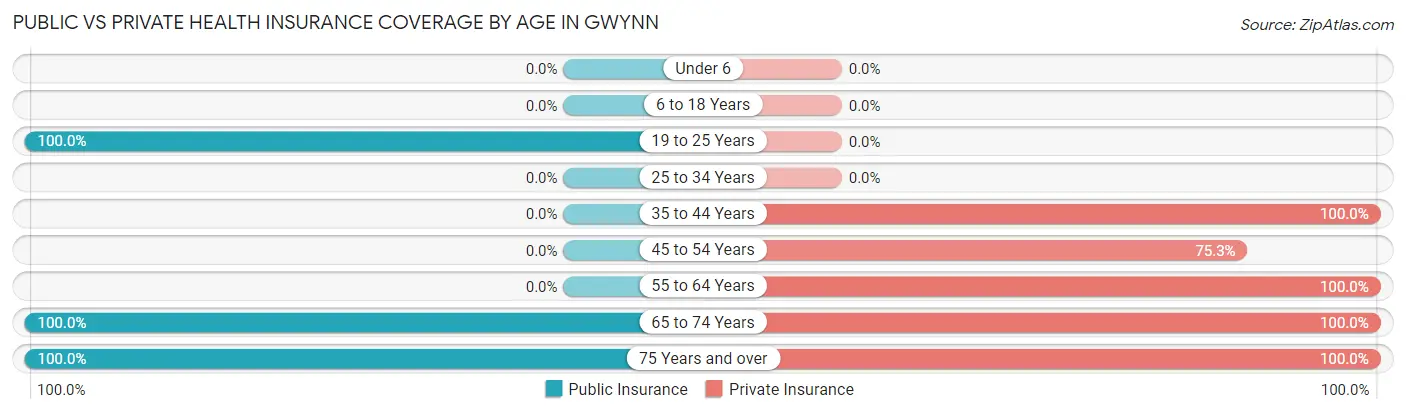
| Age Bracket | Public Insurance | Private Insurance |
| Under 6 | 0 (0.0%) | 0 (0.0%) |
| 6 to 18 Years | 0 (0.0%) | 0 (0.0%) |
| 19 to 25 Years | 141 (100.0%) | 0 (0.0%) |
| 25 to 34 Years | 0 (0.0%) | 0 (0.0%) |
| 35 to 44 Years | 0 (0.0%) | 64 (100.0%) |
| 45 to 54 Years | 0 (0.0%) | 128 (75.3%) |
| 55 to 64 Years | 0 (0.0%) | 111 (100.0%) |
| 65 to 74 Years | 80 (100.0%) | 80 (100.0%) |
| 75 Years and over | 73 (100.0%) | 73 (100.0%) |
| Total | 294 (46.0%) | 456 (71.4%) |
Disability Status by Sex by Age in Gwynn
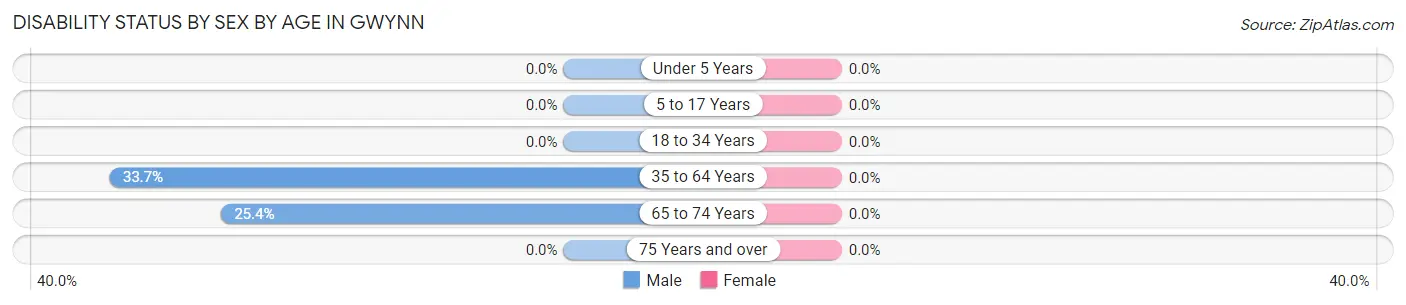
| Age Bracket | Male | Female |
| Under 5 Years | 0 (0.0%) | 0 (0.0%) |
| 5 to 17 Years | 0 (0.0%) | 0 (0.0%) |
| 18 to 34 Years | 0 (0.0%) | 0 (0.0%) |
| 35 to 64 Years | 67 (33.7%) | 0 (0.0%) |
| 65 to 74 Years | 16 (25.4%) | 0 (0.0%) |
| 75 Years and over | 0 (0.0%) | 0 (0.0%) |
Disability Class by Sex by Age in Gwynn
Disability Class: Hearing Difficulty
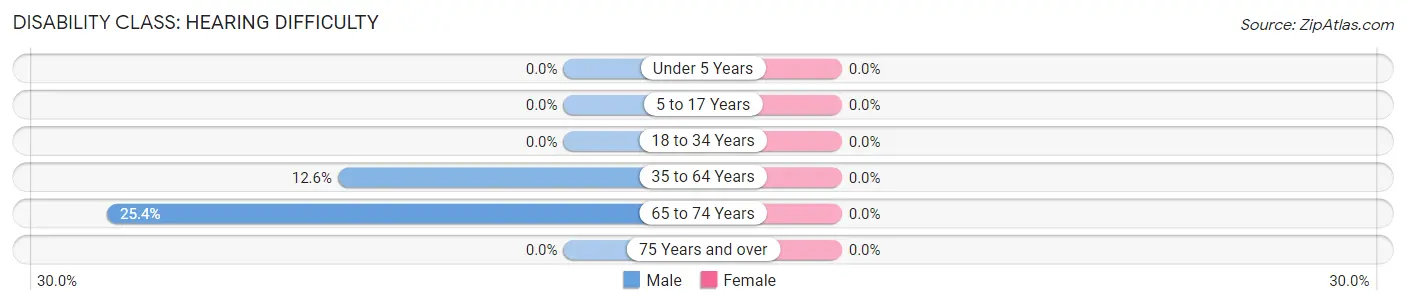
| Age Bracket | Male | Female |
| Under 5 Years | 0 (0.0%) | 0 (0.0%) |
| 5 to 17 Years | 0 (0.0%) | 0 (0.0%) |
| 18 to 34 Years | 0 (0.0%) | 0 (0.0%) |
| 35 to 64 Years | 25 (12.6%) | 0 (0.0%) |
| 65 to 74 Years | 16 (25.4%) | 0 (0.0%) |
| 75 Years and over | 0 (0.0%) | 0 (0.0%) |
Disability Class: Vision Difficulty
| Age Bracket | Male | Female |
| Under 5 Years | 0 (0.0%) | 0 (0.0%) |
| 5 to 17 Years | 0 (0.0%) | 0 (0.0%) |
| 18 to 34 Years | 0 (0.0%) | 0 (0.0%) |
| 35 to 64 Years | 0 (0.0%) | 0 (0.0%) |
| 65 to 74 Years | 0 (0.0%) | 0 (0.0%) |
| 75 Years and over | 0 (0.0%) | 0 (0.0%) |
Disability Class: Cognitive Difficulty
| Age Bracket | Male | Female |
| 5 to 17 Years | 0 (0.0%) | 0 (0.0%) |
| 18 to 34 Years | 0 (0.0%) | 0 (0.0%) |
| 35 to 64 Years | 0 (0.0%) | 0 (0.0%) |
| 65 to 74 Years | 0 (0.0%) | 0 (0.0%) |
| 75 Years and over | 0 (0.0%) | 0 (0.0%) |
Disability Class: Ambulatory Difficulty
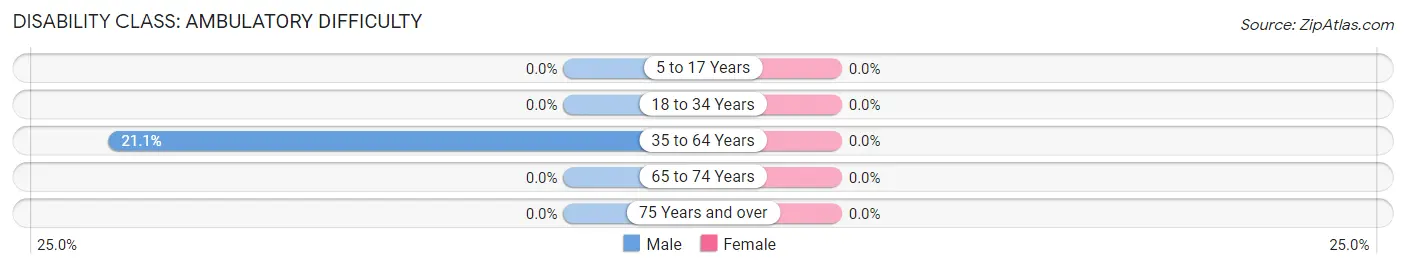
| Age Bracket | Male | Female |
| 5 to 17 Years | 0 (0.0%) | 0 (0.0%) |
| 18 to 34 Years | 0 (0.0%) | 0 (0.0%) |
| 35 to 64 Years | 42 (21.1%) | 0 (0.0%) |
| 65 to 74 Years | 0 (0.0%) | 0 (0.0%) |
| 75 Years and over | 0 (0.0%) | 0 (0.0%) |
Disability Class: Self-Care Difficulty
| Age Bracket | Male | Female |
| 5 to 17 Years | 0 (0.0%) | 0 (0.0%) |
| 18 to 34 Years | 0 (0.0%) | 0 (0.0%) |
| 35 to 64 Years | 0 (0.0%) | 0 (0.0%) |
| 65 to 74 Years | 0 (0.0%) | 0 (0.0%) |
| 75 Years and over | 0 (0.0%) | 0 (0.0%) |
Technology Access in Gwynn
Computing Device Access in Gwynn
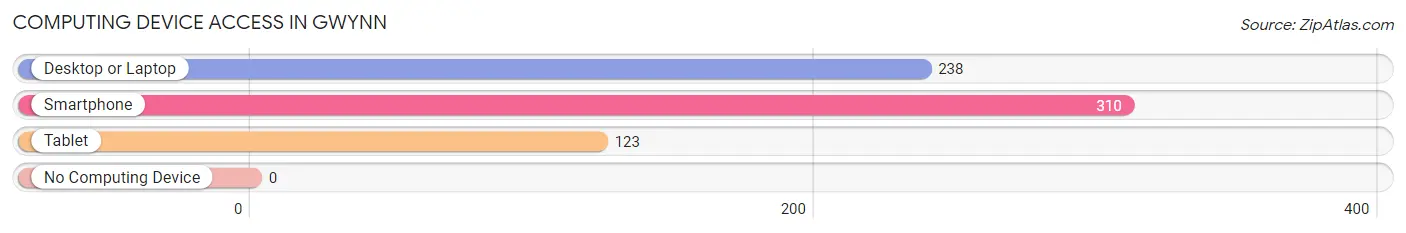
| Device Type | # Households | % Households |
| Desktop or Laptop | 238 | 76.8% |
| Smartphone | 310 | 100.0% |
| Tablet | 123 | 39.7% |
| No Computing Device | 0 | 0.0% |
| Total | 310 | 100.0% |
Internet Access in Gwynn
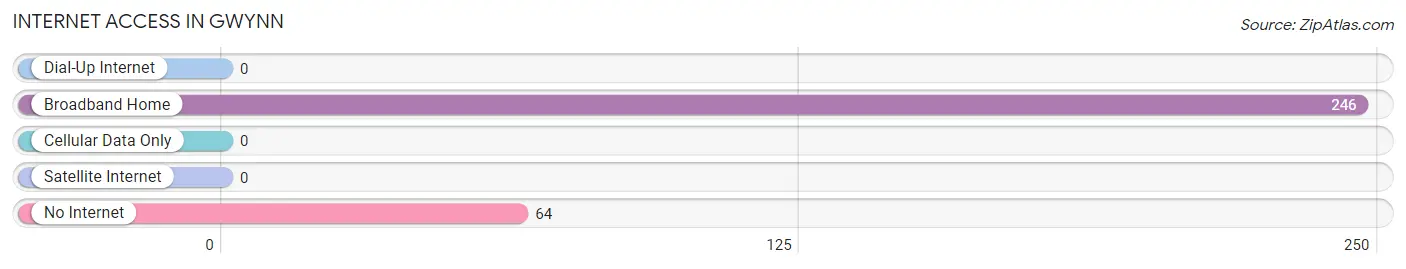
| Internet Type | # Households | % Households |
| Dial-Up Internet | 0 | 0.0% |
| Broadband Home | 246 | 79.3% |
| Cellular Data Only | 0 | 0.0% |
| Satellite Internet | 0 | 0.0% |
| No Internet | 64 | 20.6% |
| Total | 310 | 100.0% |
Gwynn Summary
Gwynn, Virginia is a small unincorporated community located in King and Queen County, Virginia. It is situated on the banks of the Mattaponi River, approximately 25 miles east of Richmond. The population of Gwynn is estimated to be around 200 people.
History
Gwynn was first settled in the early 1700s by English colonists. The town was named after the Gwynn family, who were among the first settlers. The Gwynn family owned a large plantation in the area, and the town was built around it. The plantation was eventually sold to the King and Queen County government in the late 1800s.
In the early 1900s, Gwynn was a thriving community with a post office, a general store, a blacksmith shop, and a school. The town was also home to a number of churches, including the Gwynn Baptist Church, which was founded in 1883.
Geography
Gwynn is located in King and Queen County, Virginia. It is situated on the banks of the Mattaponi River, approximately 25 miles east of Richmond. The town is surrounded by rolling hills and forests, and is located in a rural area.
The climate in Gwynn is humid subtropical, with hot, humid summers and mild winters. The average annual temperature is around 60 degrees Fahrenheit.
Economy
The economy of Gwynn is largely based on agriculture. The town is home to several farms, which produce a variety of crops, including corn, soybeans, and wheat. The town also has a number of small businesses, including a general store, a gas station, and a restaurant.
Demographics
The population of Gwynn is estimated to be around 200 people. The town is predominantly white, with a small African American population. The median household income is around $35,000, and the median home value is around $100,000.
Conclusion
Gwynn, Virginia is a small unincorporated community located in King and Queen County, Virginia. It is situated on the banks of the Mattaponi River, approximately 25 miles east of Richmond. The town has a rich history, and is home to a number of small businesses and farms. The population of Gwynn is estimated to be around 200 people, and the town is predominantly white, with a small African American population. The economy of Gwynn is largely based on agriculture, and the median household income is around $35,000.
Common Questions
What is Per Capita Income in Gwynn?
Per Capita income in Gwynn is $45,863.
What is the Median Family Income in Gwynn?
Median Family Income in Gwynn is $89,028.
What is the Median Household income in Gwynn?
Median Household Income in Gwynn is $89,009.
What is Income or Wage Gap in Gwynn?
Income or Wage Gap in Gwynn is 42.2%.
Women in Gwynn earn 57.8 cents for every dollar earned by a man.
What is Inequality or Gini Index in Gwynn?
Inequality or Gini Index in Gwynn is 0.26.
What is the Total Population of Gwynn?
Total Population of Gwynn is 639.
What is the Total Male Population of Gwynn?
Total Male Population of Gwynn is 296.
What is the Total Female Population of Gwynn?
Total Female Population of Gwynn is 343.
What is the Ratio of Males per 100 Females in Gwynn?
There are 86.30 Males per 100 Females in Gwynn.
What is the Ratio of Females per 100 Males in Gwynn?
There are 115.88 Females per 100 Males in Gwynn.
What is the Median Population Age in Gwynn?
Median Population Age in Gwynn is 52.6 Years.
What is the Average Family Size in Gwynn
Average Family Size in Gwynn is 2.9 People.
What is the Average Household Size in Gwynn
Average Household Size in Gwynn is 2.1 People.
How Large is the Labor Force in Gwynn?
There are 293 People in the Labor Forcein in Gwynn.
What is the Percentage of People in the Labor Force in Gwynn?
45.9% of People are in the Labor Force in Gwynn.