New River, VA Map & Demographics
New River Map
New River Overview
$40,387
PER CAPITA INCOME
$111,337
AVG FAMILY INCOME
0.31
INEQUALITY / GINI INDEX
387
TOTAL POPULATION
152
MALE POPULATION
235
FEMALE POPULATION
64.68
MALES / 100 FEMALES
154.61
FEMALES / 100 MALES
52.9
MEDIAN AGE
2.7
AVG FAMILY SIZE
1.9
AVG HOUSEHOLD SIZE
335
LABOR FORCE [ PEOPLE ]
86.6%
PERCENT IN LABOR FORCE
4.2%
UNEMPLOYMENT RATE
New River Zip Codes
New River Area Codes
Income in New River
Income Overview in New River
| Characteristic | Number | Measure |
| Per Capita Income | 387 | $40,387 |
| Median Family Income | 111 | $111,337 |
| Mean Family Income | 111 | $110,514 |
| Median Household Income | 203 | $0 |
| Mean Household Income | 203 | $77,400 |
| Income Deficit | 111 | $0 |
| Wage / Income Gap (%) | 387 | 0.00% |
| Wage / Income Gap ($) | 387 | 100.00¢ per $1 |
| Gini / Inequality Index | 387 | 0.31 |
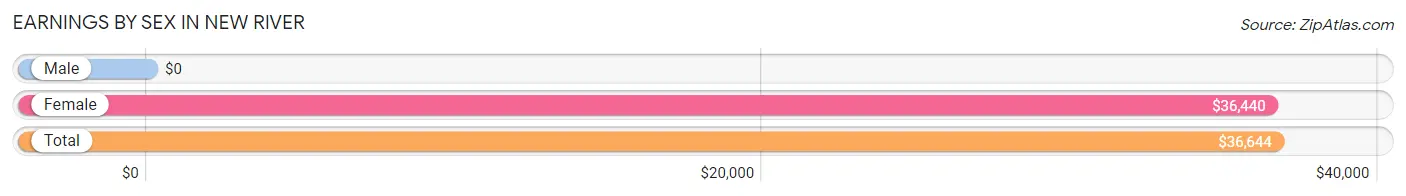
Earnings by Sex in New River
| Sex | Number | Average Earnings |
| Male | 113 (33.7%) | $0 |
| Female | 222 (66.3%) | $36,440 |
| Total | 335 (100.0%) | $36,644 |
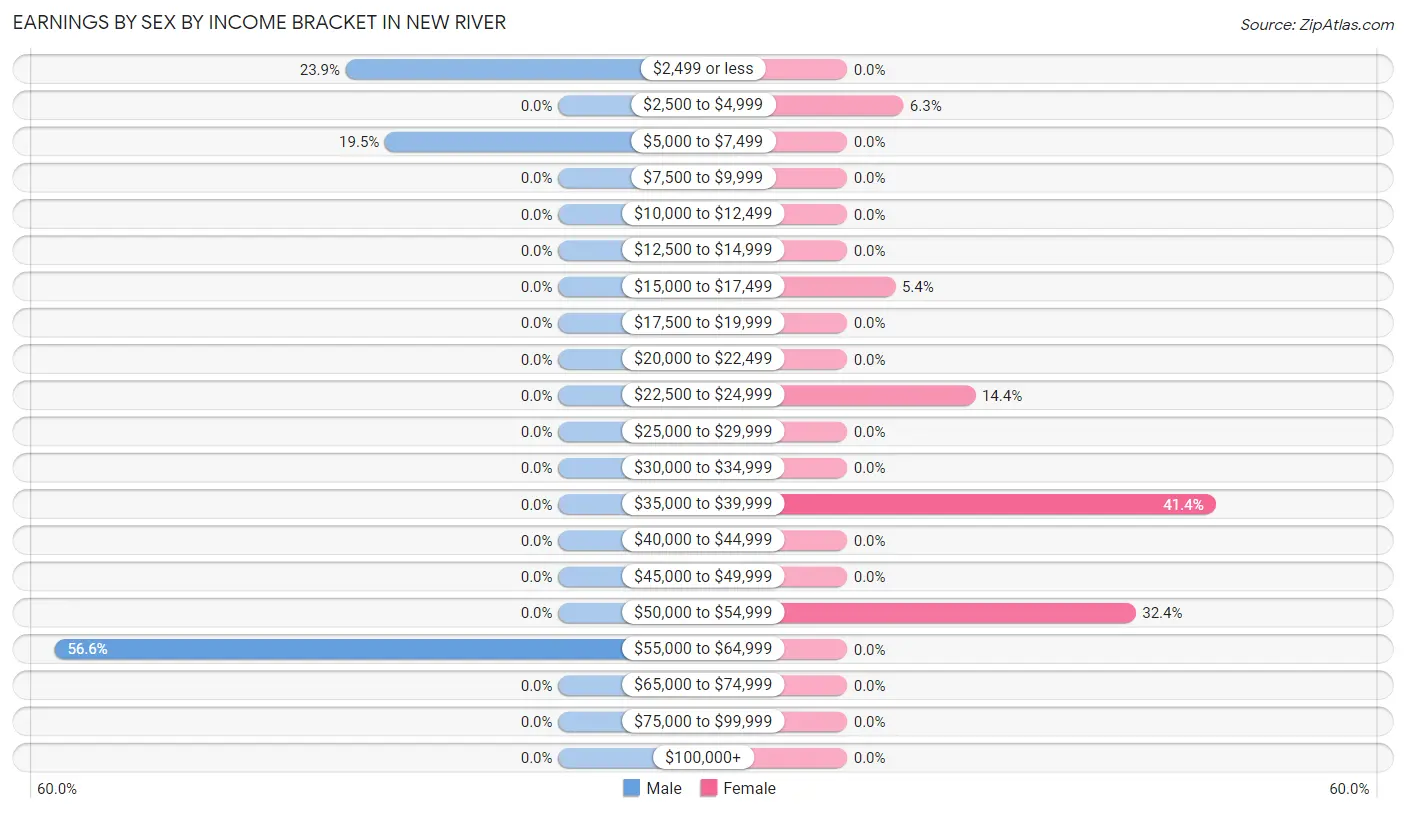
Earnings by Sex by Income Bracket in New River
The most common earnings brackets in New River are $55,000 to $64,999 for men (64 | 56.6%) and $35,000 to $39,999 for women (92 | 41.4%).
| Income | Male | Female |
| $2,499 or less | 27 (23.9%) | 0 (0.0%) |
| $2,500 to $4,999 | 0 (0.0%) | 14 (6.3%) |
| $5,000 to $7,499 | 22 (19.5%) | 0 (0.0%) |
| $7,500 to $9,999 | 0 (0.0%) | 0 (0.0%) |
| $10,000 to $12,499 | 0 (0.0%) | 0 (0.0%) |
| $12,500 to $14,999 | 0 (0.0%) | 0 (0.0%) |
| $15,000 to $17,499 | 0 (0.0%) | 12 (5.4%) |
| $17,500 to $19,999 | 0 (0.0%) | 0 (0.0%) |
| $20,000 to $22,499 | 0 (0.0%) | 0 (0.0%) |
| $22,500 to $24,999 | 0 (0.0%) | 32 (14.4%) |
| $25,000 to $29,999 | 0 (0.0%) | 0 (0.0%) |
| $30,000 to $34,999 | 0 (0.0%) | 0 (0.0%) |
| $35,000 to $39,999 | 0 (0.0%) | 92 (41.4%) |
| $40,000 to $44,999 | 0 (0.0%) | 0 (0.0%) |
| $45,000 to $49,999 | 0 (0.0%) | 0 (0.0%) |
| $50,000 to $54,999 | 0 (0.0%) | 72 (32.4%) |
| $55,000 to $64,999 | 64 (56.6%) | 0 (0.0%) |
| $65,000 to $74,999 | 0 (0.0%) | 0 (0.0%) |
| $75,000 to $99,999 | 0 (0.0%) | 0 (0.0%) |
| $100,000+ | 0 (0.0%) | 0 (0.0%) |
| Total | 113 (100.0%) | 222 (100.0%) |
Earnings by Sex by Educational Attainment in New River
| Educational Attainment | Male Income | Female Income |
| Less than High School | - | - |
| High School Diploma | - | - |
| College or Associate's Degree | - | - |
| Bachelor's Degree | - | - |
| Graduate Degree | - | - |
| Total | - | - |
Family Income in New River
Family Income Brackets in New River
According to the New River family income data, there are 72 families falling into the $100,000 to $149,999 income range, which is the most common income bracket and makes up 64.9% of all families.
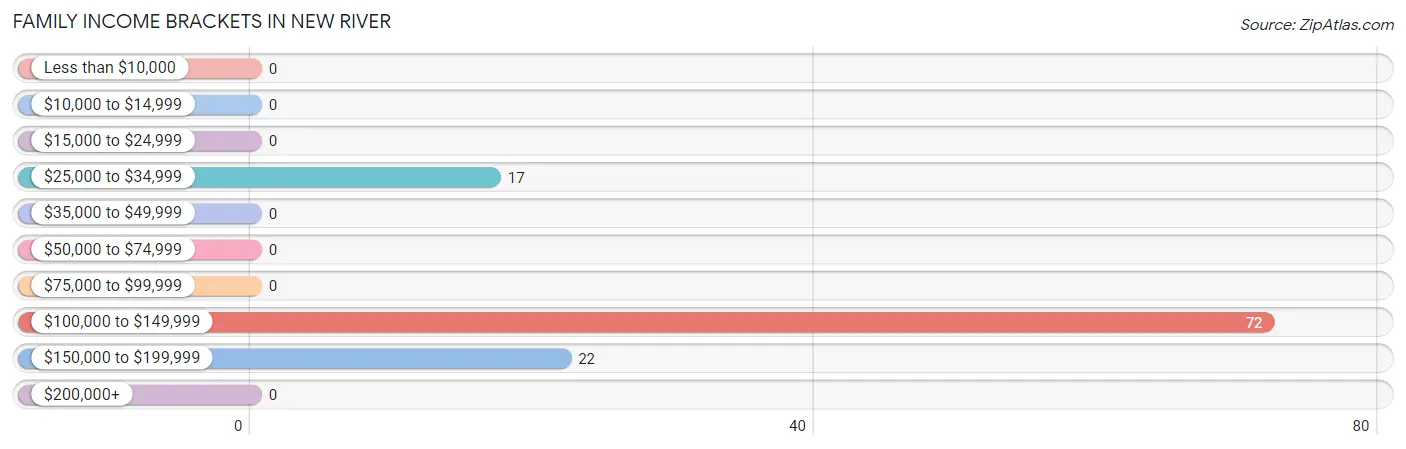
| Income Bracket | # Families | % Families |
| Less than $10,000 | 0 | 0.0% |
| $10,000 to $14,999 | 0 | 0.0% |
| $15,000 to $24,999 | 0 | 0.0% |
| $25,000 to $34,999 | 17 | 15.3% |
| $35,000 to $49,999 | 0 | 0.0% |
| $50,000 to $74,999 | 0 | 0.0% |
| $75,000 to $99,999 | 0 | 0.0% |
| $100,000 to $149,999 | 72 | 64.9% |
| $150,000 to $199,999 | 22 | 19.8% |
| $200,000+ | 0 | 0.0% |
Family Income by Famaliy Size in New River
| Income Bracket | # Families | Median Income |
| 2-Person Families | 79 (71.2%) | $0 |
| 3-Person Families | 17 (15.3%) | $0 |
| 4-Person Families | 15 (13.5%) | $0 |
| 5-Person Families | 0 (0.0%) | $0 |
| 6-Person Families | 0 (0.0%) | $0 |
| 7+ Person Families | 0 (0.0%) | $0 |
| Total | 111 (100.0%) | $111,337 |
Family Income by Number of Earners in New River
| Number of Earners | # Families | Median Income |
| No Earners | 7 (6.3%) | $0 |
| 1 Earner | 0 (0.0%) | $0 |
| 2 Earners | 89 (80.2%) | $0 |
| 3+ Earners | 15 (13.5%) | $0 |
| Total | 111 (100.0%) | $111,337 |
Household Income in New River
Household Income Brackets in New River
With 92 households falling in the category, the $35,000 to $49,999 income range is the most frequent in New River, accounting for 45.3% of all households.
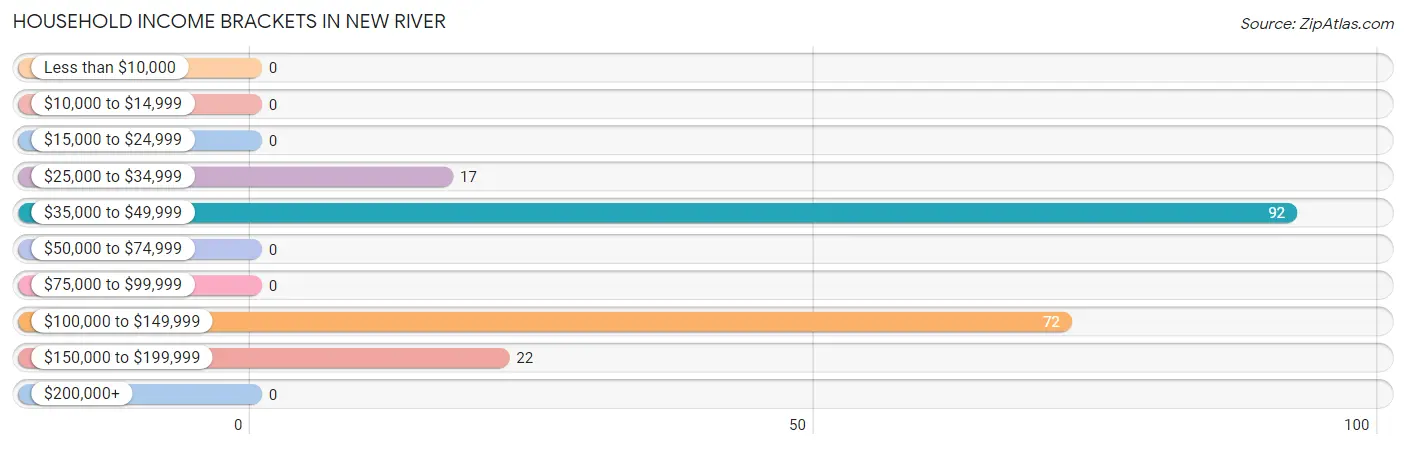
| Income Bracket | # Households | % Households |
| Less than $10,000 | 0 | 0.0% |
| $10,000 to $14,999 | 0 | 0.0% |
| $15,000 to $24,999 | 0 | 0.0% |
| $25,000 to $34,999 | 17 | 8.4% |
| $35,000 to $49,999 | 92 | 45.3% |
| $50,000 to $74,999 | 0 | 0.0% |
| $75,000 to $99,999 | 0 | 0.0% |
| $100,000 to $149,999 | 72 | 35.5% |
| $150,000 to $199,999 | 22 | 10.8% |
| $200,000+ | 0 | 0.0% |
Household Income by Householder Age in New River
The median household income in New River is $0, with the highest median household income of $111,215 found in the 45 to 64 years age bracket for the primary householder. A total of 104 households (51.2%) fall into this category.
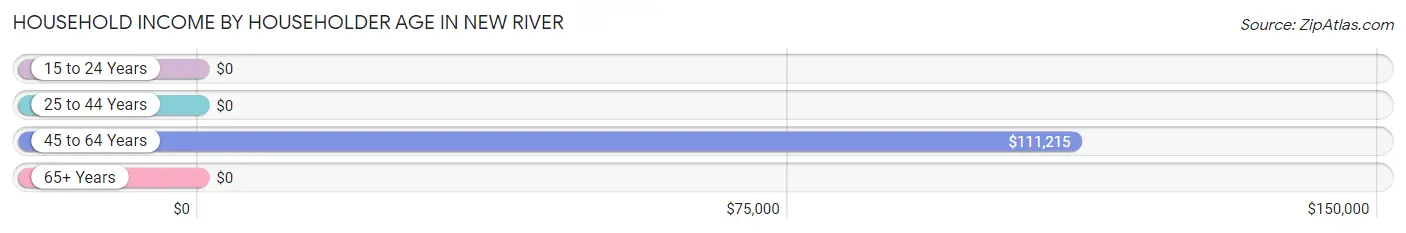
| Income Bracket | # Households | Median Income |
| 15 to 24 Years | 0 (0.0%) | $0 |
| 25 to 44 Years | 0 (0.0%) | $0 |
| 45 to 64 Years | 104 (51.2%) | $111,215 |
| 65+ Years | 99 (48.8%) | $0 |
| Total | 203 (100.0%) | $0 |
Poverty in New River
Income Below Poverty by Sex and Age in New River
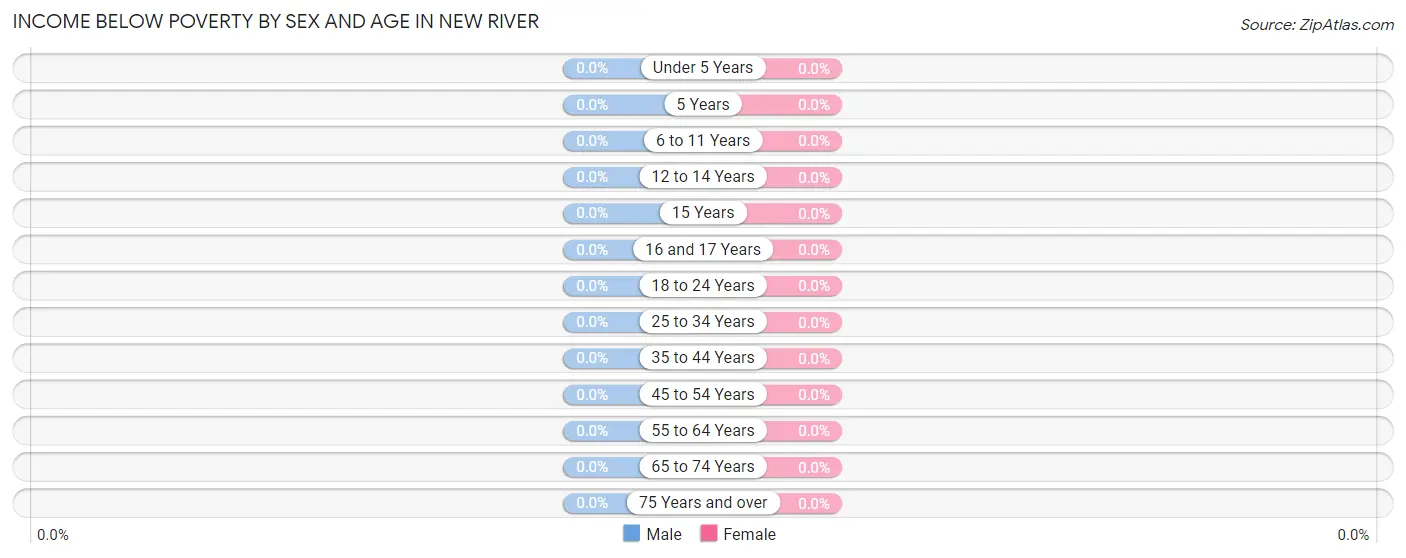
| Age Bracket | Male | Female |
| Under 5 Years | 0 (0.0%) | 0 (0.0%) |
| 5 Years | 0 (0.0%) | 0 (0.0%) |
| 6 to 11 Years | 0 (0.0%) | 0 (0.0%) |
| 12 to 14 Years | 0 (0.0%) | 0 (0.0%) |
| 15 Years | 0 (0.0%) | 0 (0.0%) |
| 16 and 17 Years | 0 (0.0%) | 0 (0.0%) |
| 18 to 24 Years | 0 (0.0%) | 0 (0.0%) |
| 25 to 34 Years | 0 (0.0%) | 0 (0.0%) |
| 35 to 44 Years | 0 (0.0%) | 0 (0.0%) |
| 45 to 54 Years | 0 (0.0%) | 0 (0.0%) |
| 55 to 64 Years | 0 (0.0%) | 0 (0.0%) |
| 65 to 74 Years | 0 (0.0%) | 0 (0.0%) |
| 75 Years and over | 0 (0.0%) | 0 (0.0%) |
| Total | 0 (0.0%) | 0 (0.0%) |
Income Above Poverty by Sex and Age in New River
According to the poverty statistics in New River, males aged 18 to 24 years and females aged 18 to 24 years are the age groups that are most secure financially, with 100.0% of males and 100.0% of females in these age groups living above the poverty line.
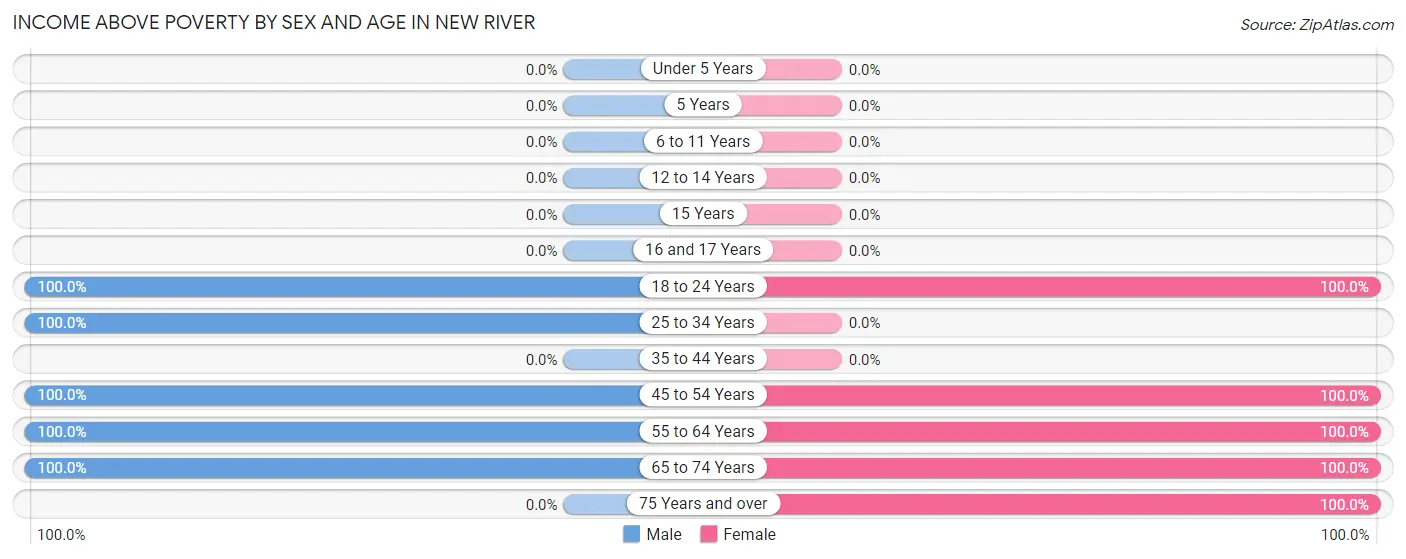
| Age Bracket | Male | Female |
| Under 5 Years | 0 (0.0%) | 0 (0.0%) |
| 5 Years | 0 (0.0%) | 0 (0.0%) |
| 6 to 11 Years | 0 (0.0%) | 0 (0.0%) |
| 12 to 14 Years | 0 (0.0%) | 0 (0.0%) |
| 15 Years | 0 (0.0%) | 0 (0.0%) |
| 16 and 17 Years | 0 (0.0%) | 0 (0.0%) |
| 18 to 24 Years | 22 (100.0%) | 12 (100.0%) |
| 25 to 34 Years | 27 (100.0%) | 0 (0.0%) |
| 35 to 44 Years | 0 (0.0%) | 0 (0.0%) |
| 45 to 54 Years | 64 (100.0%) | 72 (100.0%) |
| 55 to 64 Years | 32 (100.0%) | 46 (100.0%) |
| 65 to 74 Years | 7 (100.0%) | 92 (100.0%) |
| 75 Years and over | 0 (0.0%) | 13 (100.0%) |
| Total | 152 (100.0%) | 235 (100.0%) |
Income Below Poverty Among Married-Couple Families in New River
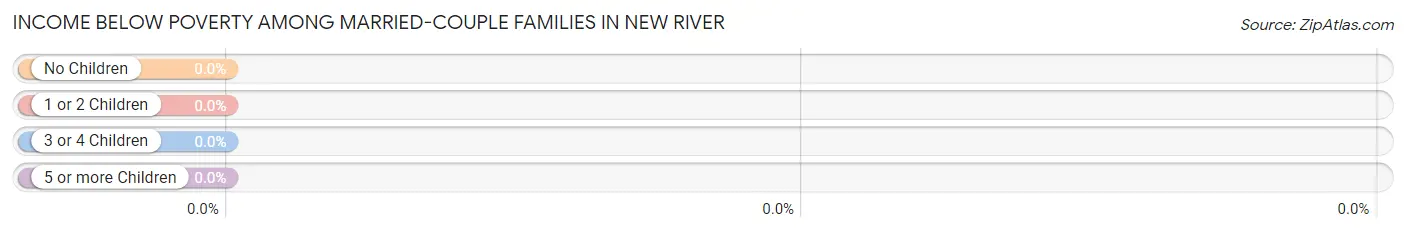
| Children | Above Poverty | Below Poverty |
| No Children | 111 (100.0%) | 0 (0.0%) |
| 1 or 2 Children | 0 (0.0%) | 0 (0.0%) |
| 3 or 4 Children | 0 (0.0%) | 0 (0.0%) |
| 5 or more Children | 0 (0.0%) | 0 (0.0%) |
| Total | 111 (100.0%) | 0 (0.0%) |
Income Below Poverty Among Single-Parent Households in New River
| Children | Single Father | Single Mother |
| No Children | 0 (0.0%) | 0 (0.0%) |
| 1 or 2 Children | 0 (0.0%) | 0 (0.0%) |
| 3 or 4 Children | 0 (0.0%) | 0 (0.0%) |
| 5 or more Children | 0 (0.0%) | 0 (0.0%) |
| Total | 0 (0.0%) | 0 (0.0%) |
Income Below Poverty Among Married-Couple vs Single-Parent Households in New River
| Children | Married-Couple Families | Single-Parent Households |
| No Children | 0 (0.0%) | 0 (0.0%) |
| 1 or 2 Children | 0 (0.0%) | 0 (0.0%) |
| 3 or 4 Children | 0 (0.0%) | 0 (0.0%) |
| 5 or more Children | 0 (0.0%) | 0 (0.0%) |
| Total | 0 (0.0%) | 0 (0.0%) |
Race in New River
The most populous races in New River are White / Caucasian (199 | 51.4%), and Black / African American (188 | 48.6%).
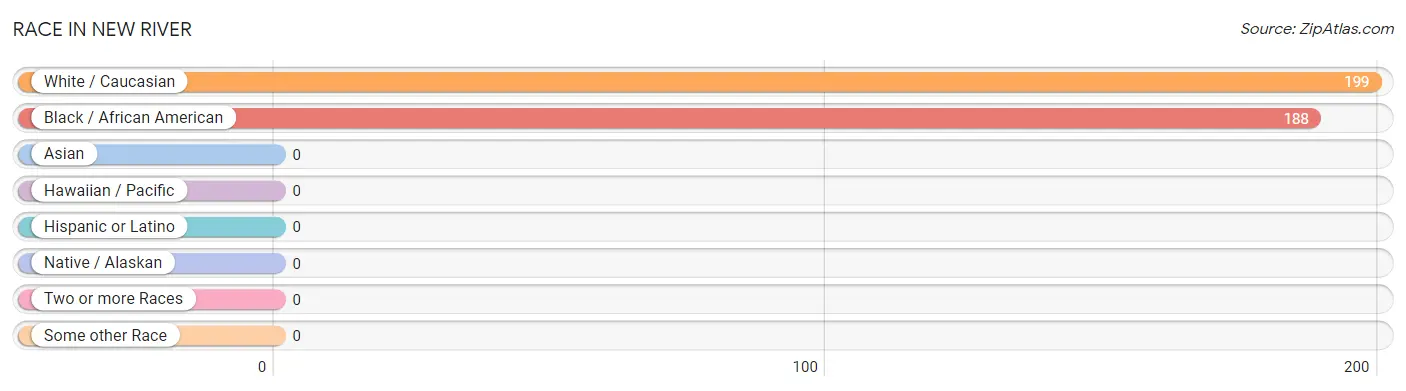
| Race | # Population | % Population |
| Asian | 0 | 0.0% |
| Black / African American | 188 | 48.6% |
| Hawaiian / Pacific | 0 | 0.0% |
| Hispanic or Latino | 0 | 0.0% |
| Native / Alaskan | 0 | 0.0% |
| White / Caucasian | 199 | 51.4% |
| Two or more Races | 0 | 0.0% |
| Some other Race | 0 | 0.0% |
| Total | 387 | 100.0% |
Ancestry in New River
The most populous ancestries reported in New River are American (136 | 35.1%), English (63 | 16.3%), and Irish (63 | 16.3%), together accounting for 67.7% of all New River residents.
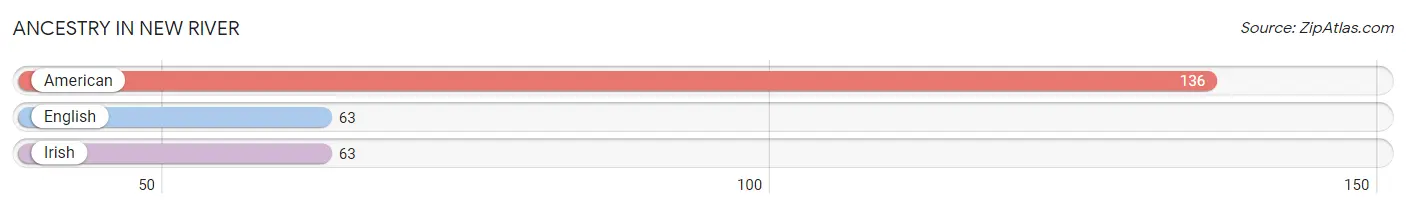
| Ancestry | # Population | % Population |
| American | 136 | 35.1% |
| English | 63 | 16.3% |
| Irish | 63 | 16.3% | View All 3 Rows |
Immigrants in New River

| Immigration Origin | # Population | % Population | View All 0 Rows |
Sex and Age in New River
Sex and Age in New River
The most populous age groups in New River are 50 to 54 Years (64 | 42.1%) for men and 65 to 69 Years (92 | 39.2%) for women.
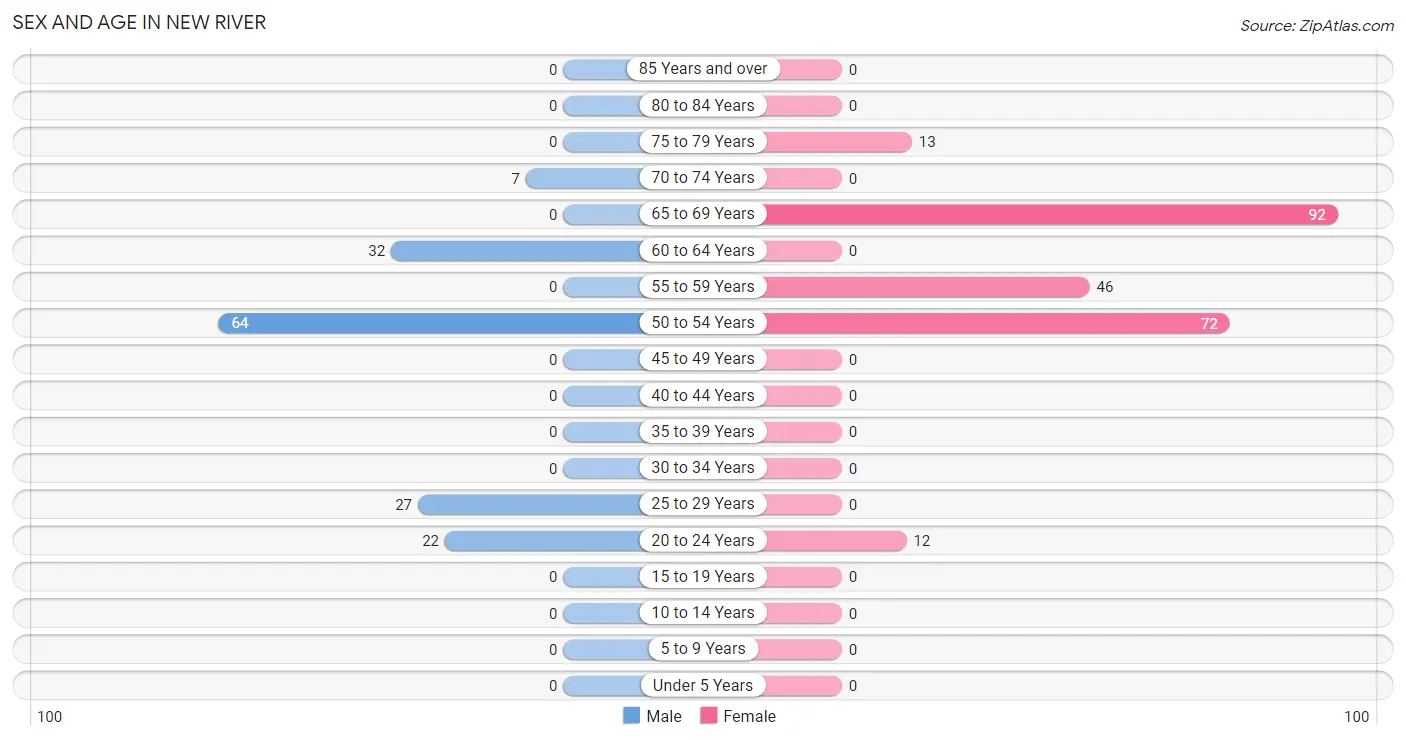
| Age Bracket | Male | Female |
| Under 5 Years | 0 (0.0%) | 0 (0.0%) |
| 5 to 9 Years | 0 (0.0%) | 0 (0.0%) |
| 10 to 14 Years | 0 (0.0%) | 0 (0.0%) |
| 15 to 19 Years | 0 (0.0%) | 0 (0.0%) |
| 20 to 24 Years | 22 (14.5%) | 12 (5.1%) |
| 25 to 29 Years | 27 (17.8%) | 0 (0.0%) |
| 30 to 34 Years | 0 (0.0%) | 0 (0.0%) |
| 35 to 39 Years | 0 (0.0%) | 0 (0.0%) |
| 40 to 44 Years | 0 (0.0%) | 0 (0.0%) |
| 45 to 49 Years | 0 (0.0%) | 0 (0.0%) |
| 50 to 54 Years | 64 (42.1%) | 72 (30.6%) |
| 55 to 59 Years | 0 (0.0%) | 46 (19.6%) |
| 60 to 64 Years | 32 (21.0%) | 0 (0.0%) |
| 65 to 69 Years | 0 (0.0%) | 92 (39.2%) |
| 70 to 74 Years | 7 (4.6%) | 0 (0.0%) |
| 75 to 79 Years | 0 (0.0%) | 13 (5.5%) |
| 80 to 84 Years | 0 (0.0%) | 0 (0.0%) |
| 85 Years and over | 0 (0.0%) | 0 (0.0%) |
| Total | 152 (100.0%) | 235 (100.0%) |
Families and Households in New River
Median Family Size in New River
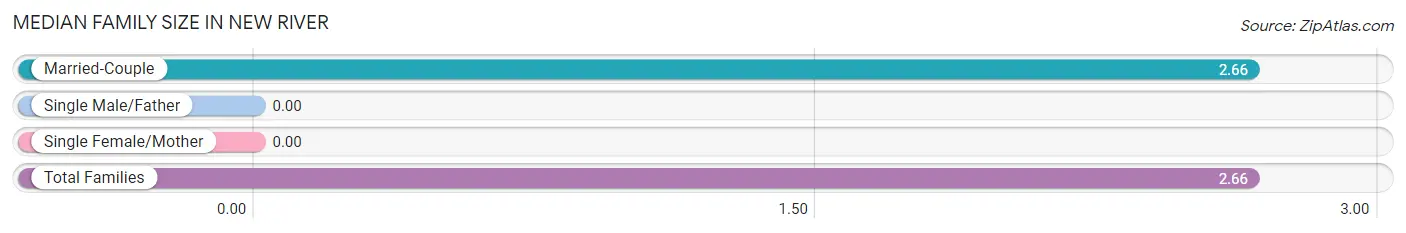
| Family Type | # Families | Family Size |
| Married-Couple | 111 (100.0%) | 2.66 |
| Single Male/Father | 0 (0.0%) | - |
| Single Female/Mother | 0 (0.0%) | - |
| Total Families | 111 (100.0%) | 2.66 |
Median Household Size in New River
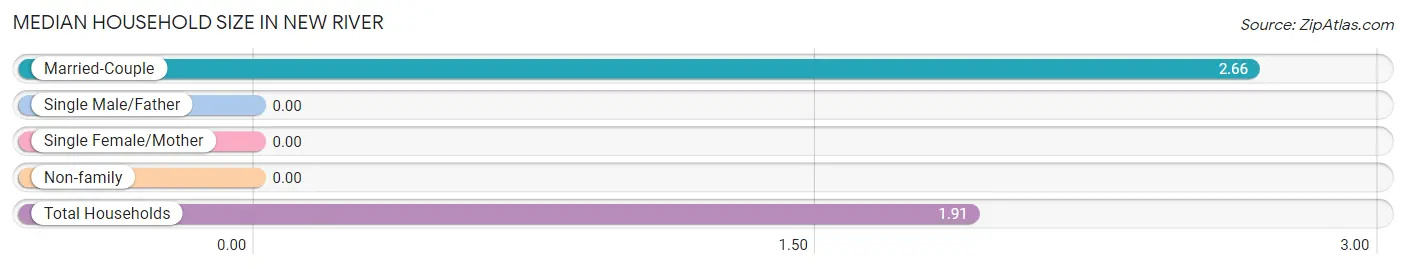
| Household Type | # Households | Household Size |
| Married-Couple | 111 (54.7%) | 2.66 |
| Single Male/Father | 0 (0.0%) | - |
| Single Female/Mother | 0 (0.0%) | - |
| Non-family | 92 (45.3%) | - |
| Total Households | 203 (100.0%) | 1.91 |
Household Size by Marriage Status in New River
Out of a total of 203 households in New River, 111 (54.7%) are family households, while 92 (45.3%) are nonfamily households. The most numerous type of family households are 2-person households, comprising 79, and the most common type of nonfamily households are 1-person households, comprising 92.
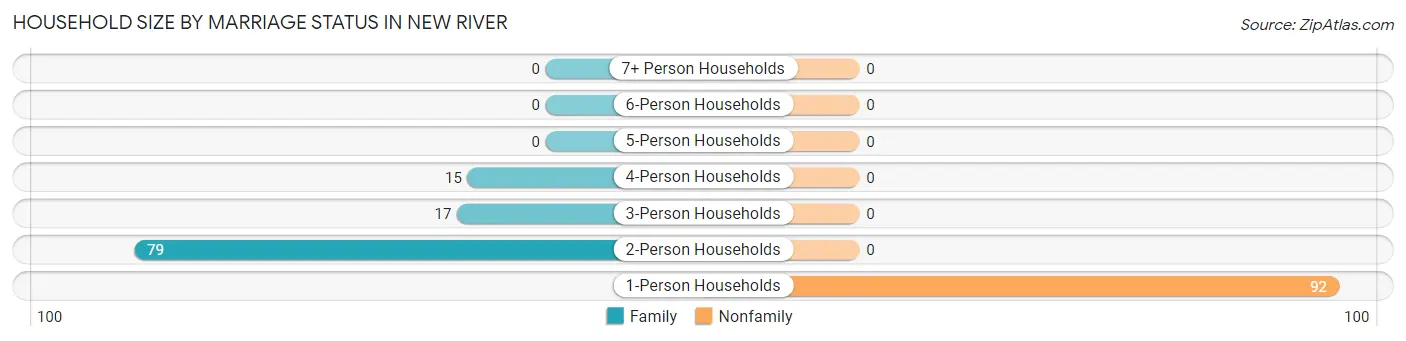
| Household Size | Family Households | Nonfamily Households |
| 1-Person Households | - | 92 (45.3%) |
| 2-Person Households | 79 (38.9%) | 0 (0.0%) |
| 3-Person Households | 17 (8.4%) | 0 (0.0%) |
| 4-Person Households | 15 (7.4%) | 0 (0.0%) |
| 5-Person Households | 0 (0.0%) | 0 (0.0%) |
| 6-Person Households | 0 (0.0%) | 0 (0.0%) |
| 7+ Person Households | 0 (0.0%) | 0 (0.0%) |
| Total | 111 (54.7%) | 92 (45.3%) |
Female Fertility in New River
Fertility by Age in New River
| Age Bracket | Women with Births | Births / 1,000 Women |
| 15 to 19 years | 0 (0.0%) | 0.0 |
| 20 to 34 years | 0 (0.0%) | 0.0 |
| 35 to 50 years | 0 (0.0%) | 0.0 |
| Total | 0 (0.0%) | 0.0 |
Fertility by Age by Marriage Status in New River
| Age Bracket | Married | Unmarried |
| 15 to 19 years | 0 (0.0%) | 0 (0.0%) |
| 20 to 34 years | 0 (0.0%) | 0 (0.0%) |
| 35 to 50 years | 0 (0.0%) | 0 (0.0%) |
| Total | 0 (0.0%) | 0 (0.0%) |
Fertility by Education in New River
| Educational Attainment | Women with Births | Births / 1,000 Women |
| Less than High School | 0 (0.0%) | 0.0 |
| High School Diploma | 0 (0.0%) | 0.0 |
| College or Associate's Degree | 0 (0.0%) | 0.0 |
| Bachelor's Degree | 0 (0.0%) | 0.0 |
| Graduate Degree | 0 (0.0%) | 0.0 |
| Total | 0 (0.0%) | 0.0 |
Fertility by Education by Marriage Status in New River
| Educational Attainment | Married | Unmarried |
| Less than High School | 0 (0.0%) | 0 (0.0%) |
| High School Diploma | 0 (0.0%) | 0 (0.0%) |
| College or Associate's Degree | 0 (0.0%) | 0 (0.0%) |
| Bachelor's Degree | 0 (0.0%) | 0 (0.0%) |
| Graduate Degree | 0 (0.0%) | 0 (0.0%) |
| Total | 0 (0.0%) | 0 (0.0%) |
Employment Characteristics in New River
Employment by Class of Employer in New River
Among the 299 employed individuals in New River, private company employees (163 | 54.5%), state government employees (72 | 24.1%), and local government employees (64 | 21.4%) make up the most common classes of employment.
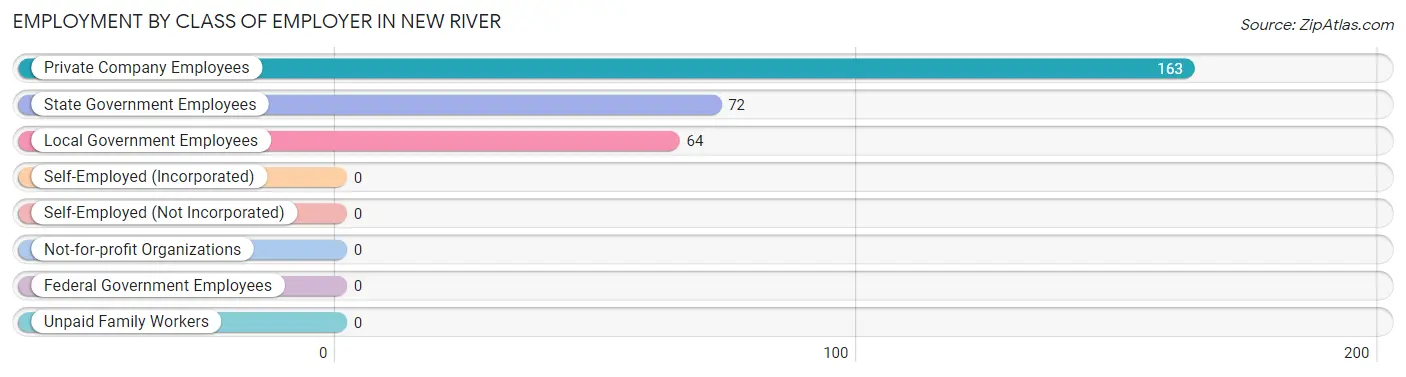
| Employer Class | # Employees | % Employees |
| Private Company Employees | 163 | 54.5% |
| Self-Employed (Incorporated) | 0 | 0.0% |
| Self-Employed (Not Incorporated) | 0 | 0.0% |
| Not-for-profit Organizations | 0 | 0.0% |
| Local Government Employees | 64 | 21.4% |
| State Government Employees | 72 | 24.1% |
| Federal Government Employees | 0 | 0.0% |
| Unpaid Family Workers | 0 | 0.0% |
| Total | 299 | 100.0% |
Employment Status by Age in New River
According to the labor force statistics for New River, out of the total population over 16 years of age (387), 86.6% or 335 individuals are in the labor force, with 4.2% or 14 of them unemployed. The age group with the highest labor force participation rate is 20 to 24 years, with 100.0% or 34 individuals in the labor force. Within the labor force, the 55 to 59 years age range has the highest percentage of unemployed individuals, with 30.4% or 14 of them being unemployed.
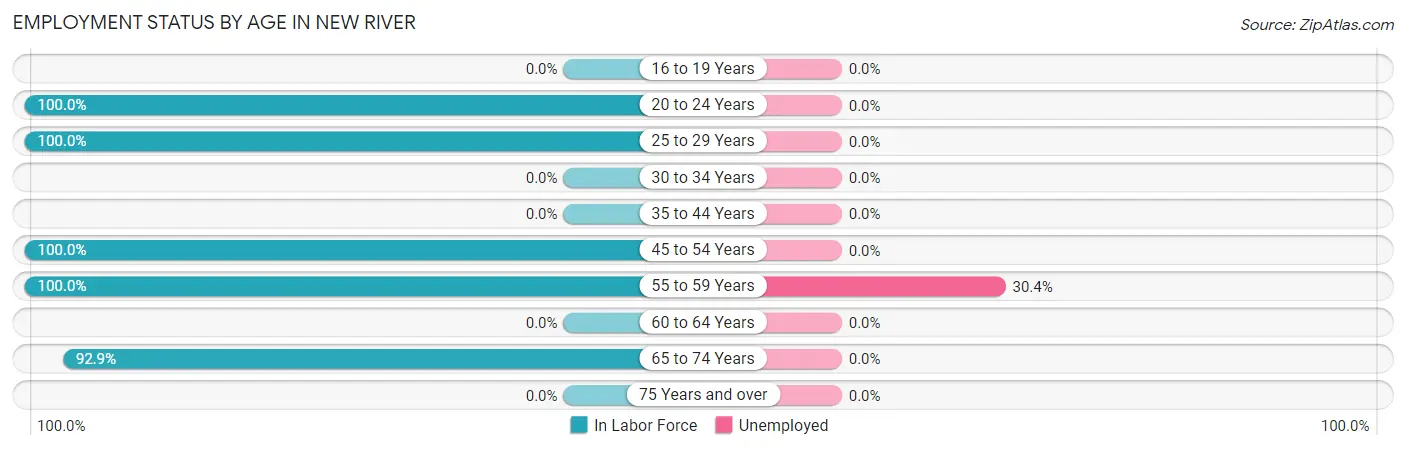
| Age Bracket | In Labor Force | Unemployed |
| 16 to 19 Years | 0 (0.0%) | 0 (0.0%) |
| 20 to 24 Years | 34 (100.0%) | 0 (0.0%) |
| 25 to 29 Years | 27 (100.0%) | 0 (0.0%) |
| 30 to 34 Years | 0 (0.0%) | 0 (0.0%) |
| 35 to 44 Years | 0 (0.0%) | 0 (0.0%) |
| 45 to 54 Years | 136 (100.0%) | 0 (0.0%) |
| 55 to 59 Years | 46 (100.0%) | 14 (30.4%) |
| 60 to 64 Years | 0 (0.0%) | 0 (0.0%) |
| 65 to 74 Years | 92 (92.9%) | 0 (0.0%) |
| 75 Years and over | 0 (0.0%) | 0 (0.0%) |
| Total | 335 (86.6%) | 14 (4.2%) |
Employment Status by Educational Attainment in New River
According to labor force statistics for New River, 86.7% of individuals (209) out of the total population between 25 and 64 years of age (241) are in the labor force, with 6.7% or 14 of them being unemployed. The group with the highest labor force participation rate are those with the educational attainment of high school diploma, with 100.0% or 59 individuals in the labor force. Within the labor force, individuals with bachelor's degree or higher education have the highest percentage of unemployment, with 9.3% or 14 of them being unemployed.
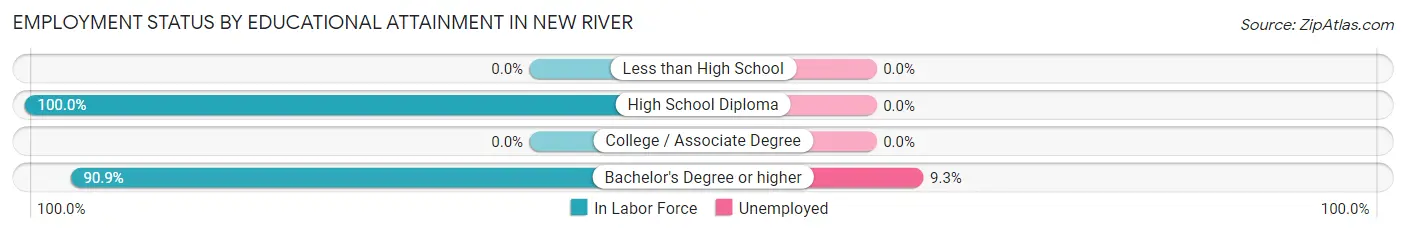
| Educational Attainment | In Labor Force | Unemployed |
| Less than High School | 0 (0.0%) | 0 (0.0%) |
| High School Diploma | 59 (100.0%) | 0 (0.0%) |
| College / Associate Degree | 0 (0.0%) | 0 (0.0%) |
| Bachelor's Degree or higher | 150 (90.9%) | 15 (9.3%) |
| Total | 209 (86.7%) | 16 (6.7%) |
Employment Occupations by Sex in New River
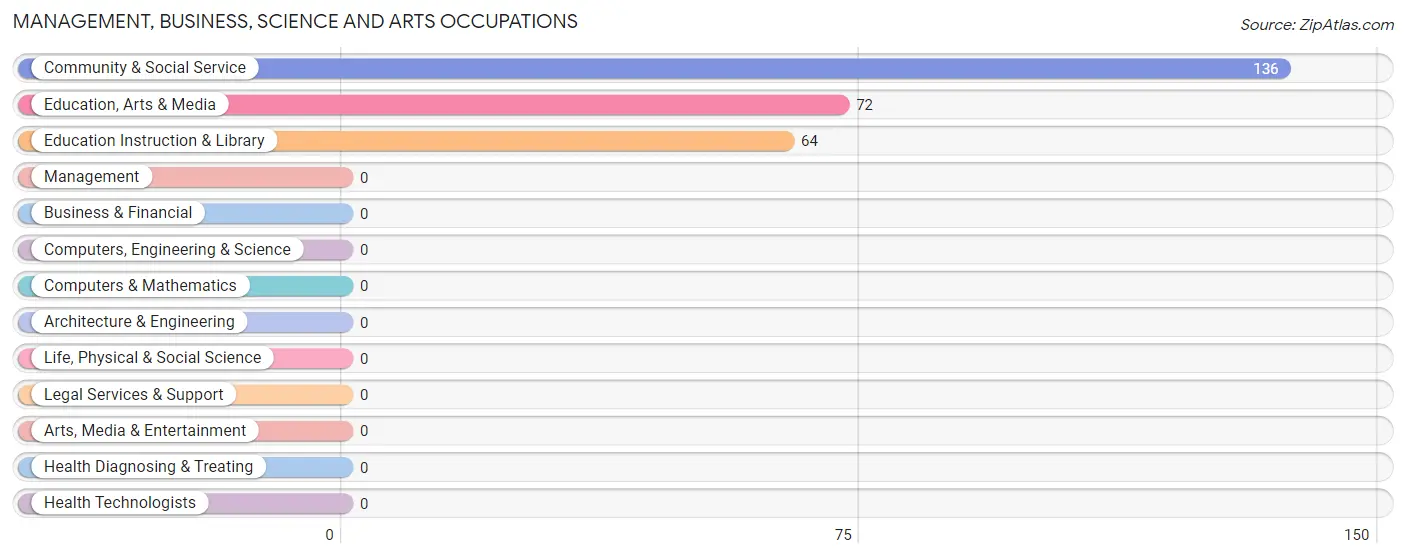
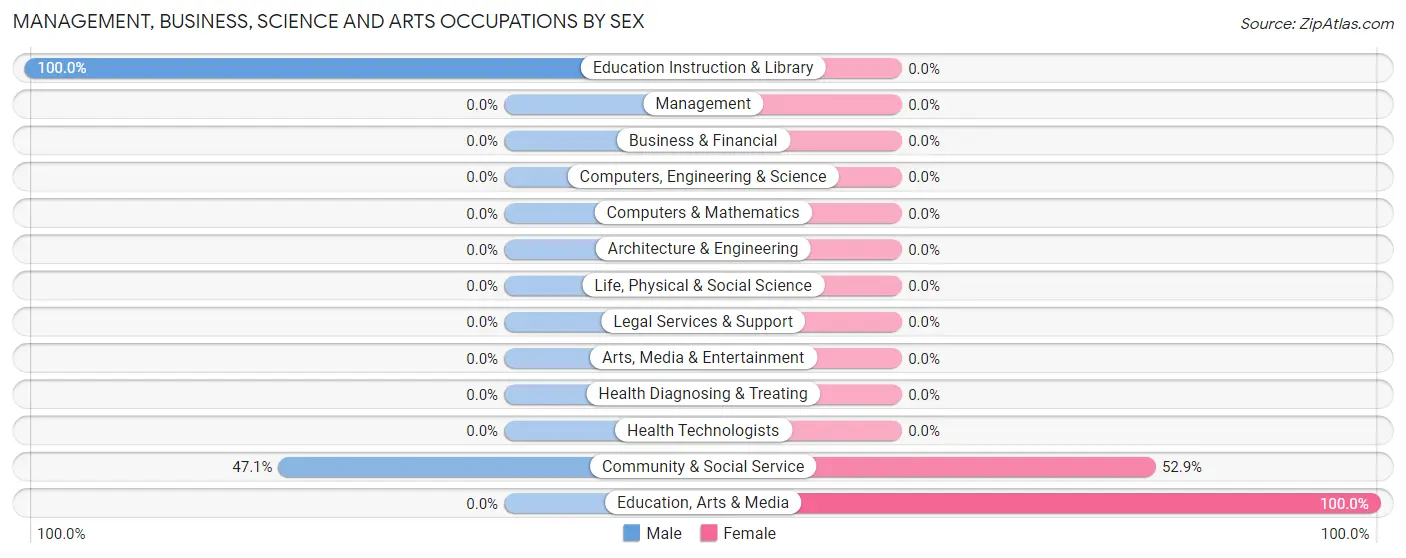
Management, Business, Science and Arts Occupations
The most common Management, Business, Science and Arts occupations in New River are Community & Social Service (136 | 42.4%), Education, Arts & Media (72 | 22.4%), and Education Instruction & Library (64 | 19.9%).
Management, Business, Science and Arts Occupations by Sex
Within the Management, Business, Science and Arts occupations in New River, the most male-oriented occupations are Education Instruction & Library (100.0%), and Community & Social Service (47.1%), while the most female-oriented occupations are Education, Arts & Media (100.0%), and Community & Social Service (52.9%).
| Occupation | Male | Female |
| Management | 0 (0.0%) | 0 (0.0%) |
| Business & Financial | 0 (0.0%) | 0 (0.0%) |
| Computers, Engineering & Science | 0 (0.0%) | 0 (0.0%) |
| Computers & Mathematics | 0 (0.0%) | 0 (0.0%) |
| Architecture & Engineering | 0 (0.0%) | 0 (0.0%) |
| Life, Physical & Social Science | 0 (0.0%) | 0 (0.0%) |
| Community & Social Service | 64 (47.1%) | 72 (52.9%) |
| Education, Arts & Media | 0 (0.0%) | 72 (100.0%) |
| Legal Services & Support | 0 (0.0%) | 0 (0.0%) |
| Education Instruction & Library | 64 (100.0%) | 0 (0.0%) |
| Arts, Media & Entertainment | 0 (0.0%) | 0 (0.0%) |
| Health Diagnosing & Treating | 0 (0.0%) | 0 (0.0%) |
| Health Technologists | 0 (0.0%) | 0 (0.0%) |
| Total (Category) | 64 (47.1%) | 72 (52.9%) |
| Total (Overall) | 113 (35.2%) | 208 (64.8%) |
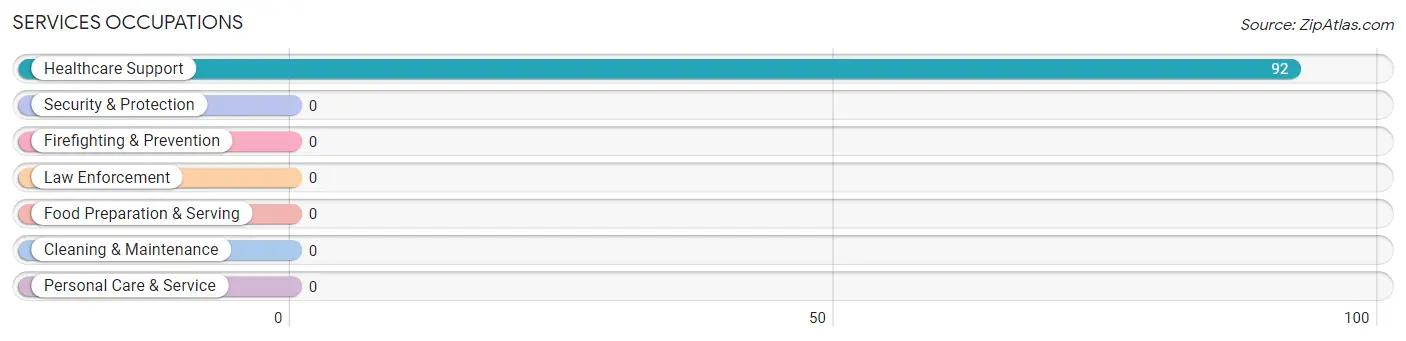
Services Occupations
The most common Services occupations in New River are , and Healthcare Support (92 | 28.7%).
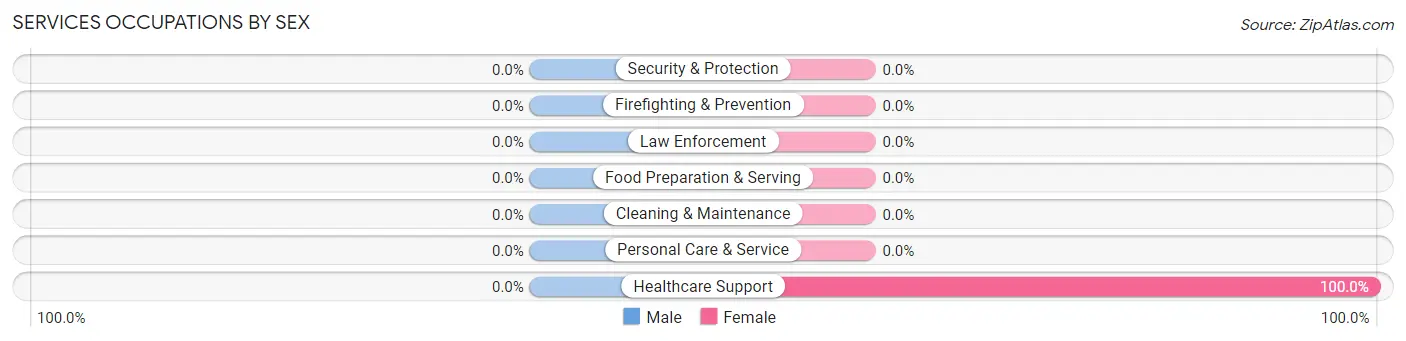
Services Occupations by Sex
| Occupation | Male | Female |
| Healthcare Support | 0 (0.0%) | 92 (100.0%) |
| Security & Protection | 0 (0.0%) | 0 (0.0%) |
| Firefighting & Prevention | 0 (0.0%) | 0 (0.0%) |
| Law Enforcement | 0 (0.0%) | 0 (0.0%) |
| Food Preparation & Serving | 0 (0.0%) | 0 (0.0%) |
| Cleaning & Maintenance | 0 (0.0%) | 0 (0.0%) |
| Personal Care & Service | 0 (0.0%) | 0 (0.0%) |
| Total (Category) | 0 (0.0%) | 92 (100.0%) |
| Total (Overall) | 113 (35.2%) | 208 (64.8%) |
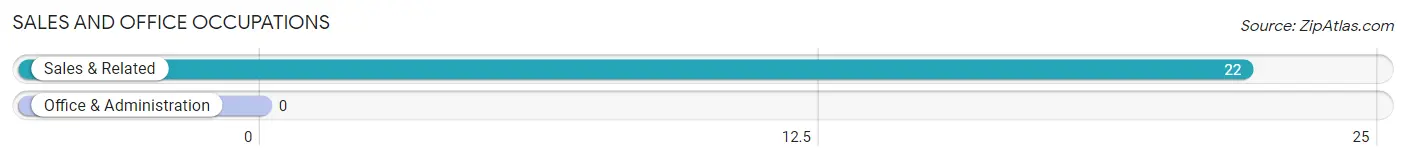
Sales and Office Occupations
The most common Sales and Office occupations in New River are , and Sales & Related (22 | 6.9%).
Sales and Office Occupations by Sex

| Occupation | Male | Female |
| Sales & Related | 22 (100.0%) | 0 (0.0%) |
| Office & Administration | 0 (0.0%) | 0 (0.0%) |
| Total (Category) | 22 (100.0%) | 0 (0.0%) |
| Total (Overall) | 113 (35.2%) | 208 (64.8%) |
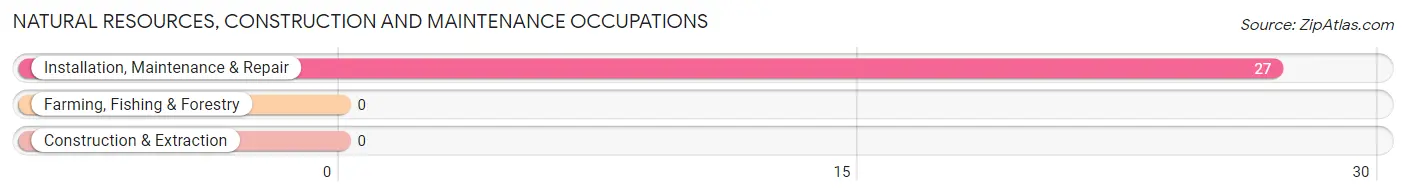
Natural Resources, Construction and Maintenance Occupations
The most common Natural Resources, Construction and Maintenance occupations in New River are , and Installation, Maintenance & Repair (27 | 8.4%).
Natural Resources, Construction and Maintenance Occupations by Sex
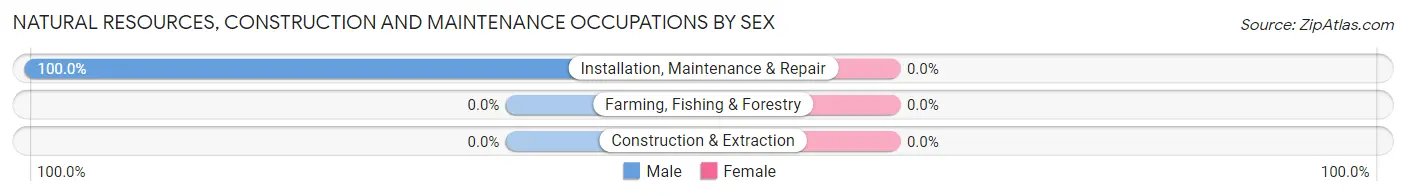
| Occupation | Male | Female |
| Farming, Fishing & Forestry | 0 (0.0%) | 0 (0.0%) |
| Construction & Extraction | 0 (0.0%) | 0 (0.0%) |
| Installation, Maintenance & Repair | 27 (100.0%) | 0 (0.0%) |
| Total (Category) | 27 (100.0%) | 0 (0.0%) |
| Total (Overall) | 113 (35.2%) | 208 (64.8%) |
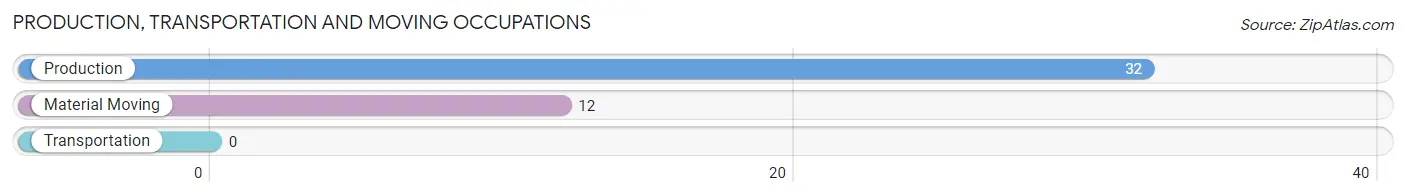
Production, Transportation and Moving Occupations
The most common Production, Transportation and Moving occupations in New River are Production (32 | 10.0%), and Material Moving (12 | 3.7%).
Production, Transportation and Moving Occupations by Sex
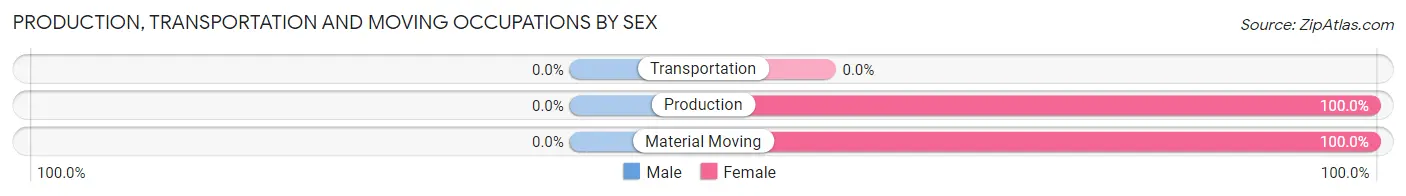
| Occupation | Male | Female |
| Production | 0 (0.0%) | 32 (100.0%) |
| Transportation | 0 (0.0%) | 0 (0.0%) |
| Material Moving | 0 (0.0%) | 12 (100.0%) |
| Total (Category) | 0 (0.0%) | 44 (100.0%) |
| Total (Overall) | 113 (35.2%) | 208 (64.8%) |
Employment Industries by Sex in New River
Employment Industries in New River
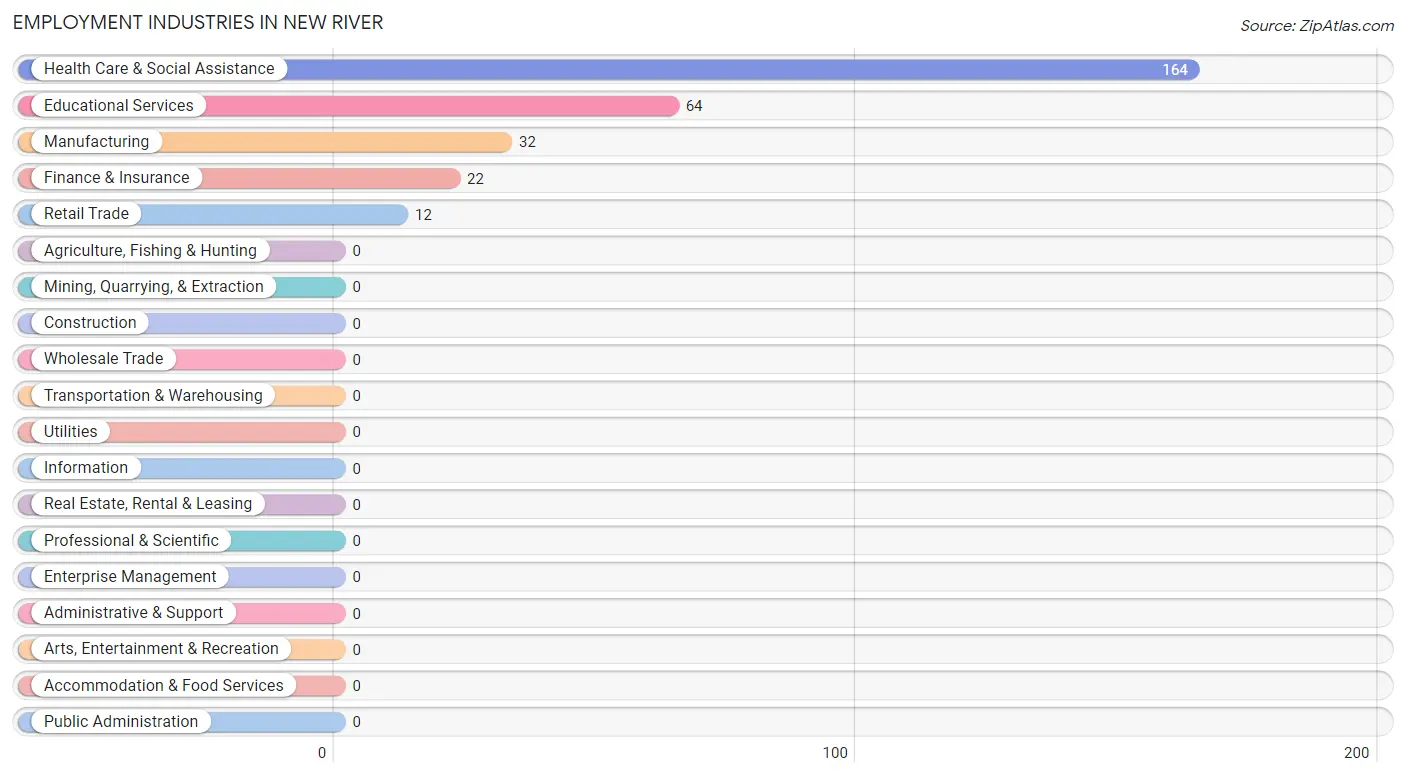
The major employment industries in New River include Health Care & Social Assistance (164 | 51.1%), Educational Services (64 | 19.9%), Manufacturing (32 | 10.0%), Finance & Insurance (22 | 6.9%), and Retail Trade (12 | 3.7%).
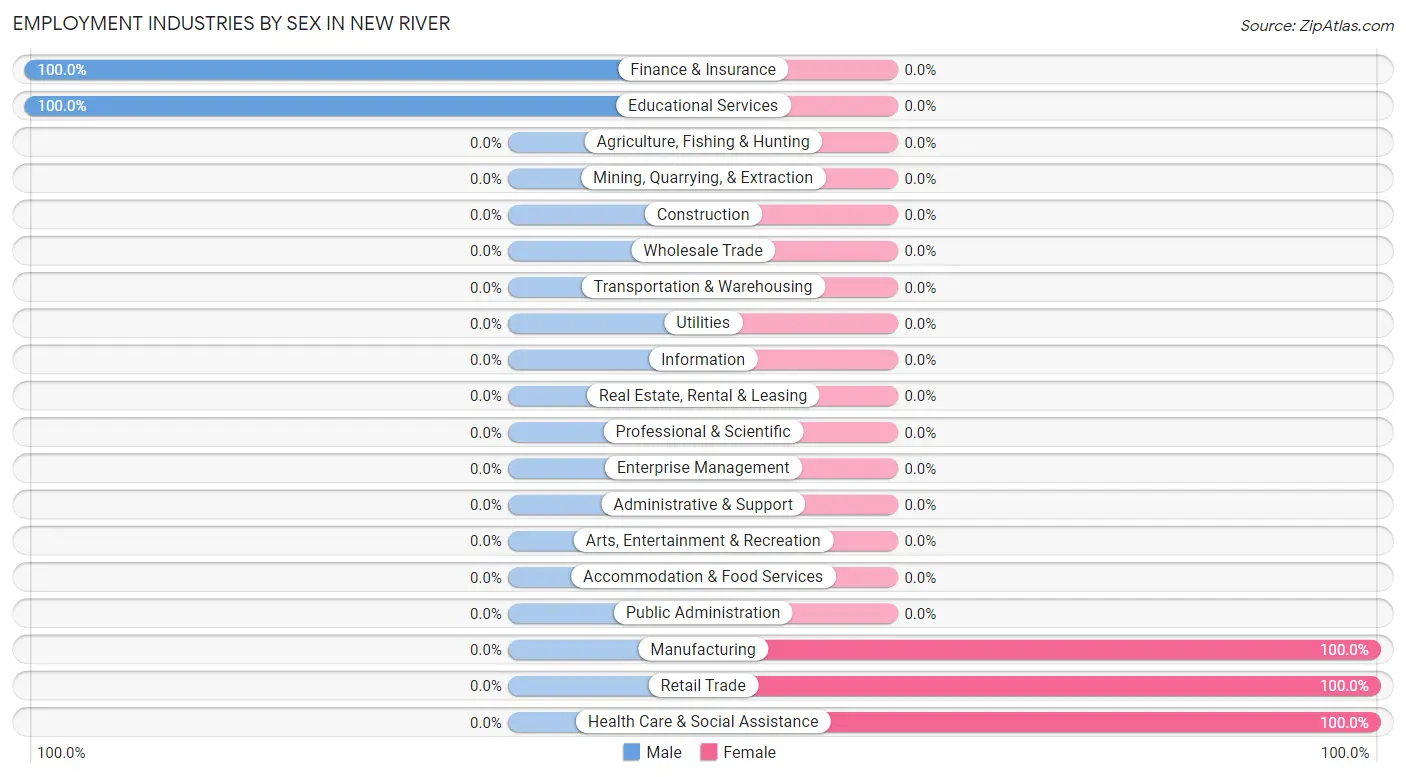
Employment Industries by Sex in New River
The New River industries that see more men than women are Finance & Insurance (100.0%), and Educational Services (100.0%), whereas the industries that tend to have a higher number of women are Manufacturing (100.0%), Retail Trade (100.0%), and Health Care & Social Assistance (100.0%).
| Industry | Male | Female |
| Agriculture, Fishing & Hunting | 0 (0.0%) | 0 (0.0%) |
| Mining, Quarrying, & Extraction | 0 (0.0%) | 0 (0.0%) |
| Construction | 0 (0.0%) | 0 (0.0%) |
| Manufacturing | 0 (0.0%) | 32 (100.0%) |
| Wholesale Trade | 0 (0.0%) | 0 (0.0%) |
| Retail Trade | 0 (0.0%) | 12 (100.0%) |
| Transportation & Warehousing | 0 (0.0%) | 0 (0.0%) |
| Utilities | 0 (0.0%) | 0 (0.0%) |
| Information | 0 (0.0%) | 0 (0.0%) |
| Finance & Insurance | 22 (100.0%) | 0 (0.0%) |
| Real Estate, Rental & Leasing | 0 (0.0%) | 0 (0.0%) |
| Professional & Scientific | 0 (0.0%) | 0 (0.0%) |
| Enterprise Management | 0 (0.0%) | 0 (0.0%) |
| Administrative & Support | 0 (0.0%) | 0 (0.0%) |
| Educational Services | 64 (100.0%) | 0 (0.0%) |
| Health Care & Social Assistance | 0 (0.0%) | 164 (100.0%) |
| Arts, Entertainment & Recreation | 0 (0.0%) | 0 (0.0%) |
| Accommodation & Food Services | 0 (0.0%) | 0 (0.0%) |
| Public Administration | 0 (0.0%) | 0 (0.0%) |
| Total | 113 (35.2%) | 208 (64.8%) |
Education in New River
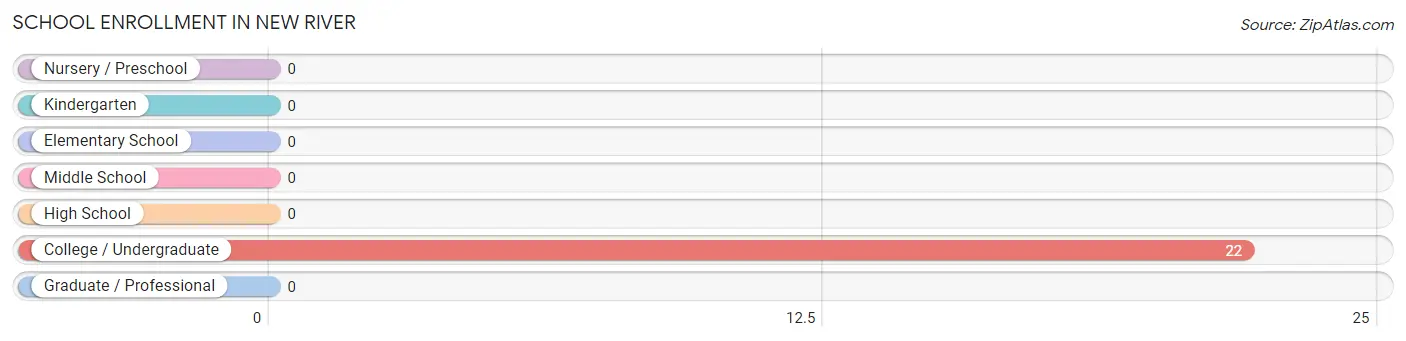
School Enrollment in New River
| School Level | # Students | % Students |
| Nursery / Preschool | 0 | 0.0% |
| Kindergarten | 0 | 0.0% |
| Elementary School | 0 | 0.0% |
| Middle School | 0 | 0.0% |
| High School | 0 | 0.0% |
| College / Undergraduate | 22 | 100.0% |
| Graduate / Professional | 0 | 0.0% |
| Total | 22 | 100.0% |
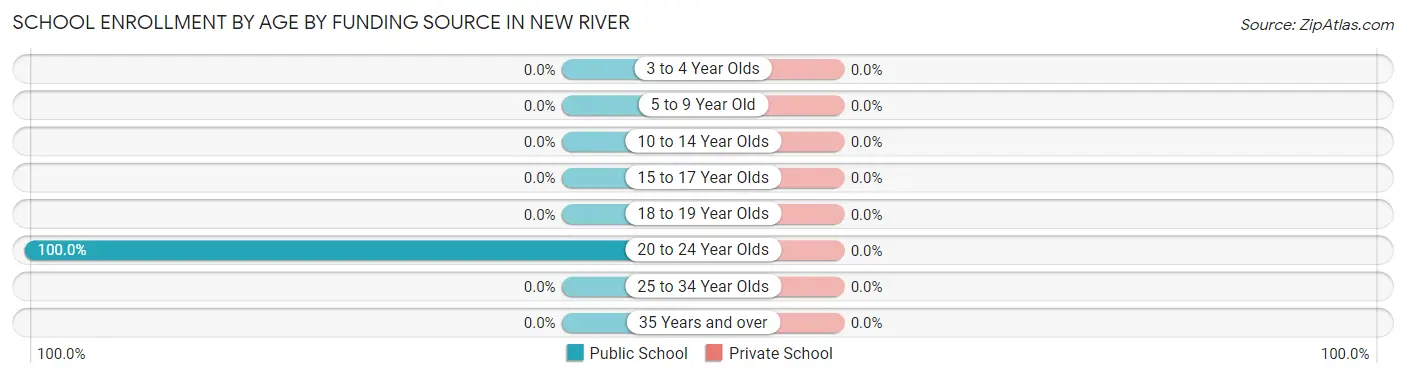
School Enrollment by Age by Funding Source in New River
| Age Bracket | Public School | Private School |
| 3 to 4 Year Olds | 0 (0.0%) | 0 (0.0%) |
| 5 to 9 Year Old | 0 (0.0%) | 0 (0.0%) |
| 10 to 14 Year Olds | 0 (0.0%) | 0 (0.0%) |
| 15 to 17 Year Olds | 0 (0.0%) | 0 (0.0%) |
| 18 to 19 Year Olds | 0 (0.0%) | 0 (0.0%) |
| 20 to 24 Year Olds | 22 (100.0%) | 0 (0.0%) |
| 25 to 34 Year Olds | 0 (0.0%) | 0 (0.0%) |
| 35 Years and over | 0 (0.0%) | 0 (0.0%) |
| Total | 22 (100.0%) | 0 (0.0%) |
Educational Attainment by Field of Study in New River
Arts & humanities (178 | 69.3%), liberal arts & history (64 | 24.9%), and bio, nature & agricultural (15 | 5.8%) are the most common fields of study among 257 individuals in New River who have obtained a bachelor's degree or higher.
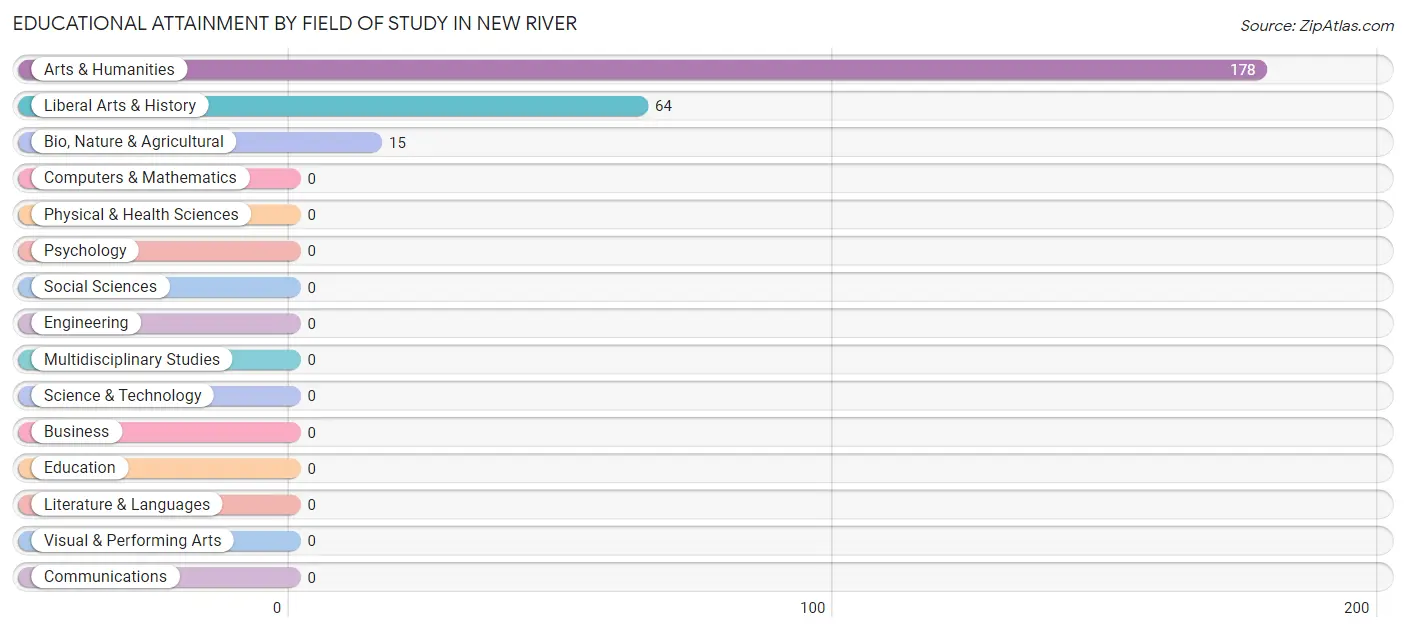
| Field of Study | # Graduates | % Graduates |
| Computers & Mathematics | 0 | 0.0% |
| Bio, Nature & Agricultural | 15 | 5.8% |
| Physical & Health Sciences | 0 | 0.0% |
| Psychology | 0 | 0.0% |
| Social Sciences | 0 | 0.0% |
| Engineering | 0 | 0.0% |
| Multidisciplinary Studies | 0 | 0.0% |
| Science & Technology | 0 | 0.0% |
| Business | 0 | 0.0% |
| Education | 0 | 0.0% |
| Literature & Languages | 0 | 0.0% |
| Liberal Arts & History | 64 | 24.9% |
| Visual & Performing Arts | 0 | 0.0% |
| Communications | 0 | 0.0% |
| Arts & Humanities | 178 | 69.3% |
| Total | 257 | 100.0% |
Transportation & Commute in New River
Vehicle Availability by Sex in New River
The most prevalent vehicle ownership categories in New River are males with 3 vehicles (64, accounting for 70.3%) and females with 3 vehicles (72, making up 30.8%).
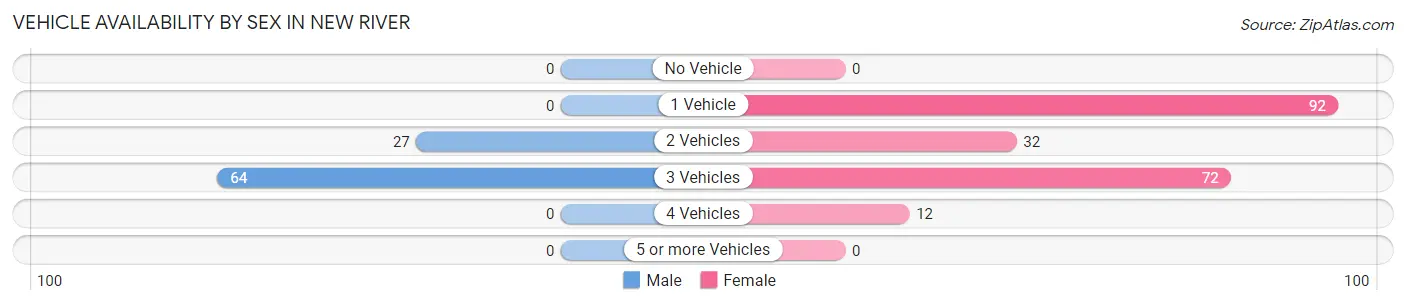
| Vehicles Available | Male | Female |
| No Vehicle | 0 (0.0%) | 0 (0.0%) |
| 1 Vehicle | 0 (0.0%) | 92 (44.2%) |
| 2 Vehicles | 27 (29.7%) | 32 (15.4%) |
| 3 Vehicles | 64 (70.3%) | 72 (34.6%) |
| 4 Vehicles | 0 (0.0%) | 12 (5.8%) |
| 5 or more Vehicles | 0 (0.0%) | 0 (0.0%) |
| Total | 91 (100.0%) | 208 (100.0%) |
Commute Time in New River
The most frequently occuring commute durations in New River are 20 to 24 minutes (92 commuters, 30.8%), 60 to 89 minutes (72 commuters, 24.1%), and 30 to 34 minutes (64 commuters, 21.4%).
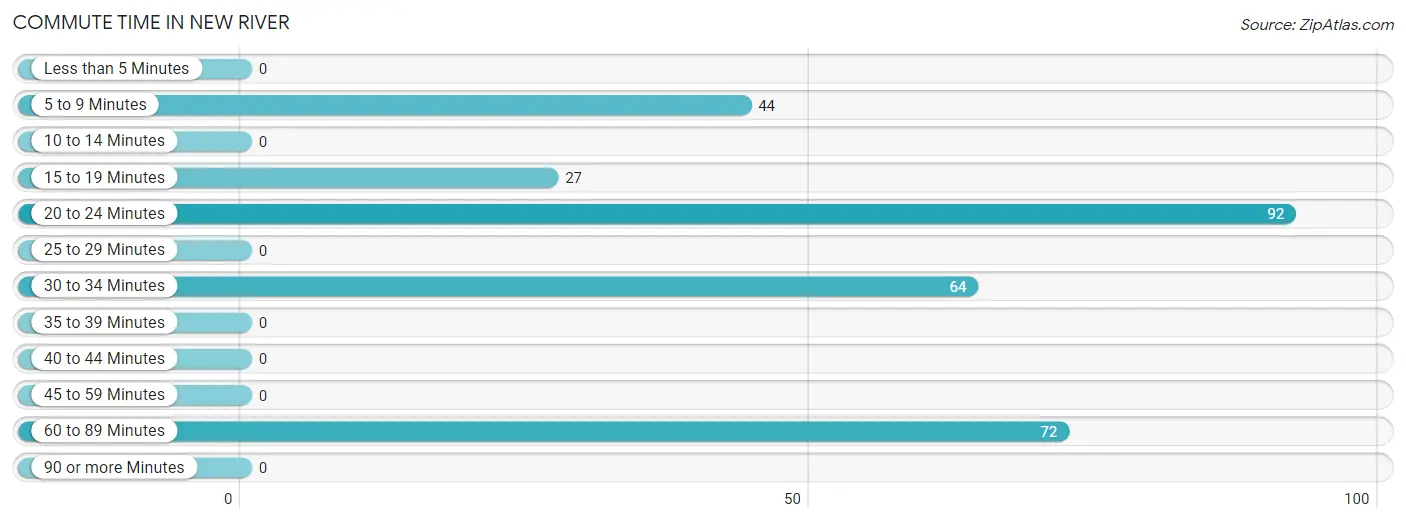
| Commute Time | # Commuters | % Commuters |
| Less than 5 Minutes | 0 | 0.0% |
| 5 to 9 Minutes | 44 | 14.7% |
| 10 to 14 Minutes | 0 | 0.0% |
| 15 to 19 Minutes | 27 | 9.0% |
| 20 to 24 Minutes | 92 | 30.8% |
| 25 to 29 Minutes | 0 | 0.0% |
| 30 to 34 Minutes | 64 | 21.4% |
| 35 to 39 Minutes | 0 | 0.0% |
| 40 to 44 Minutes | 0 | 0.0% |
| 45 to 59 Minutes | 0 | 0.0% |
| 60 to 89 Minutes | 72 | 24.1% |
| 90 or more Minutes | 0 | 0.0% |
Commute Time by Sex in New River
The most common commute times in New River are 30 to 34 minutes (64 commuters, 70.3%) for males and 20 to 24 minutes (92 commuters, 44.2%) for females.
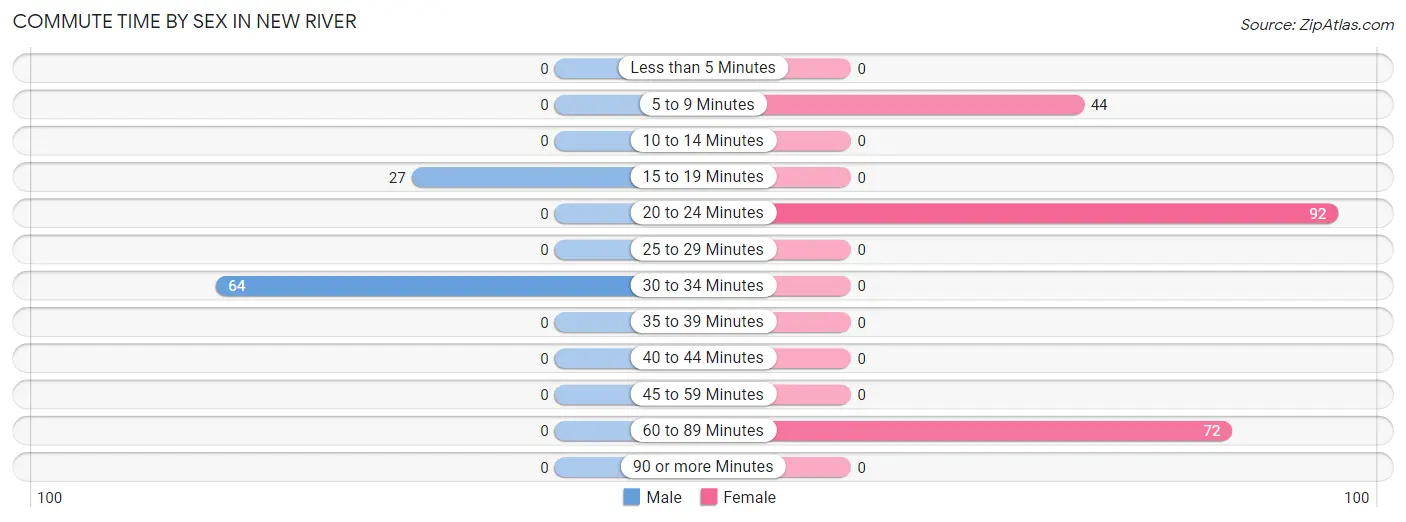
| Commute Time | Male | Female |
| Less than 5 Minutes | 0 (0.0%) | 0 (0.0%) |
| 5 to 9 Minutes | 0 (0.0%) | 44 (21.1%) |
| 10 to 14 Minutes | 0 (0.0%) | 0 (0.0%) |
| 15 to 19 Minutes | 27 (29.7%) | 0 (0.0%) |
| 20 to 24 Minutes | 0 (0.0%) | 92 (44.2%) |
| 25 to 29 Minutes | 0 (0.0%) | 0 (0.0%) |
| 30 to 34 Minutes | 64 (70.3%) | 0 (0.0%) |
| 35 to 39 Minutes | 0 (0.0%) | 0 (0.0%) |
| 40 to 44 Minutes | 0 (0.0%) | 0 (0.0%) |
| 45 to 59 Minutes | 0 (0.0%) | 0 (0.0%) |
| 60 to 89 Minutes | 0 (0.0%) | 72 (34.6%) |
| 90 or more Minutes | 0 (0.0%) | 0 (0.0%) |
Time of Departure to Work by Sex in New River
The most frequent times of departure to work in New River are 7:30 AM to 7:59 AM (64, 70.3%) for males and 7:00 AM to 7:29 AM (104, 50.0%) for females.
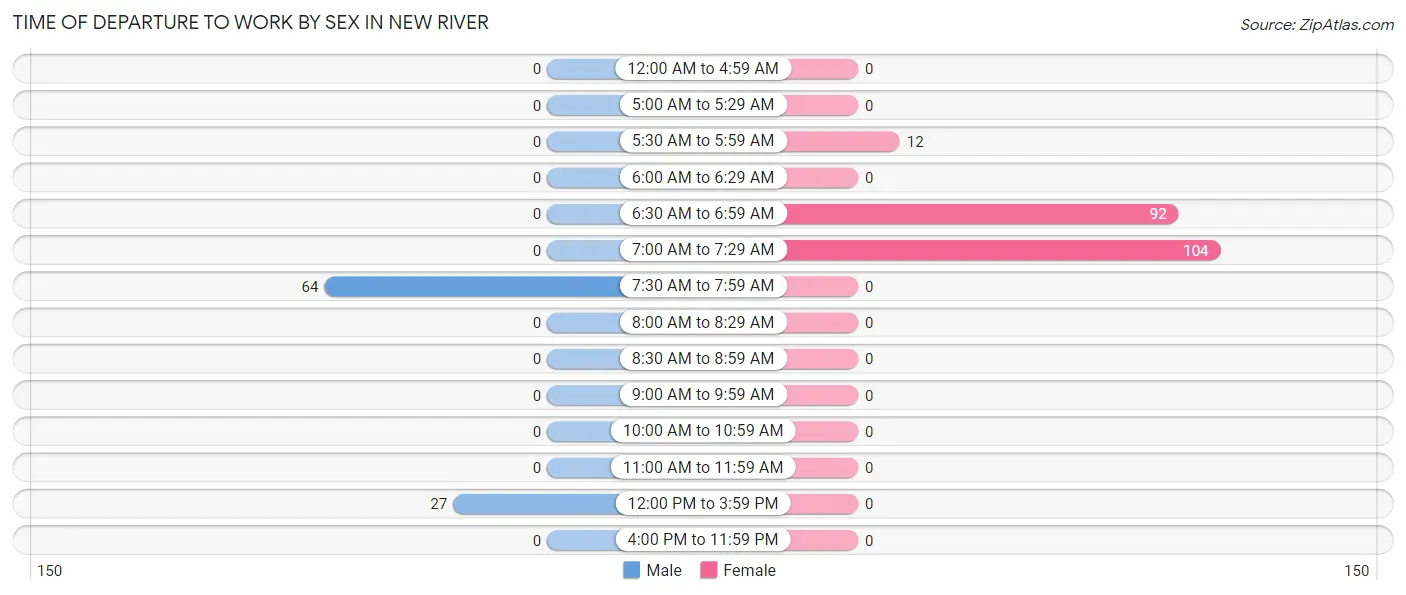
| Time of Departure | Male | Female |
| 12:00 AM to 4:59 AM | 0 (0.0%) | 0 (0.0%) |
| 5:00 AM to 5:29 AM | 0 (0.0%) | 0 (0.0%) |
| 5:30 AM to 5:59 AM | 0 (0.0%) | 12 (5.8%) |
| 6:00 AM to 6:29 AM | 0 (0.0%) | 0 (0.0%) |
| 6:30 AM to 6:59 AM | 0 (0.0%) | 92 (44.2%) |
| 7:00 AM to 7:29 AM | 0 (0.0%) | 104 (50.0%) |
| 7:30 AM to 7:59 AM | 64 (70.3%) | 0 (0.0%) |
| 8:00 AM to 8:29 AM | 0 (0.0%) | 0 (0.0%) |
| 8:30 AM to 8:59 AM | 0 (0.0%) | 0 (0.0%) |
| 9:00 AM to 9:59 AM | 0 (0.0%) | 0 (0.0%) |
| 10:00 AM to 10:59 AM | 0 (0.0%) | 0 (0.0%) |
| 11:00 AM to 11:59 AM | 0 (0.0%) | 0 (0.0%) |
| 12:00 PM to 3:59 PM | 27 (29.7%) | 0 (0.0%) |
| 4:00 PM to 11:59 PM | 0 (0.0%) | 0 (0.0%) |
| Total | 91 (100.0%) | 208 (100.0%) |
Housing Occupancy in New River
Occupancy by Ownership in New River
Of the total 203 dwellings in New River, owner-occupied units account for 186 (91.6%), while renter-occupied units make up 17 (8.4%).
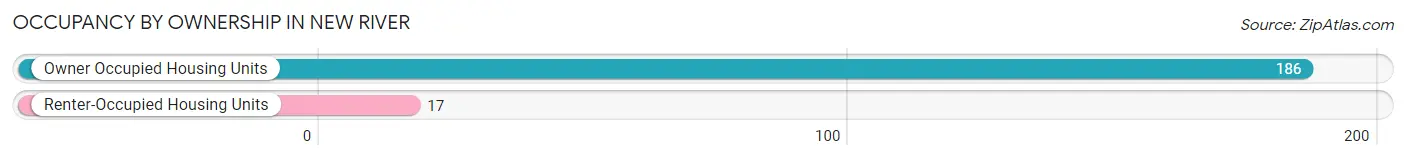
| Occupancy | # Housing Units | % Housing Units |
| Owner Occupied Housing Units | 186 | 91.6% |
| Renter-Occupied Housing Units | 17 | 8.4% |
| Total Occupied Housing Units | 203 | 100.0% |
Occupancy by Household Size in New River
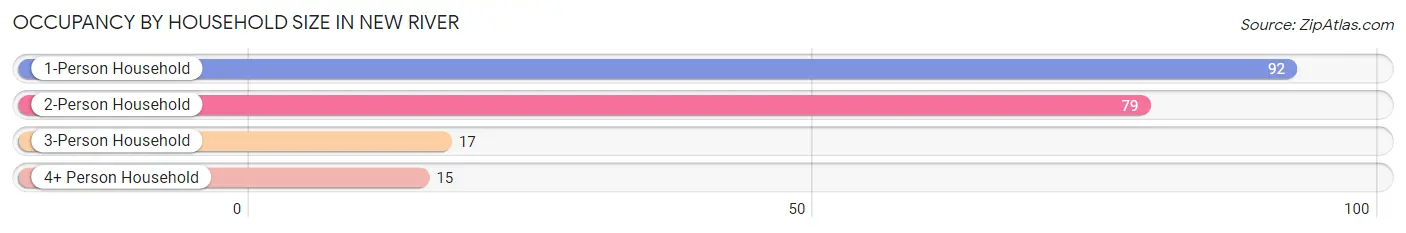
| Household Size | # Housing Units | % Housing Units |
| 1-Person Household | 92 | 45.3% |
| 2-Person Household | 79 | 38.9% |
| 3-Person Household | 17 | 8.4% |
| 4+ Person Household | 15 | 7.4% |
| Total Housing Units | 203 | 100.0% |
Occupancy by Ownership by Household Size in New River
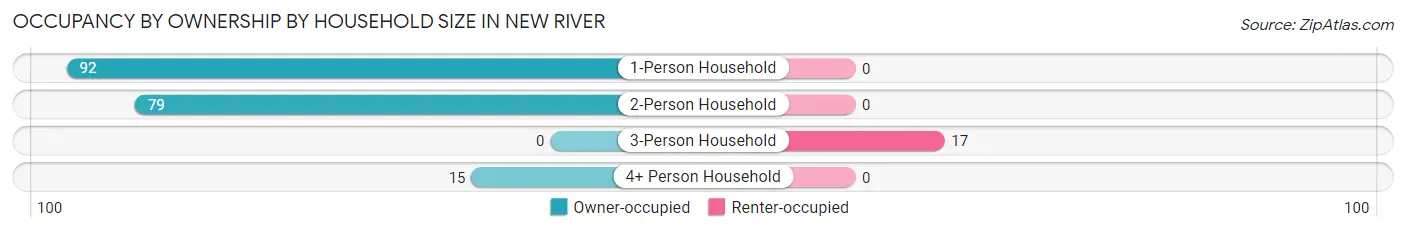
| Household Size | Owner-occupied | Renter-occupied |
| 1-Person Household | 92 (100.0%) | 0 (0.0%) |
| 2-Person Household | 79 (100.0%) | 0 (0.0%) |
| 3-Person Household | 0 (0.0%) | 17 (100.0%) |
| 4+ Person Household | 15 (100.0%) | 0 (0.0%) |
| Total Housing Units | 186 (91.6%) | 17 (8.4%) |
Occupancy by Educational Attainment in New River
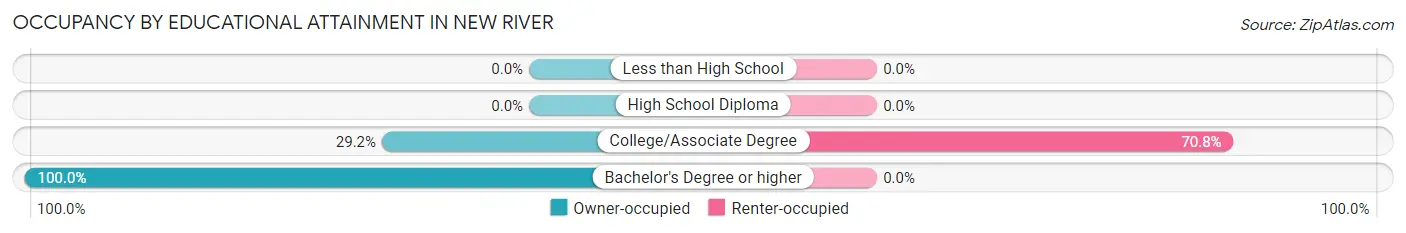
| Household Size | Owner-occupied | Renter-occupied |
| Less than High School | 0 (0.0%) | 0 (0.0%) |
| High School Diploma | 0 (0.0%) | 0 (0.0%) |
| College/Associate Degree | 7 (29.2%) | 17 (70.8%) |
| Bachelor's Degree or higher | 179 (100.0%) | 0 (0.0%) |
Occupancy by Age of Householder in New River
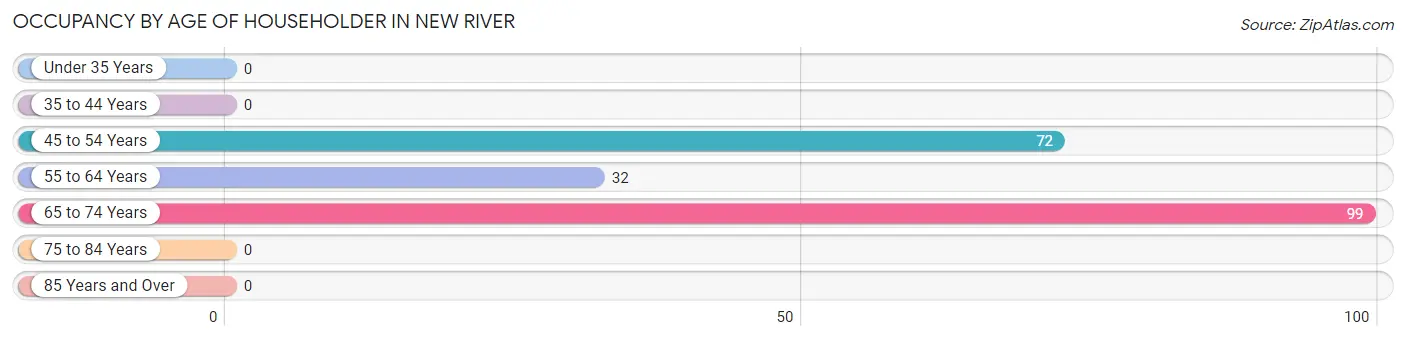
| Age Bracket | # Households | % Households |
| Under 35 Years | 0 | 0.0% |
| 35 to 44 Years | 0 | 0.0% |
| 45 to 54 Years | 72 | 35.5% |
| 55 to 64 Years | 32 | 15.8% |
| 65 to 74 Years | 99 | 48.8% |
| 75 to 84 Years | 0 | 0.0% |
| 85 Years and Over | 0 | 0.0% |
| Total | 203 | 100.0% |
Housing Finances in New River
Median Income by Occupancy in New River
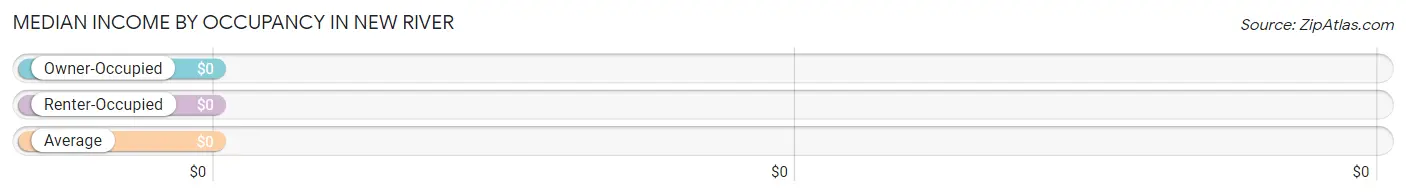
| Occupancy Type | # Households | Median Income |
| Owner-Occupied | 186 (91.6%) | $0 |
| Renter-Occupied | 17 (8.4%) | $0 |
| Average | 203 (100.0%) | $0 |
Occupancy by Householder Income Bracket in New River
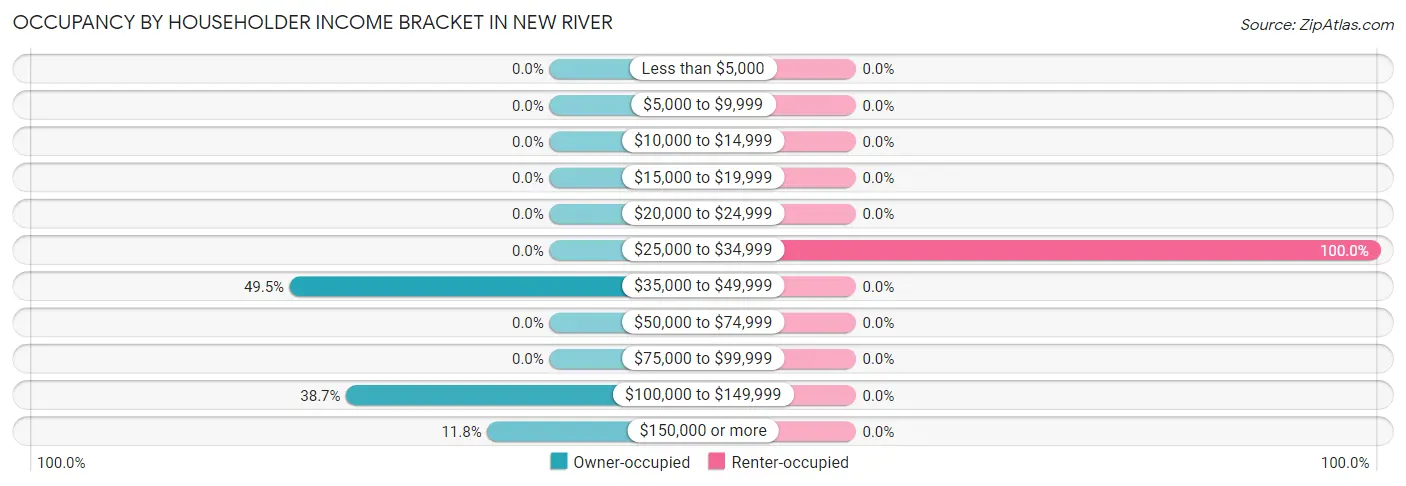
| Income Bracket | Owner-occupied | Renter-occupied |
| Less than $5,000 | 0 (0.0%) | 0 (0.0%) |
| $5,000 to $9,999 | 0 (0.0%) | 0 (0.0%) |
| $10,000 to $14,999 | 0 (0.0%) | 0 (0.0%) |
| $15,000 to $19,999 | 0 (0.0%) | 0 (0.0%) |
| $20,000 to $24,999 | 0 (0.0%) | 0 (0.0%) |
| $25,000 to $34,999 | 0 (0.0%) | 17 (100.0%) |
| $35,000 to $49,999 | 92 (49.5%) | 0 (0.0%) |
| $50,000 to $74,999 | 0 (0.0%) | 0 (0.0%) |
| $75,000 to $99,999 | 0 (0.0%) | 0 (0.0%) |
| $100,000 to $149,999 | 72 (38.7%) | 0 (0.0%) |
| $150,000 or more | 22 (11.8%) | 0 (0.0%) |
| Total | 186 (100.0%) | 17 (100.0%) |
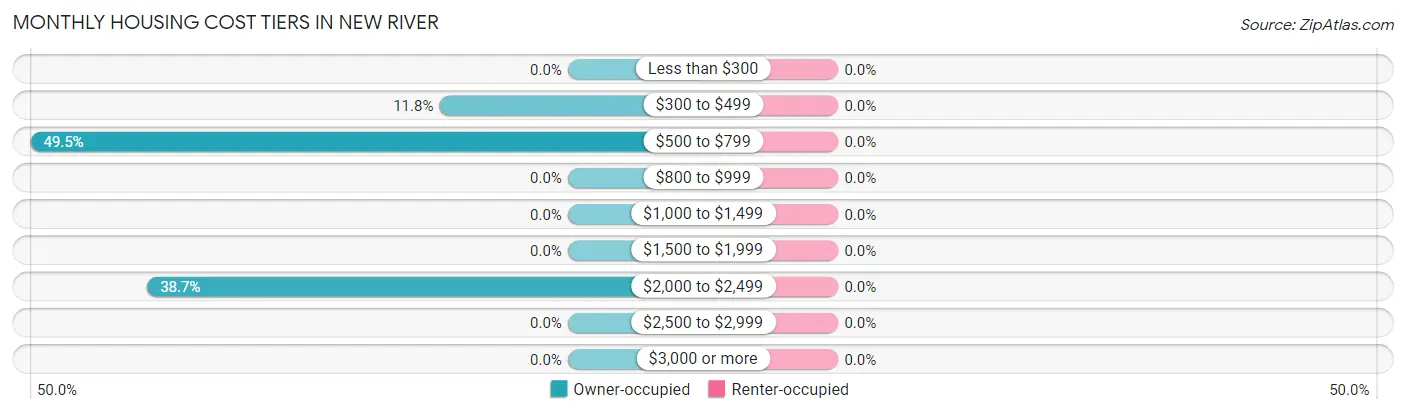
Monthly Housing Cost Tiers in New River
| Monthly Cost | Owner-occupied | Renter-occupied |
| Less than $300 | 0 (0.0%) | 0 (0.0%) |
| $300 to $499 | 22 (11.8%) | 0 (0.0%) |
| $500 to $799 | 92 (49.5%) | 0 (0.0%) |
| $800 to $999 | 0 (0.0%) | 0 (0.0%) |
| $1,000 to $1,499 | 0 (0.0%) | 0 (0.0%) |
| $1,500 to $1,999 | 0 (0.0%) | 0 (0.0%) |
| $2,000 to $2,499 | 72 (38.7%) | 0 (0.0%) |
| $2,500 to $2,999 | 0 (0.0%) | 0 (0.0%) |
| $3,000 or more | 0 (0.0%) | 0 (0.0%) |
| Total | 186 (100.0%) | 17 (100.0%) |
Physical Housing Characteristics in New River
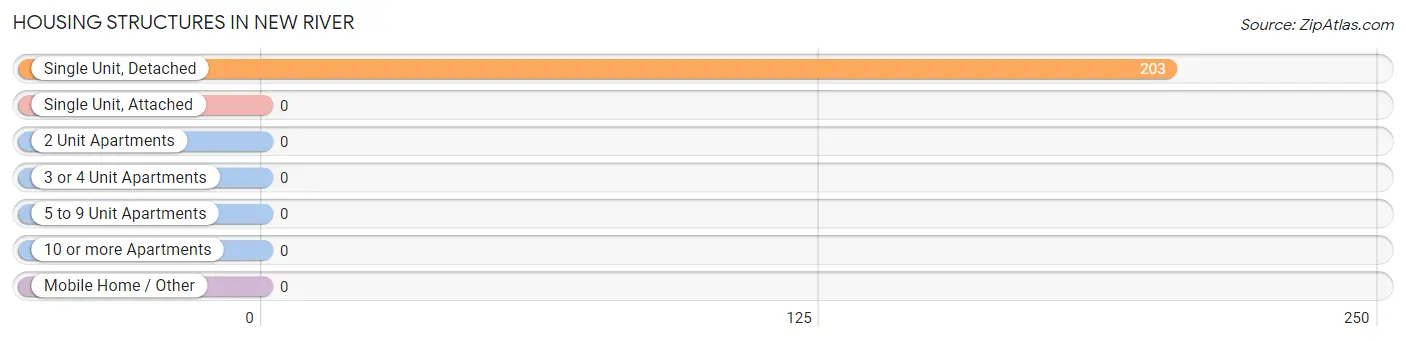
Housing Structures in New River
| Structure Type | # Housing Units | % Housing Units |
| Single Unit, Detached | 203 | 100.0% |
| Single Unit, Attached | 0 | 0.0% |
| 2 Unit Apartments | 0 | 0.0% |
| 3 or 4 Unit Apartments | 0 | 0.0% |
| 5 to 9 Unit Apartments | 0 | 0.0% |
| 10 or more Apartments | 0 | 0.0% |
| Mobile Home / Other | 0 | 0.0% |
| Total | 203 | 100.0% |
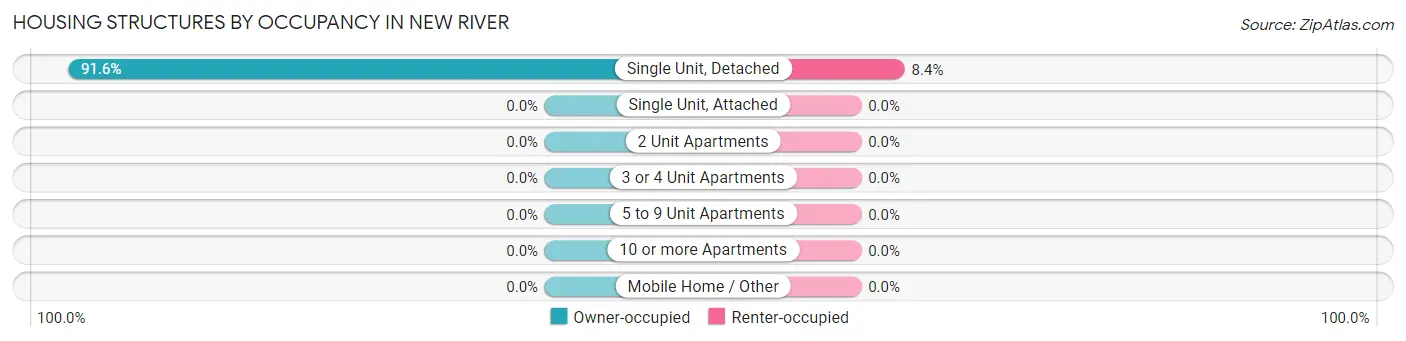
Housing Structures by Occupancy in New River
| Structure Type | Owner-occupied | Renter-occupied |
| Single Unit, Detached | 186 (91.6%) | 17 (8.4%) |
| Single Unit, Attached | 0 (0.0%) | 0 (0.0%) |
| 2 Unit Apartments | 0 (0.0%) | 0 (0.0%) |
| 3 or 4 Unit Apartments | 0 (0.0%) | 0 (0.0%) |
| 5 to 9 Unit Apartments | 0 (0.0%) | 0 (0.0%) |
| 10 or more Apartments | 0 (0.0%) | 0 (0.0%) |
| Mobile Home / Other | 0 (0.0%) | 0 (0.0%) |
| Total | 186 (91.6%) | 17 (8.4%) |
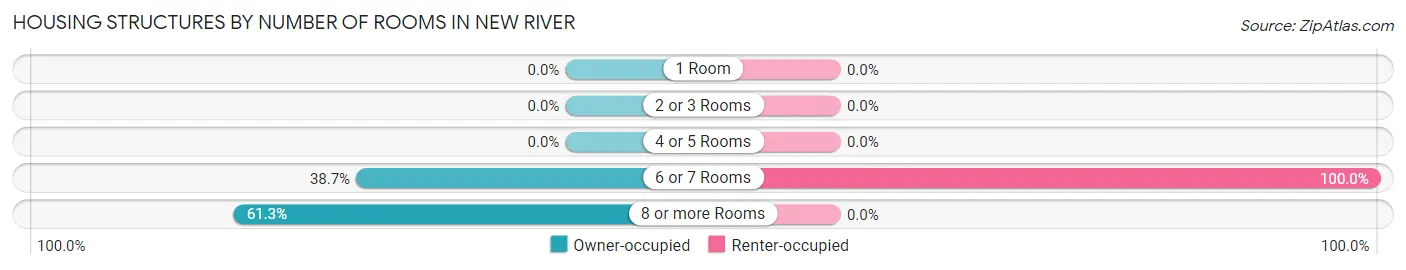
Housing Structures by Number of Rooms in New River
| Number of Rooms | Owner-occupied | Renter-occupied |
| 1 Room | 0 (0.0%) | 0 (0.0%) |
| 2 or 3 Rooms | 0 (0.0%) | 0 (0.0%) |
| 4 or 5 Rooms | 0 (0.0%) | 0 (0.0%) |
| 6 or 7 Rooms | 72 (38.7%) | 17 (100.0%) |
| 8 or more Rooms | 114 (61.3%) | 0 (0.0%) |
| Total | 186 (100.0%) | 17 (100.0%) |
Housing Structure by Heating Type in New River
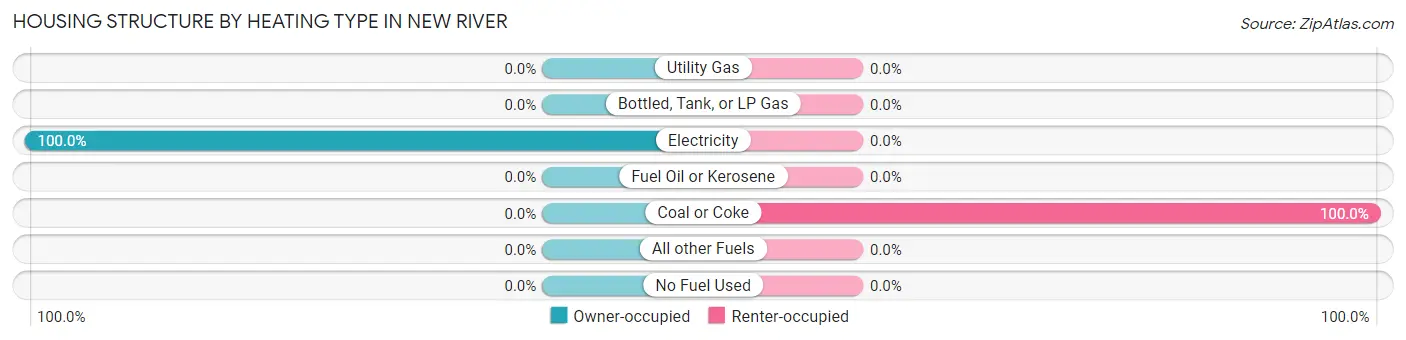
| Heating Type | Owner-occupied | Renter-occupied |
| Utility Gas | 0 (0.0%) | 0 (0.0%) |
| Bottled, Tank, or LP Gas | 0 (0.0%) | 0 (0.0%) |
| Electricity | 186 (100.0%) | 0 (0.0%) |
| Fuel Oil or Kerosene | 0 (0.0%) | 0 (0.0%) |
| Coal or Coke | 0 (0.0%) | 17 (100.0%) |
| All other Fuels | 0 (0.0%) | 0 (0.0%) |
| No Fuel Used | 0 (0.0%) | 0 (0.0%) |
| Total | 186 (100.0%) | 17 (100.0%) |
Household Vehicle Usage in New River
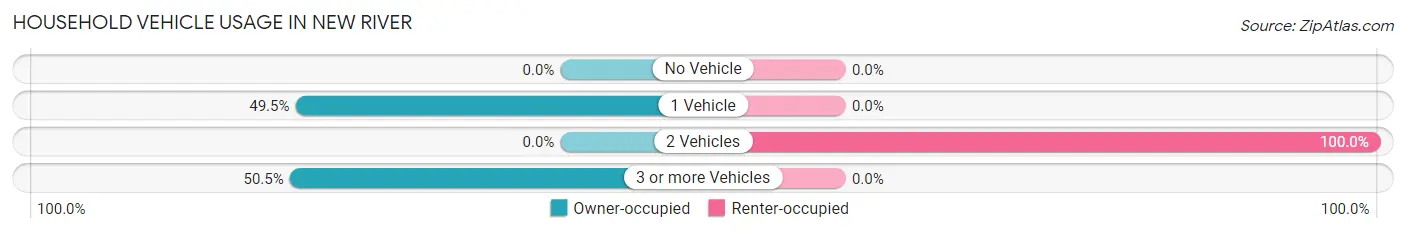
| Vehicles per Household | Owner-occupied | Renter-occupied |
| No Vehicle | 0 (0.0%) | 0 (0.0%) |
| 1 Vehicle | 92 (49.5%) | 0 (0.0%) |
| 2 Vehicles | 0 (0.0%) | 17 (100.0%) |
| 3 or more Vehicles | 94 (50.5%) | 0 (0.0%) |
| Total | 186 (100.0%) | 17 (100.0%) |
Real Estate & Mortgages in New River
Real Estate and Mortgage Overview in New River
| Characteristic | Without Mortgage | With Mortgage |
| Housing Units | 114 | 72 |
| Median Property Value | $138,600 | $0 |
| Median Household Income | - | - |
| Monthly Housing Costs | $638 | $0 |
| Real Estate Taxes | $724 | $0 |
Property Value by Mortgage Status in New River
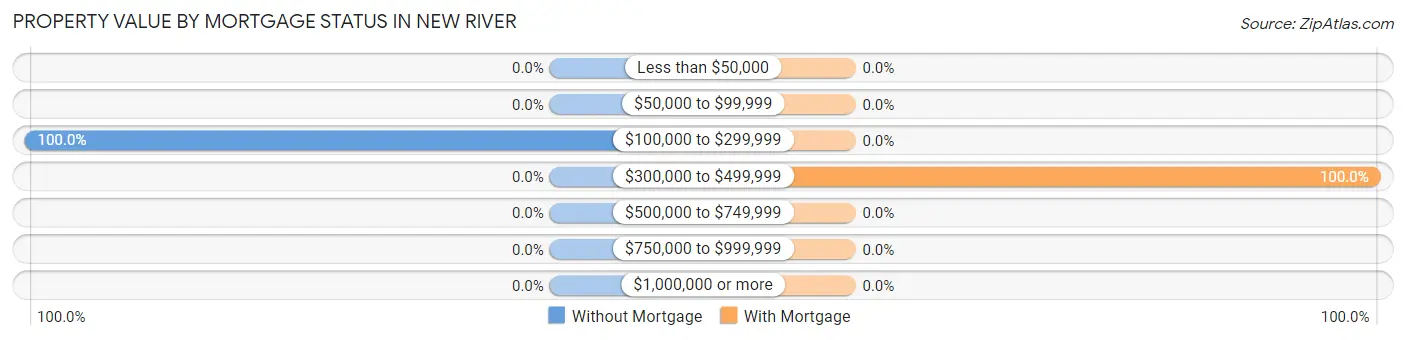
| Property Value | Without Mortgage | With Mortgage |
| Less than $50,000 | 0 (0.0%) | 0 (0.0%) |
| $50,000 to $99,999 | 0 (0.0%) | 0 (0.0%) |
| $100,000 to $299,999 | 114 (100.0%) | 0 (0.0%) |
| $300,000 to $499,999 | 0 (0.0%) | 72 (100.0%) |
| $500,000 to $749,999 | 0 (0.0%) | 0 (0.0%) |
| $750,000 to $999,999 | 0 (0.0%) | 0 (0.0%) |
| $1,000,000 or more | 0 (0.0%) | 0 (0.0%) |
| Total | 114 (100.0%) | 72 (100.0%) |
Household Income by Mortgage Status in New River
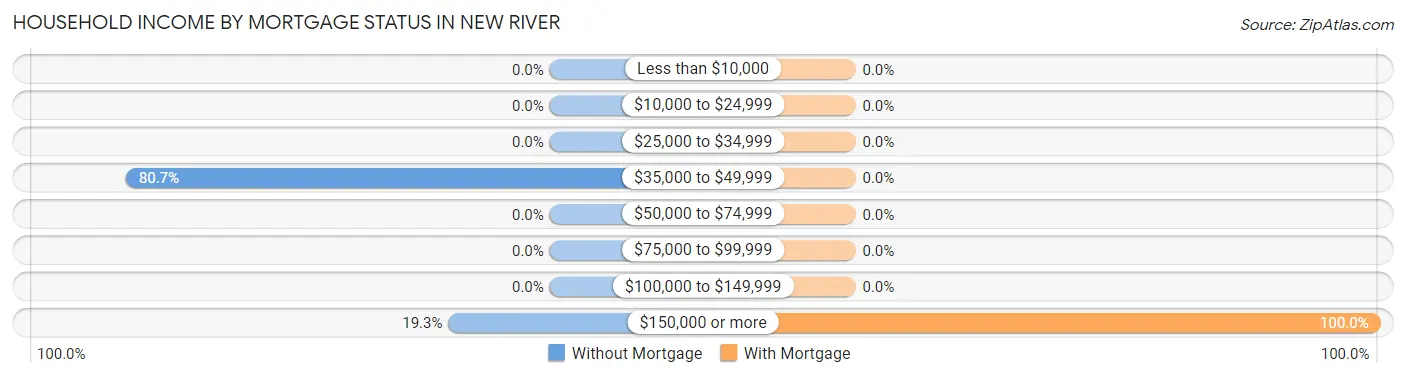
| Household Income | Without Mortgage | With Mortgage |
| Less than $10,000 | 0 (0.0%) | 0 (0.0%) |
| $10,000 to $24,999 | 0 (0.0%) | 0 (0.0%) |
| $25,000 to $34,999 | 0 (0.0%) | 0 (0.0%) |
| $35,000 to $49,999 | 92 (80.7%) | 0 (0.0%) |
| $50,000 to $74,999 | 0 (0.0%) | 0 (0.0%) |
| $75,000 to $99,999 | 0 (0.0%) | 0 (0.0%) |
| $100,000 to $149,999 | 0 (0.0%) | 0 (0.0%) |
| $150,000 or more | 22 (19.3%) | 72 (100.0%) |
| Total | 114 (100.0%) | 72 (100.0%) |
Property Value to Household Income Ratio in New River
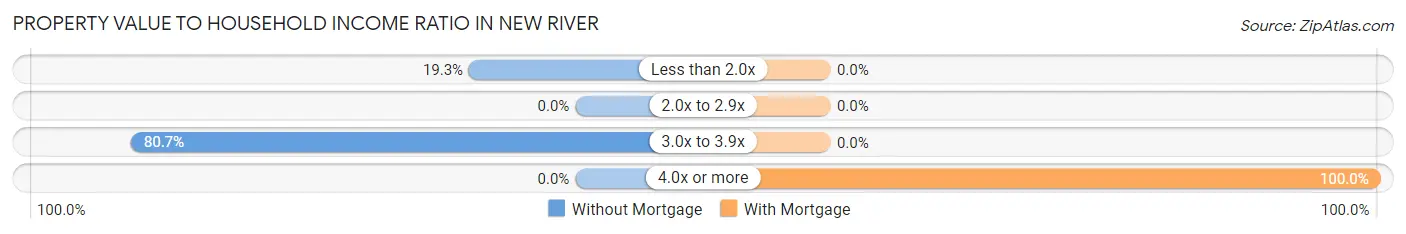
| Value-to-Income Ratio | Without Mortgage | With Mortgage |
| Less than 2.0x | 22 (19.3%) | 0 (0.0%) |
| 2.0x to 2.9x | 0 (0.0%) | 0 (0.0%) |
| 3.0x to 3.9x | 92 (80.7%) | 0 (0.0%) |
| 4.0x or more | 0 (0.0%) | 72 (100.0%) |
| Total | 114 (100.0%) | 72 (100.0%) |
Real Estate Taxes by Mortgage Status in New River
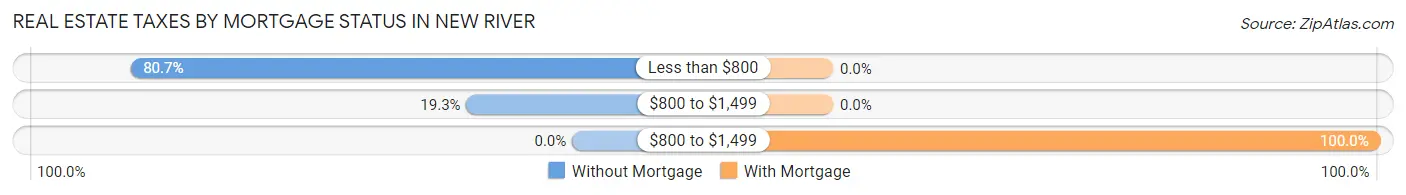
| Property Taxes | Without Mortgage | With Mortgage |
| Less than $800 | 92 (80.7%) | 0 (0.0%) |
| $800 to $1,499 | 22 (19.3%) | 0 (0.0%) |
| $800 to $1,499 | 0 (0.0%) | 72 (100.0%) |
| Total | 114 (100.0%) | 72 (100.0%) |
Health & Disability in New River
Health Insurance Coverage by Age in New River
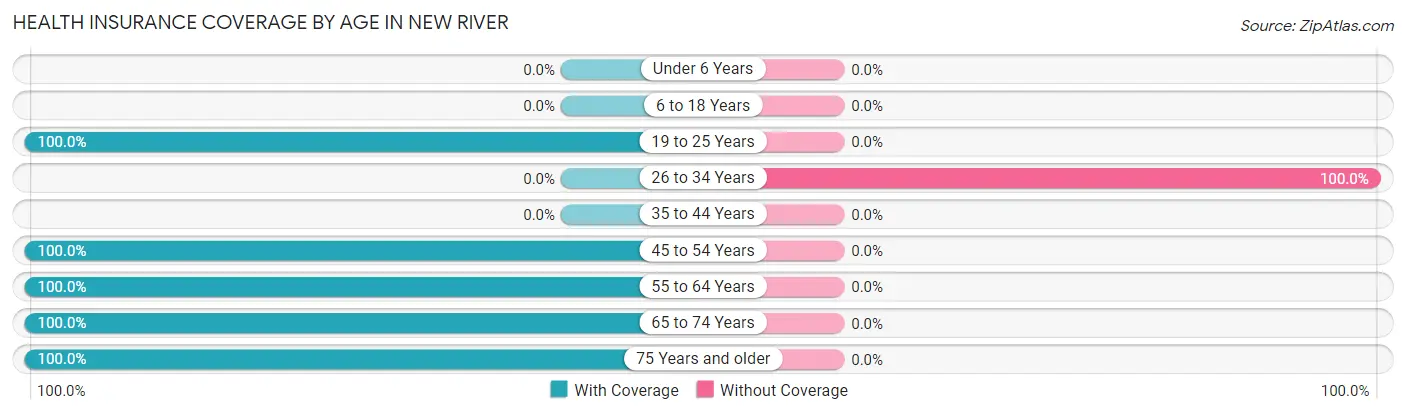
| Age Bracket | With Coverage | Without Coverage |
| Under 6 Years | 0 (0.0%) | 0 (0.0%) |
| 6 to 18 Years | 0 (0.0%) | 0 (0.0%) |
| 19 to 25 Years | 34 (100.0%) | 0 (0.0%) |
| 26 to 34 Years | 0 (0.0%) | 27 (100.0%) |
| 35 to 44 Years | 0 (0.0%) | 0 (0.0%) |
| 45 to 54 Years | 136 (100.0%) | 0 (0.0%) |
| 55 to 64 Years | 78 (100.0%) | 0 (0.0%) |
| 65 to 74 Years | 99 (100.0%) | 0 (0.0%) |
| 75 Years and older | 13 (100.0%) | 0 (0.0%) |
| Total | 360 (93.0%) | 27 (7.0%) |
Health Insurance Coverage by Citizenship Status in New River
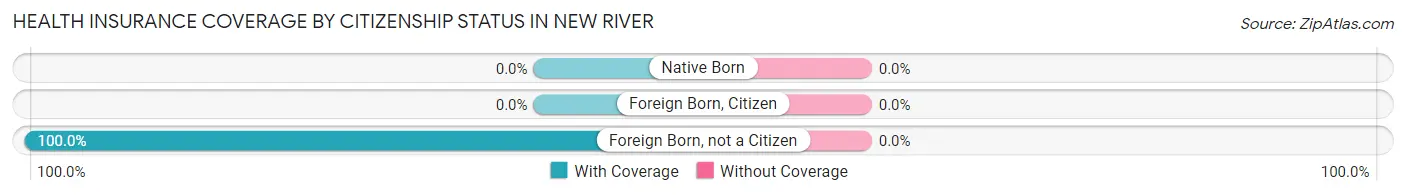
| Citizenship Status | With Coverage | Without Coverage |
| Native Born | 0 (0.0%) | 0 (0.0%) |
| Foreign Born, Citizen | 0 (0.0%) | 0 (0.0%) |
| Foreign Born, not a Citizen | 34 (100.0%) | 0 (0.0%) |
Health Insurance Coverage by Household Income in New River
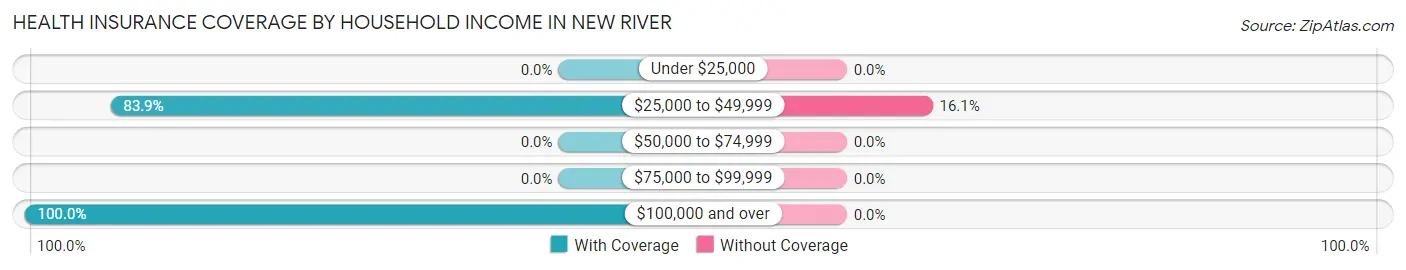
| Household Income | With Coverage | Without Coverage |
| Under $25,000 | 0 (0.0%) | 0 (0.0%) |
| $25,000 to $49,999 | 141 (83.9%) | 27 (16.1%) |
| $50,000 to $74,999 | 0 (0.0%) | 0 (0.0%) |
| $75,000 to $99,999 | 0 (0.0%) | 0 (0.0%) |
| $100,000 and over | 219 (100.0%) | 0 (0.0%) |
Public vs Private Health Insurance Coverage by Age in New River
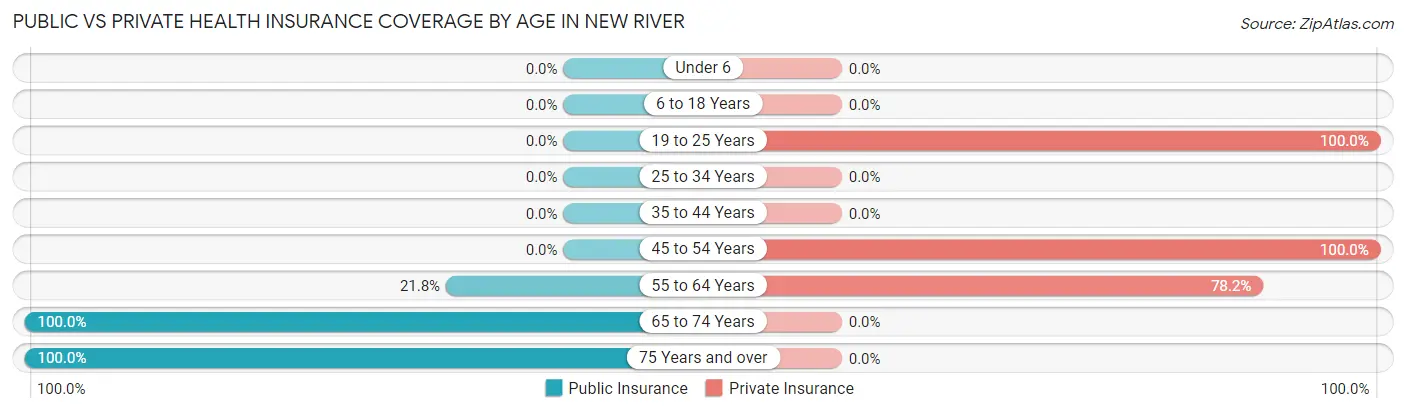
| Age Bracket | Public Insurance | Private Insurance |
| Under 6 | 0 (0.0%) | 0 (0.0%) |
| 6 to 18 Years | 0 (0.0%) | 0 (0.0%) |
| 19 to 25 Years | 0 (0.0%) | 34 (100.0%) |
| 25 to 34 Years | 0 (0.0%) | 0 (0.0%) |
| 35 to 44 Years | 0 (0.0%) | 0 (0.0%) |
| 45 to 54 Years | 0 (0.0%) | 136 (100.0%) |
| 55 to 64 Years | 17 (21.8%) | 61 (78.2%) |
| 65 to 74 Years | 99 (100.0%) | 0 (0.0%) |
| 75 Years and over | 13 (100.0%) | 0 (0.0%) |
| Total | 129 (33.3%) | 231 (59.7%) |
Disability Status by Sex by Age in New River
| Age Bracket | Male | Female |
| Under 5 Years | 0 (0.0%) | 0 (0.0%) |
| 5 to 17 Years | 0 (0.0%) | 0 (0.0%) |
| 18 to 34 Years | 0 (0.0%) | 0 (0.0%) |
| 35 to 64 Years | 0 (0.0%) | 0 (0.0%) |
| 65 to 74 Years | 0 (0.0%) | 0 (0.0%) |
| 75 Years and over | 0 (0.0%) | 0 (0.0%) |
Disability Class by Sex by Age in New River
Disability Class: Hearing Difficulty
| Age Bracket | Male | Female |
| Under 5 Years | 0 (0.0%) | 0 (0.0%) |
| 5 to 17 Years | 0 (0.0%) | 0 (0.0%) |
| 18 to 34 Years | 0 (0.0%) | 0 (0.0%) |
| 35 to 64 Years | 0 (0.0%) | 0 (0.0%) |
| 65 to 74 Years | 0 (0.0%) | 0 (0.0%) |
| 75 Years and over | 0 (0.0%) | 0 (0.0%) |
Disability Class: Vision Difficulty
| Age Bracket | Male | Female |
| Under 5 Years | 0 (0.0%) | 0 (0.0%) |
| 5 to 17 Years | 0 (0.0%) | 0 (0.0%) |
| 18 to 34 Years | 0 (0.0%) | 0 (0.0%) |
| 35 to 64 Years | 0 (0.0%) | 0 (0.0%) |
| 65 to 74 Years | 0 (0.0%) | 0 (0.0%) |
| 75 Years and over | 0 (0.0%) | 0 (0.0%) |
Disability Class: Cognitive Difficulty
| Age Bracket | Male | Female |
| 5 to 17 Years | 0 (0.0%) | 0 (0.0%) |
| 18 to 34 Years | 0 (0.0%) | 0 (0.0%) |
| 35 to 64 Years | 0 (0.0%) | 0 (0.0%) |
| 65 to 74 Years | 0 (0.0%) | 0 (0.0%) |
| 75 Years and over | 0 (0.0%) | 0 (0.0%) |
Disability Class: Ambulatory Difficulty
| Age Bracket | Male | Female |
| 5 to 17 Years | 0 (0.0%) | 0 (0.0%) |
| 18 to 34 Years | 0 (0.0%) | 0 (0.0%) |
| 35 to 64 Years | 0 (0.0%) | 0 (0.0%) |
| 65 to 74 Years | 0 (0.0%) | 0 (0.0%) |
| 75 Years and over | 0 (0.0%) | 0 (0.0%) |
Disability Class: Self-Care Difficulty
| Age Bracket | Male | Female |
| 5 to 17 Years | 0 (0.0%) | 0 (0.0%) |
| 18 to 34 Years | 0 (0.0%) | 0 (0.0%) |
| 35 to 64 Years | 0 (0.0%) | 0 (0.0%) |
| 65 to 74 Years | 0 (0.0%) | 0 (0.0%) |
| 75 Years and over | 0 (0.0%) | 0 (0.0%) |
Technology Access in New River
Computing Device Access in New River
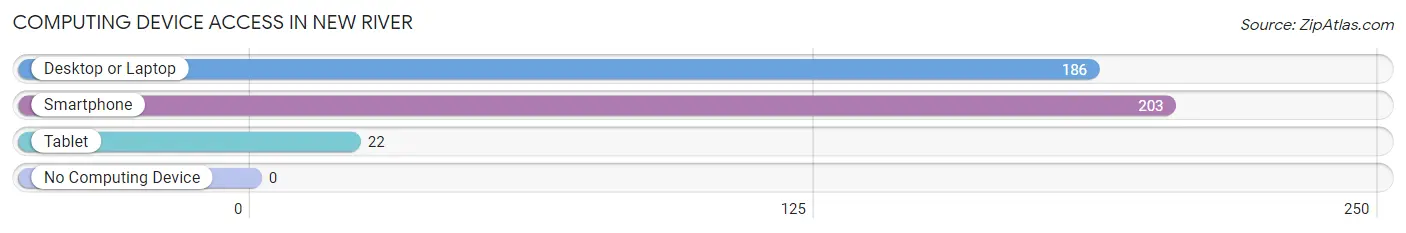
| Device Type | # Households | % Households |
| Desktop or Laptop | 186 | 91.6% |
| Smartphone | 203 | 100.0% |
| Tablet | 22 | 10.8% |
| No Computing Device | 0 | 0.0% |
| Total | 203 | 100.0% |
Internet Access in New River
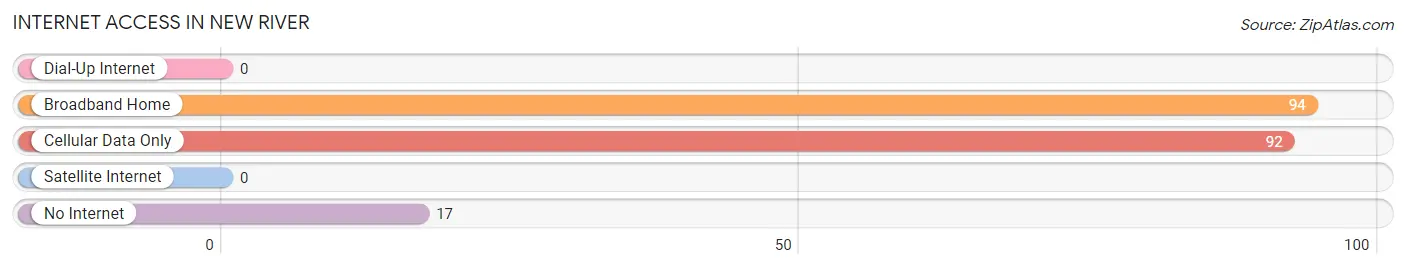
| Internet Type | # Households | % Households |
| Dial-Up Internet | 0 | 0.0% |
| Broadband Home | 94 | 46.3% |
| Cellular Data Only | 92 | 45.3% |
| Satellite Internet | 0 | 0.0% |
| No Internet | 17 | 8.4% |
| Total | 203 | 100.0% |
New River Summary
New River is a small unincorporated community located in Pulaski County, Virginia. It is situated along the New River, which is a tributary of the larger Kanawha River. The community is located in the Appalachian Mountains and is surrounded by the Jefferson National Forest. The population of New River was estimated to be around 1,000 people in 2000.
History
The area that is now known as New River was first settled in the late 1700s by settlers from the eastern part of the United States. The area was originally known as “New River Settlement” and was part of Montgomery County. In 1839, the area was officially incorporated as the Town of New River. The town was named after the nearby New River, which was named by explorer Christopher Gist in 1751.
The town of New River was an important stop on the Great Road, which was a major route for settlers traveling westward. The town was also a major stop on the Virginia and Tennessee Railroad, which was built in the late 1800s.
Geography
New River is located in the Appalachian Mountains in Pulaski County, Virginia. The town is situated along the New River, which is a tributary of the larger Kanawha River. The town is surrounded by the Jefferson National Forest and is located near the border of West Virginia.
The town of New River has a total area of 1.2 square miles, all of which is land. The town is located at an elevation of 1,890 feet above sea level. The climate in New River is classified as humid subtropical, with hot, humid summers and mild winters.
Economy
The economy of New River is largely based on tourism and outdoor recreation. The town is home to several campgrounds, fishing spots, and hiking trails. The town is also home to several small businesses, including restaurants, stores, and a post office.
The town is also home to several manufacturing companies, including a furniture factory and a paper mill. The town is also home to a coal mine, which is owned by the Appalachian Coal Company.
Demographics
The population of New River was estimated to be around 1,000 people in 2000. The town is predominantly white, with around 95% of the population being white. The median household income in New River is around $30,000, and the median home value is around $90,000.
The town is served by the Pulaski County Public Schools system. The town is also home to several churches, including the New River Baptist Church and the New River United Methodist Church.
Conclusion
New River is a small unincorporated community located in Pulaski County, Virginia. The town was first settled in the late 1700s and was an important stop on the Great Road and the Virginia and Tennessee Railroad. The town is situated along the New River and is surrounded by the Jefferson National Forest. The economy of New River is largely based on tourism and outdoor recreation, as well as several manufacturing companies. The population of New River was estimated to be around 1,000 people in 2000.
Common Questions
What is Per Capita Income in New River?
Per Capita income in New River is $40,387.
What is the Median Family Income in New River?
Median Family Income in New River is $111,337.
What is Inequality or Gini Index in New River?
Inequality or Gini Index in New River is 0.31.
What is the Total Population of New River?
Total Population of New River is 387.
What is the Total Male Population of New River?
Total Male Population of New River is 152.
What is the Total Female Population of New River?
Total Female Population of New River is 235.
What is the Ratio of Males per 100 Females in New River?
There are 64.68 Males per 100 Females in New River.
What is the Ratio of Females per 100 Males in New River?
There are 154.61 Females per 100 Males in New River.
What is the Median Population Age in New River?
Median Population Age in New River is 52.9 Years.
What is the Average Family Size in New River
Average Family Size in New River is 2.7 People.
What is the Average Household Size in New River
Average Household Size in New River is 1.9 People.
How Large is the Labor Force in New River?
There are 335 People in the Labor Forcein in New River.
What is the Percentage of People in the Labor Force in New River?
86.6% of People are in the Labor Force in New River.
What is the Unemployment Rate in New River?
Unemployment Rate in New River is 4.2%.