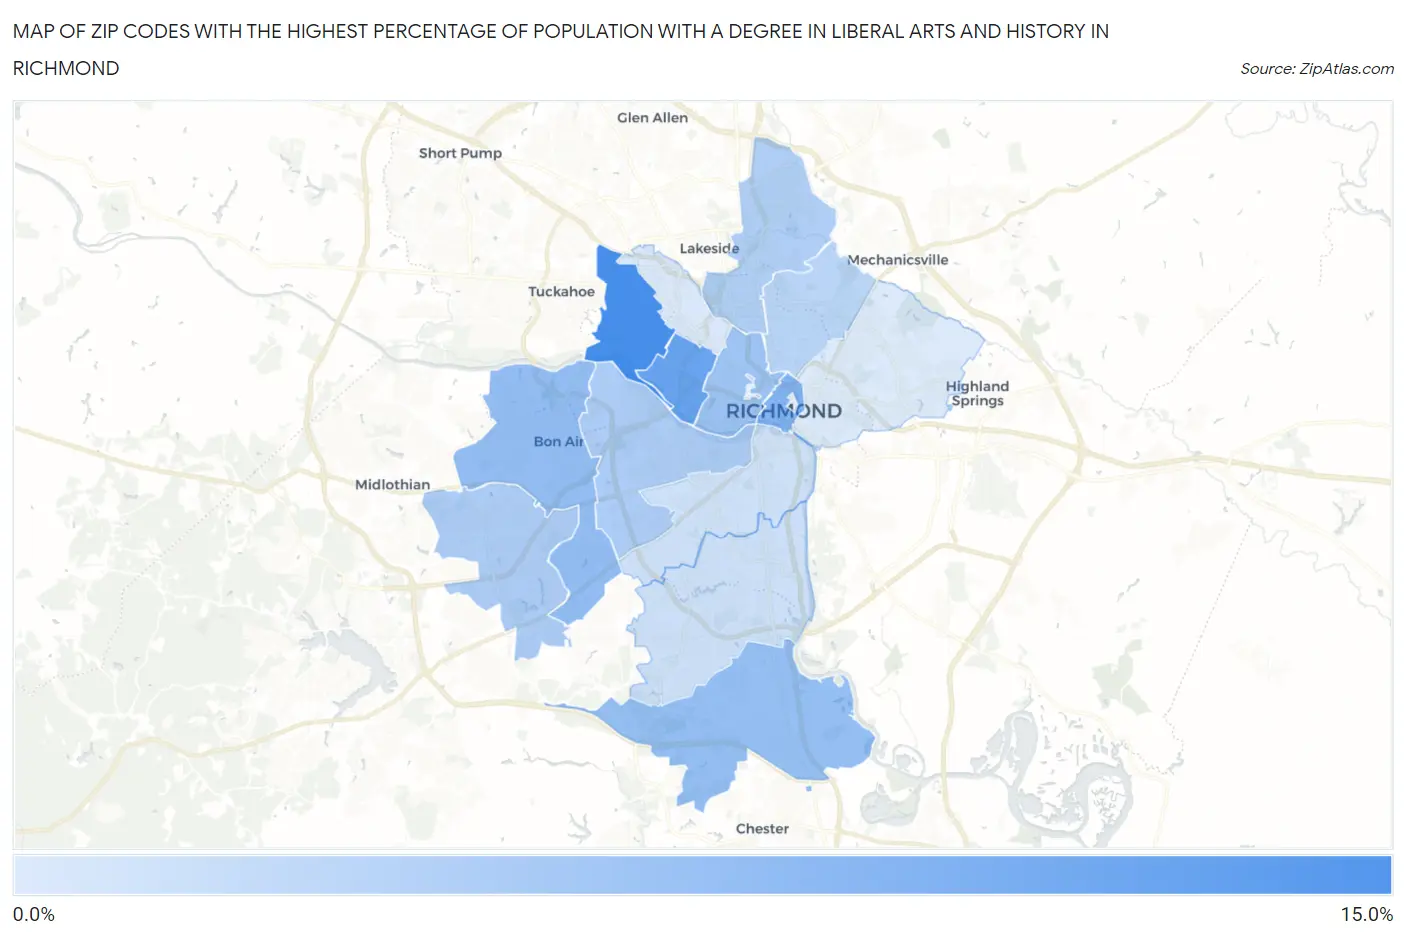
Zip Codes with the Highest Percentage of Population with a Degree in Liberal Arts and History in Richmond, VA
RELATED REPORTS & OPTIONS
Liberal Arts and History
Richmond
Compare Zip Codes
Map of Zip Codes with the Highest Percentage of Population with a Degree in Liberal Arts and History in Richmond
3.7%
11.3%
Zip Codes with the Highest Percentage of Population with a Degree in Liberal Arts and History in Richmond, VA
| Zip Code | % Graduates | vs State | vs National | |
| 1. | 23226 | 11.3% | 5.9%(+5.47)#107 | 4.9%(+6.45)#2,430 |
| 2. | 23221 | 9.5% | 5.9%(+3.60)#141 | 4.9%(+4.58)#3,489 |
| 3. | 23219 | 8.2% | 5.9%(+2.37)#198 | 4.9%(+3.35)#4,626 |
| 4. | 23235 | 7.4% | 5.9%(+1.51)#244 | 4.9%(+2.49)#5,786 |
| 5. | 23237 | 7.3% | 5.9%(+1.40)#252 | 4.9%(+2.38)#5,956 |
| 6. | 23220 | 6.8% | 5.9%(+0.931)#285 | 4.9%(+1.91)#6,772 |
| 7. | 23225 | 6.1% | 5.9%(+0.237)#327 | 4.9%(+1.22)#8,285 |
| 8. | 23236 | 6.0% | 5.9%(+0.163)#331 | 4.9%(+1.15)#8,476 |
| 9. | 23227 | 5.9% | 5.9%(+0.028)#343 | 4.9%(+1.01)#8,804 |
| 10. | 23222 | 5.3% | 5.9%(-0.534)#385 | 4.9%(+0.449)#10,373 |
| 11. | 23234 | 4.4% | 5.9%(-1.43)#469 | 4.9%(-0.444)#13,199 |
| 12. | 23224 | 4.3% | 5.9%(-1.52)#477 | 4.9%(-0.542)#13,537 |
| 13. | 23230 | 3.7% | 5.9%(-2.13)#517 | 4.9%(-1.14)#15,781 |
| 14. | 23223 | 3.7% | 5.9%(-2.20)#519 | 4.9%(-1.22)#16,047 |
1
Common Questions
What are the Top 10 Zip Codes with the Highest Percentage of Population with a Degree in Liberal Arts and History in Richmond, VA?
Top 10 Zip Codes with the Highest Percentage of Population with a Degree in Liberal Arts and History in Richmond, VA are:
What zip code has the Highest Percentage of Population with a Degree in Liberal Arts and History in Richmond, VA?
23226 has the Highest Percentage of Population with a Degree in Liberal Arts and History in Richmond, VA with 11.3%.
What is the Percentage of Population with a Degree in Liberal Arts and History in Richmond, VA?
Percentage of Population with a Degree in Liberal Arts and History in Richmond is 6.9%.
What is the Percentage of Population with a Degree in Liberal Arts and History in Virginia?
Percentage of Population with a Degree in Liberal Arts and History in Virginia is 5.9%.
What is the Percentage of Population with a Degree in Liberal Arts and History in the United States?
Percentage of Population with a Degree in Liberal Arts and History in the United States is 4.9%.