Parrott, VA Map & Demographics
Parrott Map
Parrott Overview
$11,210
PER CAPITA INCOME
$40,455
AVG FAMILY INCOME
0.38
INEQUALITY / GINI INDEX
350
TOTAL POPULATION
145
MALE POPULATION
205
FEMALE POPULATION
70.73
MALES / 100 FEMALES
141.38
FEMALES / 100 MALES
38.1
MEDIAN AGE
2.3
AVG FAMILY SIZE
2.6
AVG HOUSEHOLD SIZE
66
LABOR FORCE [ PEOPLE ]
26.8%
PERCENT IN LABOR FORCE
51.5%
UNEMPLOYMENT RATE
Parrott Zip Codes
Parrott Area Codes
Income in Parrott
Income Overview in Parrott
| Characteristic | Number | Measure |
| Per Capita Income | 350 | $11,210 |
| Median Family Income | 72 | $40,455 |
| Mean Family Income | 72 | $45,251 |
| Median Household Income | 134 | $0 |
| Mean Household Income | 134 | $29,165 |
| Income Deficit | 72 | $0 |
| Wage / Income Gap (%) | 350 | 0.00% |
| Wage / Income Gap ($) | 350 | 100.00¢ per $1 |
| Gini / Inequality Index | 350 | 0.38 |
Earnings by Sex in Parrott
| Sex | Number | Average Earnings |
| Male | 62 (93.9%) | $0 |
| Female | 4 (6.1%) | $0 |
| Total | 66 (100.0%) | $0 |
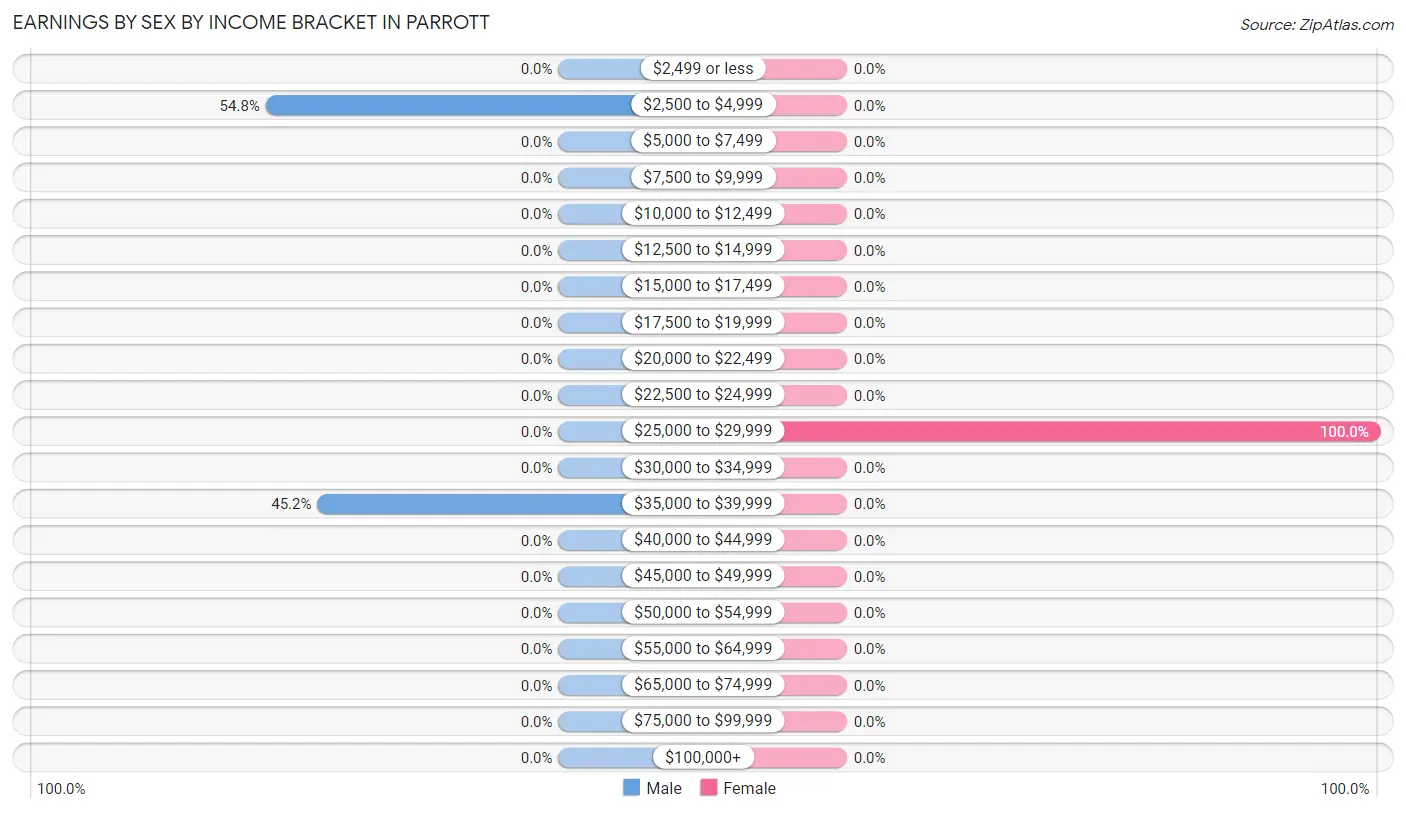
Earnings by Sex by Income Bracket in Parrott
The most common earnings brackets in Parrott are $2,500 to $4,999 for men (34 | 54.8%) and $25,000 to $29,999 for women (4 | 100.0%).
| Income | Male | Female |
| $2,499 or less | 0 (0.0%) | 0 (0.0%) |
| $2,500 to $4,999 | 34 (54.8%) | 0 (0.0%) |
| $5,000 to $7,499 | 0 (0.0%) | 0 (0.0%) |
| $7,500 to $9,999 | 0 (0.0%) | 0 (0.0%) |
| $10,000 to $12,499 | 0 (0.0%) | 0 (0.0%) |
| $12,500 to $14,999 | 0 (0.0%) | 0 (0.0%) |
| $15,000 to $17,499 | 0 (0.0%) | 0 (0.0%) |
| $17,500 to $19,999 | 0 (0.0%) | 0 (0.0%) |
| $20,000 to $22,499 | 0 (0.0%) | 0 (0.0%) |
| $22,500 to $24,999 | 0 (0.0%) | 0 (0.0%) |
| $25,000 to $29,999 | 0 (0.0%) | 4 (100.0%) |
| $30,000 to $34,999 | 0 (0.0%) | 0 (0.0%) |
| $35,000 to $39,999 | 28 (45.2%) | 0 (0.0%) |
| $40,000 to $44,999 | 0 (0.0%) | 0 (0.0%) |
| $45,000 to $49,999 | 0 (0.0%) | 0 (0.0%) |
| $50,000 to $54,999 | 0 (0.0%) | 0 (0.0%) |
| $55,000 to $64,999 | 0 (0.0%) | 0 (0.0%) |
| $65,000 to $74,999 | 0 (0.0%) | 0 (0.0%) |
| $75,000 to $99,999 | 0 (0.0%) | 0 (0.0%) |
| $100,000+ | 0 (0.0%) | 0 (0.0%) |
| Total | 62 (100.0%) | 4 (100.0%) |
Earnings by Sex by Educational Attainment in Parrott
| Educational Attainment | Male Income | Female Income |
| Less than High School | - | - |
| High School Diploma | - | - |
| College or Associate's Degree | - | - |
| Bachelor's Degree | - | - |
| Graduate Degree | - | - |
| Total | - | - |
Family Income in Parrott
Family Income Brackets in Parrott
According to the Parrott family income data, there are 63 families falling into the $35,000 to $49,999 income range, which is the most common income bracket and makes up 87.5% of all families.
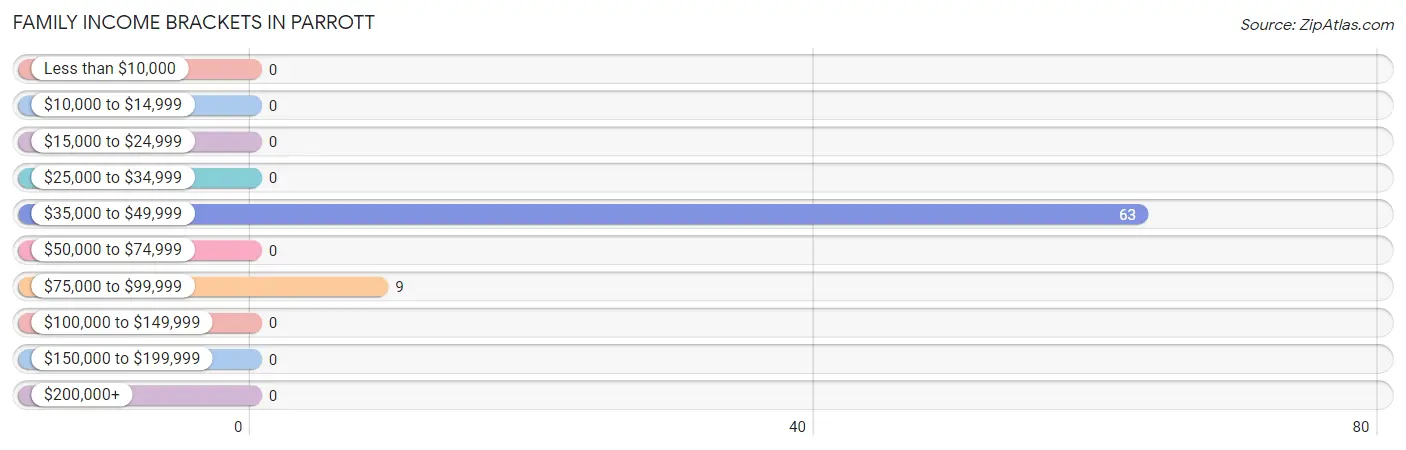
| Income Bracket | # Families | % Families |
| Less than $10,000 | 0 | 0.0% |
| $10,000 to $14,999 | 0 | 0.0% |
| $15,000 to $24,999 | 0 | 0.0% |
| $25,000 to $34,999 | 0 | 0.0% |
| $35,000 to $49,999 | 63 | 87.5% |
| $50,000 to $74,999 | 0 | 0.0% |
| $75,000 to $99,999 | 9 | 12.5% |
| $100,000 to $149,999 | 0 | 0.0% |
| $150,000 to $199,999 | 0 | 0.0% |
| $200,000+ | 0 | 0.0% |
Family Income by Famaliy Size in Parrott
2-person families (70 | 97.2%) account for the highest median family income in Parrott with $40,530 per family, while 2-person families (70 | 97.2%) have the highest median income of $20,265 per family member.
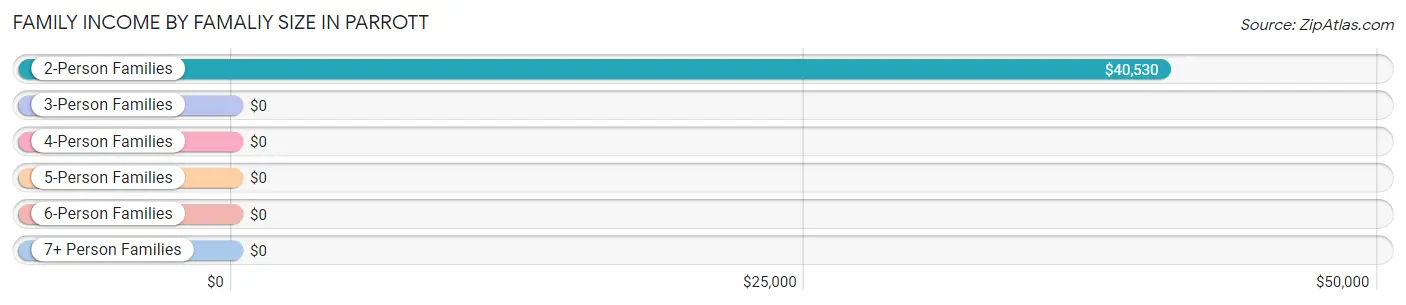
| Income Bracket | # Families | Median Income |
| 2-Person Families | 70 (97.2%) | $40,530 |
| 3-Person Families | 0 (0.0%) | $0 |
| 4-Person Families | 2 (2.8%) | $0 |
| 5-Person Families | 0 (0.0%) | $0 |
| 6-Person Families | 0 (0.0%) | $0 |
| 7+ Person Families | 0 (0.0%) | $0 |
| Total | 72 (100.0%) | $40,455 |
Family Income by Number of Earners in Parrott
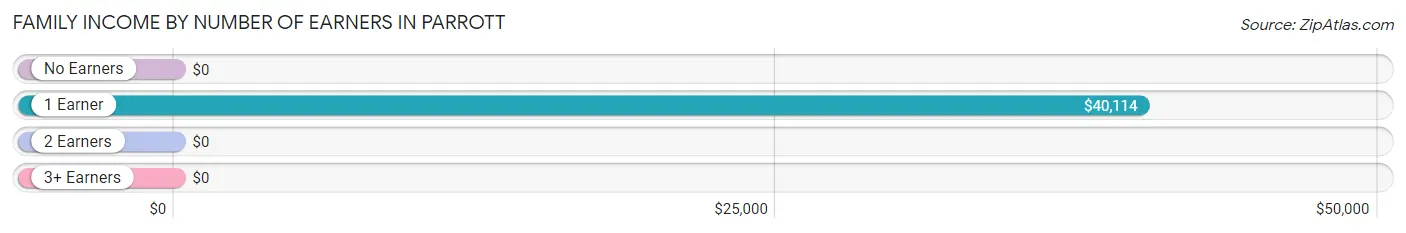
| Number of Earners | # Families | Median Income |
| No Earners | 9 (12.5%) | $0 |
| 1 Earner | 63 (87.5%) | $40,114 |
| 2 Earners | 0 (0.0%) | $0 |
| 3+ Earners | 0 (0.0%) | $0 |
| Total | 72 (100.0%) | $40,455 |
Household Income in Parrott
Household Income Brackets in Parrott
With 63 households falling in the category, the $35,000 to $49,999 income range is the most frequent in Parrott, accounting for 47.0% of all households.
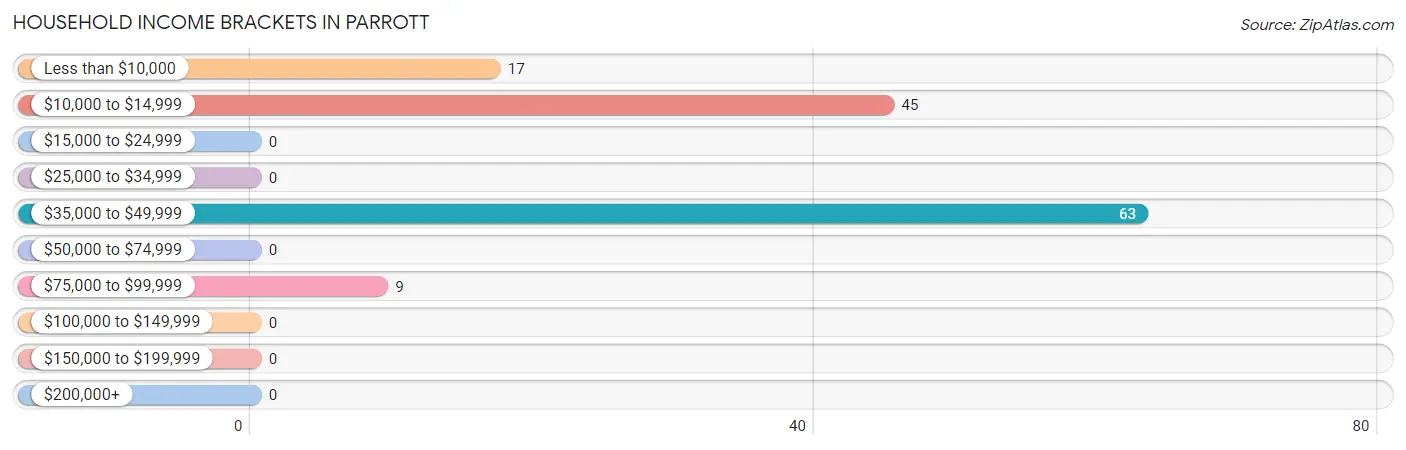
| Income Bracket | # Households | % Households |
| Less than $10,000 | 17 | 12.7% |
| $10,000 to $14,999 | 45 | 33.6% |
| $15,000 to $24,999 | 0 | 0.0% |
| $25,000 to $34,999 | 0 | 0.0% |
| $35,000 to $49,999 | 63 | 47.0% |
| $50,000 to $74,999 | 0 | 0.0% |
| $75,000 to $99,999 | 9 | 6.7% |
| $100,000 to $149,999 | 0 | 0.0% |
| $150,000 to $199,999 | 0 | 0.0% |
| $200,000+ | 0 | 0.0% |
Household Income by Householder Age in Parrott
| Income Bracket | # Households | Median Income |
| 15 to 24 Years | 0 (0.0%) | $0 |
| 25 to 44 Years | 0 (0.0%) | $0 |
| 45 to 64 Years | 92 (68.7%) | $0 |
| 65+ Years | 42 (31.3%) | $0 |
| Total | 134 (100.0%) | $0 |
Poverty in Parrott
Income Below Poverty by Sex and Age in Parrott
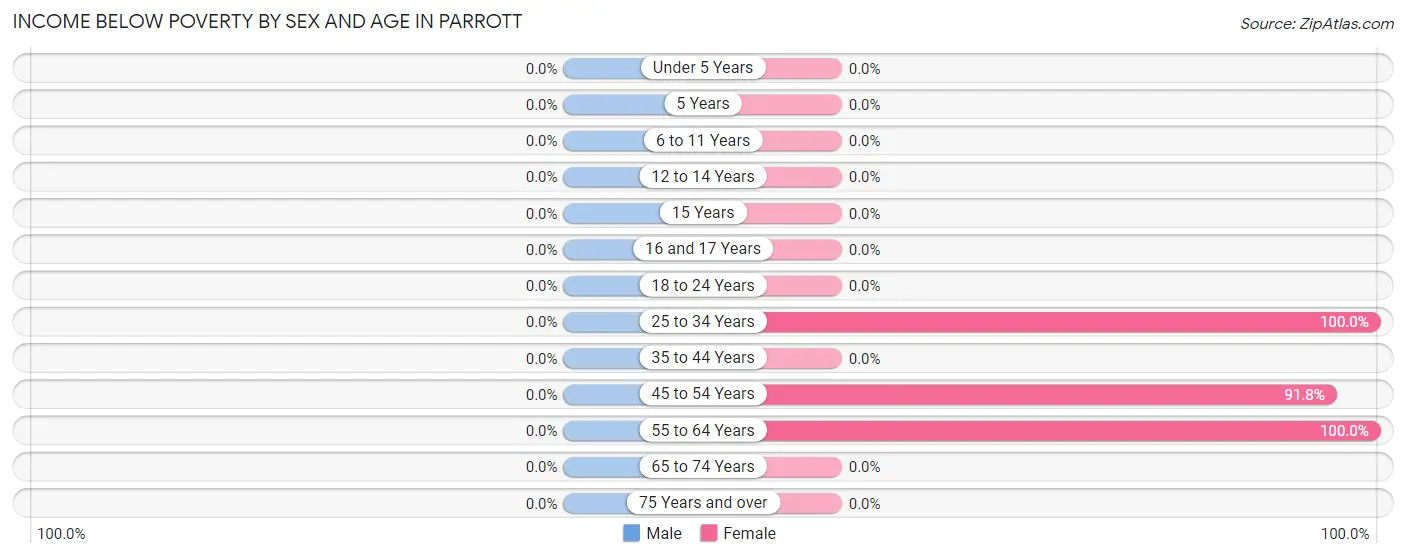
| Age Bracket | Male | Female |
| Under 5 Years | 0 (0.0%) | 0 (0.0%) |
| 5 Years | 0 (0.0%) | 0 (0.0%) |
| 6 to 11 Years | 0 (0.0%) | 0 (0.0%) |
| 12 to 14 Years | 0 (0.0%) | 0 (0.0%) |
| 15 Years | 0 (0.0%) | 0 (0.0%) |
| 16 and 17 Years | 0 (0.0%) | 0 (0.0%) |
| 18 to 24 Years | 0 (0.0%) | 0 (0.0%) |
| 25 to 34 Years | 0 (0.0%) | 26 (100.0%) |
| 35 to 44 Years | 0 (0.0%) | 0 (0.0%) |
| 45 to 54 Years | 0 (0.0%) | 45 (91.8%) |
| 55 to 64 Years | 0 (0.0%) | 17 (100.0%) |
| 65 to 74 Years | 0 (0.0%) | 0 (0.0%) |
| 75 Years and over | 0 (0.0%) | 0 (0.0%) |
| Total | 0 (0.0%) | 88 (83.0%) |
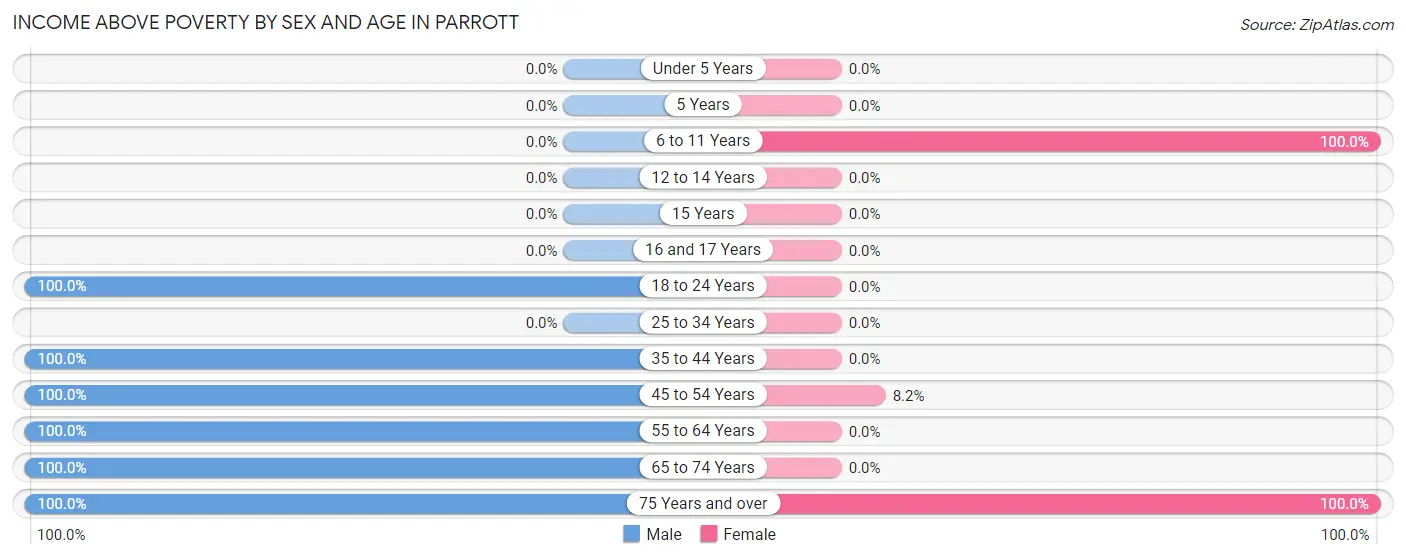
Income Above Poverty by Sex and Age in Parrott
According to the poverty statistics in Parrott, males aged 18 to 24 years and females aged 6 to 11 years are the age groups that are most secure financially, with 100.0% of males and 100.0% of females in these age groups living above the poverty line.
| Age Bracket | Male | Female |
| Under 5 Years | 0 (0.0%) | 0 (0.0%) |
| 5 Years | 0 (0.0%) | 0 (0.0%) |
| 6 to 11 Years | 0 (0.0%) | 5 (100.0%) |
| 12 to 14 Years | 0 (0.0%) | 0 (0.0%) |
| 15 Years | 0 (0.0%) | 0 (0.0%) |
| 16 and 17 Years | 0 (0.0%) | 0 (0.0%) |
| 18 to 24 Years | 40 (100.0%) | 0 (0.0%) |
| 25 to 34 Years | 0 (0.0%) | 0 (0.0%) |
| 35 to 44 Years | 34 (100.0%) | 0 (0.0%) |
| 45 to 54 Years | 28 (100.0%) | 4 (8.2%) |
| 55 to 64 Years | 2 (100.0%) | 0 (0.0%) |
| 65 to 74 Years | 33 (100.0%) | 0 (0.0%) |
| 75 Years and over | 8 (100.0%) | 9 (100.0%) |
| Total | 145 (100.0%) | 18 (17.0%) |
Income Below Poverty Among Married-Couple Families in Parrott
| Children | Above Poverty | Below Poverty |
| No Children | 9 (100.0%) | 0 (0.0%) |
| 1 or 2 Children | 2 (100.0%) | 0 (0.0%) |
| 3 or 4 Children | 0 (0.0%) | 0 (0.0%) |
| 5 or more Children | 0 (0.0%) | 0 (0.0%) |
| Total | 11 (100.0%) | 0 (0.0%) |
Income Below Poverty Among Single-Parent Households in Parrott
| Children | Single Father | Single Mother |
| No Children | 0 (0.0%) | 0 (0.0%) |
| 1 or 2 Children | 0 (0.0%) | 0 (0.0%) |
| 3 or 4 Children | 0 (0.0%) | 0 (0.0%) |
| 5 or more Children | 0 (0.0%) | 0 (0.0%) |
| Total | 0 (0.0%) | 0 (0.0%) |
Income Below Poverty Among Married-Couple vs Single-Parent Households in Parrott
| Children | Married-Couple Families | Single-Parent Households |
| No Children | 0 (0.0%) | 0 (0.0%) |
| 1 or 2 Children | 0 (0.0%) | 0 (0.0%) |
| 3 or 4 Children | 0 (0.0%) | 0 (0.0%) |
| 5 or more Children | 0 (0.0%) | 0 (0.0%) |
| Total | 0 (0.0%) | 0 (0.0%) |
Race in Parrott
The most populous races in Parrott are White / Caucasian (331 | 94.6%), and Asian (19 | 5.4%).
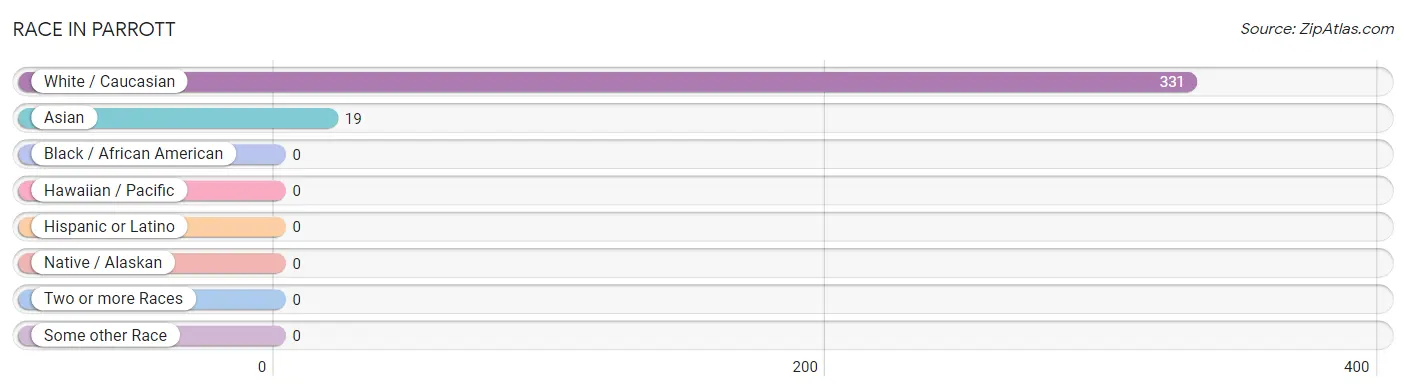
| Race | # Population | % Population |
| Asian | 19 | 5.4% |
| Black / African American | 0 | 0.0% |
| Hawaiian / Pacific | 0 | 0.0% |
| Hispanic or Latino | 0 | 0.0% |
| Native / Alaskan | 0 | 0.0% |
| White / Caucasian | 331 | 94.6% |
| Two or more Races | 0 | 0.0% |
| Some other Race | 0 | 0.0% |
| Total | 350 | 100.0% |
Ancestry in Parrott
The most populous ancestries reported in Parrott are Scotch-Irish (62 | 17.7%), English (26 | 7.4%), Sri Lankan (19 | 5.4%), and Italian (8 | 2.3%), together accounting for 32.9% of all Parrott residents.
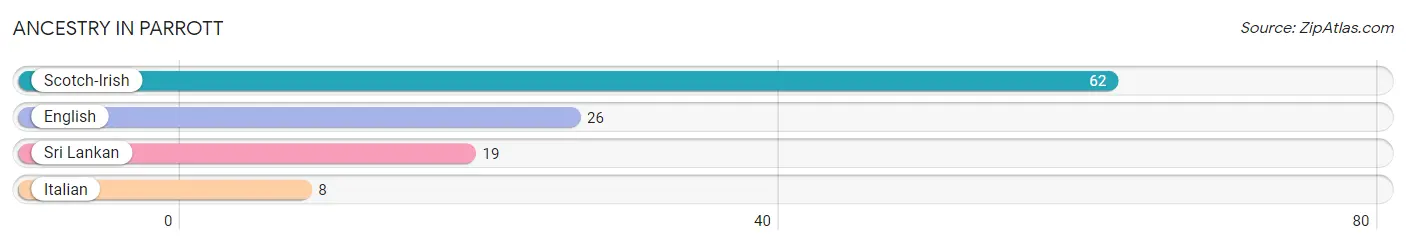
| Ancestry | # Population | % Population |
| English | 26 | 7.4% |
| Italian | 8 | 2.3% |
| Scotch-Irish | 62 | 17.7% |
| Sri Lankan | 19 | 5.4% | View All 4 Rows |
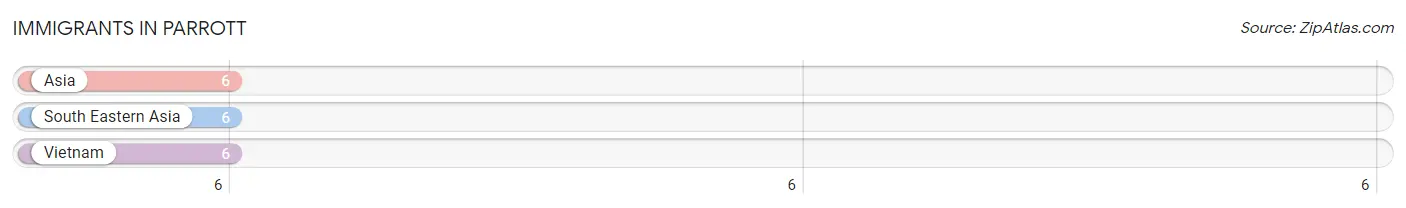
Immigrants in Parrott
The most numerous immigrant groups reported in Parrott came from Asia (6 | 1.7%), South Eastern Asia (6 | 1.7%), and Vietnam (6 | 1.7%), together accounting for 5.1% of all Parrott residents.
| Immigration Origin | # Population | % Population |
| Asia | 6 | 1.7% |
| South Eastern Asia | 6 | 1.7% |
| Vietnam | 6 | 1.7% | View All 3 Rows |
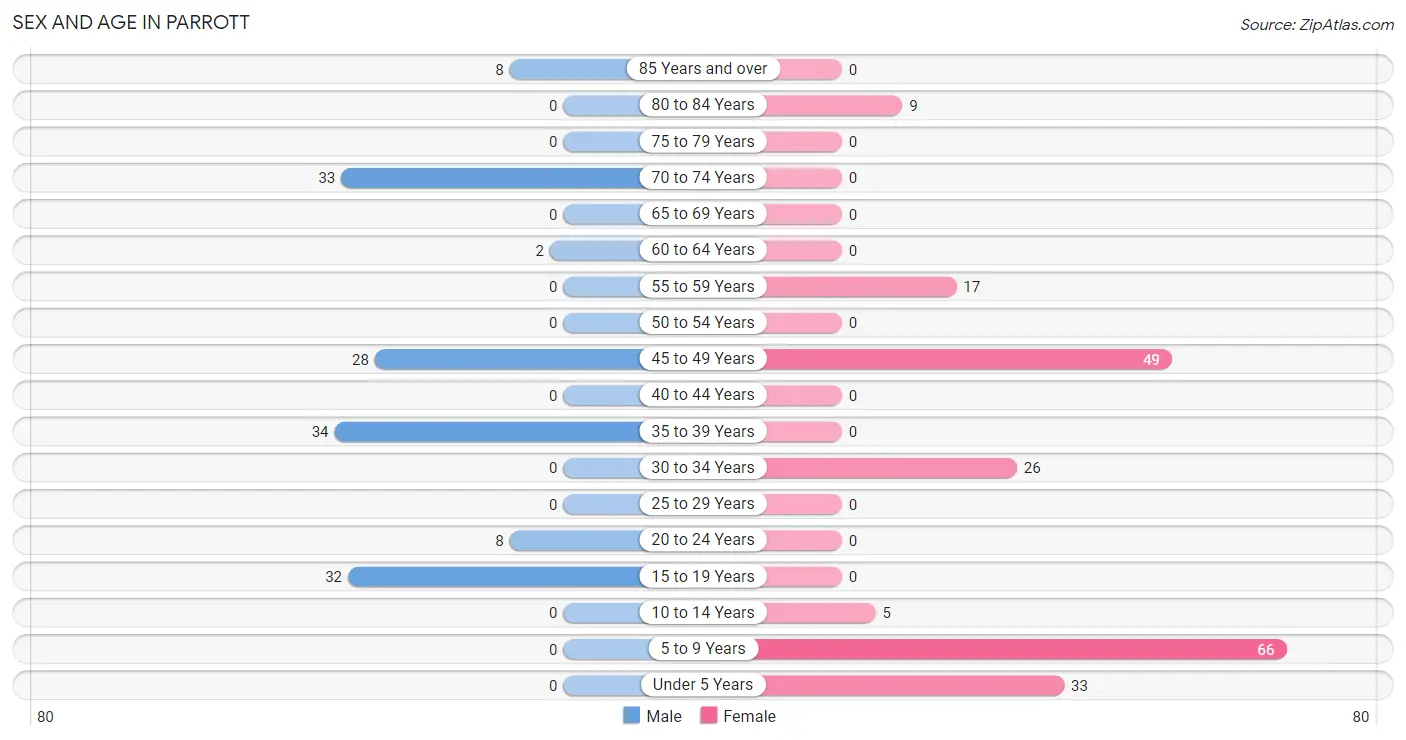
Sex and Age in Parrott
Sex and Age in Parrott
The most populous age groups in Parrott are 35 to 39 Years (34 | 23.4%) for men and 5 to 9 Years (66 | 32.2%) for women.
| Age Bracket | Male | Female |
| Under 5 Years | 0 (0.0%) | 33 (16.1%) |
| 5 to 9 Years | 0 (0.0%) | 66 (32.2%) |
| 10 to 14 Years | 0 (0.0%) | 5 (2.4%) |
| 15 to 19 Years | 32 (22.1%) | 0 (0.0%) |
| 20 to 24 Years | 8 (5.5%) | 0 (0.0%) |
| 25 to 29 Years | 0 (0.0%) | 0 (0.0%) |
| 30 to 34 Years | 0 (0.0%) | 26 (12.7%) |
| 35 to 39 Years | 34 (23.4%) | 0 (0.0%) |
| 40 to 44 Years | 0 (0.0%) | 0 (0.0%) |
| 45 to 49 Years | 28 (19.3%) | 49 (23.9%) |
| 50 to 54 Years | 0 (0.0%) | 0 (0.0%) |
| 55 to 59 Years | 0 (0.0%) | 17 (8.3%) |
| 60 to 64 Years | 2 (1.4%) | 0 (0.0%) |
| 65 to 69 Years | 0 (0.0%) | 0 (0.0%) |
| 70 to 74 Years | 33 (22.8%) | 0 (0.0%) |
| 75 to 79 Years | 0 (0.0%) | 0 (0.0%) |
| 80 to 84 Years | 0 (0.0%) | 9 (4.4%) |
| 85 Years and over | 8 (5.5%) | 0 (0.0%) |
| Total | 145 (100.0%) | 205 (100.0%) |
Families and Households in Parrott
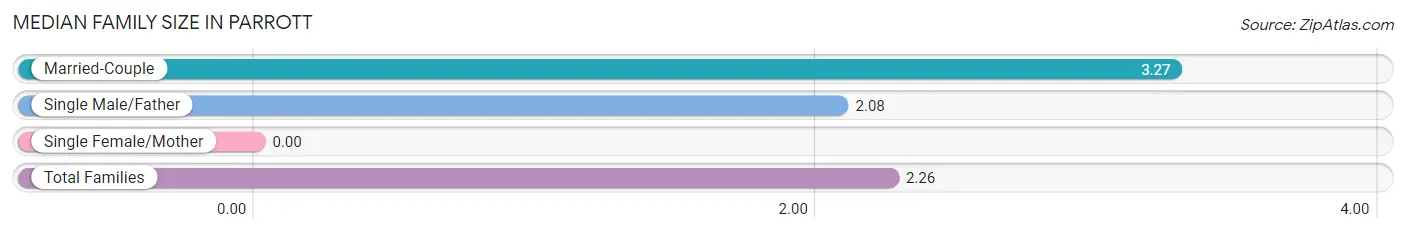
Median Family Size in Parrott
| Family Type | # Families | Family Size |
| Married-Couple | 11 (15.3%) | 3.27 |
| Single Male/Father | 61 (84.7%) | 2.08 |
| Single Female/Mother | 0 (0.0%) | - |
| Total Families | 72 (100.0%) | 2.26 |
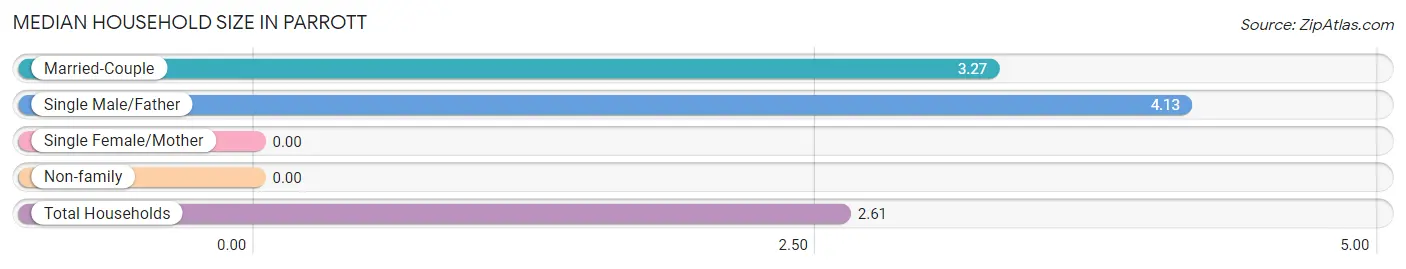
Median Household Size in Parrott
| Household Type | # Households | Household Size |
| Married-Couple | 11 (8.2%) | 3.27 |
| Single Male/Father | 61 (45.5%) | 4.13 |
| Single Female/Mother | 0 (0.0%) | - |
| Non-family | 62 (46.3%) | - |
| Total Households | 134 (100.0%) | 2.61 |
Household Size by Marriage Status in Parrott
Out of a total of 134 households in Parrott, 72 (53.7%) are family households, while 62 (46.3%) are nonfamily households. The most numerous type of family households are 2-person households, comprising 37, and the most common type of nonfamily households are 1-person households, comprising 62.
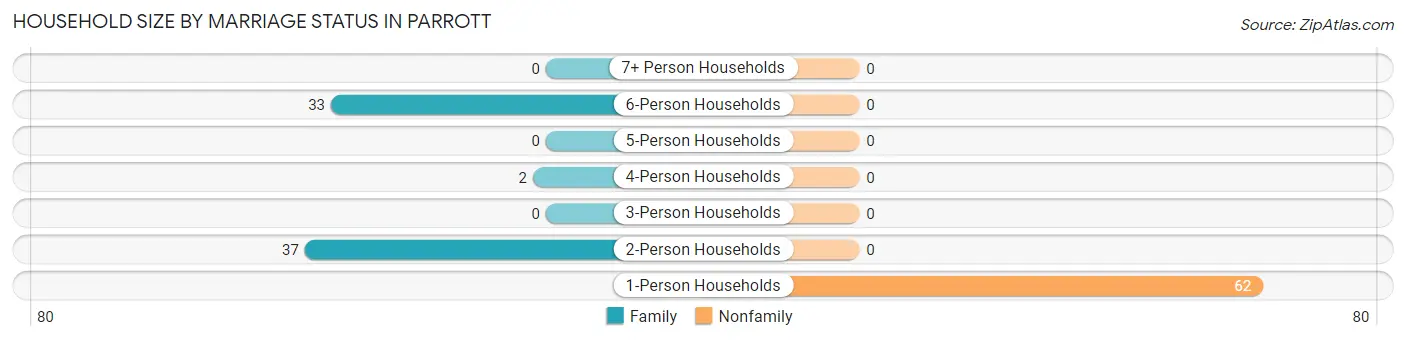
| Household Size | Family Households | Nonfamily Households |
| 1-Person Households | - | 62 (46.3%) |
| 2-Person Households | 37 (27.6%) | 0 (0.0%) |
| 3-Person Households | 0 (0.0%) | 0 (0.0%) |
| 4-Person Households | 2 (1.5%) | 0 (0.0%) |
| 5-Person Households | 0 (0.0%) | 0 (0.0%) |
| 6-Person Households | 33 (24.6%) | 0 (0.0%) |
| 7+ Person Households | 0 (0.0%) | 0 (0.0%) |
| Total | 72 (53.7%) | 62 (46.3%) |
Female Fertility in Parrott
Fertility by Age in Parrott
Average fertility rate in Parrott is 347.0 births per 1,000 women. Women in the age bracket of 20 to 34 years have the highest fertility rate with 1,000.0 births per 1,000 women. Women in the age bracket of 20 to 34 years acount for 100.0% of all women with births.
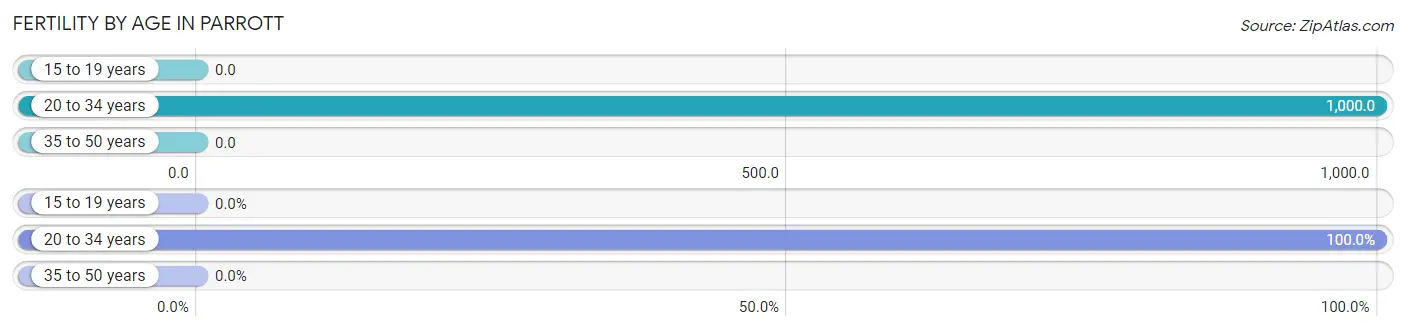
| Age Bracket | Women with Births | Births / 1,000 Women |
| 15 to 19 years | 0 (0.0%) | 0.0 |
| 20 to 34 years | 26 (100.0%) | 1,000.0 |
| 35 to 50 years | 0 (0.0%) | 0.0 |
| Total | 26 (100.0%) | 347.0 |
Fertility by Age by Marriage Status in Parrott
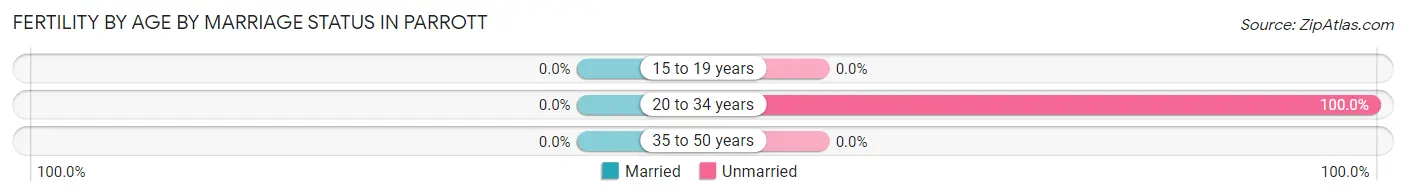
| Age Bracket | Married | Unmarried |
| 15 to 19 years | 0 (0.0%) | 0 (0.0%) |
| 20 to 34 years | 0 (0.0%) | 26 (100.0%) |
| 35 to 50 years | 0 (0.0%) | 0 (0.0%) |
| Total | 0 (0.0%) | 26 (100.0%) |
Fertility by Education in Parrott
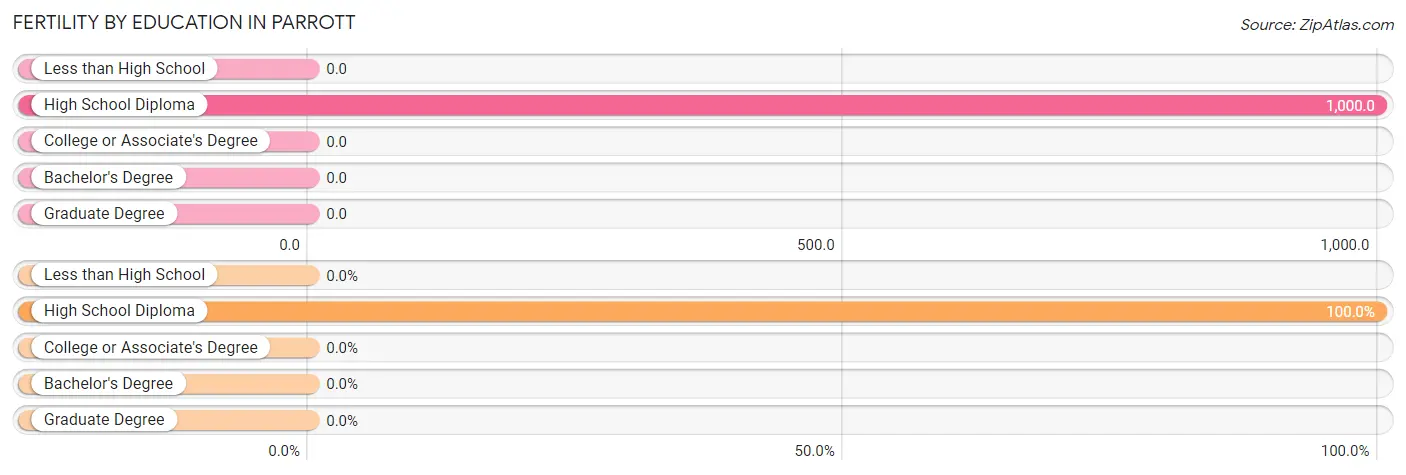
| Educational Attainment | Women with Births | Births / 1,000 Women |
| Less than High School | 0 (0.0%) | 0.0 |
| High School Diploma | 26 (100.0%) | 1,000.0 |
| College or Associate's Degree | 0 (0.0%) | 0.0 |
| Bachelor's Degree | 0 (0.0%) | 0.0 |
| Graduate Degree | 0 (0.0%) | 0.0 |
| Total | 26 (100.0%) | 347.0 |
Fertility by Education by Marriage Status in Parrott
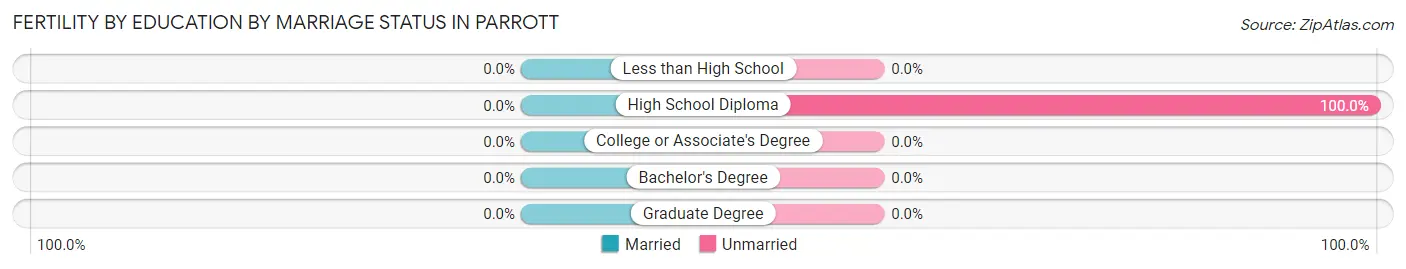
| Educational Attainment | Married | Unmarried |
| Less than High School | 0 (0.0%) | 0 (0.0%) |
| High School Diploma | 0 (0.0%) | 26 (100.0%) |
| College or Associate's Degree | 0 (0.0%) | 0 (0.0%) |
| Bachelor's Degree | 0 (0.0%) | 0 (0.0%) |
| Graduate Degree | 0 (0.0%) | 0 (0.0%) |
| Total | 0 (0.0%) | 26 (100.0%) |
Employment Characteristics in Parrott
Employment by Class of Employer in Parrott
Among the 32 employed individuals in Parrott, , and private company employees (32 | 100.0%) make up the most common classes of employment.
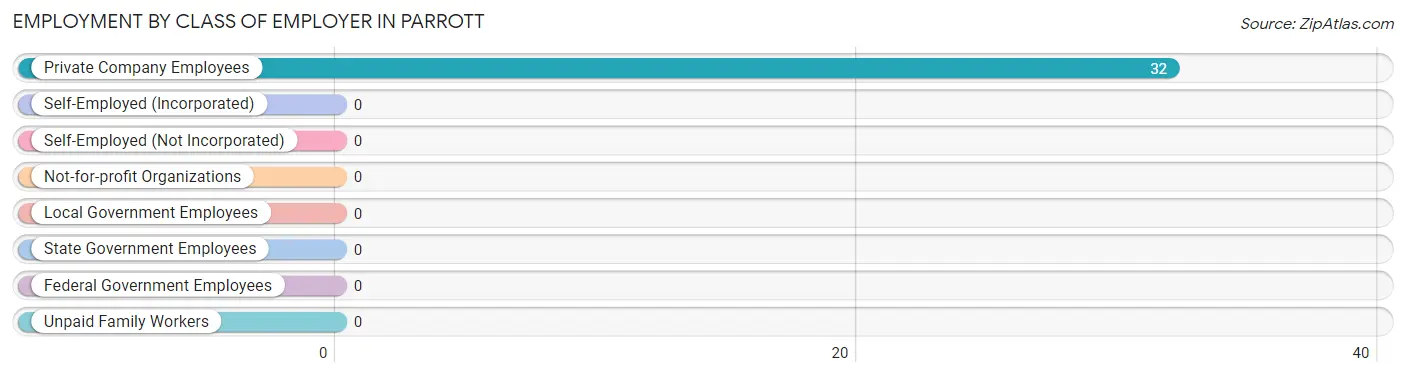
| Employer Class | # Employees | % Employees |
| Private Company Employees | 32 | 100.0% |
| Self-Employed (Incorporated) | 0 | 0.0% |
| Self-Employed (Not Incorporated) | 0 | 0.0% |
| Not-for-profit Organizations | 0 | 0.0% |
| Local Government Employees | 0 | 0.0% |
| State Government Employees | 0 | 0.0% |
| Federal Government Employees | 0 | 0.0% |
| Unpaid Family Workers | 0 | 0.0% |
| Total | 32 | 100.0% |
Employment Status by Age in Parrott
According to the labor force statistics for Parrott, out of the total population over 16 years of age (246), 26.8% or 66 individuals are in the labor force, with 51.5% or 34 of them unemployed. The age group with the highest labor force participation rate is 35 to 44 years, with 100.0% or 34 individuals in the labor force. Within the labor force, the 35 to 44 years age range has the highest percentage of unemployed individuals, with 100.0% or 34 of them being unemployed.
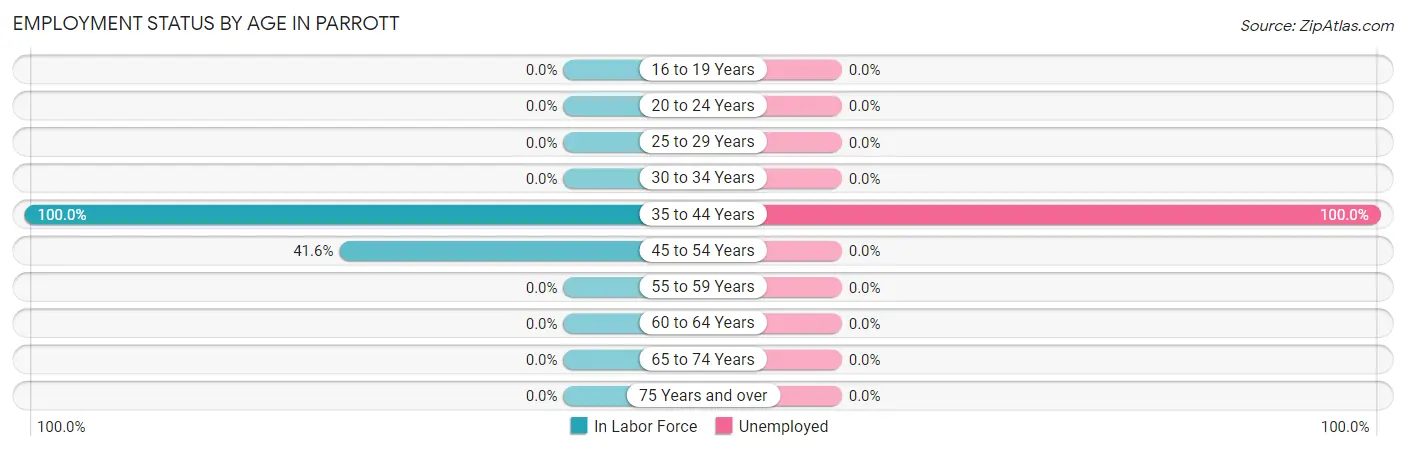
| Age Bracket | In Labor Force | Unemployed |
| 16 to 19 Years | 0 (0.0%) | 0 (0.0%) |
| 20 to 24 Years | 0 (0.0%) | 0 (0.0%) |
| 25 to 29 Years | 0 (0.0%) | 0 (0.0%) |
| 30 to 34 Years | 0 (0.0%) | 0 (0.0%) |
| 35 to 44 Years | 34 (100.0%) | 34 (100.0%) |
| 45 to 54 Years | 32 (41.6%) | 0 (0.0%) |
| 55 to 59 Years | 0 (0.0%) | 0 (0.0%) |
| 60 to 64 Years | 0 (0.0%) | 0 (0.0%) |
| 65 to 74 Years | 0 (0.0%) | 0 (0.0%) |
| 75 Years and over | 0 (0.0%) | 0 (0.0%) |
| Total | 66 (26.8%) | 34 (51.5%) |
Employment Status by Educational Attainment in Parrott
According to labor force statistics for Parrott, 42.3% of individuals (66) out of the total population between 25 and 64 years of age (156) are in the labor force, with 51.5% or 34 of them being unemployed. The group with the highest labor force participation rate are those with the educational attainment of high school diploma, with 70.5% or 62 individuals in the labor force. Within the labor force, individuals with high school diploma education have the highest percentage of unemployment, with 54.8% or 34 of them being unemployed.
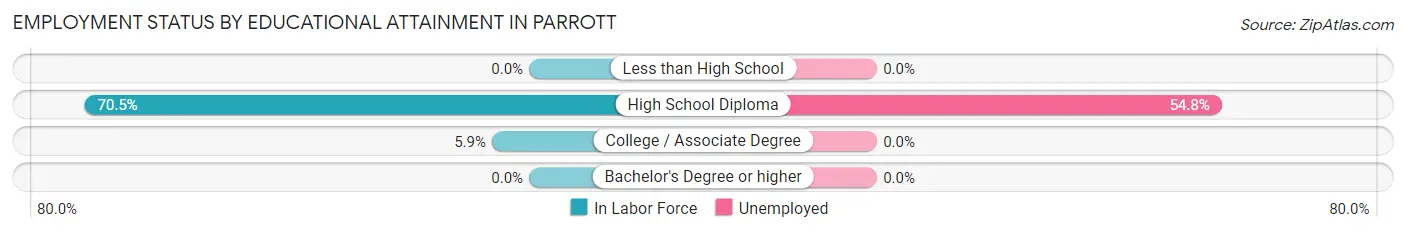
| Educational Attainment | In Labor Force | Unemployed |
| Less than High School | 0 (0.0%) | 0 (0.0%) |
| High School Diploma | 62 (70.5%) | 48 (54.8%) |
| College / Associate Degree | 4 (5.9%) | 0 (0.0%) |
| Bachelor's Degree or higher | 0 (0.0%) | 0 (0.0%) |
| Total | 66 (42.3%) | 80 (51.5%) |
Employment Occupations by Sex in Parrott
Management, Business, Science and Arts Occupations
Management, Business, Science and Arts Occupations by Sex
| Occupation | Male | Female |
| Management | 0 (0.0%) | 0 (0.0%) |
| Business & Financial | 0 (0.0%) | 0 (0.0%) |
| Computers, Engineering & Science | 0 (0.0%) | 0 (0.0%) |
| Computers & Mathematics | 0 (0.0%) | 0 (0.0%) |
| Architecture & Engineering | 0 (0.0%) | 0 (0.0%) |
| Life, Physical & Social Science | 0 (0.0%) | 0 (0.0%) |
| Community & Social Service | 0 (0.0%) | 0 (0.0%) |
| Education, Arts & Media | 0 (0.0%) | 0 (0.0%) |
| Legal Services & Support | 0 (0.0%) | 0 (0.0%) |
| Education Instruction & Library | 0 (0.0%) | 0 (0.0%) |
| Arts, Media & Entertainment | 0 (0.0%) | 0 (0.0%) |
| Health Diagnosing & Treating | 0 (0.0%) | 0 (0.0%) |
| Health Technologists | 0 (0.0%) | 0 (0.0%) |
| Total (Category) | 0 (0.0%) | 0 (0.0%) |
| Total (Overall) | 28 (87.5%) | 4 (12.5%) |
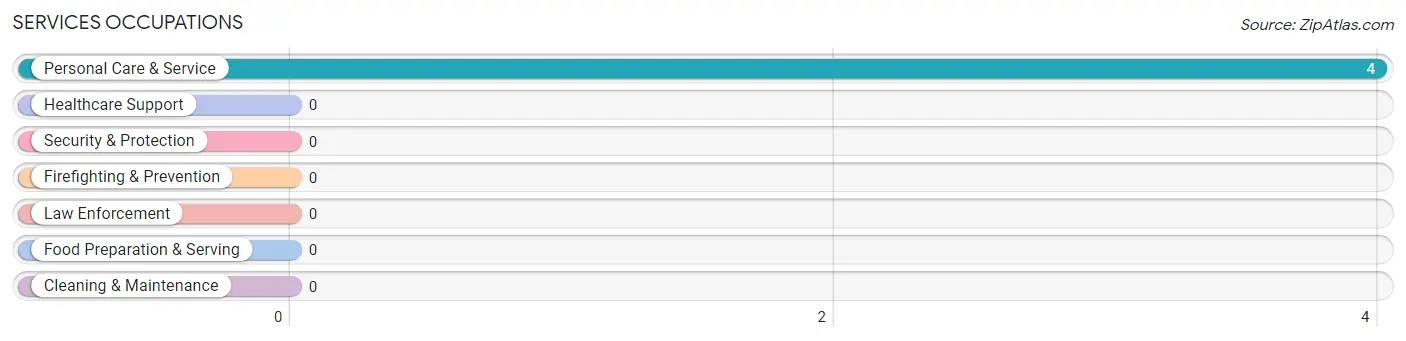
Services Occupations
The most common Services occupations in Parrott are , and Personal Care & Service (4 | 12.5%).
Services Occupations by Sex
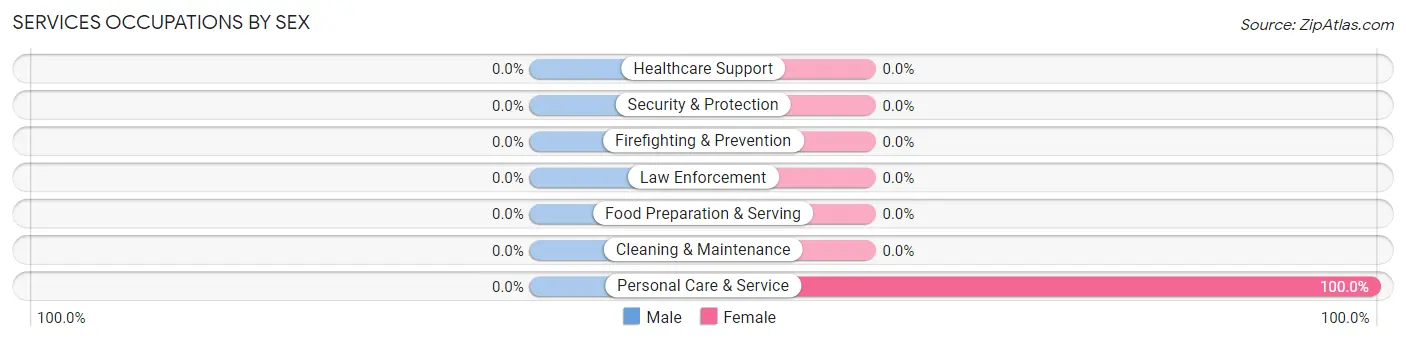
| Occupation | Male | Female |
| Healthcare Support | 0 (0.0%) | 0 (0.0%) |
| Security & Protection | 0 (0.0%) | 0 (0.0%) |
| Firefighting & Prevention | 0 (0.0%) | 0 (0.0%) |
| Law Enforcement | 0 (0.0%) | 0 (0.0%) |
| Food Preparation & Serving | 0 (0.0%) | 0 (0.0%) |
| Cleaning & Maintenance | 0 (0.0%) | 0 (0.0%) |
| Personal Care & Service | 0 (0.0%) | 4 (100.0%) |
| Total (Category) | 0 (0.0%) | 4 (100.0%) |
| Total (Overall) | 28 (87.5%) | 4 (12.5%) |
Sales and Office Occupations

Sales and Office Occupations by Sex
| Occupation | Male | Female |
| Sales & Related | 0 (0.0%) | 0 (0.0%) |
| Office & Administration | 0 (0.0%) | 0 (0.0%) |
| Total (Category) | 0 (0.0%) | 0 (0.0%) |
| Total (Overall) | 28 (87.5%) | 4 (12.5%) |
Natural Resources, Construction and Maintenance Occupations
The most common Natural Resources, Construction and Maintenance occupations in Parrott are , and Construction & Extraction (28 | 87.5%).
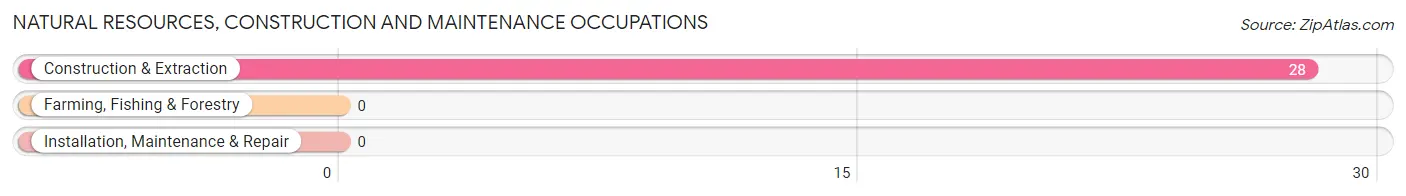
Natural Resources, Construction and Maintenance Occupations by Sex
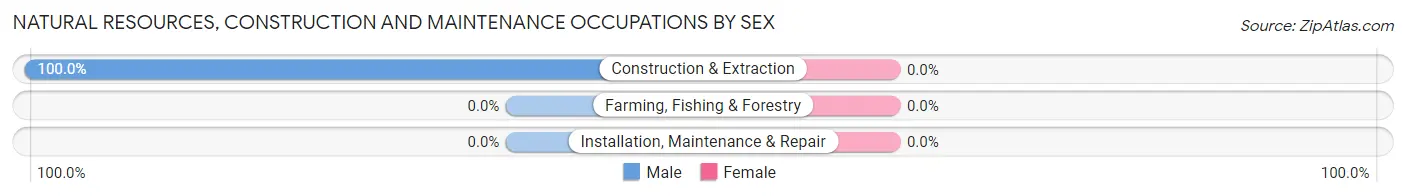
| Occupation | Male | Female |
| Farming, Fishing & Forestry | 0 (0.0%) | 0 (0.0%) |
| Construction & Extraction | 28 (100.0%) | 0 (0.0%) |
| Installation, Maintenance & Repair | 0 (0.0%) | 0 (0.0%) |
| Total (Category) | 28 (100.0%) | 0 (0.0%) |
| Total (Overall) | 28 (87.5%) | 4 (12.5%) |
Production, Transportation and Moving Occupations
Production, Transportation and Moving Occupations by Sex
| Occupation | Male | Female |
| Production | 0 (0.0%) | 0 (0.0%) |
| Transportation | 0 (0.0%) | 0 (0.0%) |
| Material Moving | 0 (0.0%) | 0 (0.0%) |
| Total (Category) | 0 (0.0%) | 0 (0.0%) |
| Total (Overall) | 28 (87.5%) | 4 (12.5%) |
Employment Industries by Sex in Parrott
Employment Industries in Parrott
The major employment industries in Parrott include , and Construction (28 | 87.5%).
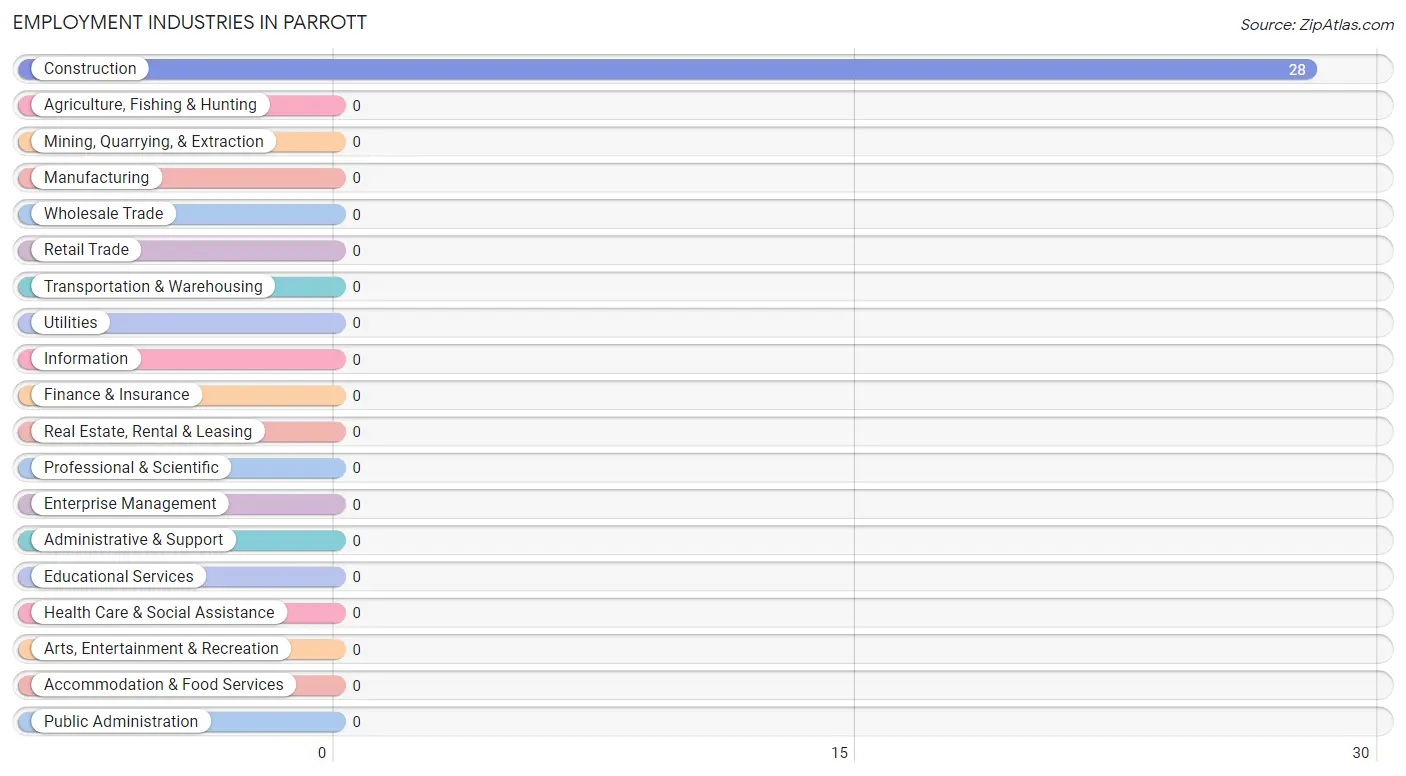
Employment Industries by Sex in Parrott
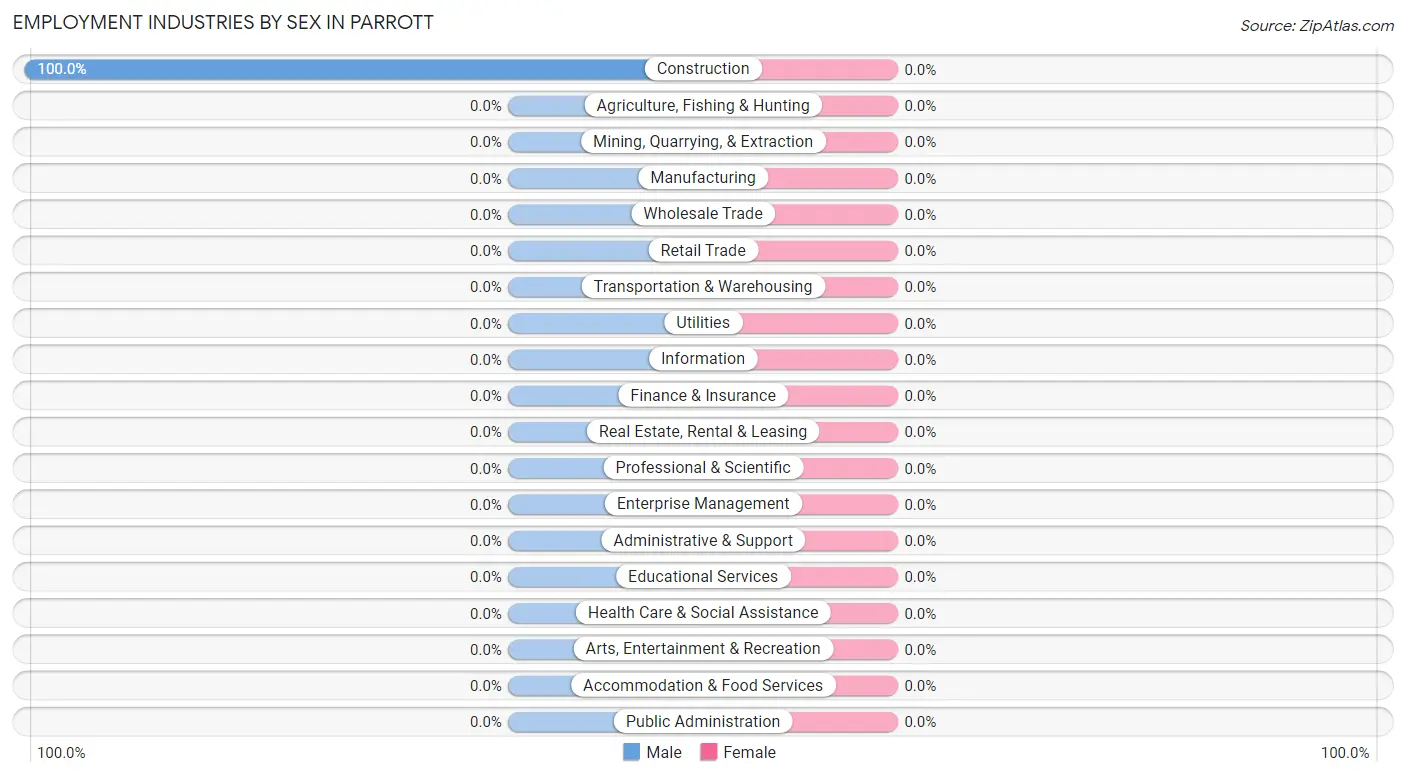
| Industry | Male | Female |
| Agriculture, Fishing & Hunting | 0 (0.0%) | 0 (0.0%) |
| Mining, Quarrying, & Extraction | 0 (0.0%) | 0 (0.0%) |
| Construction | 28 (100.0%) | 0 (0.0%) |
| Manufacturing | 0 (0.0%) | 0 (0.0%) |
| Wholesale Trade | 0 (0.0%) | 0 (0.0%) |
| Retail Trade | 0 (0.0%) | 0 (0.0%) |
| Transportation & Warehousing | 0 (0.0%) | 0 (0.0%) |
| Utilities | 0 (0.0%) | 0 (0.0%) |
| Information | 0 (0.0%) | 0 (0.0%) |
| Finance & Insurance | 0 (0.0%) | 0 (0.0%) |
| Real Estate, Rental & Leasing | 0 (0.0%) | 0 (0.0%) |
| Professional & Scientific | 0 (0.0%) | 0 (0.0%) |
| Enterprise Management | 0 (0.0%) | 0 (0.0%) |
| Administrative & Support | 0 (0.0%) | 0 (0.0%) |
| Educational Services | 0 (0.0%) | 0 (0.0%) |
| Health Care & Social Assistance | 0 (0.0%) | 0 (0.0%) |
| Arts, Entertainment & Recreation | 0 (0.0%) | 0 (0.0%) |
| Accommodation & Food Services | 0 (0.0%) | 0 (0.0%) |
| Public Administration | 0 (0.0%) | 0 (0.0%) |
| Total | 28 (87.5%) | 4 (12.5%) |
Education in Parrott
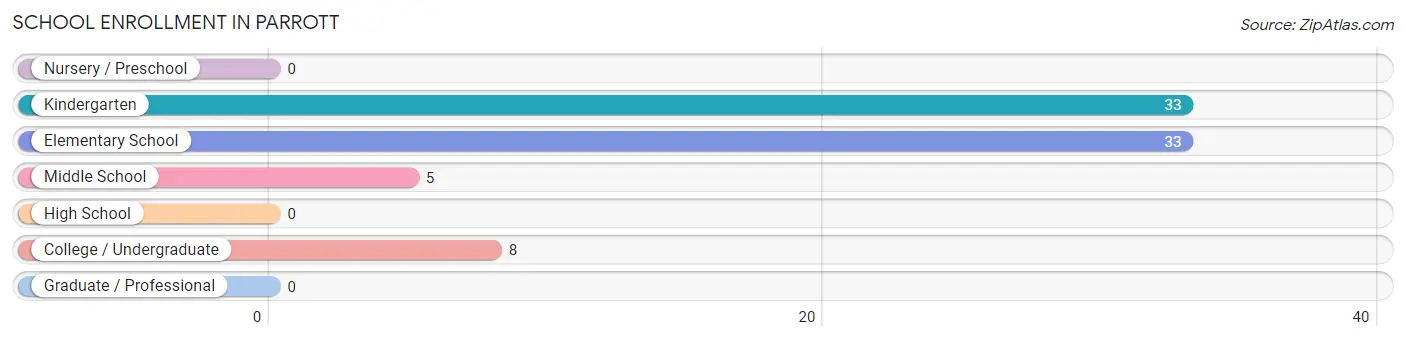
School Enrollment in Parrott
The most common levels of schooling among the 79 students in Parrott are kindergarten (33 | 41.8%), elementary school (33 | 41.8%), and college / undergraduate (8 | 10.1%).
| School Level | # Students | % Students |
| Nursery / Preschool | 0 | 0.0% |
| Kindergarten | 33 | 41.8% |
| Elementary School | 33 | 41.8% |
| Middle School | 5 | 6.3% |
| High School | 0 | 0.0% |
| College / Undergraduate | 8 | 10.1% |
| Graduate / Professional | 0 | 0.0% |
| Total | 79 | 100.0% |
School Enrollment by Age by Funding Source in Parrott
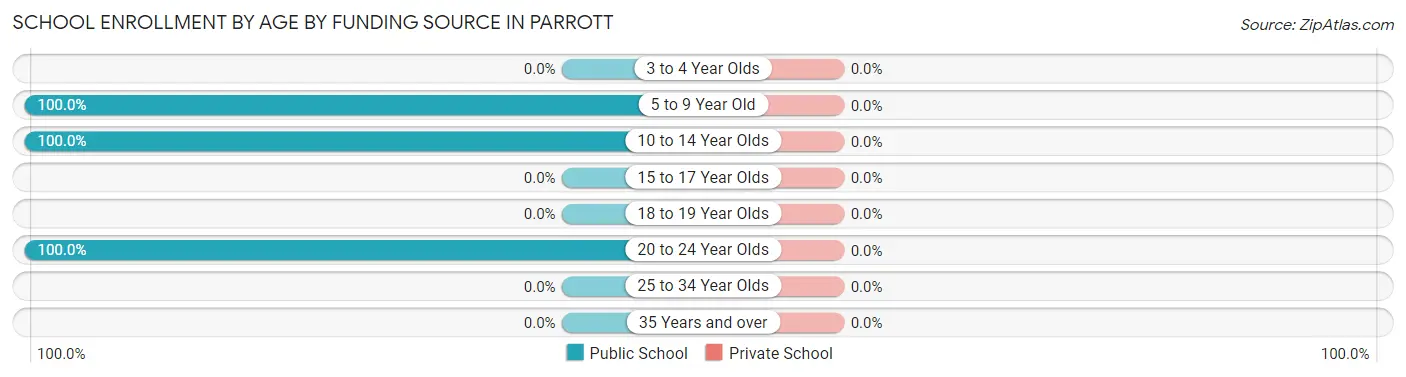
| Age Bracket | Public School | Private School |
| 3 to 4 Year Olds | 0 (0.0%) | 0 (0.0%) |
| 5 to 9 Year Old | 66 (100.0%) | 0 (0.0%) |
| 10 to 14 Year Olds | 5 (100.0%) | 0 (0.0%) |
| 15 to 17 Year Olds | 0 (0.0%) | 0 (0.0%) |
| 18 to 19 Year Olds | 0 (0.0%) | 0 (0.0%) |
| 20 to 24 Year Olds | 8 (100.0%) | 0 (0.0%) |
| 25 to 34 Year Olds | 0 (0.0%) | 0 (0.0%) |
| 35 Years and over | 0 (0.0%) | 0 (0.0%) |
| Total | 79 (100.0%) | 0 (0.0%) |
Educational Attainment by Field of Study in Parrott
Literature & languages (9 | 52.9%), and education (8 | 47.1%) are the most common fields of study among 17 individuals in Parrott who have obtained a bachelor's degree or higher.
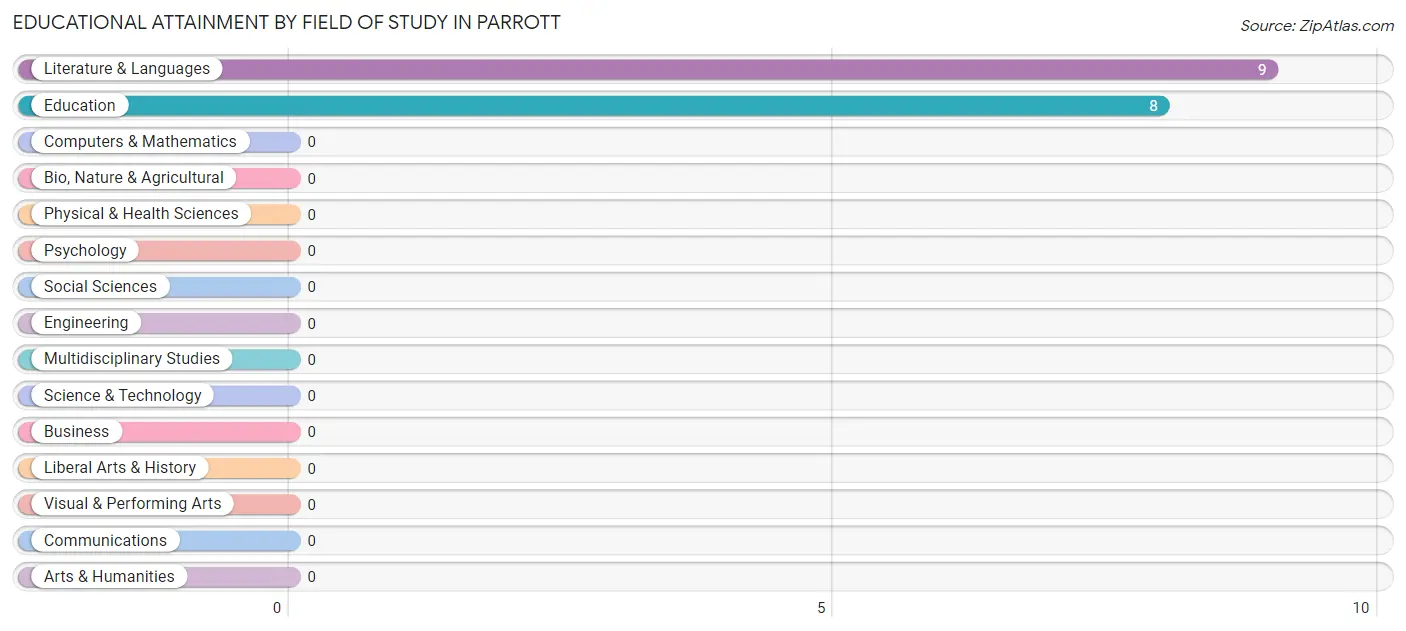
| Field of Study | # Graduates | % Graduates |
| Computers & Mathematics | 0 | 0.0% |
| Bio, Nature & Agricultural | 0 | 0.0% |
| Physical & Health Sciences | 0 | 0.0% |
| Psychology | 0 | 0.0% |
| Social Sciences | 0 | 0.0% |
| Engineering | 0 | 0.0% |
| Multidisciplinary Studies | 0 | 0.0% |
| Science & Technology | 0 | 0.0% |
| Business | 0 | 0.0% |
| Education | 8 | 47.1% |
| Literature & Languages | 9 | 52.9% |
| Liberal Arts & History | 0 | 0.0% |
| Visual & Performing Arts | 0 | 0.0% |
| Communications | 0 | 0.0% |
| Arts & Humanities | 0 | 0.0% |
| Total | 17 | 100.0% |
Transportation & Commute in Parrott
Vehicle Availability by Sex in Parrott
The most prevalent vehicle ownership categories in Parrott are males with 1 vehicle (28, accounting for 100.0%) and females with 1 vehicle (0, making up 700.0%).
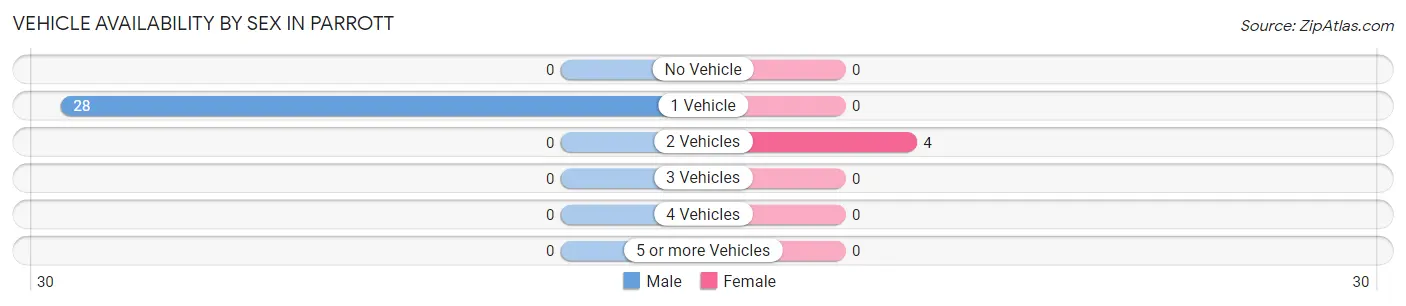
| Vehicles Available | Male | Female |
| No Vehicle | 0 (0.0%) | 0 (0.0%) |
| 1 Vehicle | 28 (100.0%) | 0 (0.0%) |
| 2 Vehicles | 0 (0.0%) | 4 (100.0%) |
| 3 Vehicles | 0 (0.0%) | 0 (0.0%) |
| 4 Vehicles | 0 (0.0%) | 0 (0.0%) |
| 5 or more Vehicles | 0 (0.0%) | 0 (0.0%) |
| Total | 28 (100.0%) | 4 (100.0%) |
Commute Time in Parrott
The most frequently occuring commute durations in Parrott are 20 to 24 minutes (32 commuters, 100.0%), less than 5 minutes (0 commuters, 0.0%), and 5 to 9 minutes (0 commuters, 0.0%).
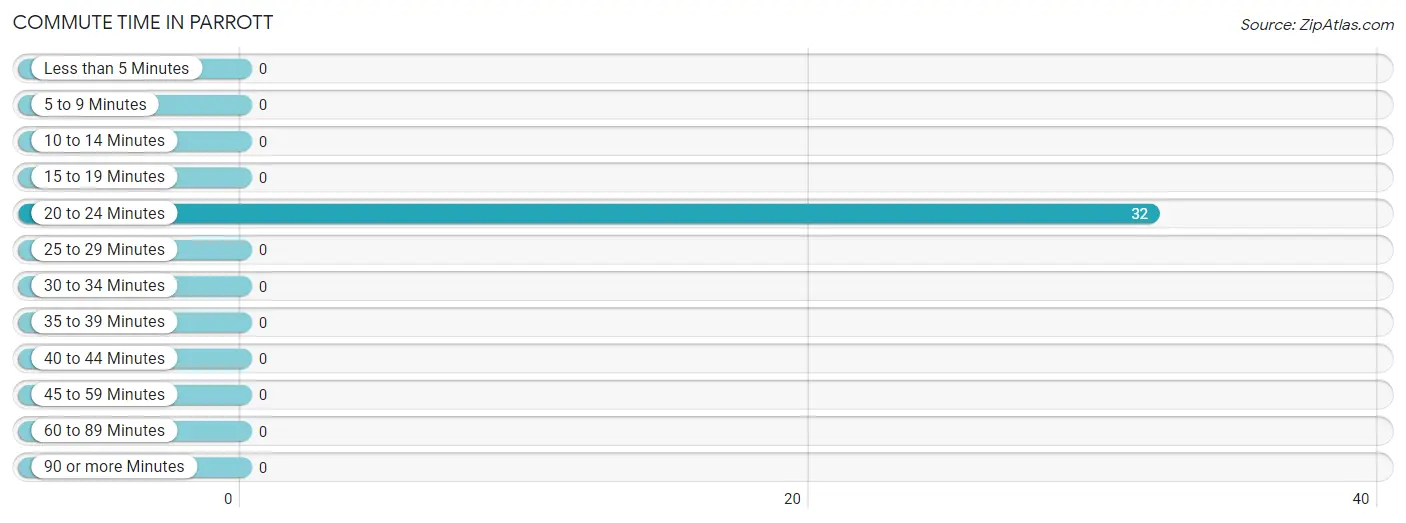
| Commute Time | # Commuters | % Commuters |
| Less than 5 Minutes | 0 | 0.0% |
| 5 to 9 Minutes | 0 | 0.0% |
| 10 to 14 Minutes | 0 | 0.0% |
| 15 to 19 Minutes | 0 | 0.0% |
| 20 to 24 Minutes | 32 | 100.0% |
| 25 to 29 Minutes | 0 | 0.0% |
| 30 to 34 Minutes | 0 | 0.0% |
| 35 to 39 Minutes | 0 | 0.0% |
| 40 to 44 Minutes | 0 | 0.0% |
| 45 to 59 Minutes | 0 | 0.0% |
| 60 to 89 Minutes | 0 | 0.0% |
| 90 or more Minutes | 0 | 0.0% |
Commute Time by Sex in Parrott
The most common commute times in Parrott are 20 to 24 minutes (28 commuters, 100.0%) for males and 20 to 24 minutes (4 commuters, 100.0%) for females.
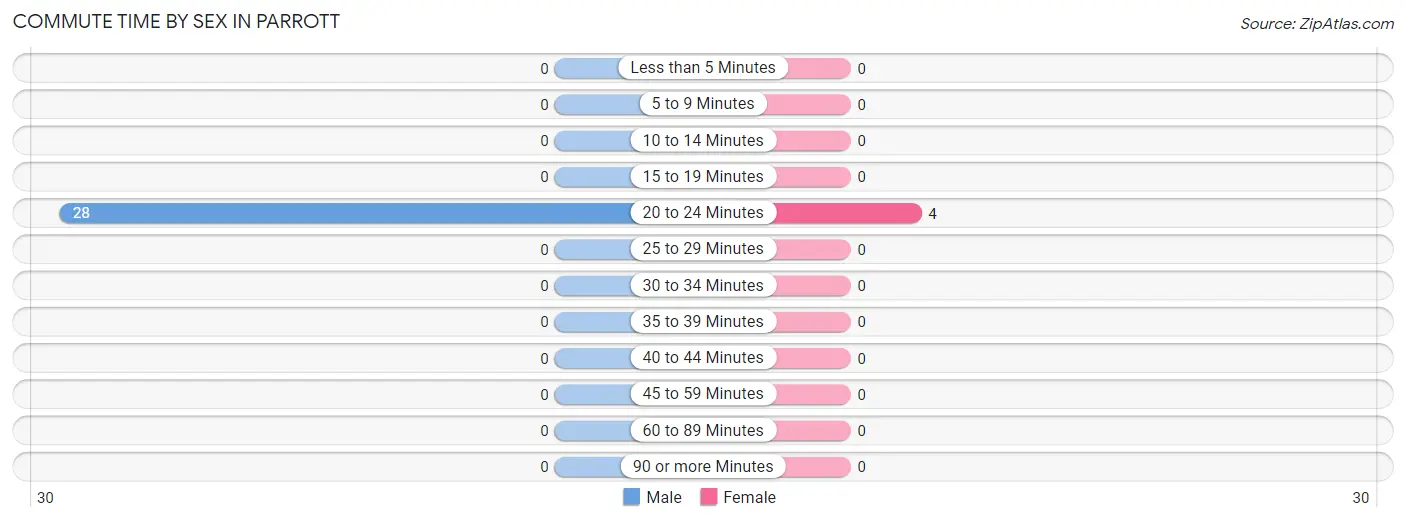
| Commute Time | Male | Female |
| Less than 5 Minutes | 0 (0.0%) | 0 (0.0%) |
| 5 to 9 Minutes | 0 (0.0%) | 0 (0.0%) |
| 10 to 14 Minutes | 0 (0.0%) | 0 (0.0%) |
| 15 to 19 Minutes | 0 (0.0%) | 0 (0.0%) |
| 20 to 24 Minutes | 28 (100.0%) | 4 (100.0%) |
| 25 to 29 Minutes | 0 (0.0%) | 0 (0.0%) |
| 30 to 34 Minutes | 0 (0.0%) | 0 (0.0%) |
| 35 to 39 Minutes | 0 (0.0%) | 0 (0.0%) |
| 40 to 44 Minutes | 0 (0.0%) | 0 (0.0%) |
| 45 to 59 Minutes | 0 (0.0%) | 0 (0.0%) |
| 60 to 89 Minutes | 0 (0.0%) | 0 (0.0%) |
| 90 or more Minutes | 0 (0.0%) | 0 (0.0%) |
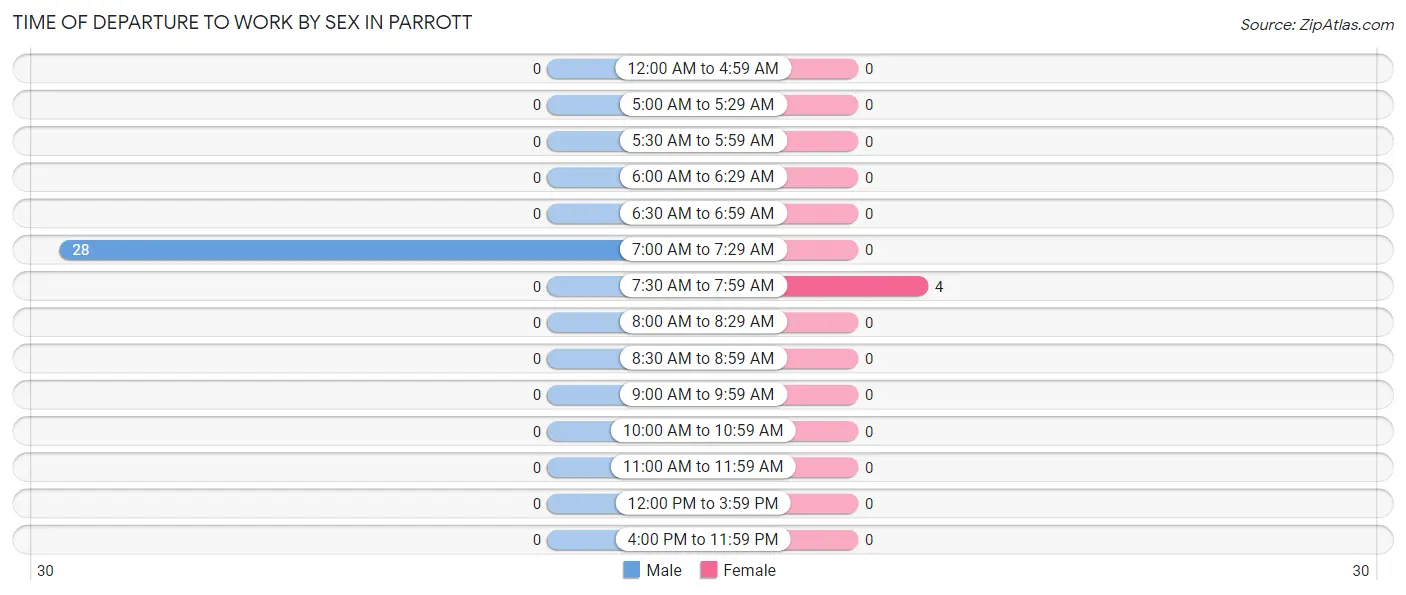
Time of Departure to Work by Sex in Parrott
The most frequent times of departure to work in Parrott are 7:00 AM to 7:29 AM (28, 100.0%) for males and 7:30 AM to 7:59 AM (4, 100.0%) for females.
| Time of Departure | Male | Female |
| 12:00 AM to 4:59 AM | 0 (0.0%) | 0 (0.0%) |
| 5:00 AM to 5:29 AM | 0 (0.0%) | 0 (0.0%) |
| 5:30 AM to 5:59 AM | 0 (0.0%) | 0 (0.0%) |
| 6:00 AM to 6:29 AM | 0 (0.0%) | 0 (0.0%) |
| 6:30 AM to 6:59 AM | 0 (0.0%) | 0 (0.0%) |
| 7:00 AM to 7:29 AM | 28 (100.0%) | 0 (0.0%) |
| 7:30 AM to 7:59 AM | 0 (0.0%) | 4 (100.0%) |
| 8:00 AM to 8:29 AM | 0 (0.0%) | 0 (0.0%) |
| 8:30 AM to 8:59 AM | 0 (0.0%) | 0 (0.0%) |
| 9:00 AM to 9:59 AM | 0 (0.0%) | 0 (0.0%) |
| 10:00 AM to 10:59 AM | 0 (0.0%) | 0 (0.0%) |
| 11:00 AM to 11:59 AM | 0 (0.0%) | 0 (0.0%) |
| 12:00 PM to 3:59 PM | 0 (0.0%) | 0 (0.0%) |
| 4:00 PM to 11:59 PM | 0 (0.0%) | 0 (0.0%) |
| Total | 28 (100.0%) | 4 (100.0%) |
Housing Occupancy in Parrott
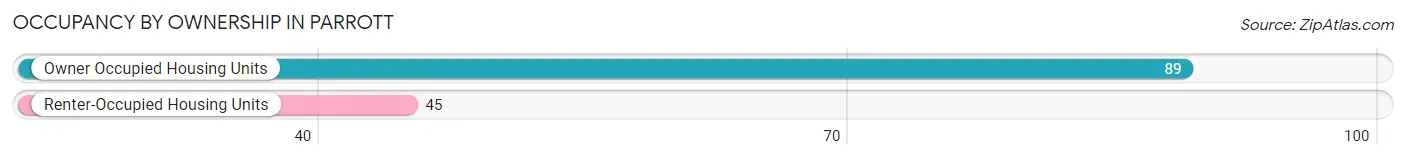
Occupancy by Ownership in Parrott
Of the total 134 dwellings in Parrott, owner-occupied units account for 89 (66.4%), while renter-occupied units make up 45 (33.6%).
| Occupancy | # Housing Units | % Housing Units |
| Owner Occupied Housing Units | 89 | 66.4% |
| Renter-Occupied Housing Units | 45 | 33.6% |
| Total Occupied Housing Units | 134 | 100.0% |
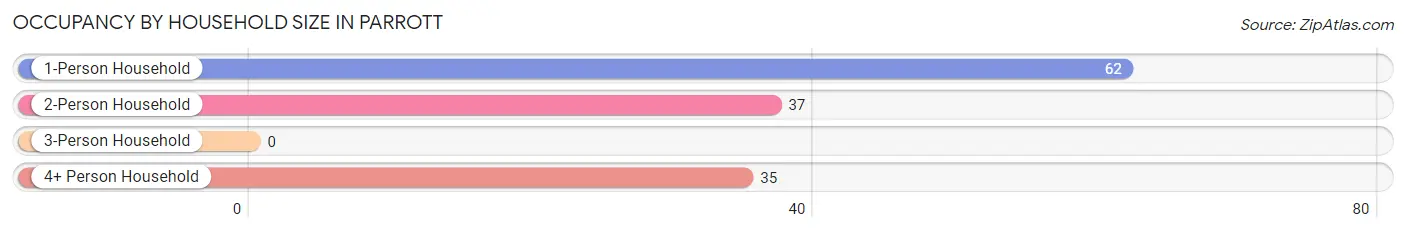
Occupancy by Household Size in Parrott
| Household Size | # Housing Units | % Housing Units |
| 1-Person Household | 62 | 46.3% |
| 2-Person Household | 37 | 27.6% |
| 3-Person Household | 0 | 0.0% |
| 4+ Person Household | 35 | 26.1% |
| Total Housing Units | 134 | 100.0% |
Occupancy by Ownership by Household Size in Parrott
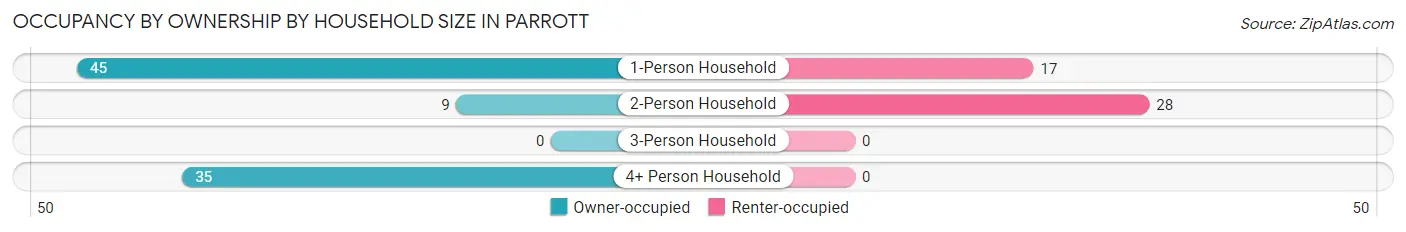
| Household Size | Owner-occupied | Renter-occupied |
| 1-Person Household | 45 (72.6%) | 17 (27.4%) |
| 2-Person Household | 9 (24.3%) | 28 (75.7%) |
| 3-Person Household | 0 (0.0%) | 0 (0.0%) |
| 4+ Person Household | 35 (100.0%) | 0 (0.0%) |
| Total Housing Units | 89 (66.4%) | 45 (33.6%) |
Occupancy by Educational Attainment in Parrott
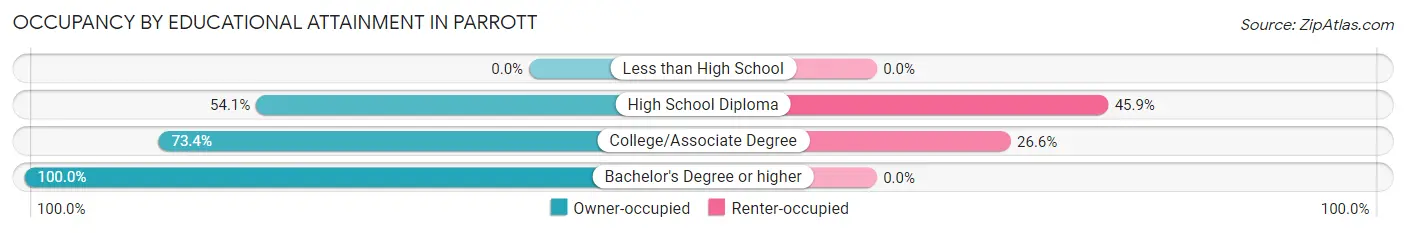
| Household Size | Owner-occupied | Renter-occupied |
| Less than High School | 0 (0.0%) | 0 (0.0%) |
| High School Diploma | 33 (54.1%) | 28 (45.9%) |
| College/Associate Degree | 47 (73.4%) | 17 (26.6%) |
| Bachelor's Degree or higher | 9 (100.0%) | 0 (0.0%) |
Occupancy by Age of Householder in Parrott
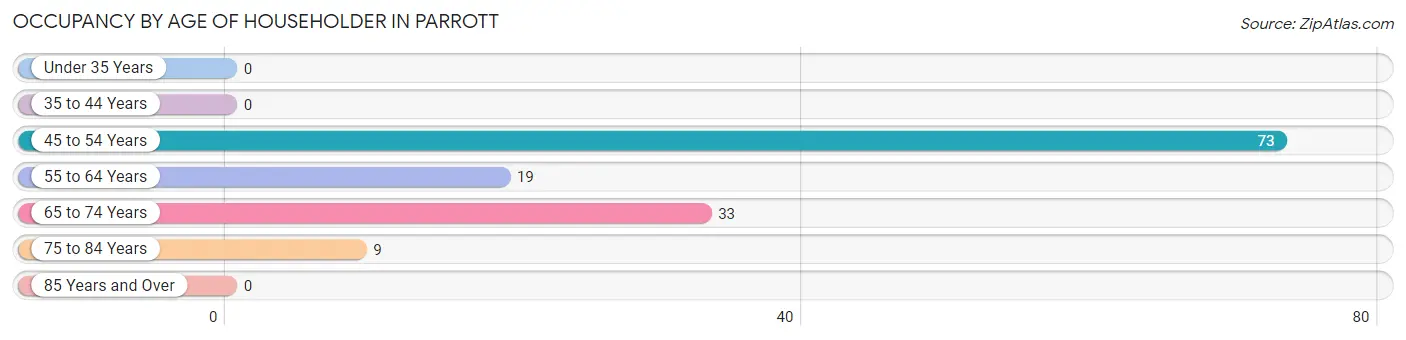
| Age Bracket | # Households | % Households |
| Under 35 Years | 0 | 0.0% |
| 35 to 44 Years | 0 | 0.0% |
| 45 to 54 Years | 73 | 54.5% |
| 55 to 64 Years | 19 | 14.2% |
| 65 to 74 Years | 33 | 24.6% |
| 75 to 84 Years | 9 | 6.7% |
| 85 Years and Over | 0 | 0.0% |
| Total | 134 | 100.0% |
Housing Finances in Parrott
Median Income by Occupancy in Parrott
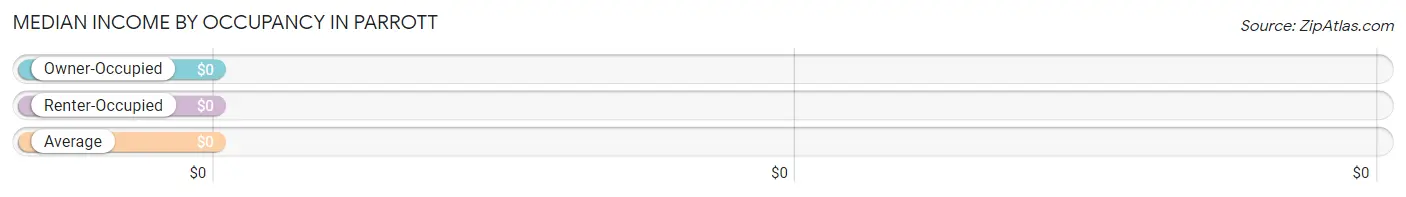
| Occupancy Type | # Households | Median Income |
| Owner-Occupied | 89 (66.4%) | $0 |
| Renter-Occupied | 45 (33.6%) | $0 |
| Average | 134 (100.0%) | $0 |
Occupancy by Householder Income Bracket in Parrott
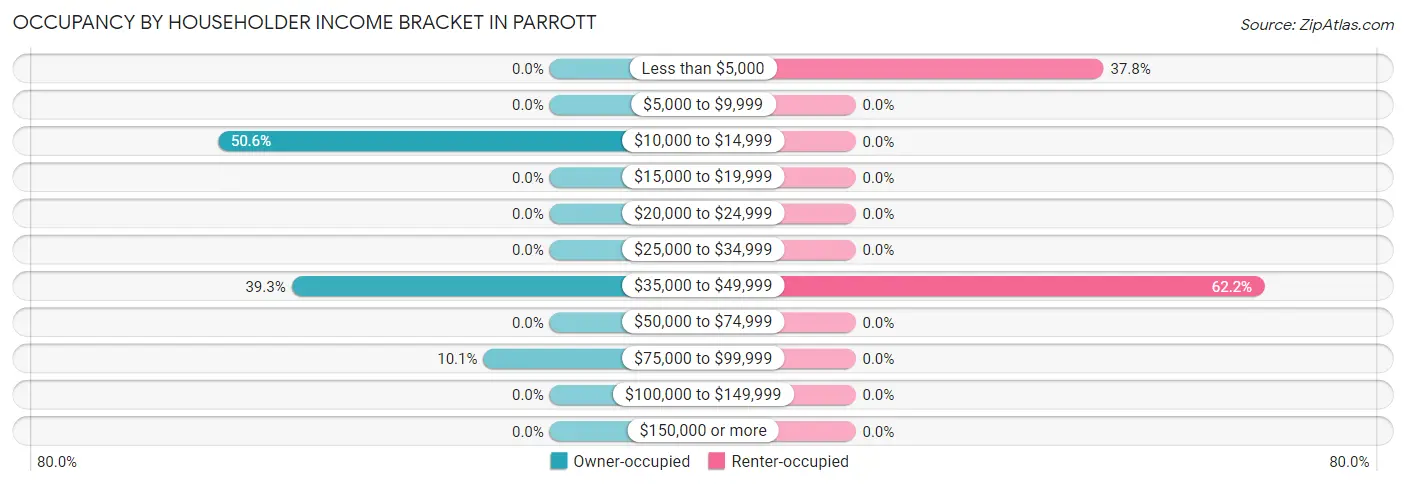
| Income Bracket | Owner-occupied | Renter-occupied |
| Less than $5,000 | 0 (0.0%) | 17 (37.8%) |
| $5,000 to $9,999 | 0 (0.0%) | 0 (0.0%) |
| $10,000 to $14,999 | 45 (50.6%) | 0 (0.0%) |
| $15,000 to $19,999 | 0 (0.0%) | 0 (0.0%) |
| $20,000 to $24,999 | 0 (0.0%) | 0 (0.0%) |
| $25,000 to $34,999 | 0 (0.0%) | 0 (0.0%) |
| $35,000 to $49,999 | 35 (39.3%) | 28 (62.2%) |
| $50,000 to $74,999 | 0 (0.0%) | 0 (0.0%) |
| $75,000 to $99,999 | 9 (10.1%) | 0 (0.0%) |
| $100,000 to $149,999 | 0 (0.0%) | 0 (0.0%) |
| $150,000 or more | 0 (0.0%) | 0 (0.0%) |
| Total | 89 (100.0%) | 45 (100.0%) |
Monthly Housing Cost Tiers in Parrott
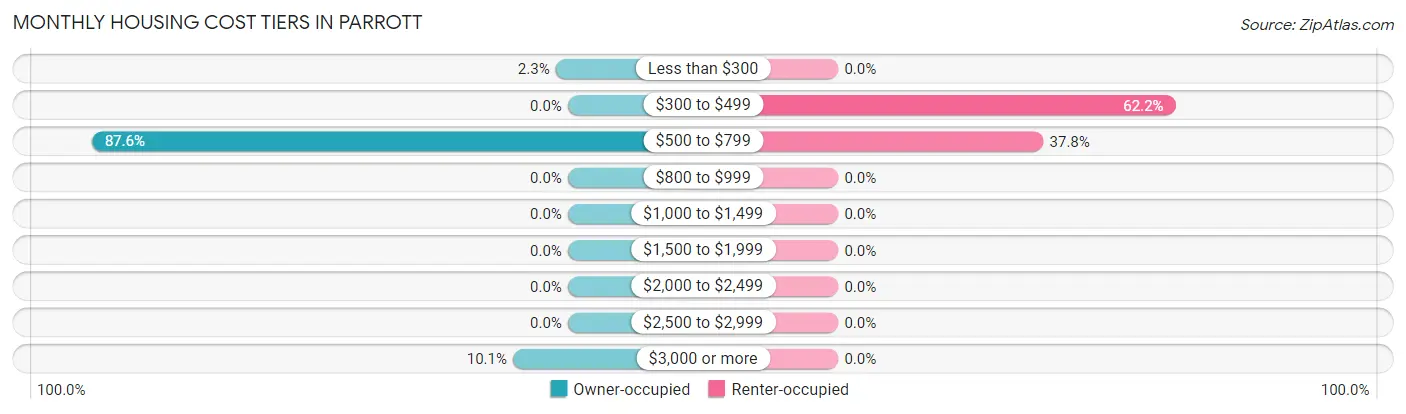
| Monthly Cost | Owner-occupied | Renter-occupied |
| Less than $300 | 2 (2.2%) | 0 (0.0%) |
| $300 to $499 | 0 (0.0%) | 28 (62.2%) |
| $500 to $799 | 78 (87.6%) | 17 (37.8%) |
| $800 to $999 | 0 (0.0%) | 0 (0.0%) |
| $1,000 to $1,499 | 0 (0.0%) | 0 (0.0%) |
| $1,500 to $1,999 | 0 (0.0%) | 0 (0.0%) |
| $2,000 to $2,499 | 0 (0.0%) | 0 (0.0%) |
| $2,500 to $2,999 | 0 (0.0%) | 0 (0.0%) |
| $3,000 or more | 9 (10.1%) | 0 (0.0%) |
| Total | 89 (100.0%) | 45 (100.0%) |
Physical Housing Characteristics in Parrott
Housing Structures in Parrott
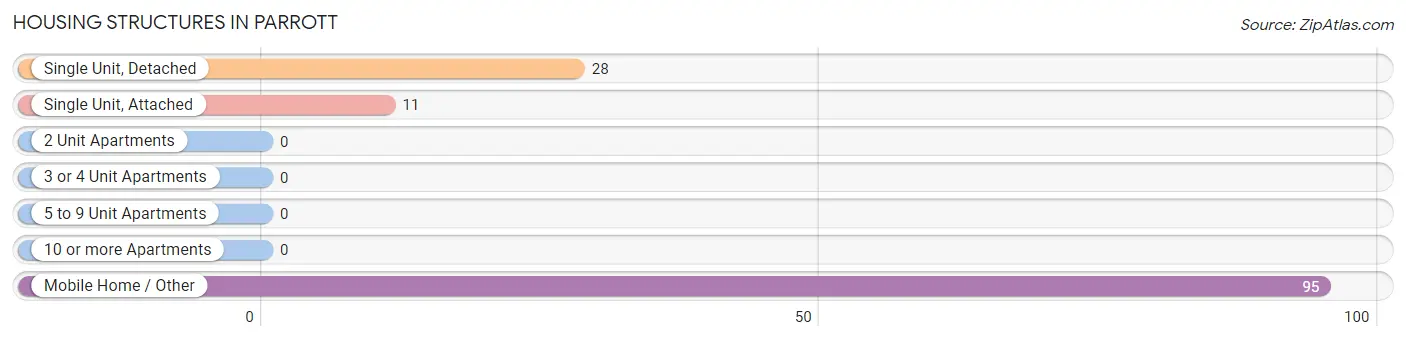
| Structure Type | # Housing Units | % Housing Units |
| Single Unit, Detached | 28 | 20.9% |
| Single Unit, Attached | 11 | 8.2% |
| 2 Unit Apartments | 0 | 0.0% |
| 3 or 4 Unit Apartments | 0 | 0.0% |
| 5 to 9 Unit Apartments | 0 | 0.0% |
| 10 or more Apartments | 0 | 0.0% |
| Mobile Home / Other | 95 | 70.9% |
| Total | 134 | 100.0% |
Housing Structures by Occupancy in Parrott
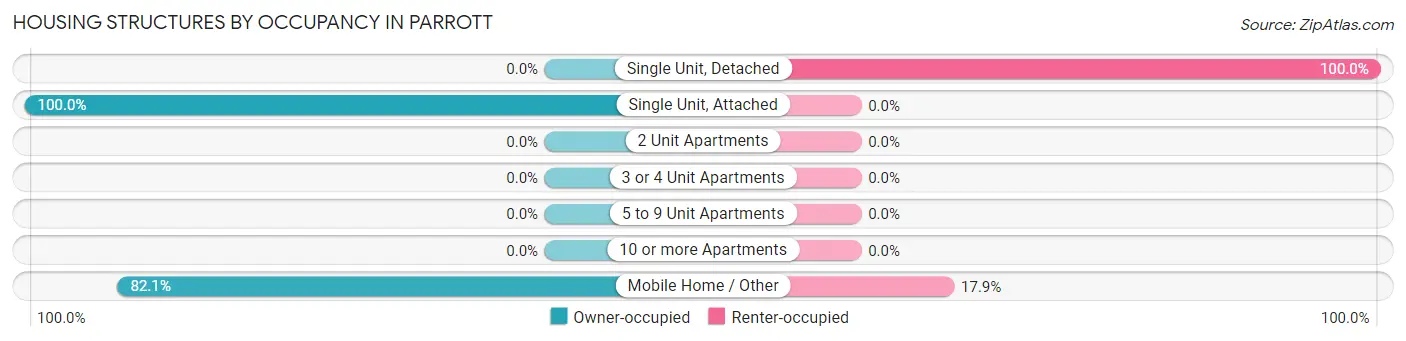
| Structure Type | Owner-occupied | Renter-occupied |
| Single Unit, Detached | 0 (0.0%) | 28 (100.0%) |
| Single Unit, Attached | 11 (100.0%) | 0 (0.0%) |
| 2 Unit Apartments | 0 (0.0%) | 0 (0.0%) |
| 3 or 4 Unit Apartments | 0 (0.0%) | 0 (0.0%) |
| 5 to 9 Unit Apartments | 0 (0.0%) | 0 (0.0%) |
| 10 or more Apartments | 0 (0.0%) | 0 (0.0%) |
| Mobile Home / Other | 78 (82.1%) | 17 (17.9%) |
| Total | 89 (66.4%) | 45 (33.6%) |
Housing Structures by Number of Rooms in Parrott
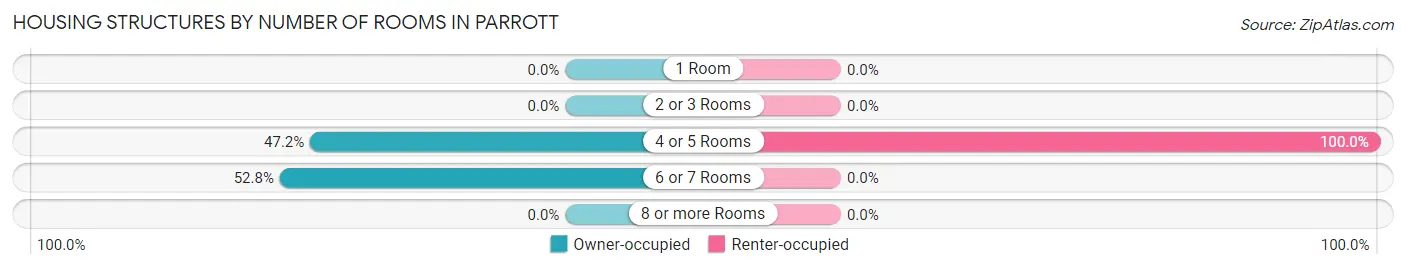
| Number of Rooms | Owner-occupied | Renter-occupied |
| 1 Room | 0 (0.0%) | 0 (0.0%) |
| 2 or 3 Rooms | 0 (0.0%) | 0 (0.0%) |
| 4 or 5 Rooms | 42 (47.2%) | 45 (100.0%) |
| 6 or 7 Rooms | 47 (52.8%) | 0 (0.0%) |
| 8 or more Rooms | 0 (0.0%) | 0 (0.0%) |
| Total | 89 (100.0%) | 45 (100.0%) |
Housing Structure by Heating Type in Parrott
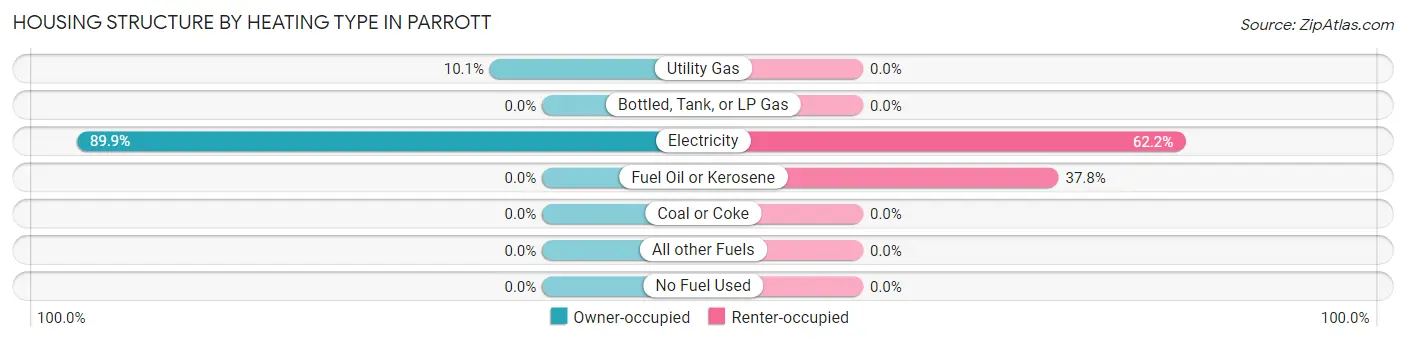
| Heating Type | Owner-occupied | Renter-occupied |
| Utility Gas | 9 (10.1%) | 0 (0.0%) |
| Bottled, Tank, or LP Gas | 0 (0.0%) | 0 (0.0%) |
| Electricity | 80 (89.9%) | 28 (62.2%) |
| Fuel Oil or Kerosene | 0 (0.0%) | 17 (37.8%) |
| Coal or Coke | 0 (0.0%) | 0 (0.0%) |
| All other Fuels | 0 (0.0%) | 0 (0.0%) |
| No Fuel Used | 0 (0.0%) | 0 (0.0%) |
| Total | 89 (100.0%) | 45 (100.0%) |
Household Vehicle Usage in Parrott
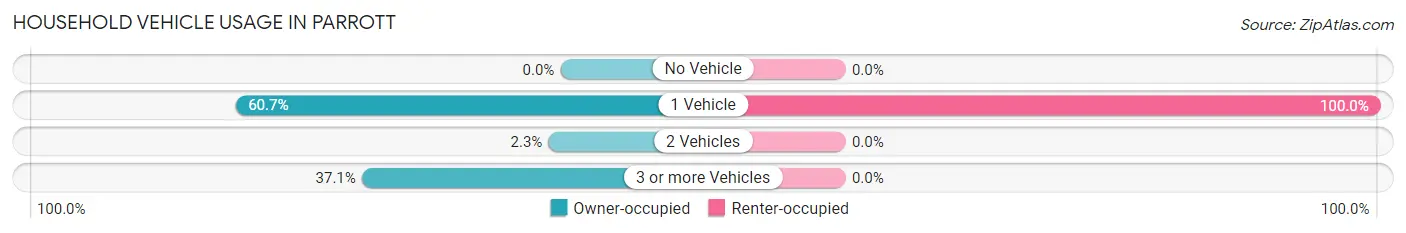
| Vehicles per Household | Owner-occupied | Renter-occupied |
| No Vehicle | 0 (0.0%) | 0 (0.0%) |
| 1 Vehicle | 54 (60.7%) | 45 (100.0%) |
| 2 Vehicles | 2 (2.2%) | 0 (0.0%) |
| 3 or more Vehicles | 33 (37.1%) | 0 (0.0%) |
| Total | 89 (100.0%) | 45 (100.0%) |
Real Estate & Mortgages in Parrott
Real Estate and Mortgage Overview in Parrott
| Characteristic | Without Mortgage | With Mortgage |
| Housing Units | 11 | 78 |
| Median Property Value | - | - |
| Median Household Income | - | - |
| Monthly Housing Costs | - | - |
| Real Estate Taxes | - | - |
Property Value by Mortgage Status in Parrott
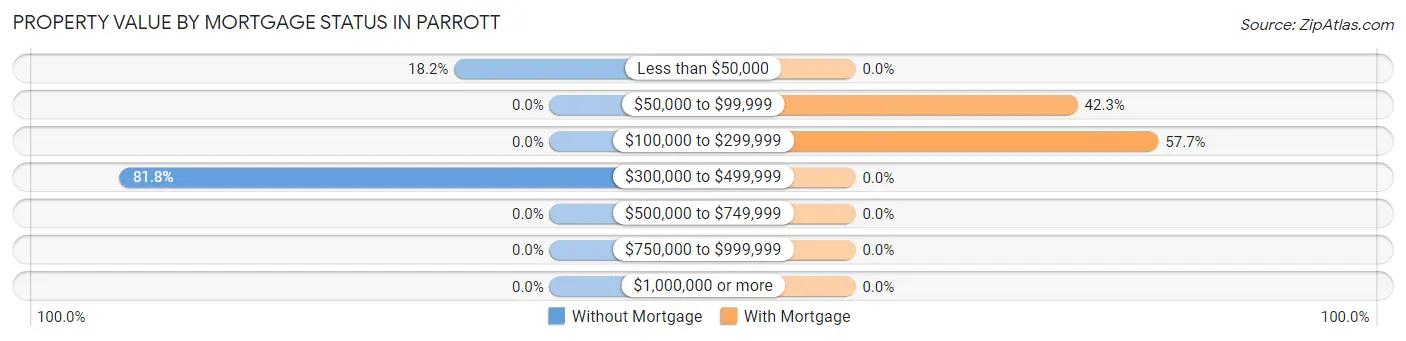
| Property Value | Without Mortgage | With Mortgage |
| Less than $50,000 | 2 (18.2%) | 0 (0.0%) |
| $50,000 to $99,999 | 0 (0.0%) | 33 (42.3%) |
| $100,000 to $299,999 | 0 (0.0%) | 45 (57.7%) |
| $300,000 to $499,999 | 9 (81.8%) | 0 (0.0%) |
| $500,000 to $749,999 | 0 (0.0%) | 0 (0.0%) |
| $750,000 to $999,999 | 0 (0.0%) | 0 (0.0%) |
| $1,000,000 or more | 0 (0.0%) | 0 (0.0%) |
| Total | 11 (100.0%) | 78 (100.0%) |
Household Income by Mortgage Status in Parrott
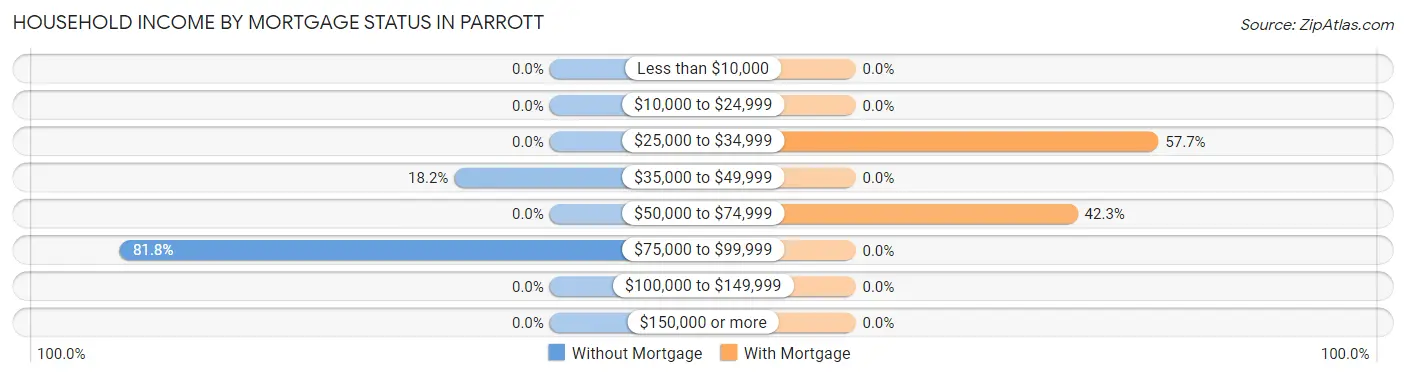
| Household Income | Without Mortgage | With Mortgage |
| Less than $10,000 | 0 (0.0%) | 0 (0.0%) |
| $10,000 to $24,999 | 0 (0.0%) | 0 (0.0%) |
| $25,000 to $34,999 | 0 (0.0%) | 45 (57.7%) |
| $35,000 to $49,999 | 2 (18.2%) | 0 (0.0%) |
| $50,000 to $74,999 | 0 (0.0%) | 33 (42.3%) |
| $75,000 to $99,999 | 9 (81.8%) | 0 (0.0%) |
| $100,000 to $149,999 | 0 (0.0%) | 0 (0.0%) |
| $150,000 or more | 0 (0.0%) | 0 (0.0%) |
| Total | 11 (100.0%) | 78 (100.0%) |
Property Value to Household Income Ratio in Parrott
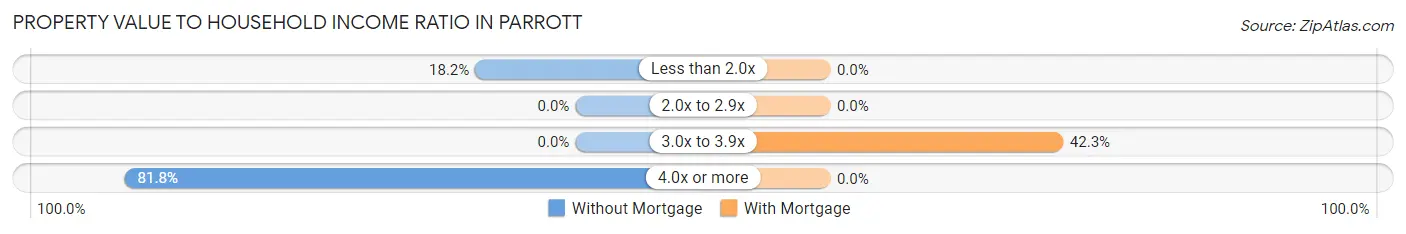
| Value-to-Income Ratio | Without Mortgage | With Mortgage |
| Less than 2.0x | 2 (18.2%) | 0 (0.0%) |
| 2.0x to 2.9x | 0 (0.0%) | 0 (0.0%) |
| 3.0x to 3.9x | 0 (0.0%) | 33 (42.3%) |
| 4.0x or more | 9 (81.8%) | 0 (0.0%) |
| Total | 11 (100.0%) | 78 (100.0%) |
Real Estate Taxes by Mortgage Status in Parrott
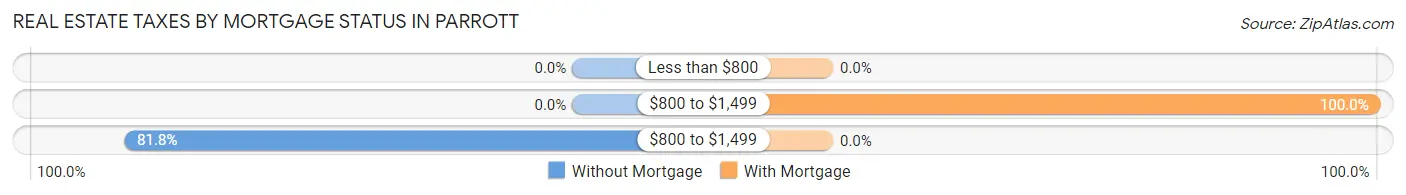
| Property Taxes | Without Mortgage | With Mortgage |
| Less than $800 | 0 (0.0%) | 0 (0.0%) |
| $800 to $1,499 | 0 (0.0%) | 78 (100.0%) |
| $800 to $1,499 | 9 (81.8%) | 0 (0.0%) |
| Total | 11 (100.0%) | 78 (100.0%) |
Health & Disability in Parrott
Health Insurance Coverage by Age in Parrott
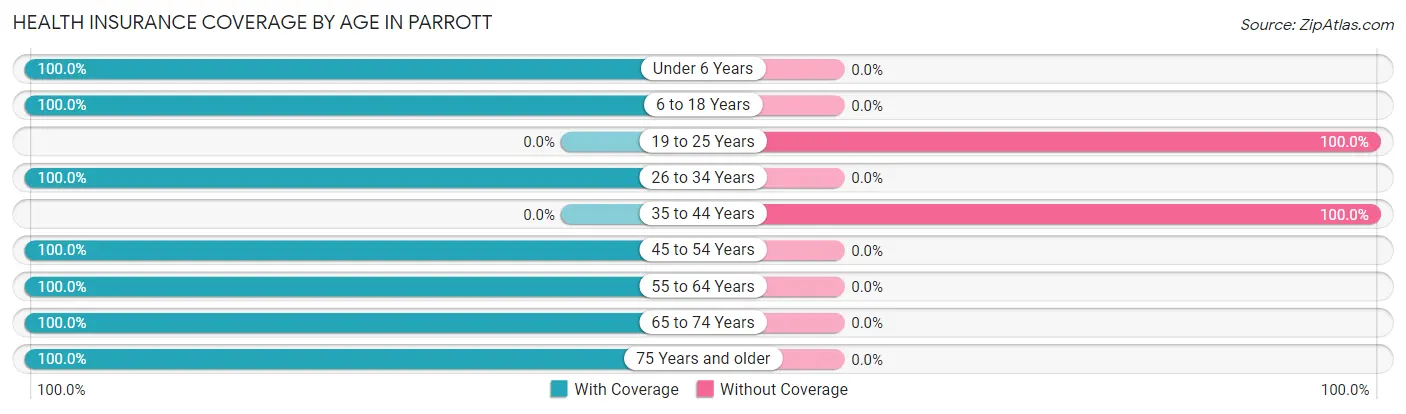
| Age Bracket | With Coverage | Without Coverage |
| Under 6 Years | 66 (100.0%) | 0 (0.0%) |
| 6 to 18 Years | 70 (100.0%) | 0 (0.0%) |
| 19 to 25 Years | 0 (0.0%) | 8 (100.0%) |
| 26 to 34 Years | 26 (100.0%) | 0 (0.0%) |
| 35 to 44 Years | 0 (0.0%) | 34 (100.0%) |
| 45 to 54 Years | 77 (100.0%) | 0 (0.0%) |
| 55 to 64 Years | 19 (100.0%) | 0 (0.0%) |
| 65 to 74 Years | 33 (100.0%) | 0 (0.0%) |
| 75 Years and older | 17 (100.0%) | 0 (0.0%) |
| Total | 308 (88.0%) | 42 (12.0%) |
Health Insurance Coverage by Citizenship Status in Parrott
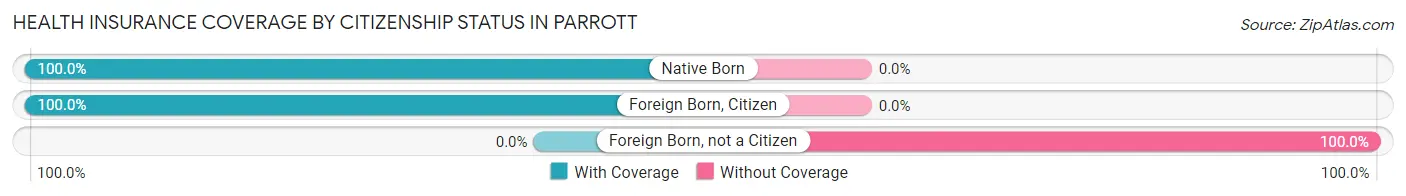
| Citizenship Status | With Coverage | Without Coverage |
| Native Born | 66 (100.0%) | 0 (0.0%) |
| Foreign Born, Citizen | 70 (100.0%) | 0 (0.0%) |
| Foreign Born, not a Citizen | 0 (0.0%) | 8 (100.0%) |
Health Insurance Coverage by Household Income in Parrott
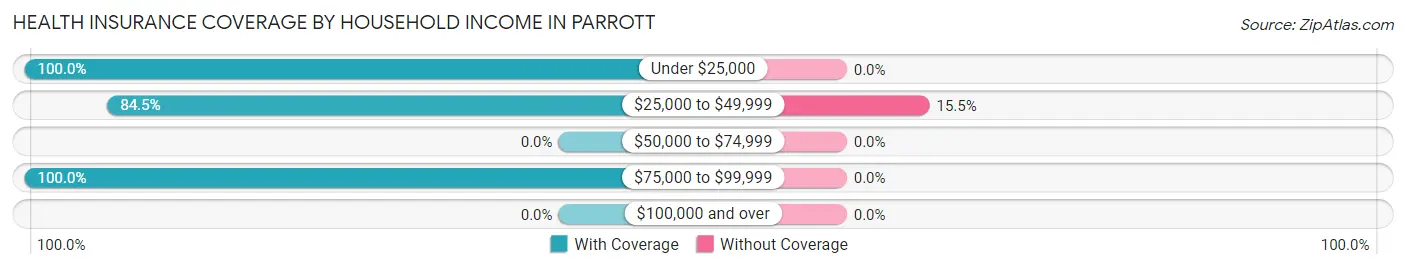
| Household Income | With Coverage | Without Coverage |
| Under $25,000 | 62 (100.0%) | 0 (0.0%) |
| $25,000 to $49,999 | 229 (84.5%) | 42 (15.5%) |
| $50,000 to $74,999 | 0 (0.0%) | 0 (0.0%) |
| $75,000 to $99,999 | 17 (100.0%) | 0 (0.0%) |
| $100,000 and over | 0 (0.0%) | 0 (0.0%) |
Public vs Private Health Insurance Coverage by Age in Parrott
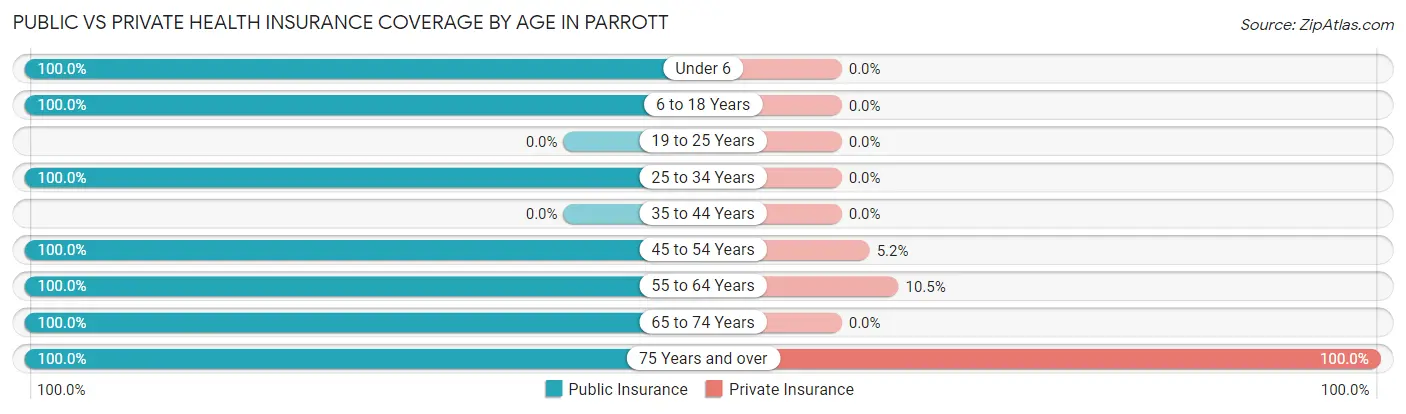
| Age Bracket | Public Insurance | Private Insurance |
| Under 6 | 66 (100.0%) | 0 (0.0%) |
| 6 to 18 Years | 70 (100.0%) | 0 (0.0%) |
| 19 to 25 Years | 0 (0.0%) | 0 (0.0%) |
| 25 to 34 Years | 26 (100.0%) | 0 (0.0%) |
| 35 to 44 Years | 0 (0.0%) | 0 (0.0%) |
| 45 to 54 Years | 77 (100.0%) | 4 (5.2%) |
| 55 to 64 Years | 19 (100.0%) | 2 (10.5%) |
| 65 to 74 Years | 33 (100.0%) | 0 (0.0%) |
| 75 Years and over | 17 (100.0%) | 17 (100.0%) |
| Total | 308 (88.0%) | 23 (6.6%) |
Disability Status by Sex by Age in Parrott
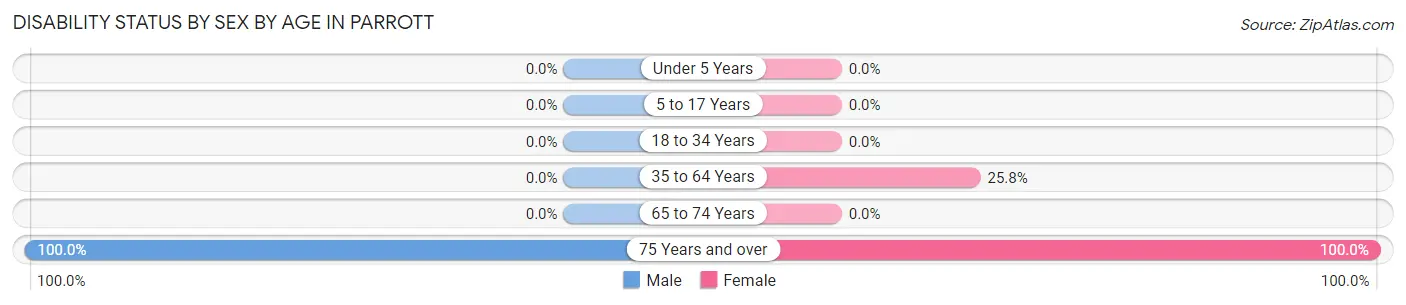
| Age Bracket | Male | Female |
| Under 5 Years | 0 (0.0%) | 0 (0.0%) |
| 5 to 17 Years | 0 (0.0%) | 0 (0.0%) |
| 18 to 34 Years | 0 (0.0%) | 0 (0.0%) |
| 35 to 64 Years | 0 (0.0%) | 17 (25.8%) |
| 65 to 74 Years | 0 (0.0%) | 0 (0.0%) |
| 75 Years and over | 8 (100.0%) | 9 (100.0%) |
Disability Class by Sex by Age in Parrott
Disability Class: Hearing Difficulty
| Age Bracket | Male | Female |
| Under 5 Years | 0 (0.0%) | 0 (0.0%) |
| 5 to 17 Years | 0 (0.0%) | 0 (0.0%) |
| 18 to 34 Years | 0 (0.0%) | 0 (0.0%) |
| 35 to 64 Years | 0 (0.0%) | 0 (0.0%) |
| 65 to 74 Years | 0 (0.0%) | 0 (0.0%) |
| 75 Years and over | 0 (0.0%) | 0 (0.0%) |
Disability Class: Vision Difficulty
| Age Bracket | Male | Female |
| Under 5 Years | 0 (0.0%) | 0 (0.0%) |
| 5 to 17 Years | 0 (0.0%) | 0 (0.0%) |
| 18 to 34 Years | 0 (0.0%) | 0 (0.0%) |
| 35 to 64 Years | 0 (0.0%) | 0 (0.0%) |
| 65 to 74 Years | 0 (0.0%) | 0 (0.0%) |
| 75 Years and over | 0 (0.0%) | 0 (0.0%) |
Disability Class: Cognitive Difficulty
| Age Bracket | Male | Female |
| 5 to 17 Years | 0 (0.0%) | 0 (0.0%) |
| 18 to 34 Years | 0 (0.0%) | 0 (0.0%) |
| 35 to 64 Years | 0 (0.0%) | 0 (0.0%) |
| 65 to 74 Years | 0 (0.0%) | 0 (0.0%) |
| 75 Years and over | 0 (0.0%) | 0 (0.0%) |
Disability Class: Ambulatory Difficulty
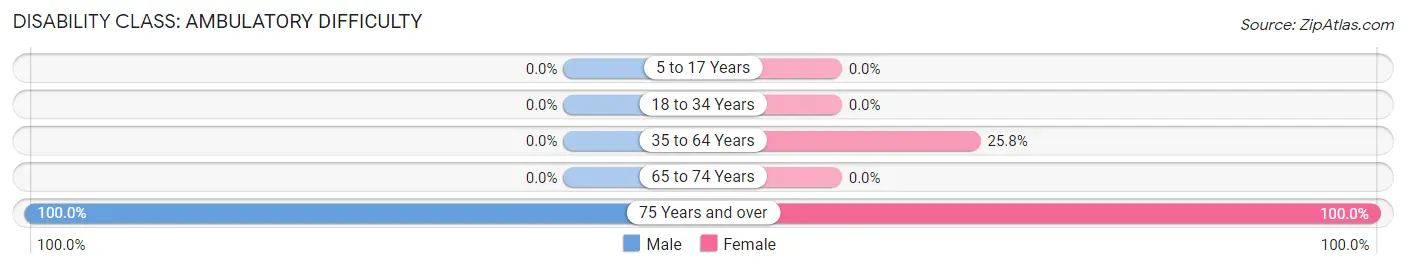
| Age Bracket | Male | Female |
| 5 to 17 Years | 0 (0.0%) | 0 (0.0%) |
| 18 to 34 Years | 0 (0.0%) | 0 (0.0%) |
| 35 to 64 Years | 0 (0.0%) | 17 (25.8%) |
| 65 to 74 Years | 0 (0.0%) | 0 (0.0%) |
| 75 Years and over | 8 (100.0%) | 9 (100.0%) |
Disability Class: Self-Care Difficulty

| Age Bracket | Male | Female |
| 5 to 17 Years | 0 (0.0%) | 0 (0.0%) |
| 18 to 34 Years | 0 (0.0%) | 0 (0.0%) |
| 35 to 64 Years | 0 (0.0%) | 0 (0.0%) |
| 65 to 74 Years | 0 (0.0%) | 0 (0.0%) |
| 75 Years and over | 0 (0.0%) | 0 (0.0%) |
Technology Access in Parrott
Computing Device Access in Parrott
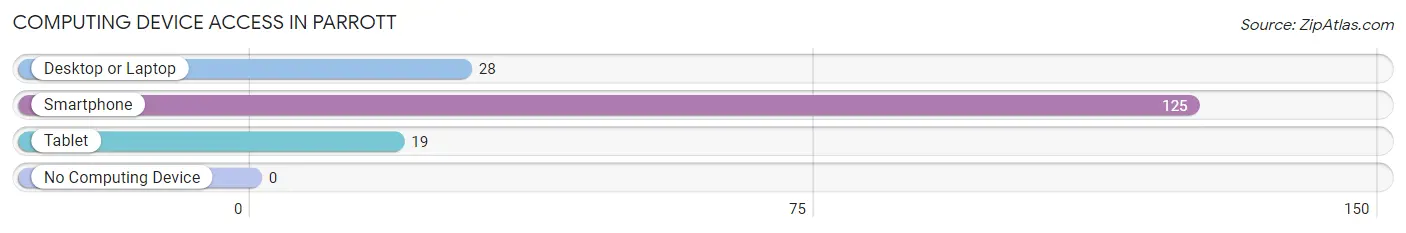
| Device Type | # Households | % Households |
| Desktop or Laptop | 28 | 20.9% |
| Smartphone | 125 | 93.3% |
| Tablet | 19 | 14.2% |
| No Computing Device | 0 | 0.0% |
| Total | 134 | 100.0% |
Internet Access in Parrott
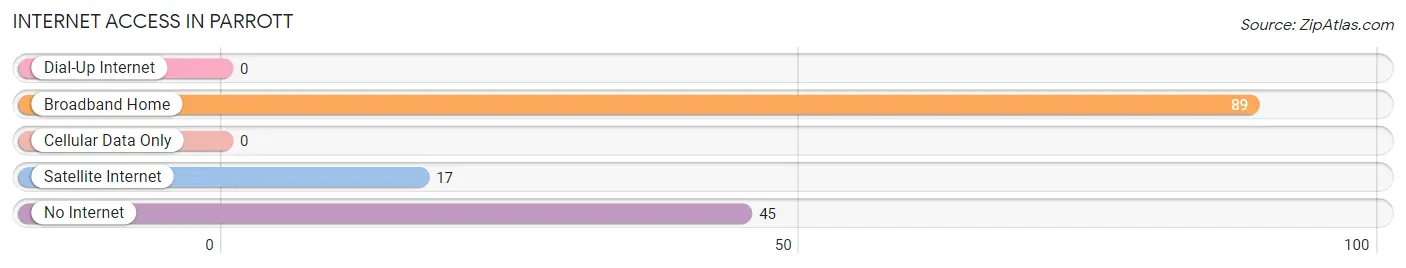
| Internet Type | # Households | % Households |
| Dial-Up Internet | 0 | 0.0% |
| Broadband Home | 89 | 66.4% |
| Cellular Data Only | 0 | 0.0% |
| Satellite Internet | 17 | 12.7% |
| No Internet | 45 | 33.6% |
| Total | 134 | 100.0% |
Parrott Summary
Parrott, Virginia is a small town located in the southwestern part of the state, in the Appalachian Mountains. It is situated in Tazewell County, and is part of the Bluefield, WV-VA Metropolitan Statistical Area. The town has a population of just over 1,000 people, and is known for its rural charm and small-town atmosphere.
Geography
Parrott is located in the Appalachian Mountains, in the southwestern part of Virginia. It is situated in Tazewell County, and is part of the Bluefield, WV-VA Metropolitan Statistical Area. The town is located at an elevation of 1,845 feet, and is surrounded by the Appalachian Mountains. The town is located near the border of West Virginia, and is just a few miles from the state line. The town is located in a valley, and is surrounded by rolling hills and mountains. The town is located near the Clinch River, and is also close to the New River.
Economy
The economy of Parrott is largely based on agriculture and tourism. The town is home to several farms, and the surrounding area is known for its production of tobacco, corn, and hay. The town is also home to several small businesses, including a grocery store, a hardware store, and a few restaurants. The town is also home to a few small manufacturing companies, which produce a variety of products, including furniture and clothing.
The town is also a popular tourist destination, and is home to several attractions, including the Parrott Museum, which houses a collection of artifacts from the town's history. The town is also home to several parks, including the Parrott Park, which features a playground, picnic areas, and a walking trail. The town is also home to several festivals, including the Parrott Festival, which is held every year in the summer.
Demographics
As of the 2010 census, the population of Parrott was 1,072. The population is largely white, with a small percentage of African Americans and Hispanics. The median age of the population is 44.7 years, and the median household income is $35,000. The town has a high rate of poverty, with nearly 30% of the population living below the poverty line.
Parrott is a small town with a rural atmosphere. The town is known for its friendly people and its small-town charm. The town is home to several farms, and the surrounding area is known for its production of tobacco, corn, and hay. The town is also home to several small businesses, and is a popular tourist destination. The town is also home to several parks and festivals, and is a great place to visit for those looking for a quiet, rural getaway.
Common Questions
What is Per Capita Income in Parrott?
Per Capita income in Parrott is $11,210.
What is the Median Family Income in Parrott?
Median Family Income in Parrott is $40,455.
What is Inequality or Gini Index in Parrott?
Inequality or Gini Index in Parrott is 0.38.
What is the Total Population of Parrott?
Total Population of Parrott is 350.
What is the Total Male Population of Parrott?
Total Male Population of Parrott is 145.
What is the Total Female Population of Parrott?
Total Female Population of Parrott is 205.
What is the Ratio of Males per 100 Females in Parrott?
There are 70.73 Males per 100 Females in Parrott.
What is the Ratio of Females per 100 Males in Parrott?
There are 141.38 Females per 100 Males in Parrott.
What is the Median Population Age in Parrott?
Median Population Age in Parrott is 38.1 Years.
What is the Average Family Size in Parrott
Average Family Size in Parrott is 2.3 People.
What is the Average Household Size in Parrott
Average Household Size in Parrott is 2.6 People.
How Large is the Labor Force in Parrott?
There are 66 People in the Labor Forcein in Parrott.
What is the Percentage of People in the Labor Force in Parrott?
26.8% of People are in the Labor Force in Parrott.
What is the Unemployment Rate in Parrott?
Unemployment Rate in Parrott is 51.5%.