Detroit Beach, MI Map & Demographics
Detroit Beach Map
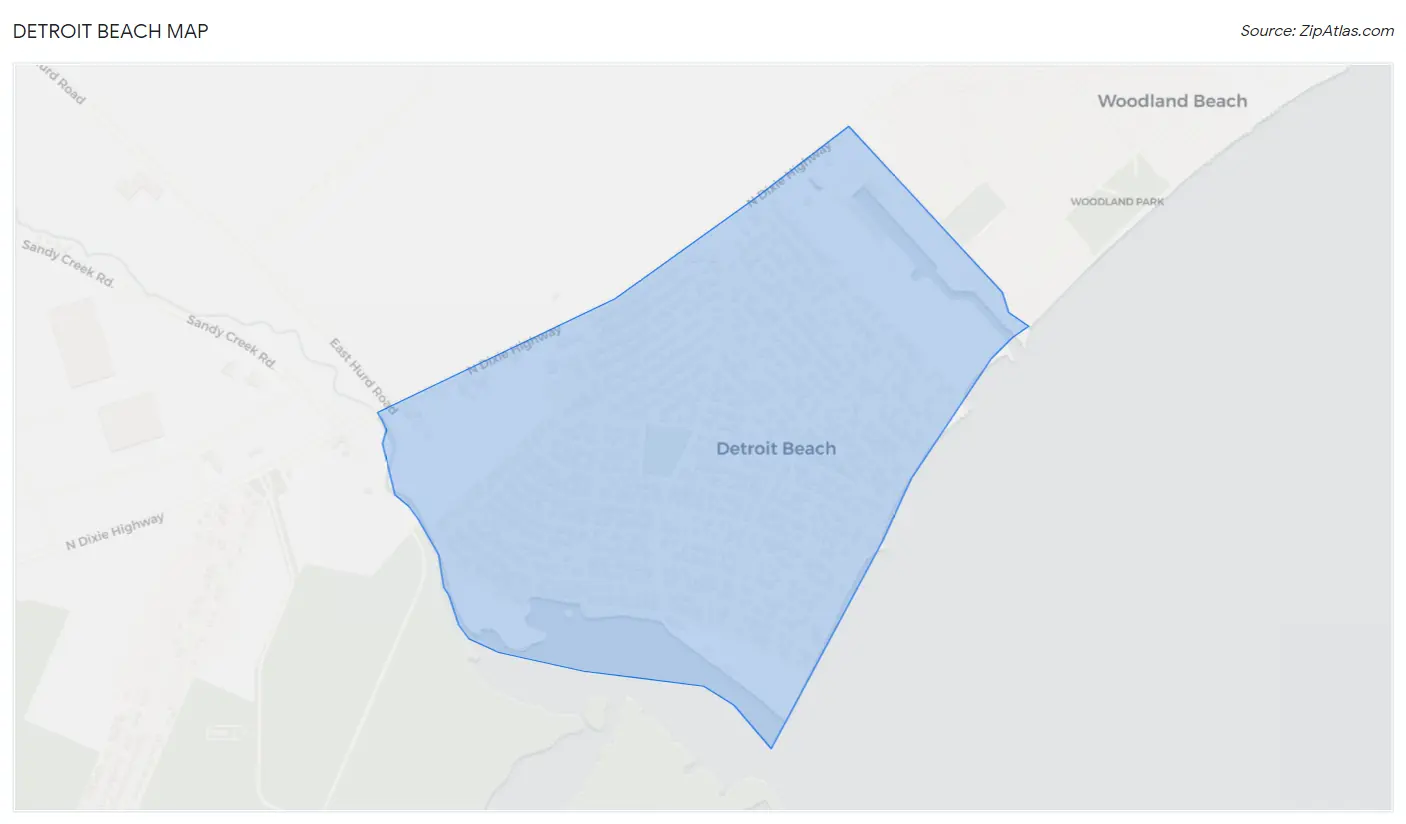
Detroit Beach Overview
$29,310
PER CAPITA INCOME
$60,515
AVG FAMILY INCOME
$70,868
AVG HOUSEHOLD INCOME
69.5%
WAGE / INCOME GAP [ % ]
30.5¢/ $1
WAGE / INCOME GAP [ $ ]
0.30
INEQUALITY / GINI INDEX
2,211
TOTAL POPULATION
1,263
MALE POPULATION
948
FEMALE POPULATION
133.23
MALES / 100 FEMALES
75.06
FEMALES / 100 MALES
33.4
MEDIAN AGE
2.7
AVG FAMILY SIZE
2.6
AVG HOUSEHOLD SIZE
1,130
LABOR FORCE [ PEOPLE ]
61.9%
PERCENT IN LABOR FORCE
1.4%
UNEMPLOYMENT RATE
Income in Detroit Beach
Income Overview in Detroit Beach
Per Capita Income in Detroit Beach is $29,310, while median incomes of families and households are $60,515 and $70,868 respectively.
| Characteristic | Number | Measure |
| Per Capita Income | 2,211 | $29,310 |
| Median Family Income | 701 | $60,515 |
| Mean Family Income | 701 | $65,482 |
| Median Household Income | 844 | $70,868 |
| Mean Household Income | 844 | $74,695 |
| Income Deficit | 701 | $0 |
| Wage / Income Gap (%) | 2,211 | 69.45% |
| Wage / Income Gap ($) | 2,211 | 30.55¢ per $1 |
| Gini / Inequality Index | 2,211 | 0.30 |
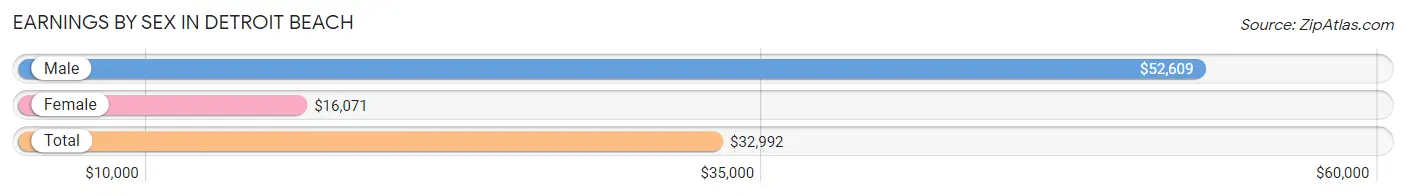
Earnings by Sex in Detroit Beach
Average Earnings in Detroit Beach are $32,992, $52,609 for men and $16,071 for women, a difference of 69.5%.
| Sex | Number | Average Earnings |
| Male | 762 (64.0%) | $52,609 |
| Female | 428 (36.0%) | $16,071 |
| Total | 1,190 (100.0%) | $32,992 |
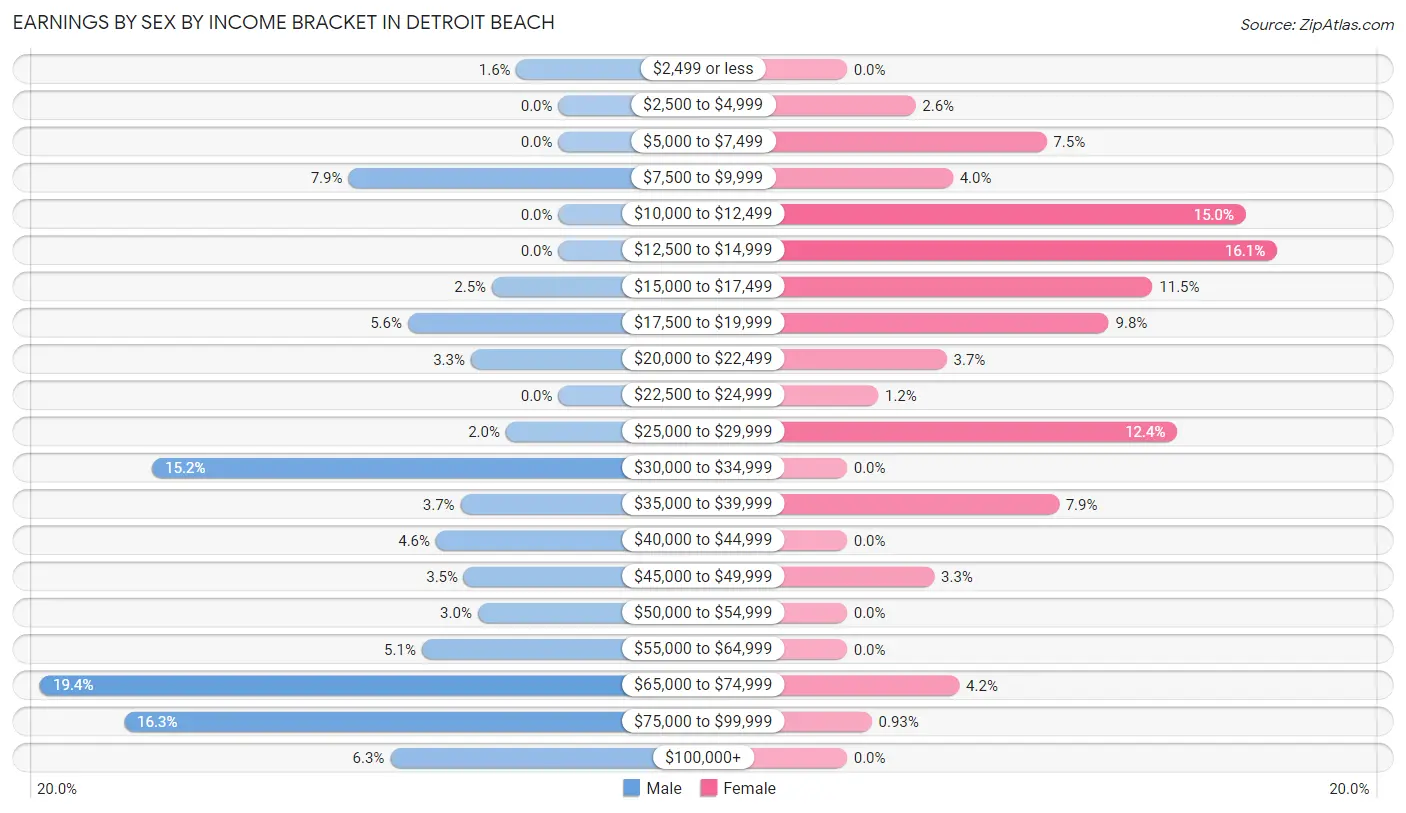
Earnings by Sex by Income Bracket in Detroit Beach
The most common earnings brackets in Detroit Beach are $65,000 to $74,999 for men (148 | 19.4%) and $12,500 to $14,999 for women (69 | 16.1%).
| Income | Male | Female |
| $2,499 or less | 12 (1.6%) | 0 (0.0%) |
| $2,500 to $4,999 | 0 (0.0%) | 11 (2.6%) |
| $5,000 to $7,499 | 0 (0.0%) | 32 (7.5%) |
| $7,500 to $9,999 | 60 (7.9%) | 17 (4.0%) |
| $10,000 to $12,499 | 0 (0.0%) | 64 (14.9%) |
| $12,500 to $14,999 | 0 (0.0%) | 69 (16.1%) |
| $15,000 to $17,499 | 19 (2.5%) | 49 (11.5%) |
| $17,500 to $19,999 | 43 (5.6%) | 42 (9.8%) |
| $20,000 to $22,499 | 25 (3.3%) | 16 (3.7%) |
| $22,500 to $24,999 | 0 (0.0%) | 5 (1.2%) |
| $25,000 to $29,999 | 15 (2.0%) | 53 (12.4%) |
| $30,000 to $34,999 | 116 (15.2%) | 0 (0.0%) |
| $35,000 to $39,999 | 28 (3.7%) | 34 (7.9%) |
| $40,000 to $44,999 | 35 (4.6%) | 0 (0.0%) |
| $45,000 to $49,999 | 27 (3.5%) | 14 (3.3%) |
| $50,000 to $54,999 | 23 (3.0%) | 0 (0.0%) |
| $55,000 to $64,999 | 39 (5.1%) | 0 (0.0%) |
| $65,000 to $74,999 | 148 (19.4%) | 18 (4.2%) |
| $75,000 to $99,999 | 124 (16.3%) | 4 (0.9%) |
| $100,000+ | 48 (6.3%) | 0 (0.0%) |
| Total | 762 (100.0%) | 428 (100.0%) |
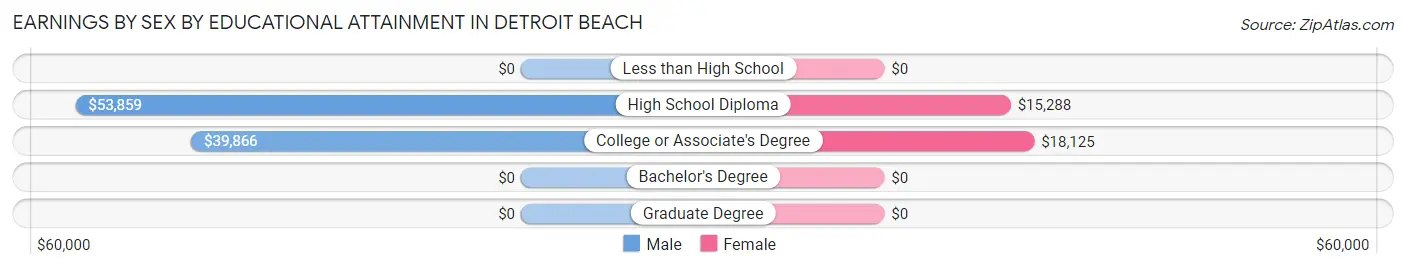
Earnings by Sex by Educational Attainment in Detroit Beach
Average earnings in Detroit Beach are $52,935 for men and $17,589 for women, a difference of 66.8%. Men with an educational attainment of high school diploma enjoy the highest average annual earnings of $53,859, while those with college or associate's degree education earn the least with $39,866. Women with an educational attainment of college or associate's degree earn the most with the average annual earnings of $18,125, while those with high school diploma education have the smallest earnings of $15,288.
| Educational Attainment | Male Income | Female Income |
| Less than High School | - | - |
| High School Diploma | $53,859 | $15,288 |
| College or Associate's Degree | $39,866 | $18,125 |
| Bachelor's Degree | - | - |
| Graduate Degree | - | - |
| Total | $52,935 | $17,589 |
Family Income in Detroit Beach
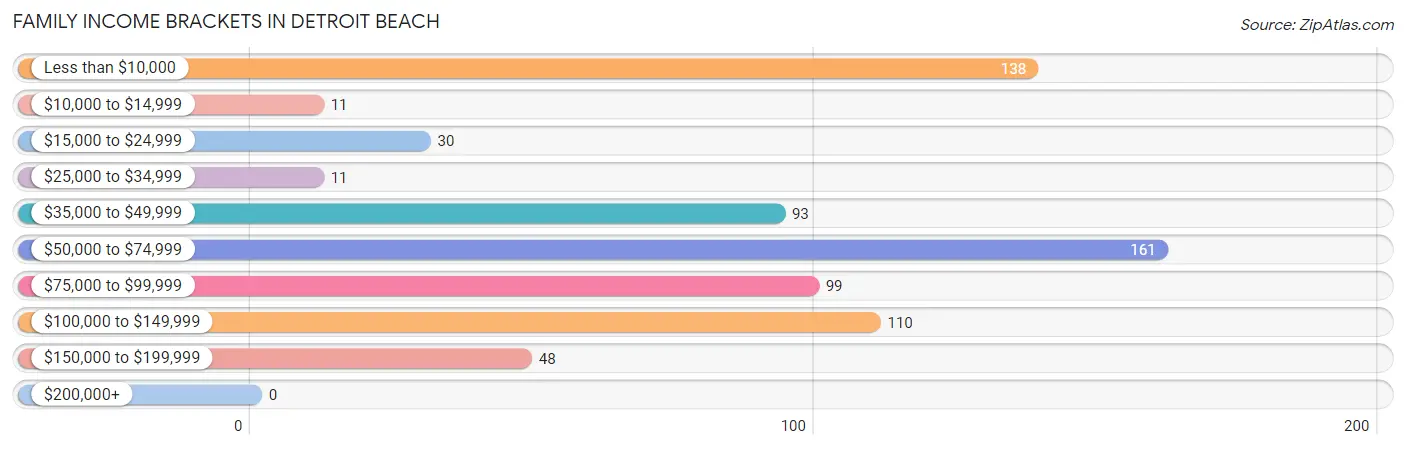
Family Income Brackets in Detroit Beach
According to the Detroit Beach family income data, there are 161 families falling into the $50,000 to $74,999 income range, which is the most common income bracket and makes up 23.0% of all families.
| Income Bracket | # Families | % Families |
| Less than $10,000 | 138 | 19.7% |
| $10,000 to $14,999 | 11 | 1.6% |
| $15,000 to $24,999 | 30 | 4.3% |
| $25,000 to $34,999 | 11 | 1.6% |
| $35,000 to $49,999 | 93 | 13.3% |
| $50,000 to $74,999 | 161 | 23.0% |
| $75,000 to $99,999 | 99 | 14.1% |
| $100,000 to $149,999 | 110 | 15.7% |
| $150,000 to $199,999 | 48 | 6.8% |
| $200,000+ | 0 | 0.0% |
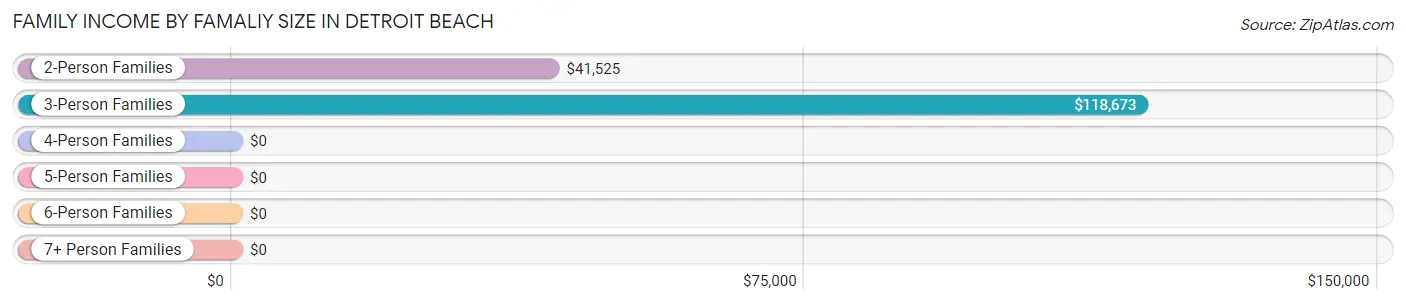
Family Income by Famaliy Size in Detroit Beach
3-person families (152 | 21.7%) account for the highest median family income in Detroit Beach with $118,673 per family, while 3-person families (152 | 21.7%) have the highest median income of $39,558 per family member.
| Income Bracket | # Families | Median Income |
| 2-Person Families | 449 (64.0%) | $41,525 |
| 3-Person Families | 152 (21.7%) | $118,673 |
| 4-Person Families | 49 (7.0%) | $0 |
| 5-Person Families | 42 (6.0%) | $0 |
| 6-Person Families | 0 (0.0%) | $0 |
| 7+ Person Families | 9 (1.3%) | $0 |
| Total | 701 (100.0%) | $60,515 |
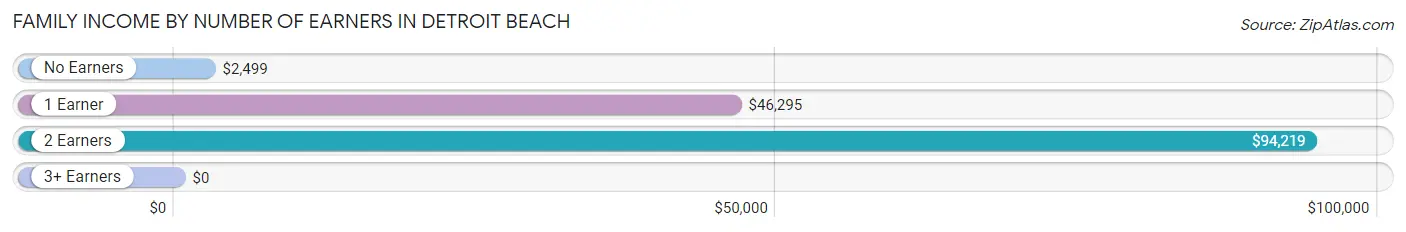
Family Income by Number of Earners in Detroit Beach
| Number of Earners | # Families | Median Income |
| No Earners | 261 (37.2%) | $2,499 |
| 1 Earner | 111 (15.8%) | $46,295 |
| 2 Earners | 223 (31.8%) | $94,219 |
| 3+ Earners | 106 (15.1%) | $0 |
| Total | 701 (100.0%) | $60,515 |
Household Income in Detroit Beach
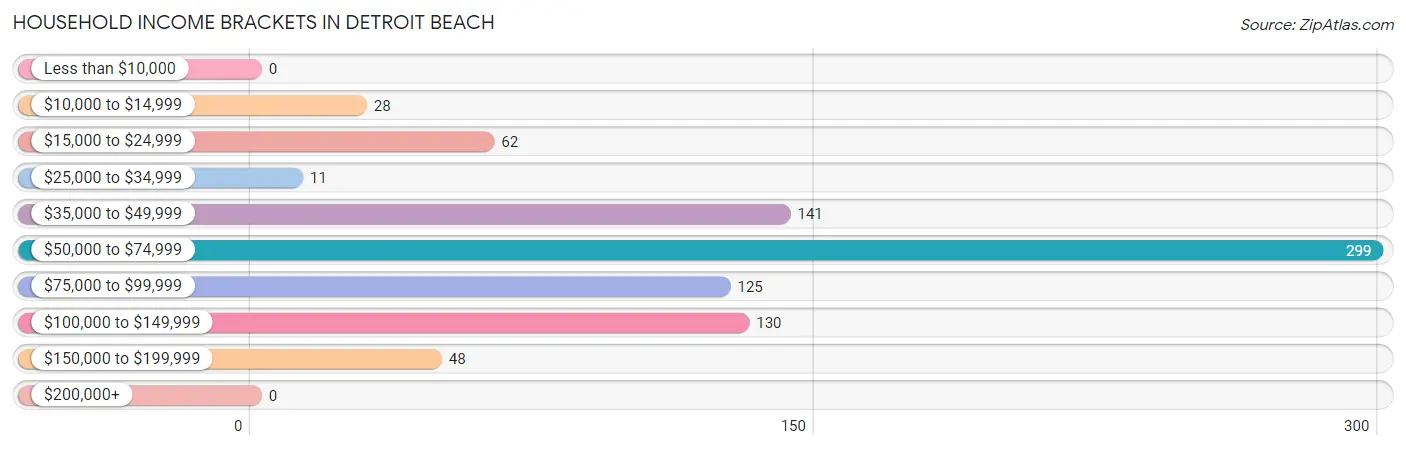
Household Income Brackets in Detroit Beach
With 299 households falling in the category, the $50,000 to $74,999 income range is the most frequent in Detroit Beach, accounting for 35.4% of all households.
| Income Bracket | # Households | % Households |
| Less than $10,000 | 0 | 0.0% |
| $10,000 to $14,999 | 28 | 3.3% |
| $15,000 to $24,999 | 62 | 7.3% |
| $25,000 to $34,999 | 11 | 1.3% |
| $35,000 to $49,999 | 141 | 16.7% |
| $50,000 to $74,999 | 299 | 35.4% |
| $75,000 to $99,999 | 125 | 14.8% |
| $100,000 to $149,999 | 130 | 15.4% |
| $150,000 to $199,999 | 48 | 5.7% |
| $200,000+ | 0 | 0.0% |
Household Income by Householder Age in Detroit Beach
The median household income in Detroit Beach is $70,868, with the highest median household income of $86,316 found in the 45 to 64 years age bracket for the primary householder. A total of 368 households (43.6%) fall into this category.
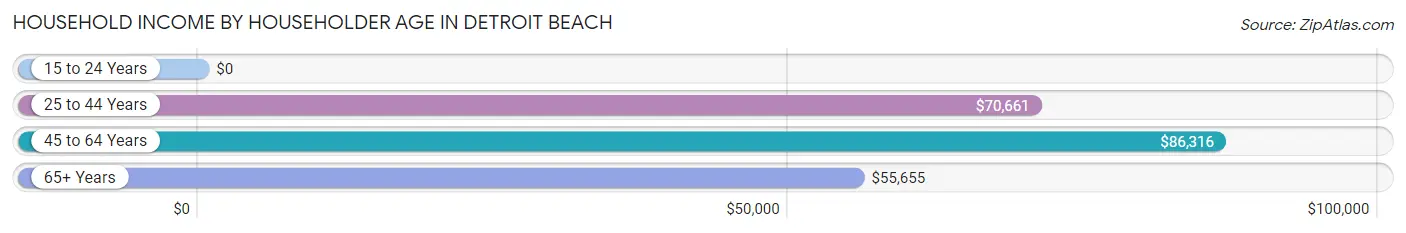
| Income Bracket | # Households | Median Income |
| 15 to 24 Years | 0 (0.0%) | $0 |
| 25 to 44 Years | 321 (38.0%) | $70,661 |
| 45 to 64 Years | 368 (43.6%) | $86,316 |
| 65+ Years | 155 (18.4%) | $55,655 |
| Total | 844 (100.0%) | $70,868 |
Poverty in Detroit Beach
Income Below Poverty by Sex and Age in Detroit Beach
With 15.3% poverty level for males and 23.1% for females among the residents of Detroit Beach, under 5 year old males and 25 to 34 year old females are the most vulnerable to poverty, with 132 males (100.0%) and 159 females (64.4%) in their respective age groups living below the poverty level.
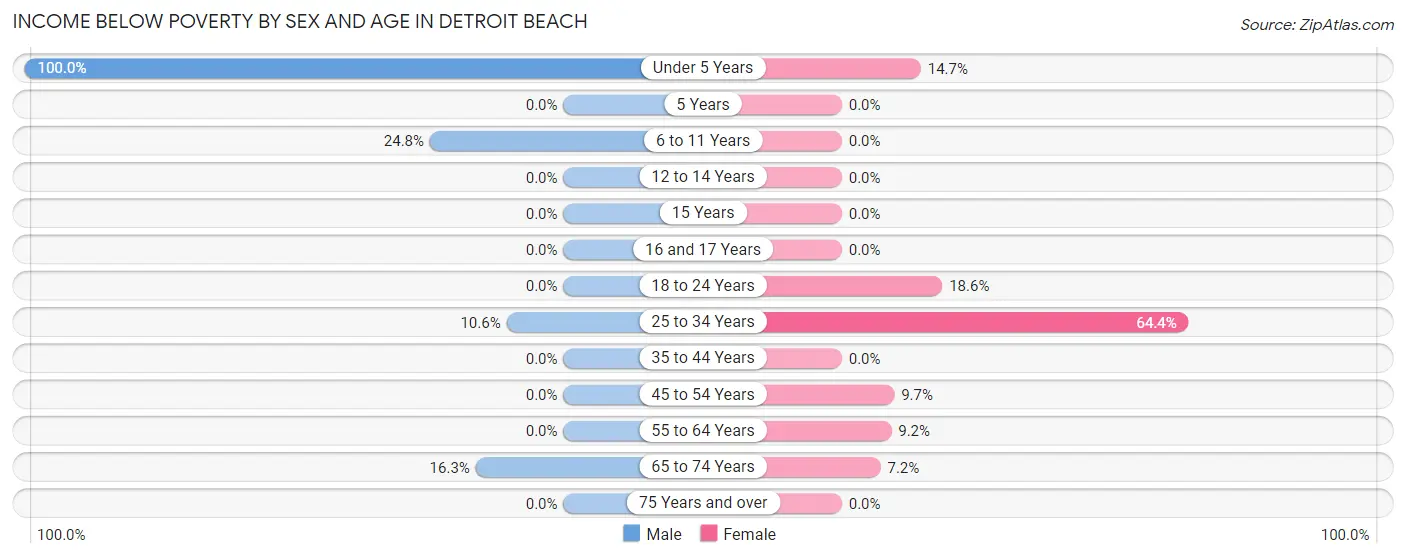
| Age Bracket | Male | Female |
| Under 5 Years | 132 (100.0%) | 11 (14.7%) |
| 5 Years | 0 (0.0%) | 0 (0.0%) |
| 6 to 11 Years | 28 (24.8%) | 0 (0.0%) |
| 12 to 14 Years | 0 (0.0%) | 0 (0.0%) |
| 15 Years | 0 (0.0%) | 0 (0.0%) |
| 16 and 17 Years | 0 (0.0%) | 0 (0.0%) |
| 18 to 24 Years | 0 (0.0%) | 11 (18.6%) |
| 25 to 34 Years | 19 (10.6%) | 159 (64.4%) |
| 35 to 44 Years | 0 (0.0%) | 0 (0.0%) |
| 45 to 54 Years | 0 (0.0%) | 11 (9.7%) |
| 55 to 64 Years | 0 (0.0%) | 17 (9.2%) |
| 65 to 74 Years | 14 (16.3%) | 10 (7.2%) |
| 75 Years and over | 0 (0.0%) | 0 (0.0%) |
| Total | 193 (15.3%) | 219 (23.1%) |
Income Above Poverty by Sex and Age in Detroit Beach
According to the poverty statistics in Detroit Beach, males aged 5 years and females aged 6 to 11 years are the age groups that are most secure financially, with 100.0% of males and 100.0% of females in these age groups living above the poverty line.
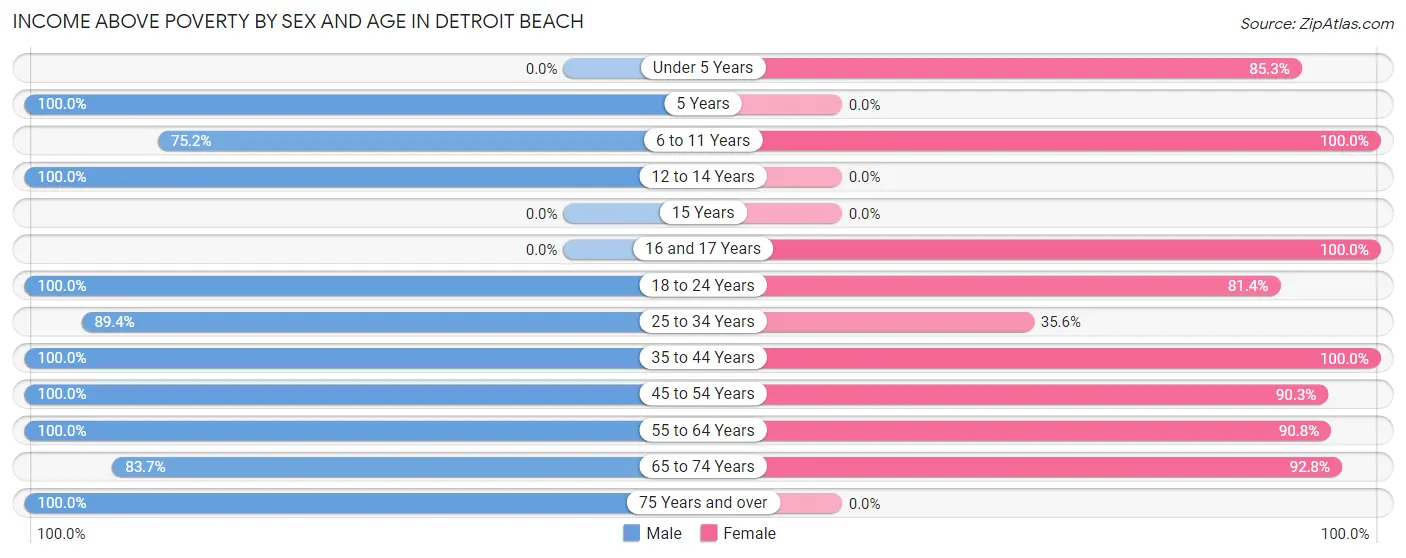
| Age Bracket | Male | Female |
| Under 5 Years | 0 (0.0%) | 64 (85.3%) |
| 5 Years | 13 (100.0%) | 0 (0.0%) |
| 6 to 11 Years | 85 (75.2%) | 33 (100.0%) |
| 12 to 14 Years | 19 (100.0%) | 0 (0.0%) |
| 15 Years | 0 (0.0%) | 0 (0.0%) |
| 16 and 17 Years | 0 (0.0%) | 21 (100.0%) |
| 18 to 24 Years | 264 (100.0%) | 48 (81.4%) |
| 25 to 34 Years | 161 (89.4%) | 88 (35.6%) |
| 35 to 44 Years | 73 (100.0%) | 76 (100.0%) |
| 45 to 54 Years | 66 (100.0%) | 102 (90.3%) |
| 55 to 64 Years | 292 (100.0%) | 168 (90.8%) |
| 65 to 74 Years | 72 (83.7%) | 129 (92.8%) |
| 75 Years and over | 25 (100.0%) | 0 (0.0%) |
| Total | 1,070 (84.7%) | 729 (76.9%) |
Income Below Poverty Among Married-Couple Families in Detroit Beach
The poverty statistics for married-couple families in Detroit Beach show that 2.6% or 11 of the total 430 families live below the poverty line. Families with 1 or 2 children have the highest poverty rate of 16.9%, comprising of 11 families. On the other hand, families with no children have the lowest poverty rate of 0.0%, which includes 0 families.
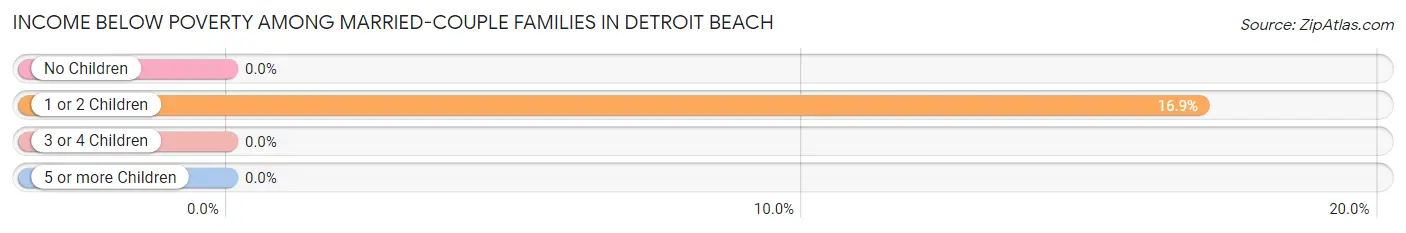
| Children | Above Poverty | Below Poverty |
| No Children | 323 (100.0%) | 0 (0.0%) |
| 1 or 2 Children | 54 (83.1%) | 11 (16.9%) |
| 3 or 4 Children | 42 (100.0%) | 0 (0.0%) |
| 5 or more Children | 0 (0.0%) | 0 (0.0%) |
| Total | 419 (97.4%) | 11 (2.6%) |
Income Below Poverty Among Single-Parent Households in Detroit Beach
According to the poverty data in Detroit Beach, 26.4% or 19 single-father households and 74.9% or 149 single-mother households are living below the poverty line. Among single-father households, those with 1 or 2 children have the highest poverty rate, with 19 households (100.0%) experiencing poverty. Likewise, among single-mother households, those with 1 or 2 children have the highest poverty rate, with 149 households (100.0%) falling below the poverty line.
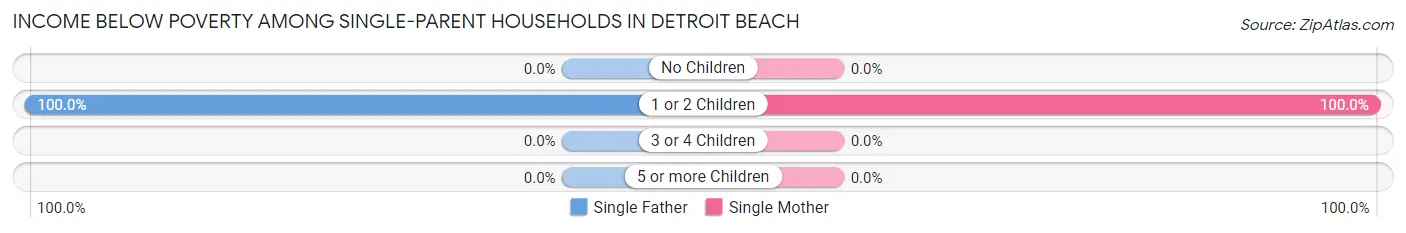
| Children | Single Father | Single Mother |
| No Children | 0 (0.0%) | 0 (0.0%) |
| 1 or 2 Children | 19 (100.0%) | 149 (100.0%) |
| 3 or 4 Children | 0 (0.0%) | 0 (0.0%) |
| 5 or more Children | 0 (0.0%) | 0 (0.0%) |
| Total | 19 (26.4%) | 149 (74.9%) |
Income Below Poverty Among Married-Couple vs Single-Parent Households in Detroit Beach
The poverty data for Detroit Beach shows that 11 of the married-couple family households (2.6%) and 168 of the single-parent households (62.0%) are living below the poverty level. Within the married-couple family households, those with 1 or 2 children have the highest poverty rate, with 11 households (16.9%) falling below the poverty line. Among the single-parent households, those with 1 or 2 children have the highest poverty rate, with 168 household (100.0%) living below poverty.
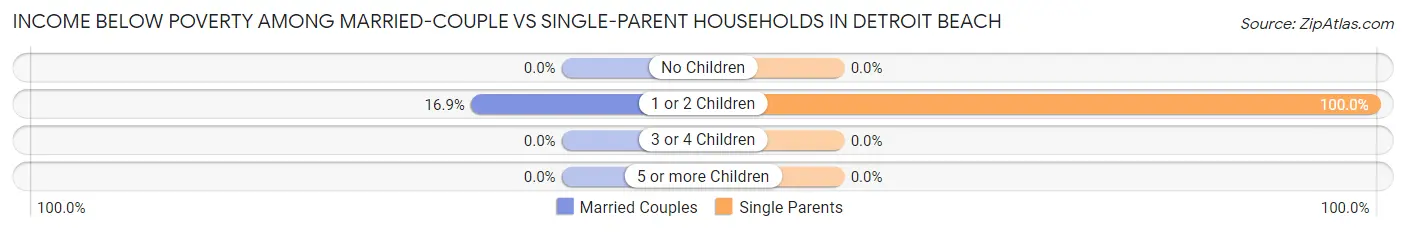
| Children | Married-Couple Families | Single-Parent Households |
| No Children | 0 (0.0%) | 0 (0.0%) |
| 1 or 2 Children | 11 (16.9%) | 168 (100.0%) |
| 3 or 4 Children | 0 (0.0%) | 0 (0.0%) |
| 5 or more Children | 0 (0.0%) | 0 (0.0%) |
| Total | 11 (2.6%) | 168 (62.0%) |
Race in Detroit Beach
The most populous races in Detroit Beach are White / Caucasian (2,168 | 98.1%), Hispanic or Latino (184 | 8.3%), and Two or more Races (40 | 1.8%).
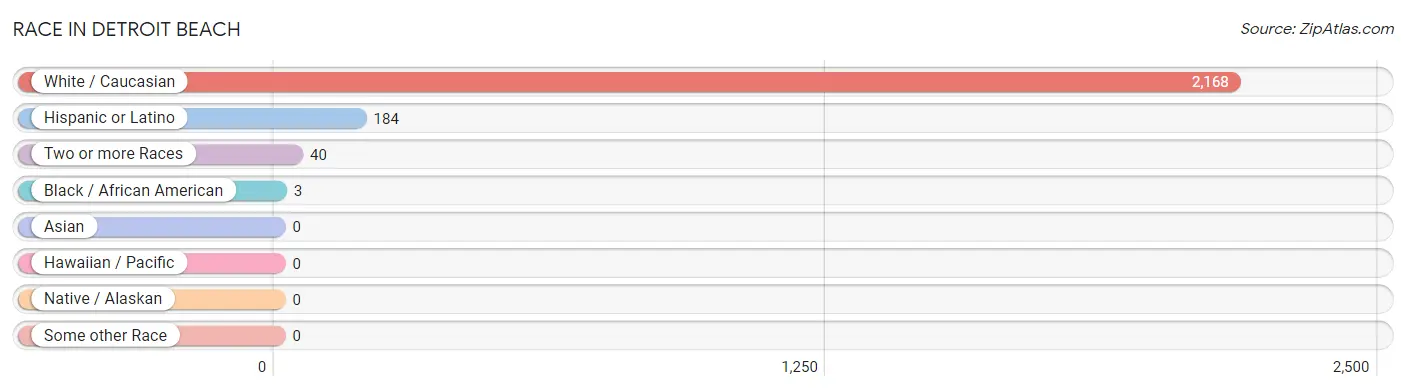
| Race | # Population | % Population |
| Asian | 0 | 0.0% |
| Black / African American | 3 | 0.1% |
| Hawaiian / Pacific | 0 | 0.0% |
| Hispanic or Latino | 184 | 8.3% |
| Native / Alaskan | 0 | 0.0% |
| White / Caucasian | 2,168 | 98.1% |
| Two or more Races | 40 | 1.8% |
| Some other Race | 0 | 0.0% |
| Total | 2,211 | 100.0% |
Ancestry in Detroit Beach
The most populous ancestries reported in Detroit Beach are German (561 | 25.4%), Scottish (255 | 11.5%), Irish (223 | 10.1%), English (196 | 8.9%), and Italian (191 | 8.6%), together accounting for 64.5% of all Detroit Beach residents.
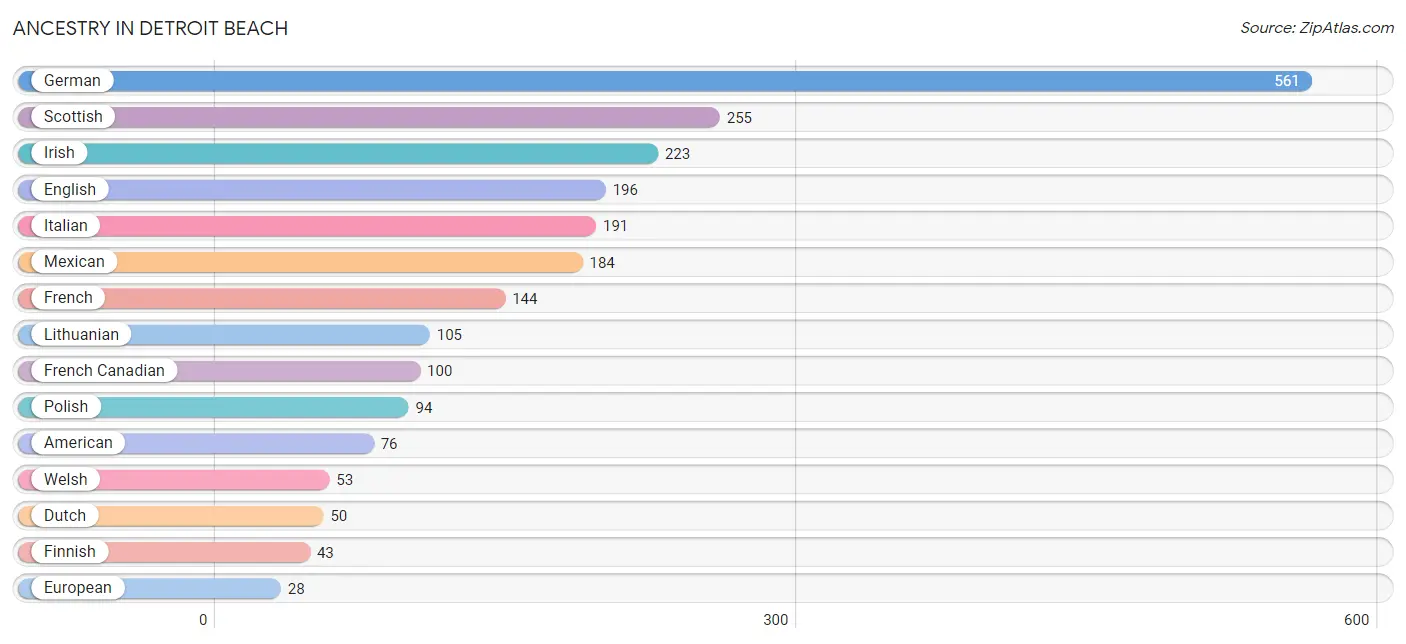
| Ancestry | # Population | % Population |
| American | 76 | 3.4% |
| Blackfeet | 2 | 0.1% |
| British | 22 | 1.0% |
| Dutch | 50 | 2.3% |
| English | 196 | 8.9% |
| European | 28 | 1.3% |
| Finnish | 43 | 1.9% |
| French | 144 | 6.5% |
| French Canadian | 100 | 4.5% |
| German | 561 | 25.4% |
| Hungarian | 17 | 0.8% |
| Irish | 223 | 10.1% |
| Italian | 191 | 8.6% |
| Korean | 17 | 0.8% |
| Lithuanian | 105 | 4.8% |
| Mexican | 184 | 8.3% |
| Norwegian | 7 | 0.3% |
| Polish | 94 | 4.3% |
| Scottish | 255 | 11.5% |
| Swedish | 13 | 0.6% |
| Welsh | 53 | 2.4% | View All 21 Rows |
Immigrants in Detroit Beach

| Immigration Origin | # Population | % Population | View All 0 Rows |
Sex and Age in Detroit Beach
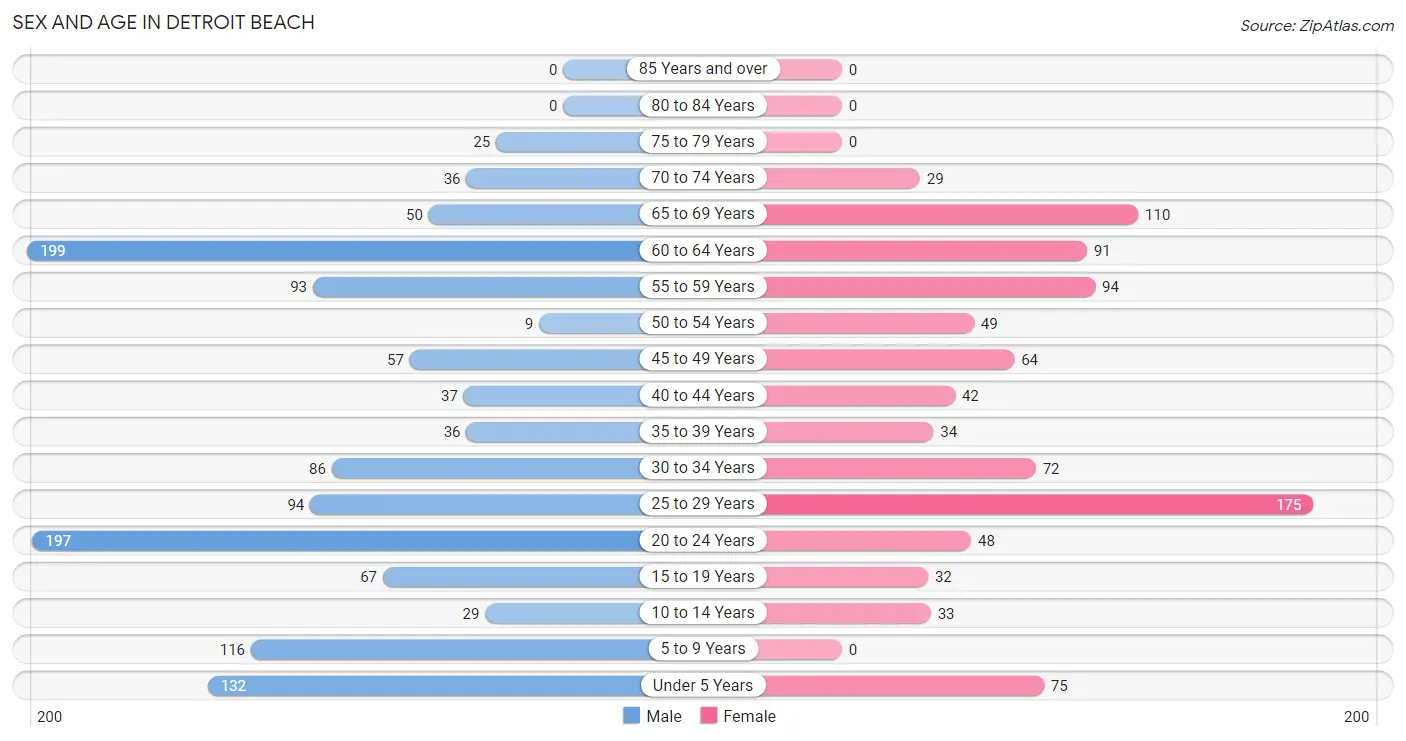
Sex and Age in Detroit Beach
The most populous age groups in Detroit Beach are 60 to 64 Years (199 | 15.8%) for men and 25 to 29 Years (175 | 18.5%) for women.
| Age Bracket | Male | Female |
| Under 5 Years | 132 (10.4%) | 75 (7.9%) |
| 5 to 9 Years | 116 (9.2%) | 0 (0.0%) |
| 10 to 14 Years | 29 (2.3%) | 33 (3.5%) |
| 15 to 19 Years | 67 (5.3%) | 32 (3.4%) |
| 20 to 24 Years | 197 (15.6%) | 48 (5.1%) |
| 25 to 29 Years | 94 (7.4%) | 175 (18.5%) |
| 30 to 34 Years | 86 (6.8%) | 72 (7.6%) |
| 35 to 39 Years | 36 (2.9%) | 34 (3.6%) |
| 40 to 44 Years | 37 (2.9%) | 42 (4.4%) |
| 45 to 49 Years | 57 (4.5%) | 64 (6.8%) |
| 50 to 54 Years | 9 (0.7%) | 49 (5.2%) |
| 55 to 59 Years | 93 (7.4%) | 94 (9.9%) |
| 60 to 64 Years | 199 (15.8%) | 91 (9.6%) |
| 65 to 69 Years | 50 (4.0%) | 110 (11.6%) |
| 70 to 74 Years | 36 (2.9%) | 29 (3.1%) |
| 75 to 79 Years | 25 (2.0%) | 0 (0.0%) |
| 80 to 84 Years | 0 (0.0%) | 0 (0.0%) |
| 85 Years and over | 0 (0.0%) | 0 (0.0%) |
| Total | 1,263 (100.0%) | 948 (100.0%) |
Families and Households in Detroit Beach
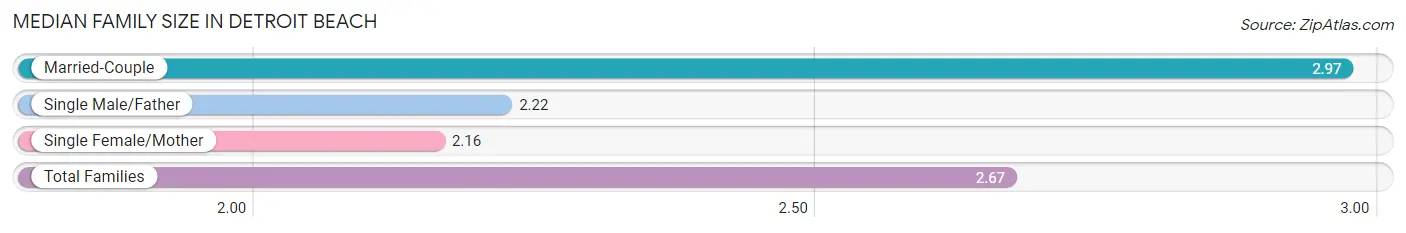
Median Family Size in Detroit Beach
The median family size in Detroit Beach is 2.67 persons per family, with married-couple families (430 | 61.3%) accounting for the largest median family size of 2.97 persons per family. On the other hand, single female/mother families (199 | 28.4%) represent the smallest median family size with 2.16 persons per family.
| Family Type | # Families | Family Size |
| Married-Couple | 430 (61.3%) | 2.97 |
| Single Male/Father | 72 (10.3%) | 2.22 |
| Single Female/Mother | 199 (28.4%) | 2.16 |
| Total Families | 701 (100.0%) | 2.67 |
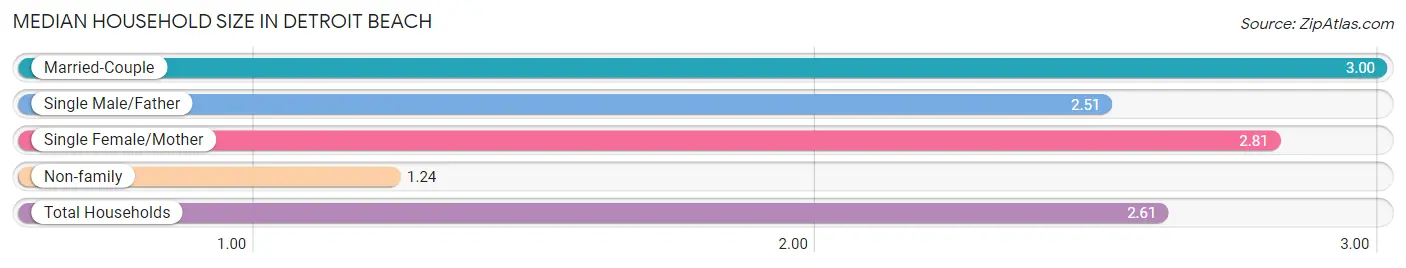
Median Household Size in Detroit Beach
The median household size in Detroit Beach is 2.61 persons per household, with married-couple households (430 | 50.9%) accounting for the largest median household size of 3 persons per household. non-family households (143 | 16.9%) represent the smallest median household size with 1.24 persons per household.
| Household Type | # Households | Household Size |
| Married-Couple | 430 (50.9%) | 3.00 |
| Single Male/Father | 72 (8.5%) | 2.51 |
| Single Female/Mother | 199 (23.6%) | 2.81 |
| Non-family | 143 (16.9%) | 1.24 |
| Total Households | 844 (100.0%) | 2.61 |
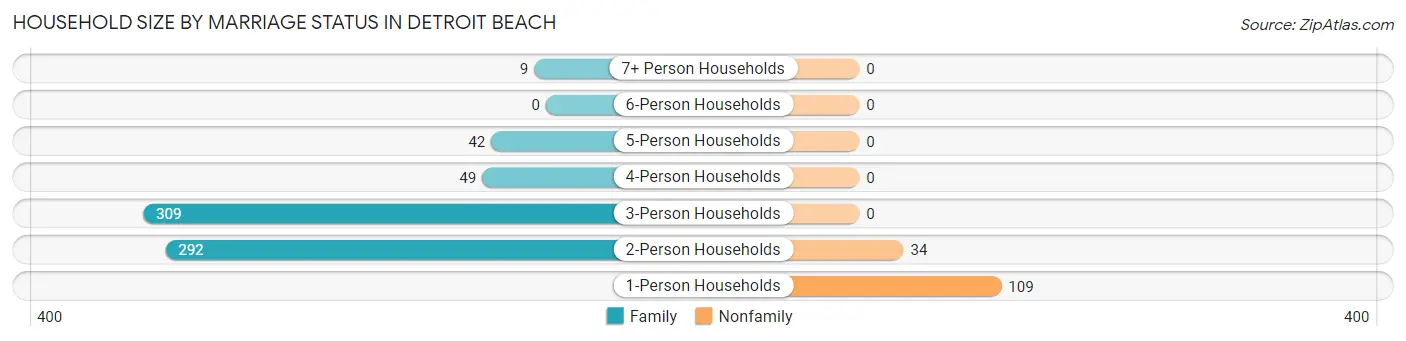
Household Size by Marriage Status in Detroit Beach
Out of a total of 844 households in Detroit Beach, 701 (83.1%) are family households, while 143 (16.9%) are nonfamily households. The most numerous type of family households are 3-person households, comprising 309, and the most common type of nonfamily households are 1-person households, comprising 109.
| Household Size | Family Households | Nonfamily Households |
| 1-Person Households | - | 109 (12.9%) |
| 2-Person Households | 292 (34.6%) | 34 (4.0%) |
| 3-Person Households | 309 (36.6%) | 0 (0.0%) |
| 4-Person Households | 49 (5.8%) | 0 (0.0%) |
| 5-Person Households | 42 (5.0%) | 0 (0.0%) |
| 6-Person Households | 0 (0.0%) | 0 (0.0%) |
| 7+ Person Households | 9 (1.1%) | 0 (0.0%) |
| Total | 701 (83.1%) | 143 (16.9%) |
Female Fertility in Detroit Beach
Fertility by Age in Detroit Beach
Average fertility rate in Detroit Beach is 56.0 births per 1,000 women. Women in the age bracket of 20 to 34 years have the highest fertility rate with 92.0 births per 1,000 women. Women in the age bracket of 20 to 34 years acount for 100.0% of all women with births.
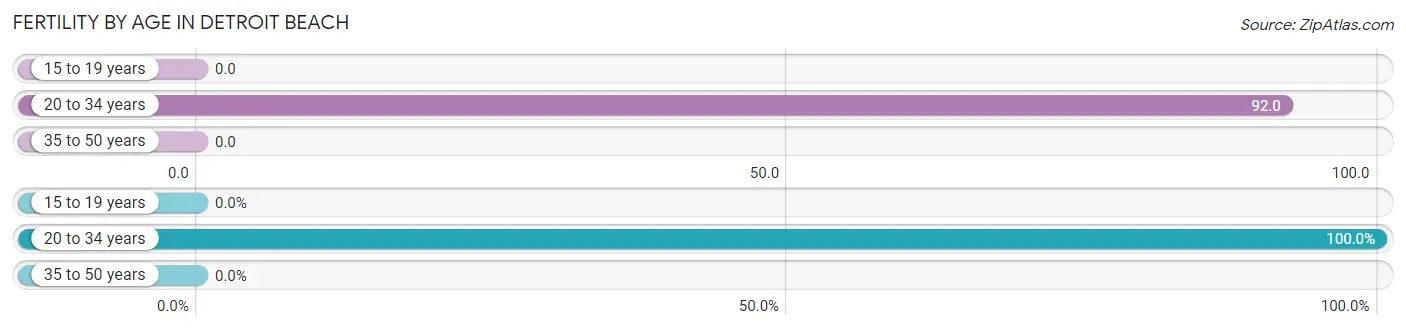
| Age Bracket | Women with Births | Births / 1,000 Women |
| 15 to 19 years | 0 (0.0%) | 0.0 |
| 20 to 34 years | 27 (100.0%) | 92.0 |
| 35 to 50 years | 0 (0.0%) | 0.0 |
| Total | 27 (100.0%) | 56.0 |
Fertility by Age by Marriage Status in Detroit Beach
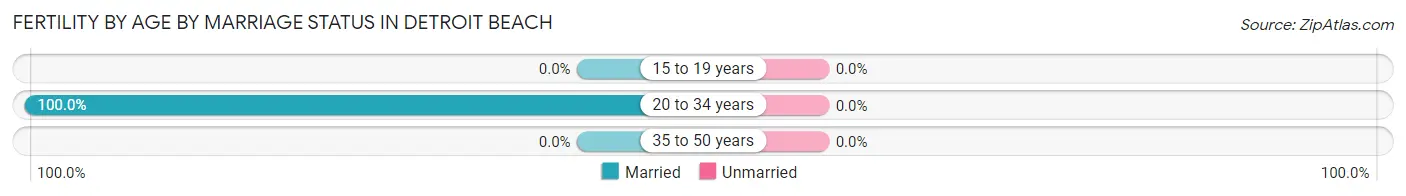
| Age Bracket | Married | Unmarried |
| 15 to 19 years | 0 (0.0%) | 0 (0.0%) |
| 20 to 34 years | 27 (100.0%) | 0 (0.0%) |
| 35 to 50 years | 0 (0.0%) | 0 (0.0%) |
| Total | 27 (100.0%) | 0 (0.0%) |
Fertility by Education in Detroit Beach
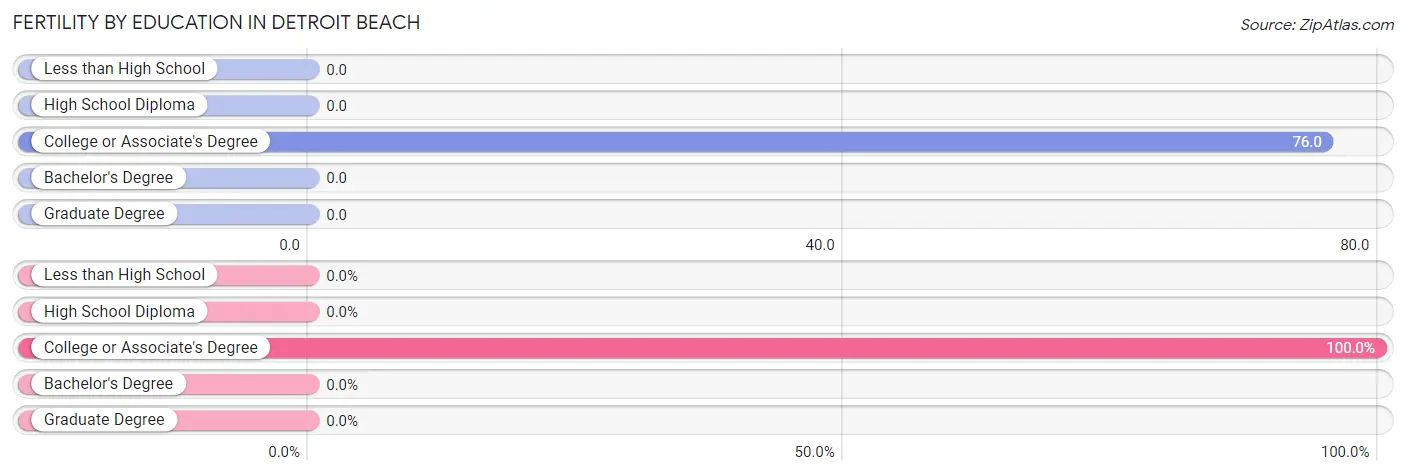
| Educational Attainment | Women with Births | Births / 1,000 Women |
| Less than High School | 0 (0.0%) | 0.0 |
| High School Diploma | 0 (0.0%) | 0.0 |
| College or Associate's Degree | 27 (100.0%) | 76.0 |
| Bachelor's Degree | 0 (0.0%) | 0.0 |
| Graduate Degree | 0 (0.0%) | 0.0 |
| Total | 27 (100.0%) | 56.0 |
Fertility by Education by Marriage Status in Detroit Beach
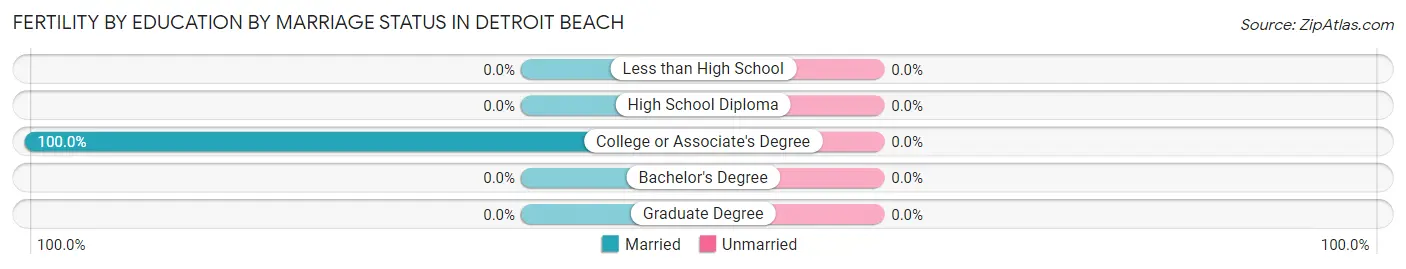
| Educational Attainment | Married | Unmarried |
| Less than High School | 0 (0.0%) | 0 (0.0%) |
| High School Diploma | 0 (0.0%) | 0 (0.0%) |
| College or Associate's Degree | 27 (100.0%) | 0 (0.0%) |
| Bachelor's Degree | 0 (0.0%) | 0 (0.0%) |
| Graduate Degree | 0 (0.0%) | 0 (0.0%) |
| Total | 27 (100.0%) | 0 (0.0%) |
Employment Characteristics in Detroit Beach
Employment by Class of Employer in Detroit Beach
Among the 1,115 employed individuals in Detroit Beach, private company employees (961 | 86.2%), local government employees (59 | 5.3%), and not-for-profit organizations (53 | 4.8%) make up the most common classes of employment.
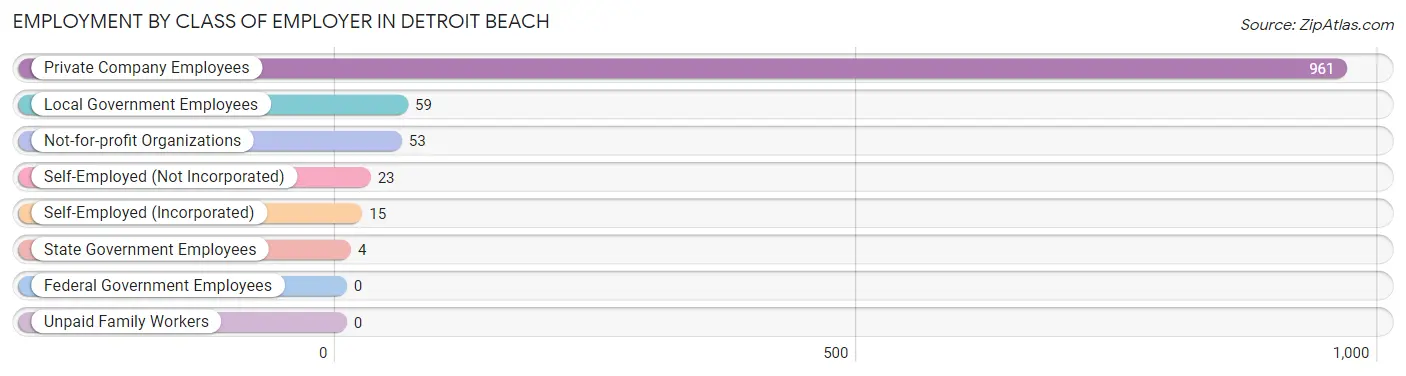
| Employer Class | # Employees | % Employees |
| Private Company Employees | 961 | 86.2% |
| Self-Employed (Incorporated) | 15 | 1.3% |
| Self-Employed (Not Incorporated) | 23 | 2.1% |
| Not-for-profit Organizations | 53 | 4.8% |
| Local Government Employees | 59 | 5.3% |
| State Government Employees | 4 | 0.4% |
| Federal Government Employees | 0 | 0.0% |
| Unpaid Family Workers | 0 | 0.0% |
| Total | 1,115 | 100.0% |
Employment Status by Age in Detroit Beach
According to the labor force statistics for Detroit Beach, out of the total population over 16 years of age (1,826), 61.9% or 1,130 individuals are in the labor force, with 1.4% or 16 of them unemployed. The age group with the highest labor force participation rate is 20 to 24 years, with 100.0% or 245 individuals in the labor force. Within the labor force, the 55 to 59 years age range has the highest percentage of unemployed individuals, with 10.2% or 11 of them being unemployed.
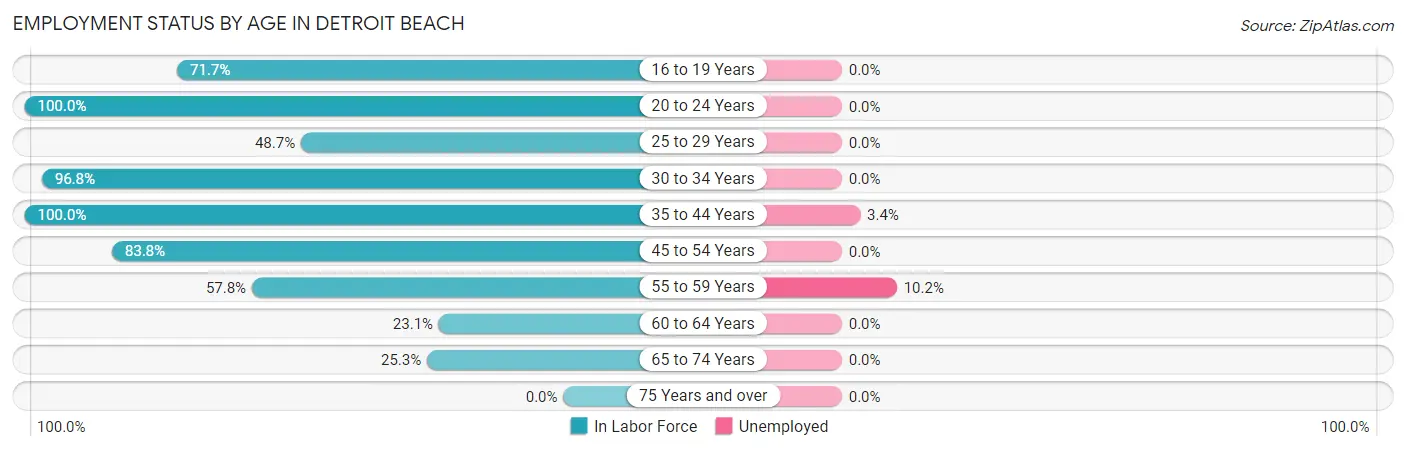
| Age Bracket | In Labor Force | Unemployed |
| 16 to 19 Years | 71 (71.7%) | 0 (0.0%) |
| 20 to 24 Years | 245 (100.0%) | 0 (0.0%) |
| 25 to 29 Years | 131 (48.7%) | 0 (0.0%) |
| 30 to 34 Years | 153 (96.8%) | 0 (0.0%) |
| 35 to 44 Years | 149 (100.0%) | 5 (3.4%) |
| 45 to 54 Years | 150 (83.8%) | 0 (0.0%) |
| 55 to 59 Years | 108 (57.8%) | 11 (10.2%) |
| 60 to 64 Years | 67 (23.1%) | 0 (0.0%) |
| 65 to 74 Years | 57 (25.3%) | 0 (0.0%) |
| 75 Years and over | 0 (0.0%) | 0 (0.0%) |
| Total | 1,130 (61.9%) | 16 (1.4%) |
Employment Status by Educational Attainment in Detroit Beach
According to labor force statistics for Detroit Beach, 61.5% of individuals (758) out of the total population between 25 and 64 years of age (1,232) are in the labor force, with 2.1% or 16 of them being unemployed. The group with the highest labor force participation rate are those with the educational attainment of bachelor's degree or higher, with 100.0% or 63 individuals in the labor force. Within the labor force, individuals with high school diploma education have the highest percentage of unemployment, with 5.7% or 16 of them being unemployed.
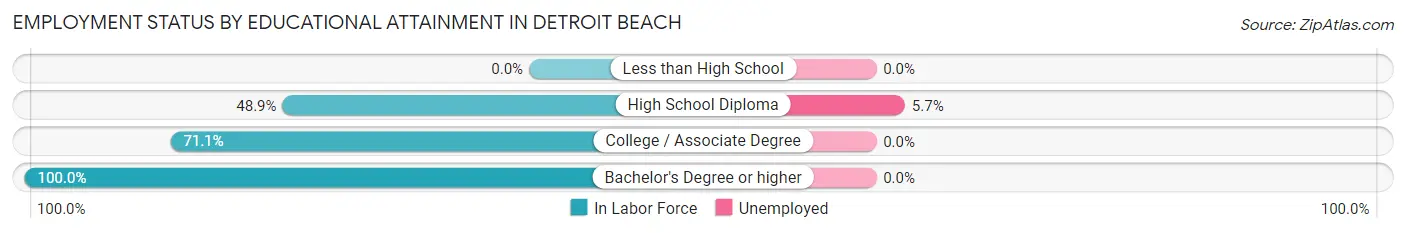
| Educational Attainment | In Labor Force | Unemployed |
| Less than High School | 0 (0.0%) | 0 (0.0%) |
| High School Diploma | 280 (48.9%) | 33 (5.7%) |
| College / Associate Degree | 415 (71.1%) | 0 (0.0%) |
| Bachelor's Degree or higher | 63 (100.0%) | 0 (0.0%) |
| Total | 758 (61.5%) | 26 (2.1%) |
Employment Occupations by Sex in Detroit Beach
Management, Business, Science and Arts Occupations
The most common Management, Business, Science and Arts occupations in Detroit Beach are Community & Social Service (38 | 3.4%), Legal Services & Support (38 | 3.4%), Health Diagnosing & Treating (32 | 2.9%), Computers, Engineering & Science (31 | 2.8%), and Architecture & Engineering (31 | 2.8%).
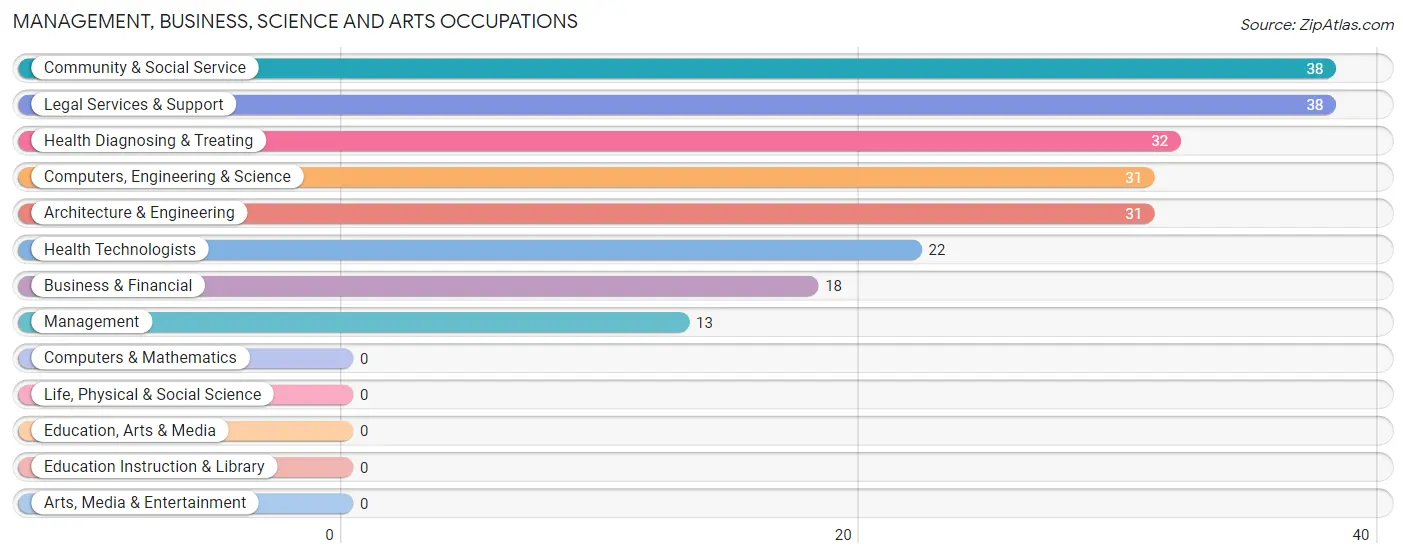
Management, Business, Science and Arts Occupations by Sex
Within the Management, Business, Science and Arts occupations in Detroit Beach, the most male-oriented occupations are Management (100.0%), Computers, Engineering & Science (100.0%), and Architecture & Engineering (100.0%), while the most female-oriented occupations are Business & Financial (100.0%), Community & Social Service (100.0%), and Legal Services & Support (100.0%).
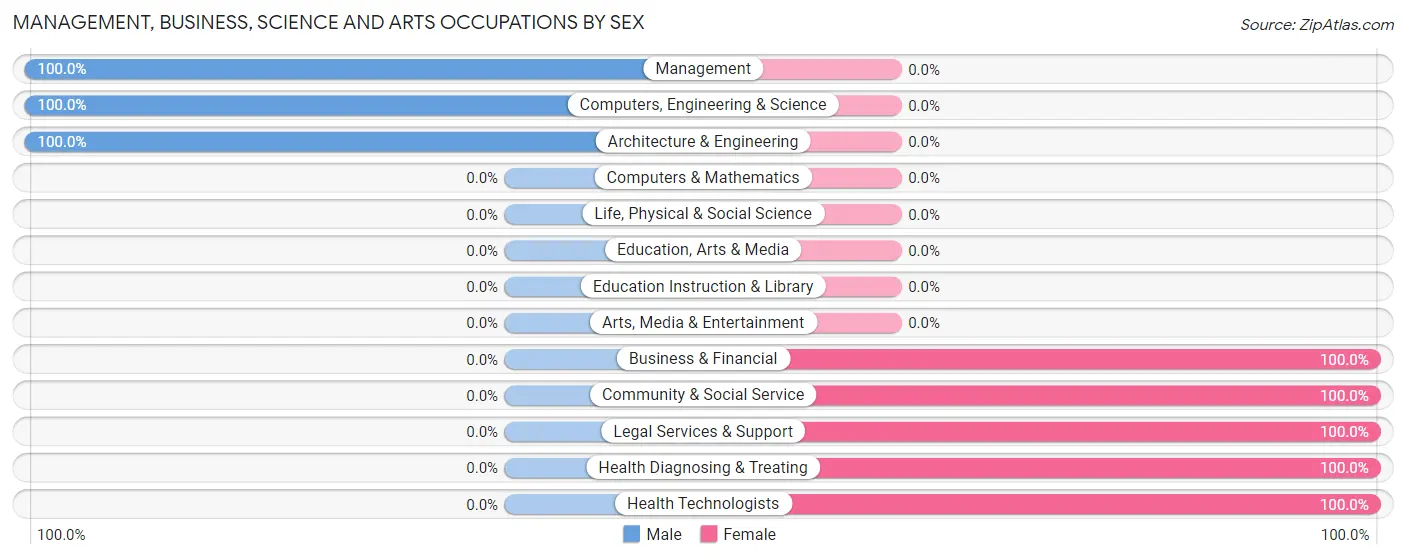
| Occupation | Male | Female |
| Management | 13 (100.0%) | 0 (0.0%) |
| Business & Financial | 0 (0.0%) | 18 (100.0%) |
| Computers, Engineering & Science | 31 (100.0%) | 0 (0.0%) |
| Computers & Mathematics | 0 (0.0%) | 0 (0.0%) |
| Architecture & Engineering | 31 (100.0%) | 0 (0.0%) |
| Life, Physical & Social Science | 0 (0.0%) | 0 (0.0%) |
| Community & Social Service | 0 (0.0%) | 38 (100.0%) |
| Education, Arts & Media | 0 (0.0%) | 0 (0.0%) |
| Legal Services & Support | 0 (0.0%) | 38 (100.0%) |
| Education Instruction & Library | 0 (0.0%) | 0 (0.0%) |
| Arts, Media & Entertainment | 0 (0.0%) | 0 (0.0%) |
| Health Diagnosing & Treating | 0 (0.0%) | 32 (100.0%) |
| Health Technologists | 0 (0.0%) | 22 (100.0%) |
| Total (Category) | 44 (33.3%) | 88 (66.7%) |
| Total (Overall) | 729 (65.4%) | 386 (34.6%) |
Services Occupations
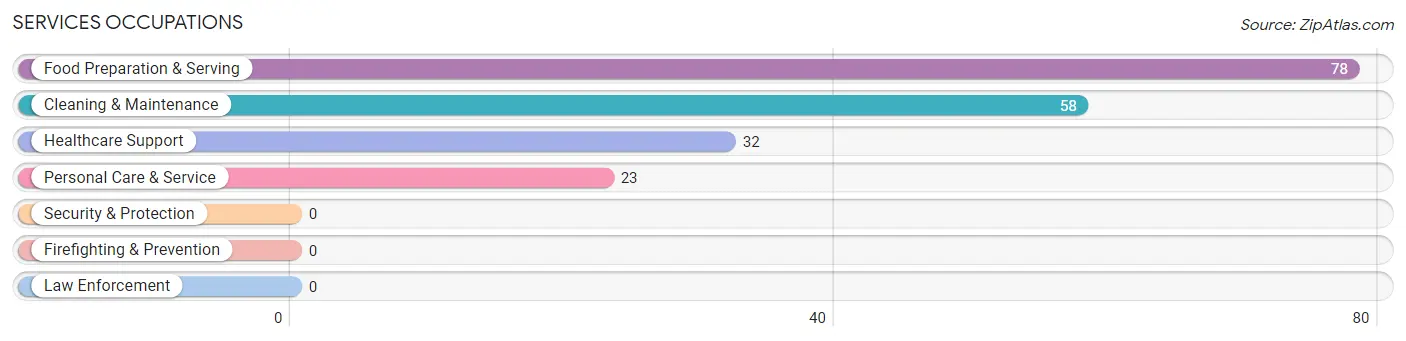
The most common Services occupations in Detroit Beach are Food Preparation & Serving (78 | 7.0%), Cleaning & Maintenance (58 | 5.2%), Healthcare Support (32 | 2.9%), and Personal Care & Service (23 | 2.1%).
Services Occupations by Sex
Within the Services occupations in Detroit Beach, the most male-oriented occupations are Cleaning & Maintenance (100.0%), and Food Preparation & Serving (55.1%), while the most female-oriented occupations are Healthcare Support (100.0%), Personal Care & Service (100.0%), and Food Preparation & Serving (44.9%).
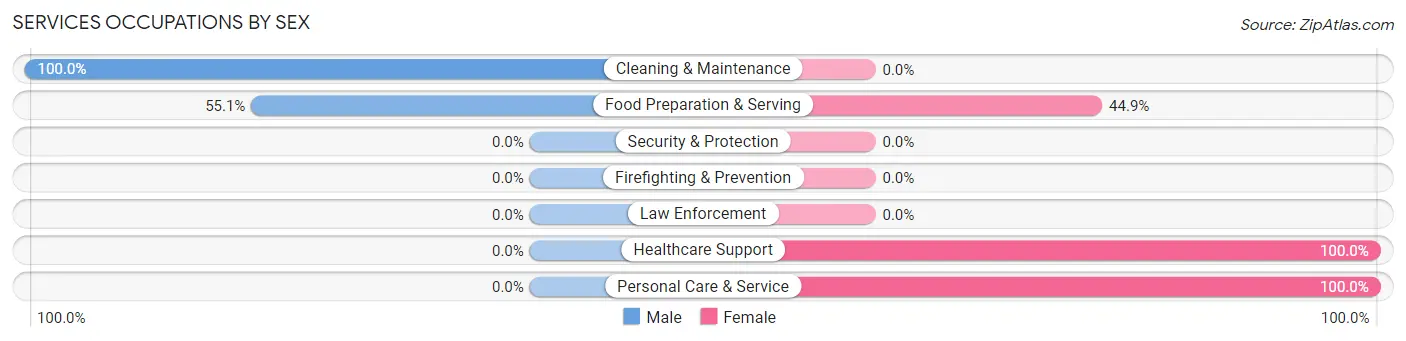
| Occupation | Male | Female |
| Healthcare Support | 0 (0.0%) | 32 (100.0%) |
| Security & Protection | 0 (0.0%) | 0 (0.0%) |
| Firefighting & Prevention | 0 (0.0%) | 0 (0.0%) |
| Law Enforcement | 0 (0.0%) | 0 (0.0%) |
| Food Preparation & Serving | 43 (55.1%) | 35 (44.9%) |
| Cleaning & Maintenance | 58 (100.0%) | 0 (0.0%) |
| Personal Care & Service | 0 (0.0%) | 23 (100.0%) |
| Total (Category) | 101 (52.9%) | 90 (47.1%) |
| Total (Overall) | 729 (65.4%) | 386 (34.6%) |
Sales and Office Occupations
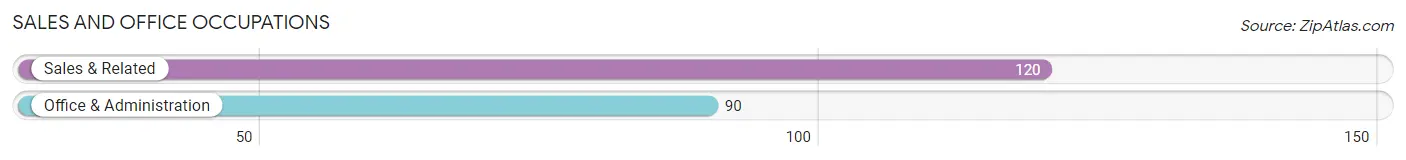
The most common Sales and Office occupations in Detroit Beach are Sales & Related (120 | 10.8%), and Office & Administration (90 | 8.1%).
Sales and Office Occupations by Sex
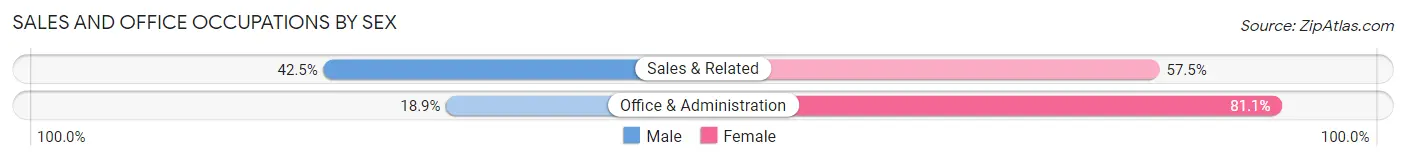
| Occupation | Male | Female |
| Sales & Related | 51 (42.5%) | 69 (57.5%) |
| Office & Administration | 17 (18.9%) | 73 (81.1%) |
| Total (Category) | 68 (32.4%) | 142 (67.6%) |
| Total (Overall) | 729 (65.4%) | 386 (34.6%) |
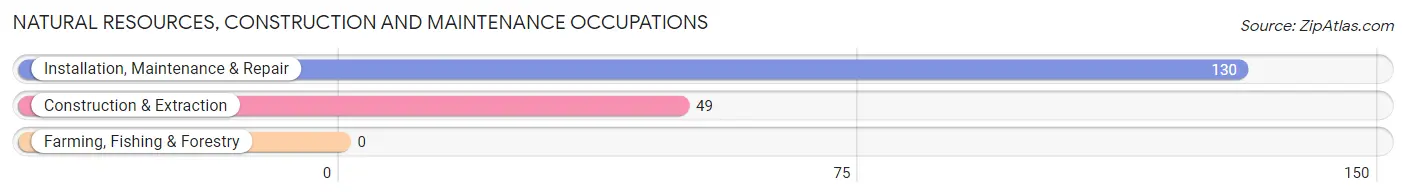
Natural Resources, Construction and Maintenance Occupations
The most common Natural Resources, Construction and Maintenance occupations in Detroit Beach are Installation, Maintenance & Repair (130 | 11.7%), and Construction & Extraction (49 | 4.4%).
Natural Resources, Construction and Maintenance Occupations by Sex
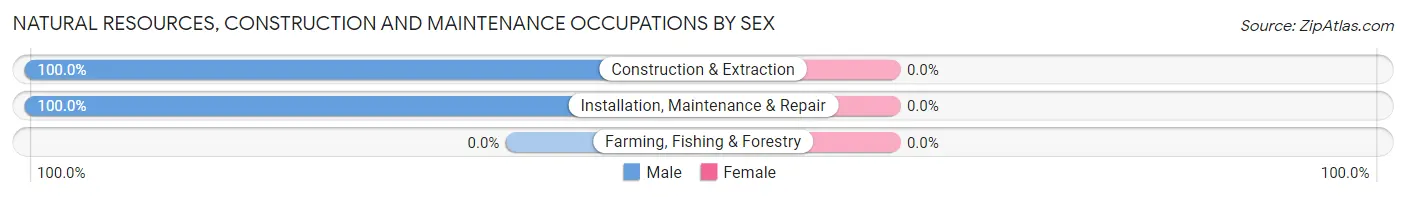
| Occupation | Male | Female |
| Farming, Fishing & Forestry | 0 (0.0%) | 0 (0.0%) |
| Construction & Extraction | 49 (100.0%) | 0 (0.0%) |
| Installation, Maintenance & Repair | 130 (100.0%) | 0 (0.0%) |
| Total (Category) | 179 (100.0%) | 0 (0.0%) |
| Total (Overall) | 729 (65.4%) | 386 (34.6%) |
Production, Transportation and Moving Occupations
The most common Production, Transportation and Moving occupations in Detroit Beach are Production (287 | 25.7%), Material Moving (99 | 8.9%), and Transportation (17 | 1.5%).
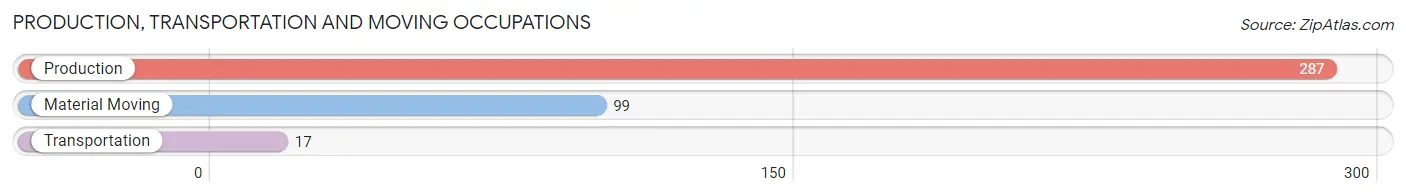
Production, Transportation and Moving Occupations by Sex
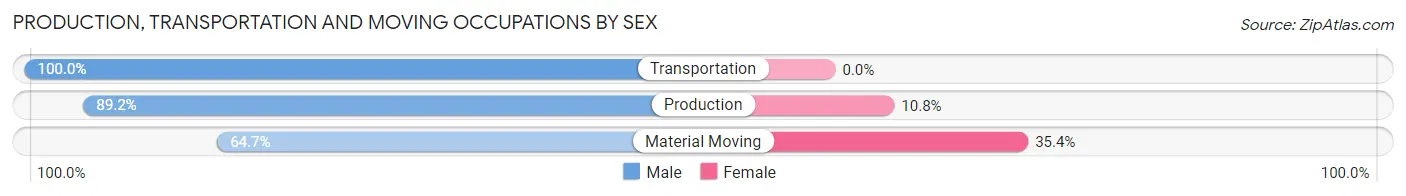
| Occupation | Male | Female |
| Production | 256 (89.2%) | 31 (10.8%) |
| Transportation | 17 (100.0%) | 0 (0.0%) |
| Material Moving | 64 (64.6%) | 35 (35.3%) |
| Total (Category) | 337 (83.6%) | 66 (16.4%) |
| Total (Overall) | 729 (65.4%) | 386 (34.6%) |
Employment Industries by Sex in Detroit Beach
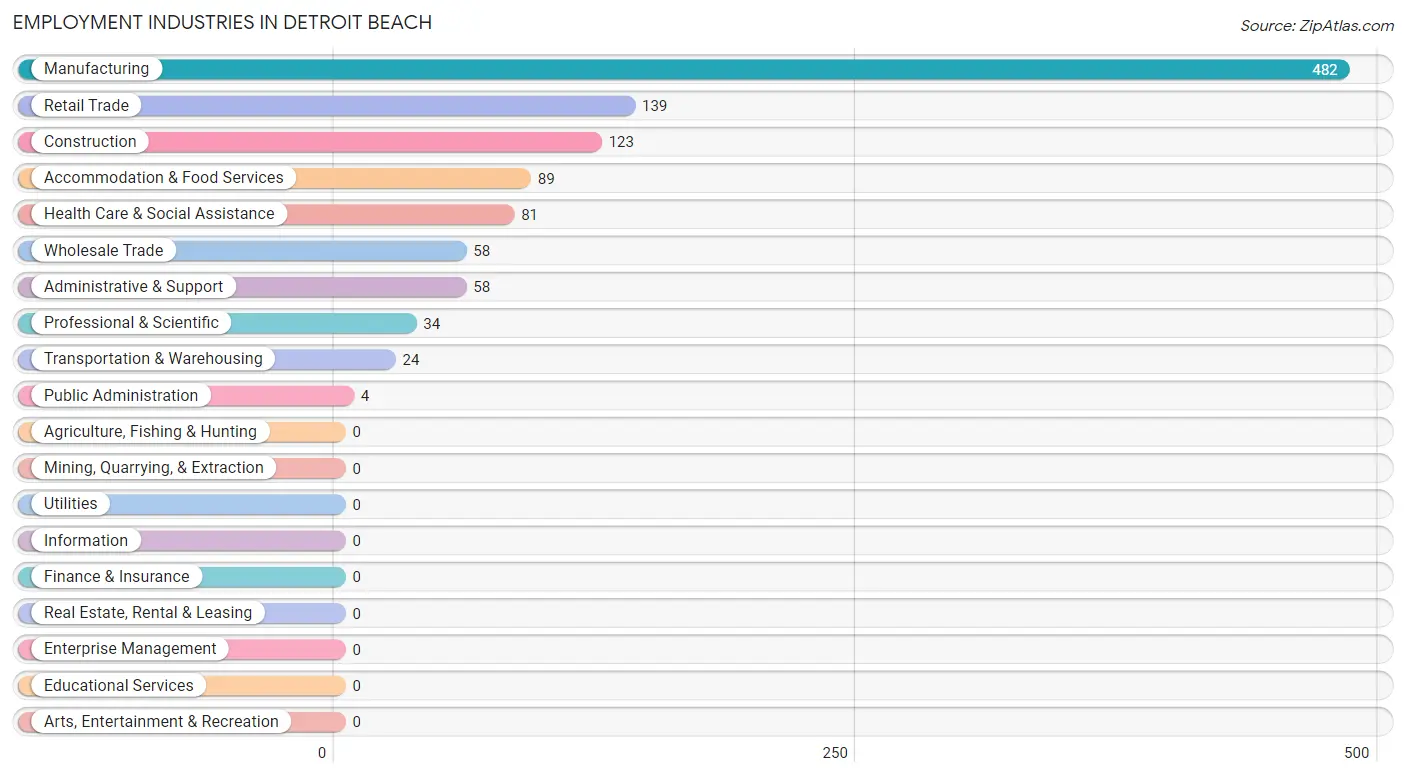
Employment Industries in Detroit Beach
The major employment industries in Detroit Beach include Manufacturing (482 | 43.2%), Retail Trade (139 | 12.5%), Construction (123 | 11.0%), Accommodation & Food Services (89 | 8.0%), and Health Care & Social Assistance (81 | 7.3%).
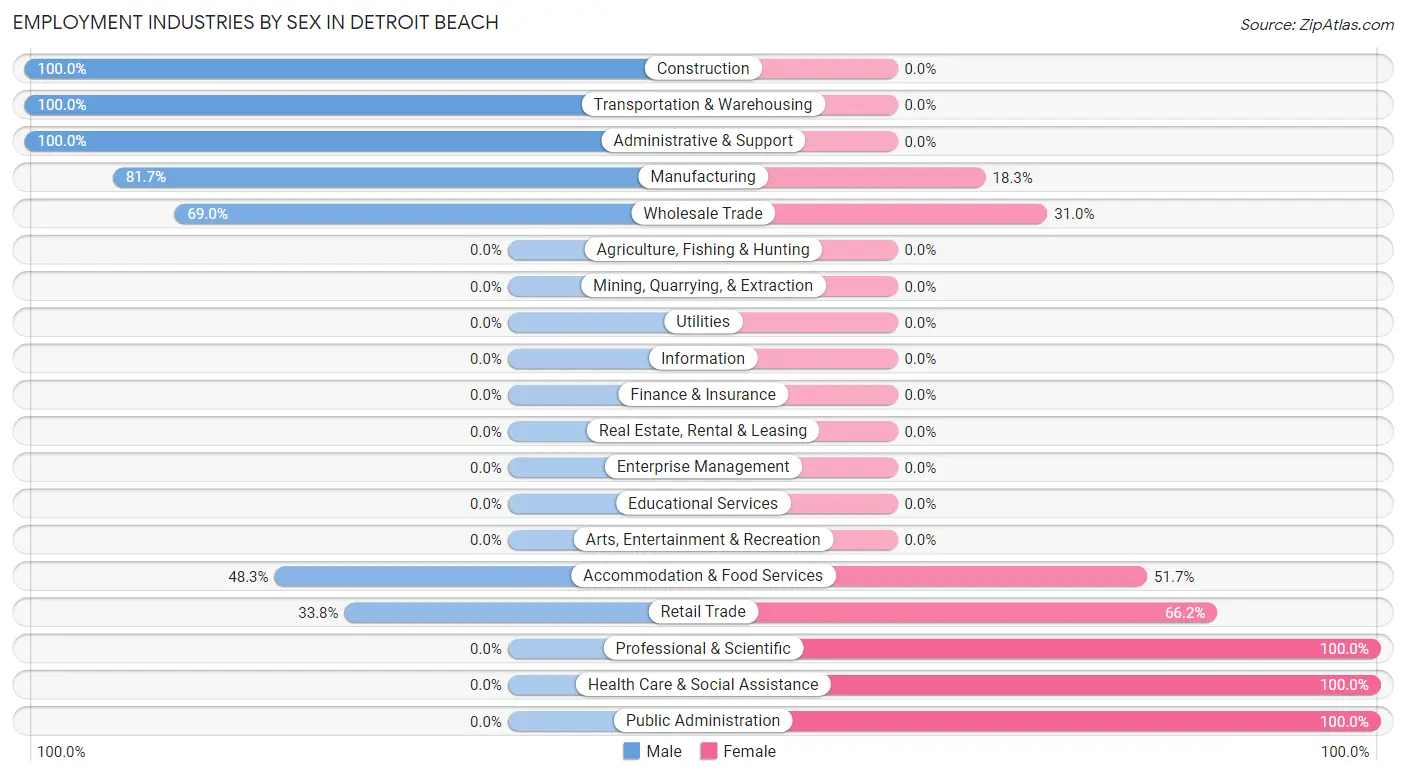
Employment Industries by Sex in Detroit Beach
The Detroit Beach industries that see more men than women are Construction (100.0%), Transportation & Warehousing (100.0%), and Administrative & Support (100.0%), whereas the industries that tend to have a higher number of women are Professional & Scientific (100.0%), Health Care & Social Assistance (100.0%), and Public Administration (100.0%).
| Industry | Male | Female |
| Agriculture, Fishing & Hunting | 0 (0.0%) | 0 (0.0%) |
| Mining, Quarrying, & Extraction | 0 (0.0%) | 0 (0.0%) |
| Construction | 123 (100.0%) | 0 (0.0%) |
| Manufacturing | 394 (81.7%) | 88 (18.3%) |
| Wholesale Trade | 40 (69.0%) | 18 (31.0%) |
| Retail Trade | 47 (33.8%) | 92 (66.2%) |
| Transportation & Warehousing | 24 (100.0%) | 0 (0.0%) |
| Utilities | 0 (0.0%) | 0 (0.0%) |
| Information | 0 (0.0%) | 0 (0.0%) |
| Finance & Insurance | 0 (0.0%) | 0 (0.0%) |
| Real Estate, Rental & Leasing | 0 (0.0%) | 0 (0.0%) |
| Professional & Scientific | 0 (0.0%) | 34 (100.0%) |
| Enterprise Management | 0 (0.0%) | 0 (0.0%) |
| Administrative & Support | 58 (100.0%) | 0 (0.0%) |
| Educational Services | 0 (0.0%) | 0 (0.0%) |
| Health Care & Social Assistance | 0 (0.0%) | 81 (100.0%) |
| Arts, Entertainment & Recreation | 0 (0.0%) | 0 (0.0%) |
| Accommodation & Food Services | 43 (48.3%) | 46 (51.7%) |
| Public Administration | 0 (0.0%) | 4 (100.0%) |
| Total | 729 (65.4%) | 386 (34.6%) |
Education in Detroit Beach
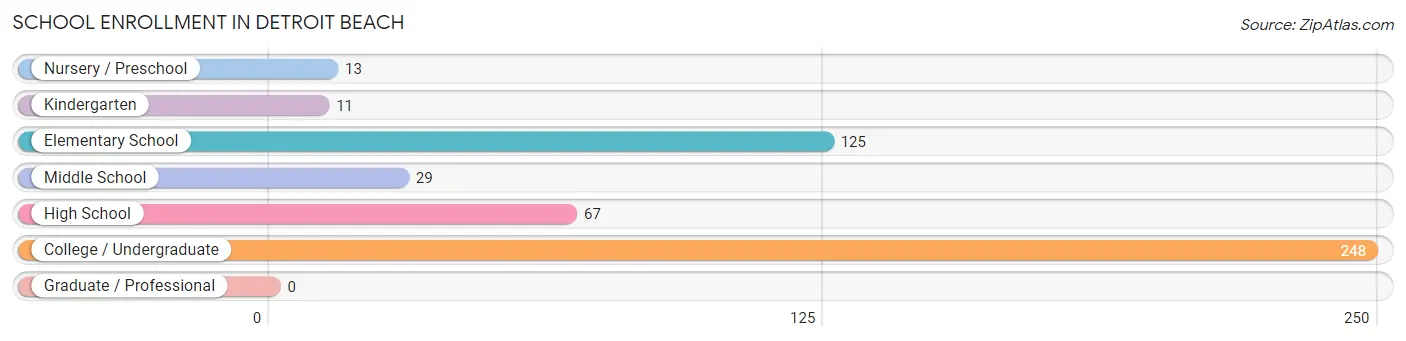
School Enrollment in Detroit Beach
The most common levels of schooling among the 493 students in Detroit Beach are college / undergraduate (248 | 50.3%), elementary school (125 | 25.4%), and high school (67 | 13.6%).
| School Level | # Students | % Students |
| Nursery / Preschool | 13 | 2.6% |
| Kindergarten | 11 | 2.2% |
| Elementary School | 125 | 25.4% |
| Middle School | 29 | 5.9% |
| High School | 67 | 13.6% |
| College / Undergraduate | 248 | 50.3% |
| Graduate / Professional | 0 | 0.0% |
| Total | 493 | 100.0% |
School Enrollment by Age by Funding Source in Detroit Beach
Out of a total of 493 students who are enrolled in schools in Detroit Beach, 44 (8.9%) attend a private institution, while the remaining 449 (91.1%) are enrolled in public schools. The age group of 5 to 9 year old has the highest likelihood of being enrolled in private schools, with 27 (23.3% in the age bracket) enrolled. Conversely, the age group of 10 to 14 year olds has the lowest likelihood of being enrolled in a private school, with 62 (100.0% in the age bracket) attending a public institution.
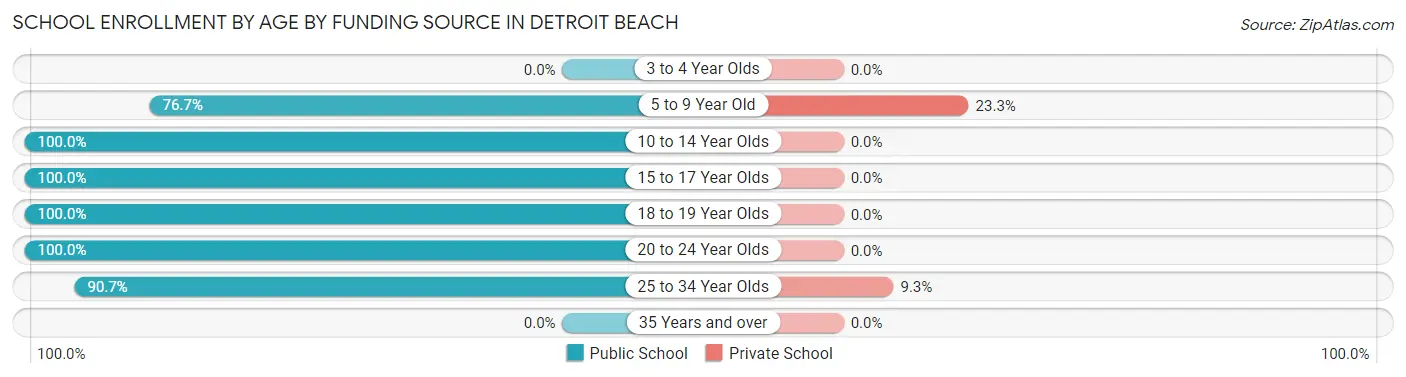
| Age Bracket | Public School | Private School |
| 3 to 4 Year Olds | 0 (0.0%) | 0 (0.0%) |
| 5 to 9 Year Old | 89 (76.7%) | 27 (23.3%) |
| 10 to 14 Year Olds | 62 (100.0%) | 0 (0.0%) |
| 15 to 17 Year Olds | 21 (100.0%) | 0 (0.0%) |
| 18 to 19 Year Olds | 63 (100.0%) | 0 (0.0%) |
| 20 to 24 Year Olds | 48 (100.0%) | 0 (0.0%) |
| 25 to 34 Year Olds | 166 (90.7%) | 17 (9.3%) |
| 35 Years and over | 0 (0.0%) | 0 (0.0%) |
| Total | 449 (91.1%) | 44 (8.9%) |
Educational Attainment by Field of Study in Detroit Beach
Visual & performing arts (44 | 35.2%), business (43 | 34.4%), literature & languages (18 | 14.4%), engineering (11 | 8.8%), and computers & mathematics (3 | 2.4%) are the most common fields of study among 125 individuals in Detroit Beach who have obtained a bachelor's degree or higher.
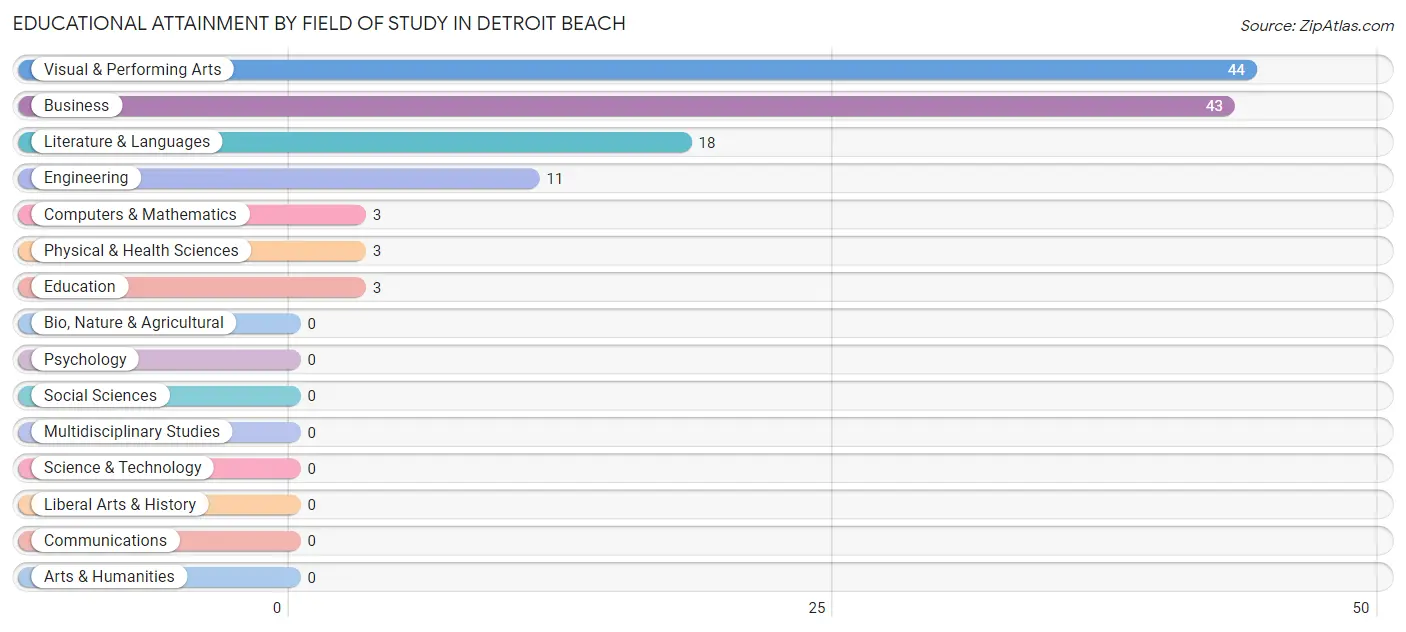
| Field of Study | # Graduates | % Graduates |
| Computers & Mathematics | 3 | 2.4% |
| Bio, Nature & Agricultural | 0 | 0.0% |
| Physical & Health Sciences | 3 | 2.4% |
| Psychology | 0 | 0.0% |
| Social Sciences | 0 | 0.0% |
| Engineering | 11 | 8.8% |
| Multidisciplinary Studies | 0 | 0.0% |
| Science & Technology | 0 | 0.0% |
| Business | 43 | 34.4% |
| Education | 3 | 2.4% |
| Literature & Languages | 18 | 14.4% |
| Liberal Arts & History | 0 | 0.0% |
| Visual & Performing Arts | 44 | 35.2% |
| Communications | 0 | 0.0% |
| Arts & Humanities | 0 | 0.0% |
| Total | 125 | 100.0% |
Transportation & Commute in Detroit Beach
Vehicle Availability by Sex in Detroit Beach
The most prevalent vehicle ownership categories in Detroit Beach are males with 2 vehicles (423, accounting for 58.0%) and females with 2 vehicles (220, making up 109.6%).
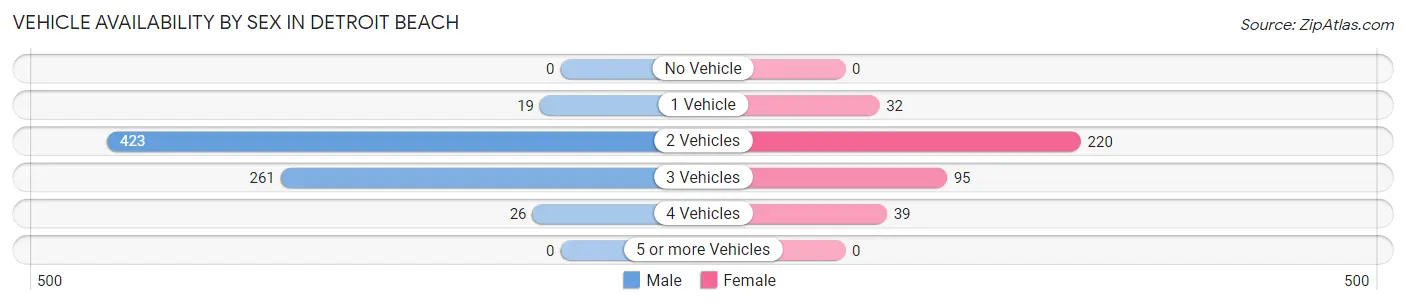
| Vehicles Available | Male | Female |
| No Vehicle | 0 (0.0%) | 0 (0.0%) |
| 1 Vehicle | 19 (2.6%) | 32 (8.3%) |
| 2 Vehicles | 423 (58.0%) | 220 (57.0%) |
| 3 Vehicles | 261 (35.8%) | 95 (24.6%) |
| 4 Vehicles | 26 (3.6%) | 39 (10.1%) |
| 5 or more Vehicles | 0 (0.0%) | 0 (0.0%) |
| Total | 729 (100.0%) | 386 (100.0%) |
Commute Time in Detroit Beach
The most frequently occuring commute durations in Detroit Beach are 45 to 59 minutes (274 commuters, 24.7%), 10 to 14 minutes (259 commuters, 23.3%), and 15 to 19 minutes (157 commuters, 14.1%).
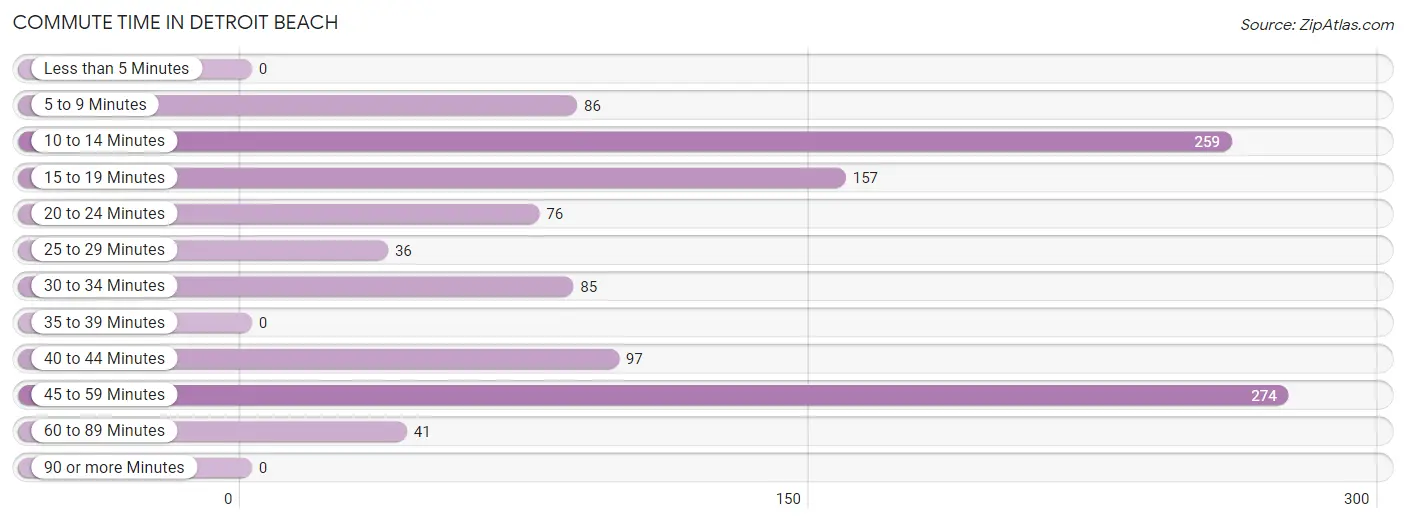
| Commute Time | # Commuters | % Commuters |
| Less than 5 Minutes | 0 | 0.0% |
| 5 to 9 Minutes | 86 | 7.7% |
| 10 to 14 Minutes | 259 | 23.3% |
| 15 to 19 Minutes | 157 | 14.1% |
| 20 to 24 Minutes | 76 | 6.8% |
| 25 to 29 Minutes | 36 | 3.2% |
| 30 to 34 Minutes | 85 | 7.6% |
| 35 to 39 Minutes | 0 | 0.0% |
| 40 to 44 Minutes | 97 | 8.7% |
| 45 to 59 Minutes | 274 | 24.7% |
| 60 to 89 Minutes | 41 | 3.7% |
| 90 or more Minutes | 0 | 0.0% |
Commute Time by Sex in Detroit Beach
The most common commute times in Detroit Beach are 45 to 59 minutes (221 commuters, 30.3%) for males and 15 to 19 minutes (98 commuters, 25.7%) for females.
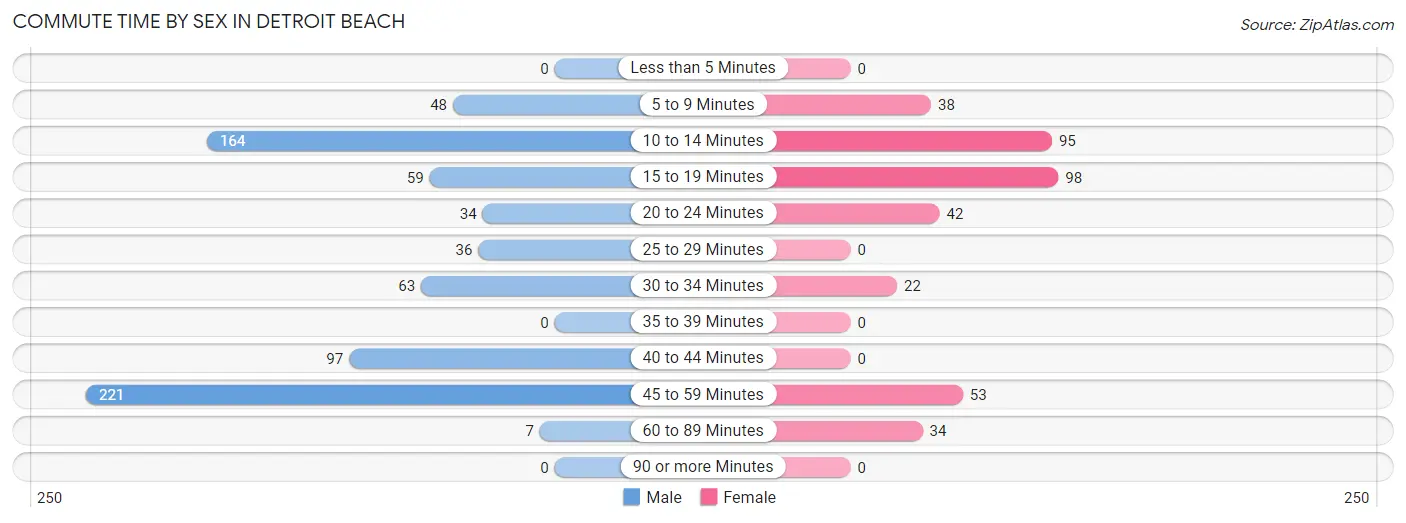
| Commute Time | Male | Female |
| Less than 5 Minutes | 0 (0.0%) | 0 (0.0%) |
| 5 to 9 Minutes | 48 (6.6%) | 38 (10.0%) |
| 10 to 14 Minutes | 164 (22.5%) | 95 (24.9%) |
| 15 to 19 Minutes | 59 (8.1%) | 98 (25.7%) |
| 20 to 24 Minutes | 34 (4.7%) | 42 (11.0%) |
| 25 to 29 Minutes | 36 (4.9%) | 0 (0.0%) |
| 30 to 34 Minutes | 63 (8.6%) | 22 (5.8%) |
| 35 to 39 Minutes | 0 (0.0%) | 0 (0.0%) |
| 40 to 44 Minutes | 97 (13.3%) | 0 (0.0%) |
| 45 to 59 Minutes | 221 (30.3%) | 53 (13.9%) |
| 60 to 89 Minutes | 7 (1.0%) | 34 (8.9%) |
| 90 or more Minutes | 0 (0.0%) | 0 (0.0%) |
Time of Departure to Work by Sex in Detroit Beach
The most frequent times of departure to work in Detroit Beach are 12:00 AM to 4:59 AM (149, 20.4%) for males and 12:00 AM to 4:59 AM (69, 18.1%) for females.
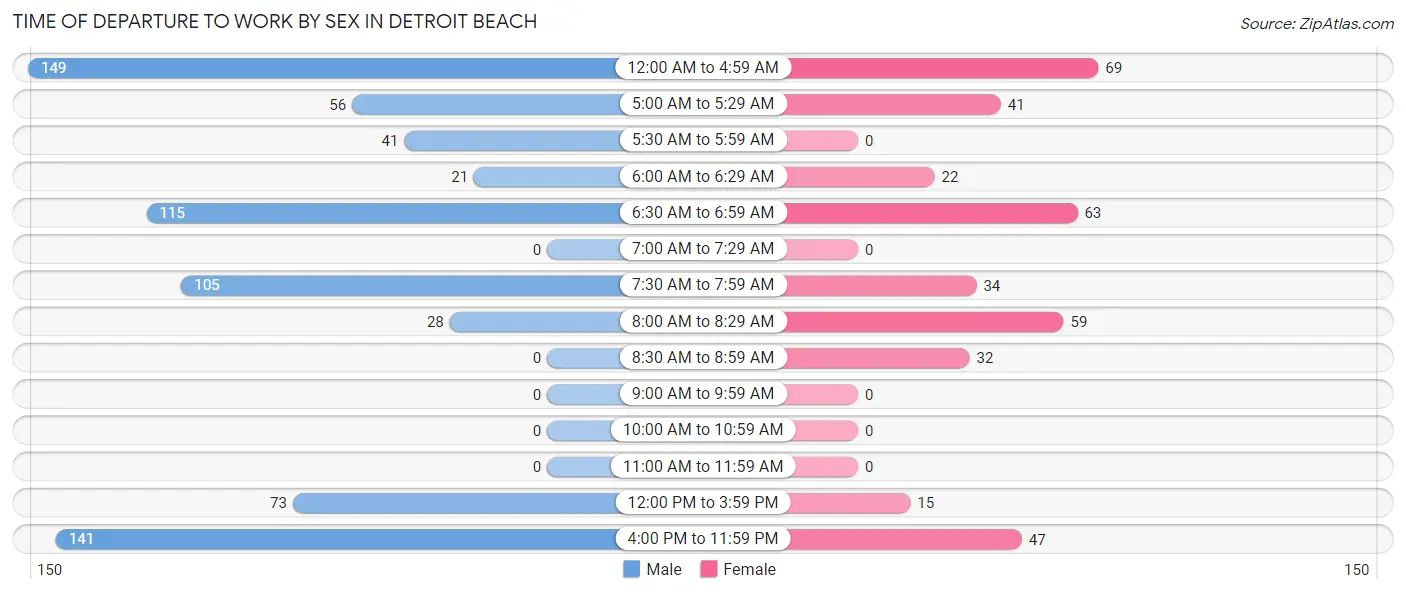
| Time of Departure | Male | Female |
| 12:00 AM to 4:59 AM | 149 (20.4%) | 69 (18.1%) |
| 5:00 AM to 5:29 AM | 56 (7.7%) | 41 (10.7%) |
| 5:30 AM to 5:59 AM | 41 (5.6%) | 0 (0.0%) |
| 6:00 AM to 6:29 AM | 21 (2.9%) | 22 (5.8%) |
| 6:30 AM to 6:59 AM | 115 (15.8%) | 63 (16.5%) |
| 7:00 AM to 7:29 AM | 0 (0.0%) | 0 (0.0%) |
| 7:30 AM to 7:59 AM | 105 (14.4%) | 34 (8.9%) |
| 8:00 AM to 8:29 AM | 28 (3.8%) | 59 (15.4%) |
| 8:30 AM to 8:59 AM | 0 (0.0%) | 32 (8.4%) |
| 9:00 AM to 9:59 AM | 0 (0.0%) | 0 (0.0%) |
| 10:00 AM to 10:59 AM | 0 (0.0%) | 0 (0.0%) |
| 11:00 AM to 11:59 AM | 0 (0.0%) | 0 (0.0%) |
| 12:00 PM to 3:59 PM | 73 (10.0%) | 15 (3.9%) |
| 4:00 PM to 11:59 PM | 141 (19.3%) | 47 (12.3%) |
| Total | 729 (100.0%) | 382 (100.0%) |
Housing Occupancy in Detroit Beach
Occupancy by Ownership in Detroit Beach
Of the total 844 dwellings in Detroit Beach, owner-occupied units account for 749 (88.7%), while renter-occupied units make up 95 (11.3%).
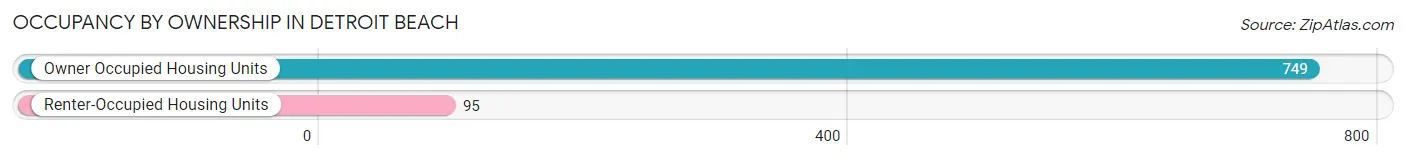
| Occupancy | # Housing Units | % Housing Units |
| Owner Occupied Housing Units | 749 | 88.7% |
| Renter-Occupied Housing Units | 95 | 11.3% |
| Total Occupied Housing Units | 844 | 100.0% |
Occupancy by Household Size in Detroit Beach
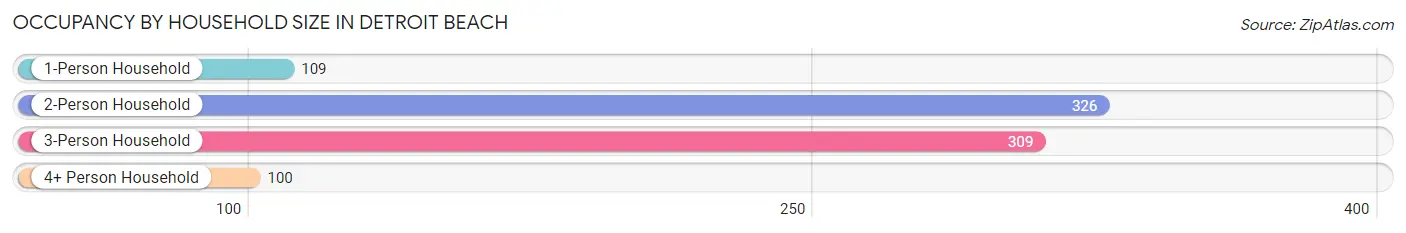
| Household Size | # Housing Units | % Housing Units |
| 1-Person Household | 109 | 12.9% |
| 2-Person Household | 326 | 38.6% |
| 3-Person Household | 309 | 36.6% |
| 4+ Person Household | 100 | 11.8% |
| Total Housing Units | 844 | 100.0% |
Occupancy by Ownership by Household Size in Detroit Beach
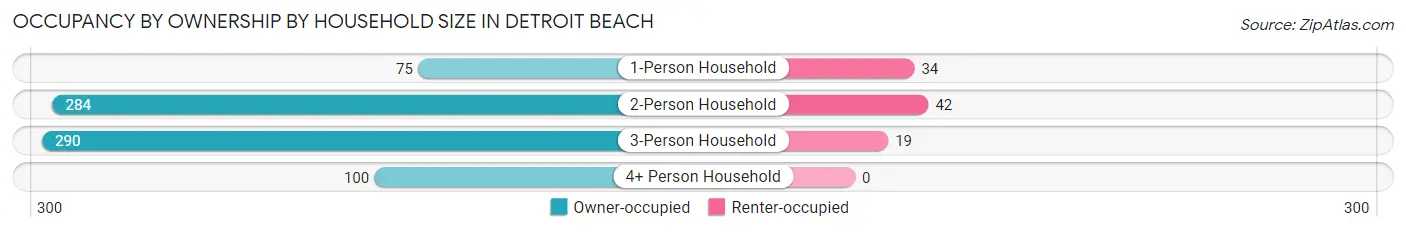
| Household Size | Owner-occupied | Renter-occupied |
| 1-Person Household | 75 (68.8%) | 34 (31.2%) |
| 2-Person Household | 284 (87.1%) | 42 (12.9%) |
| 3-Person Household | 290 (93.9%) | 19 (6.1%) |
| 4+ Person Household | 100 (100.0%) | 0 (0.0%) |
| Total Housing Units | 749 (88.7%) | 95 (11.3%) |
Occupancy by Educational Attainment in Detroit Beach
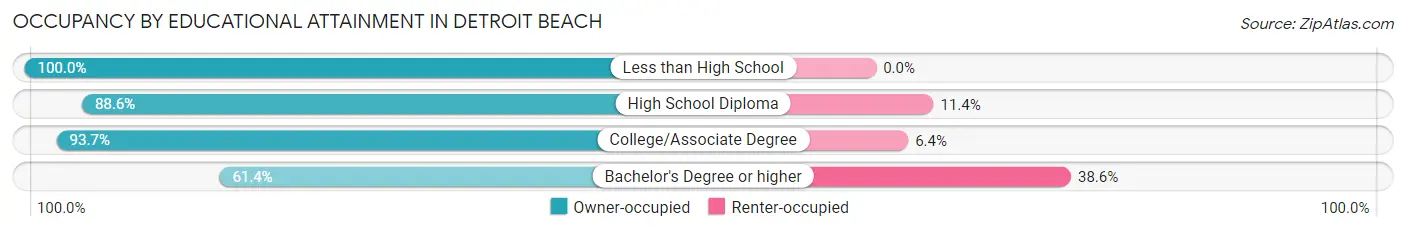
| Household Size | Owner-occupied | Renter-occupied |
| Less than High School | 25 (100.0%) | 0 (0.0%) |
| High School Diploma | 257 (88.6%) | 33 (11.4%) |
| College/Associate Degree | 413 (93.6%) | 28 (6.4%) |
| Bachelor's Degree or higher | 54 (61.4%) | 34 (38.6%) |
Occupancy by Age of Householder in Detroit Beach
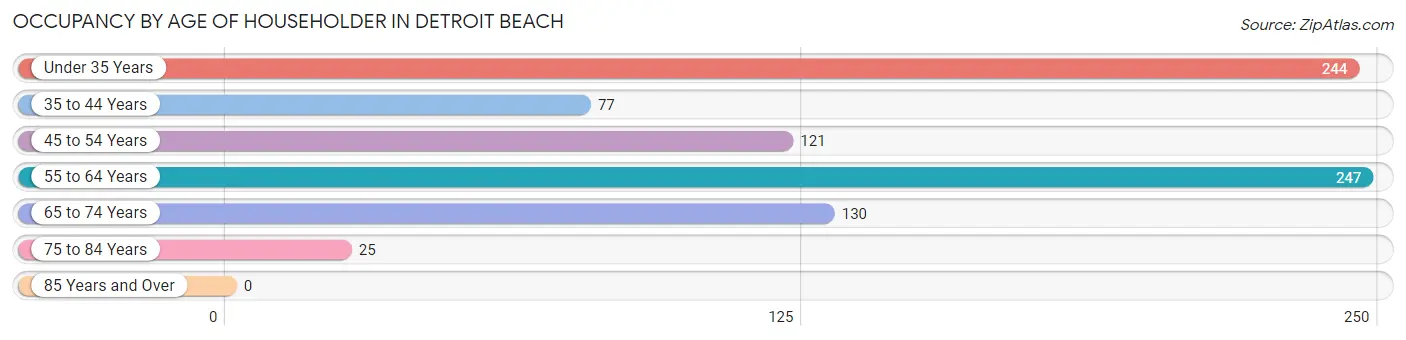
| Age Bracket | # Households | % Households |
| Under 35 Years | 244 | 28.9% |
| 35 to 44 Years | 77 | 9.1% |
| 45 to 54 Years | 121 | 14.3% |
| 55 to 64 Years | 247 | 29.3% |
| 65 to 74 Years | 130 | 15.4% |
| 75 to 84 Years | 25 | 3.0% |
| 85 Years and Over | 0 | 0.0% |
| Total | 844 | 100.0% |
Housing Finances in Detroit Beach
Median Income by Occupancy in Detroit Beach
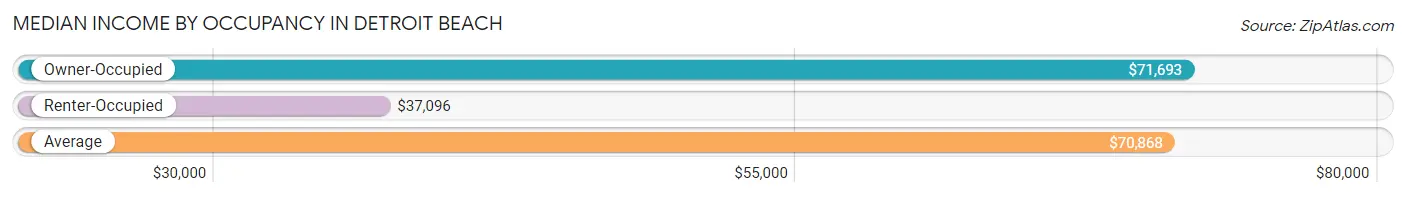
| Occupancy Type | # Households | Median Income |
| Owner-Occupied | 749 (88.7%) | $71,693 |
| Renter-Occupied | 95 (11.3%) | $37,096 |
| Average | 844 (100.0%) | $70,868 |
Occupancy by Householder Income Bracket in Detroit Beach
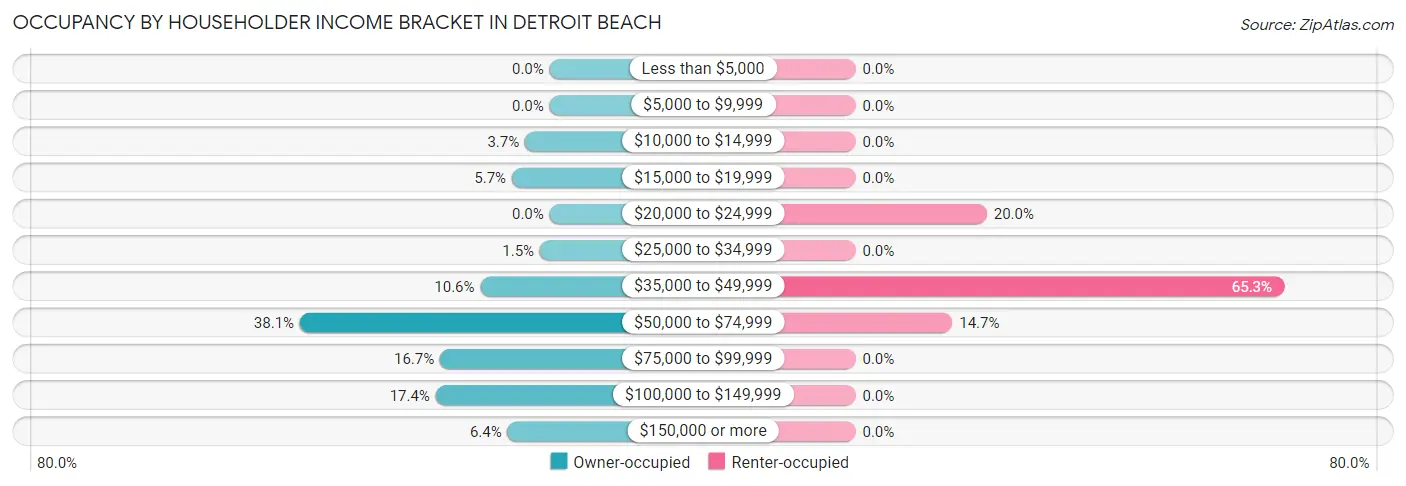
| Income Bracket | Owner-occupied | Renter-occupied |
| Less than $5,000 | 0 (0.0%) | 0 (0.0%) |
| $5,000 to $9,999 | 0 (0.0%) | 0 (0.0%) |
| $10,000 to $14,999 | 28 (3.7%) | 0 (0.0%) |
| $15,000 to $19,999 | 43 (5.7%) | 0 (0.0%) |
| $20,000 to $24,999 | 0 (0.0%) | 19 (20.0%) |
| $25,000 to $34,999 | 11 (1.5%) | 0 (0.0%) |
| $35,000 to $49,999 | 79 (10.5%) | 62 (65.3%) |
| $50,000 to $74,999 | 285 (38.1%) | 14 (14.7%) |
| $75,000 to $99,999 | 125 (16.7%) | 0 (0.0%) |
| $100,000 to $149,999 | 130 (17.4%) | 0 (0.0%) |
| $150,000 or more | 48 (6.4%) | 0 (0.0%) |
| Total | 749 (100.0%) | 95 (100.0%) |
Monthly Housing Cost Tiers in Detroit Beach
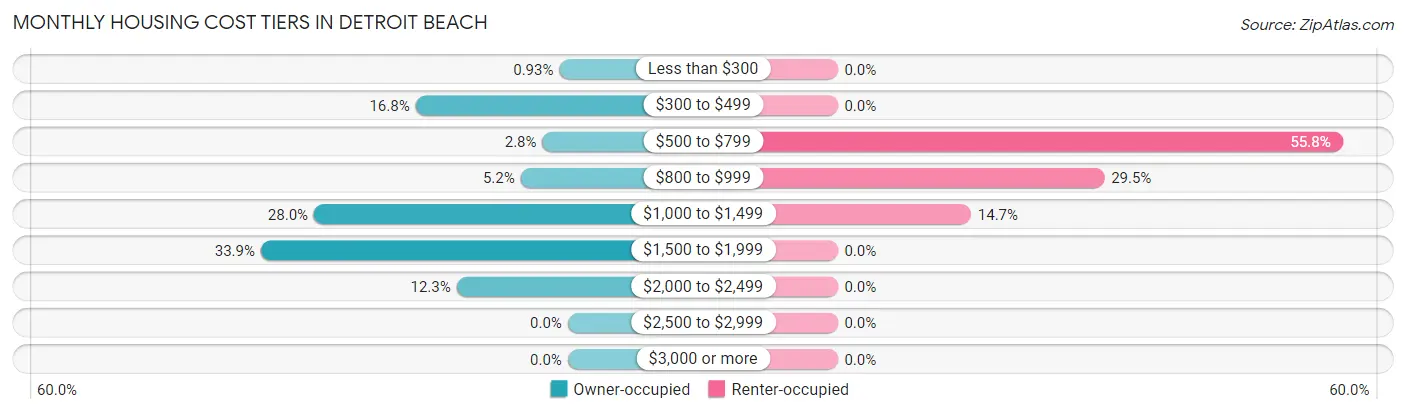
| Monthly Cost | Owner-occupied | Renter-occupied |
| Less than $300 | 7 (0.9%) | 0 (0.0%) |
| $300 to $499 | 126 (16.8%) | 0 (0.0%) |
| $500 to $799 | 21 (2.8%) | 53 (55.8%) |
| $800 to $999 | 39 (5.2%) | 28 (29.5%) |
| $1,000 to $1,499 | 210 (28.0%) | 14 (14.7%) |
| $1,500 to $1,999 | 254 (33.9%) | 0 (0.0%) |
| $2,000 to $2,499 | 92 (12.3%) | 0 (0.0%) |
| $2,500 to $2,999 | 0 (0.0%) | 0 (0.0%) |
| $3,000 or more | 0 (0.0%) | 0 (0.0%) |
| Total | 749 (100.0%) | 95 (100.0%) |
Physical Housing Characteristics in Detroit Beach
Housing Structures in Detroit Beach
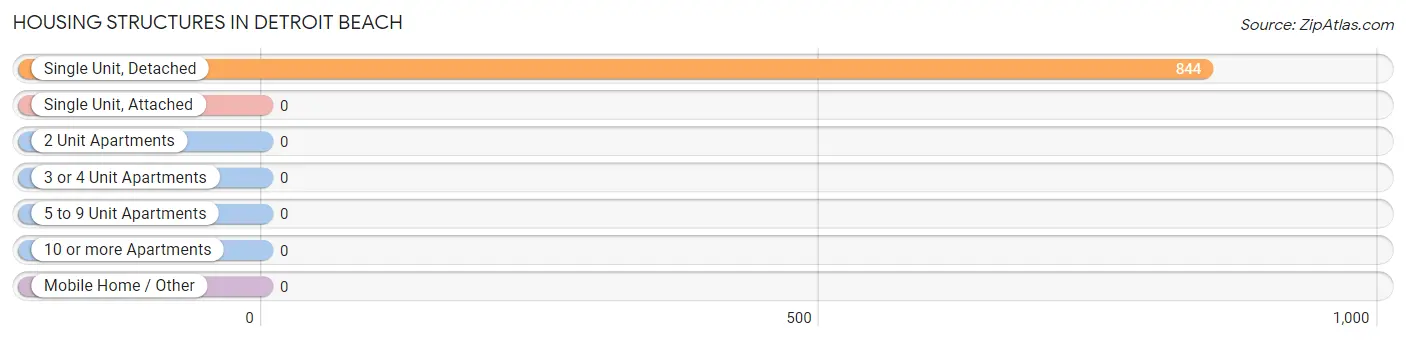
| Structure Type | # Housing Units | % Housing Units |
| Single Unit, Detached | 844 | 100.0% |
| Single Unit, Attached | 0 | 0.0% |
| 2 Unit Apartments | 0 | 0.0% |
| 3 or 4 Unit Apartments | 0 | 0.0% |
| 5 to 9 Unit Apartments | 0 | 0.0% |
| 10 or more Apartments | 0 | 0.0% |
| Mobile Home / Other | 0 | 0.0% |
| Total | 844 | 100.0% |
Housing Structures by Occupancy in Detroit Beach
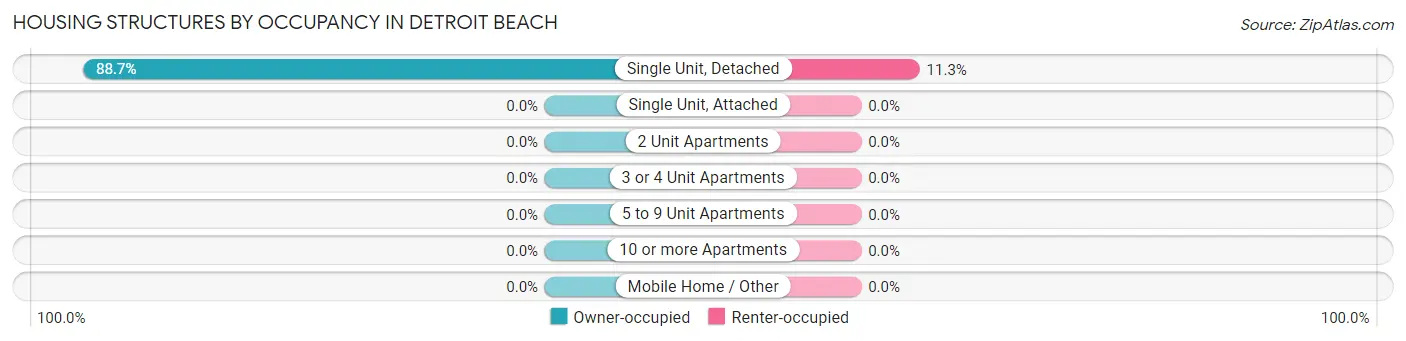
| Structure Type | Owner-occupied | Renter-occupied |
| Single Unit, Detached | 749 (88.7%) | 95 (11.3%) |
| Single Unit, Attached | 0 (0.0%) | 0 (0.0%) |
| 2 Unit Apartments | 0 (0.0%) | 0 (0.0%) |
| 3 or 4 Unit Apartments | 0 (0.0%) | 0 (0.0%) |
| 5 to 9 Unit Apartments | 0 (0.0%) | 0 (0.0%) |
| 10 or more Apartments | 0 (0.0%) | 0 (0.0%) |
| Mobile Home / Other | 0 (0.0%) | 0 (0.0%) |
| Total | 749 (88.7%) | 95 (11.3%) |
Housing Structures by Number of Rooms in Detroit Beach
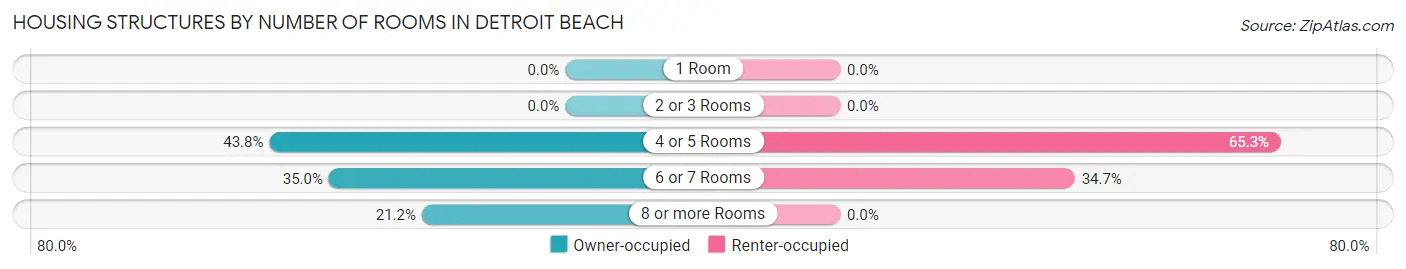
| Number of Rooms | Owner-occupied | Renter-occupied |
| 1 Room | 0 (0.0%) | 0 (0.0%) |
| 2 or 3 Rooms | 0 (0.0%) | 0 (0.0%) |
| 4 or 5 Rooms | 328 (43.8%) | 62 (65.3%) |
| 6 or 7 Rooms | 262 (35.0%) | 33 (34.7%) |
| 8 or more Rooms | 159 (21.2%) | 0 (0.0%) |
| Total | 749 (100.0%) | 95 (100.0%) |
Housing Structure by Heating Type in Detroit Beach
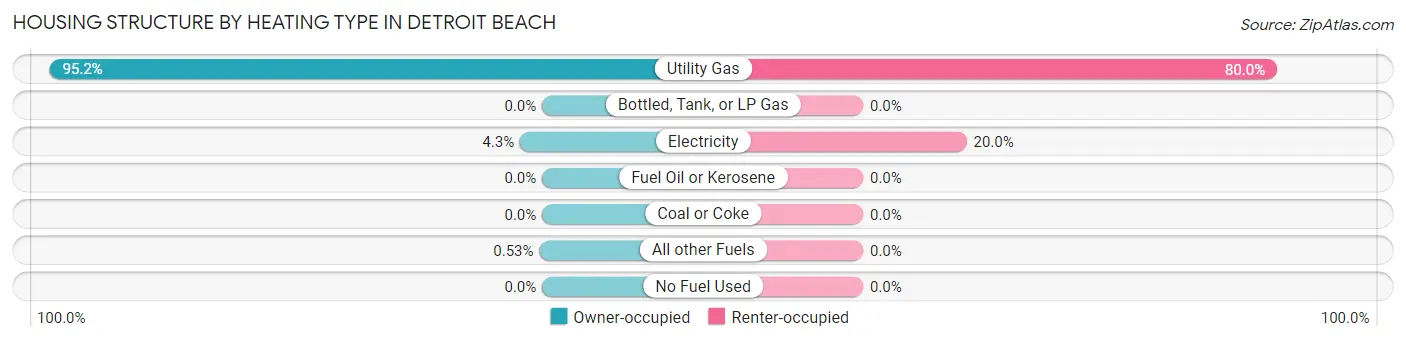
| Heating Type | Owner-occupied | Renter-occupied |
| Utility Gas | 713 (95.2%) | 76 (80.0%) |
| Bottled, Tank, or LP Gas | 0 (0.0%) | 0 (0.0%) |
| Electricity | 32 (4.3%) | 19 (20.0%) |
| Fuel Oil or Kerosene | 0 (0.0%) | 0 (0.0%) |
| Coal or Coke | 0 (0.0%) | 0 (0.0%) |
| All other Fuels | 4 (0.5%) | 0 (0.0%) |
| No Fuel Used | 0 (0.0%) | 0 (0.0%) |
| Total | 749 (100.0%) | 95 (100.0%) |
Household Vehicle Usage in Detroit Beach
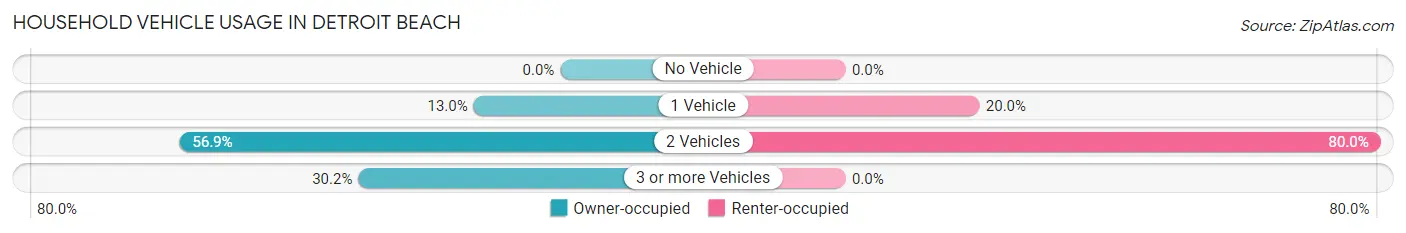
| Vehicles per Household | Owner-occupied | Renter-occupied |
| No Vehicle | 0 (0.0%) | 0 (0.0%) |
| 1 Vehicle | 97 (13.0%) | 19 (20.0%) |
| 2 Vehicles | 426 (56.9%) | 76 (80.0%) |
| 3 or more Vehicles | 226 (30.2%) | 0 (0.0%) |
| Total | 749 (100.0%) | 95 (100.0%) |
Real Estate & Mortgages in Detroit Beach
Real Estate and Mortgage Overview in Detroit Beach
| Characteristic | Without Mortgage | With Mortgage |
| Housing Units | 137 | 612 |
| Median Property Value | $102,400 | $139,600 |
| Median Household Income | - | - |
| Monthly Housing Costs | $414 | $0 |
| Real Estate Taxes | $1,439 | $57 |
Property Value by Mortgage Status in Detroit Beach
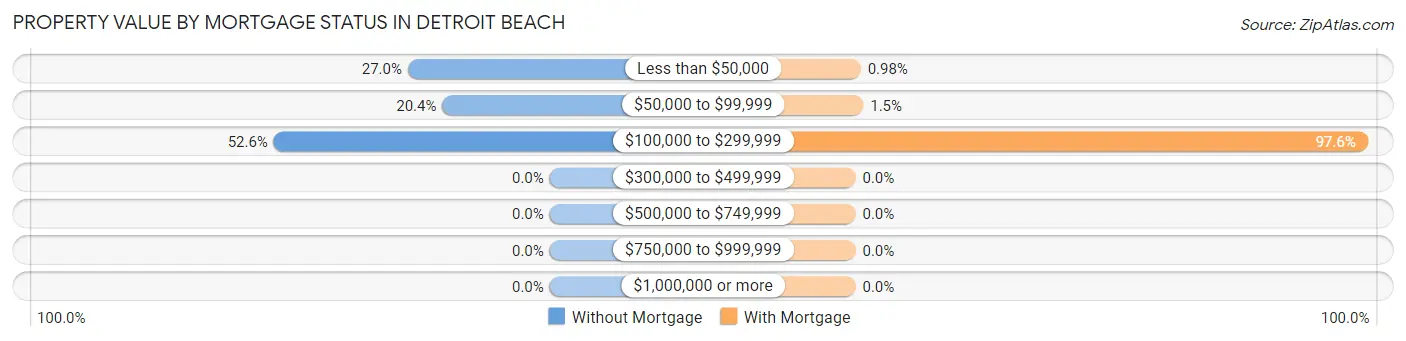
| Property Value | Without Mortgage | With Mortgage |
| Less than $50,000 | 37 (27.0%) | 6 (1.0%) |
| $50,000 to $99,999 | 28 (20.4%) | 9 (1.5%) |
| $100,000 to $299,999 | 72 (52.5%) | 597 (97.6%) |
| $300,000 to $499,999 | 0 (0.0%) | 0 (0.0%) |
| $500,000 to $749,999 | 0 (0.0%) | 0 (0.0%) |
| $750,000 to $999,999 | 0 (0.0%) | 0 (0.0%) |
| $1,000,000 or more | 0 (0.0%) | 0 (0.0%) |
| Total | 137 (100.0%) | 612 (100.0%) |
Household Income by Mortgage Status in Detroit Beach
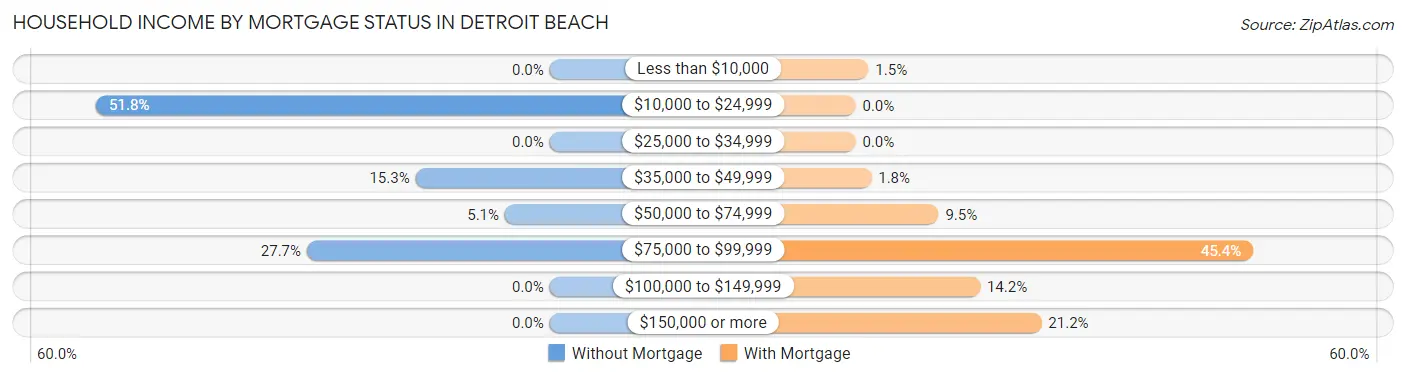
| Household Income | Without Mortgage | With Mortgage |
| Less than $10,000 | 0 (0.0%) | 9 (1.5%) |
| $10,000 to $24,999 | 71 (51.8%) | 0 (0.0%) |
| $25,000 to $34,999 | 0 (0.0%) | 0 (0.0%) |
| $35,000 to $49,999 | 21 (15.3%) | 11 (1.8%) |
| $50,000 to $74,999 | 7 (5.1%) | 58 (9.5%) |
| $75,000 to $99,999 | 38 (27.7%) | 278 (45.4%) |
| $100,000 to $149,999 | 0 (0.0%) | 87 (14.2%) |
| $150,000 or more | 0 (0.0%) | 130 (21.2%) |
| Total | 137 (100.0%) | 612 (100.0%) |
Property Value to Household Income Ratio in Detroit Beach
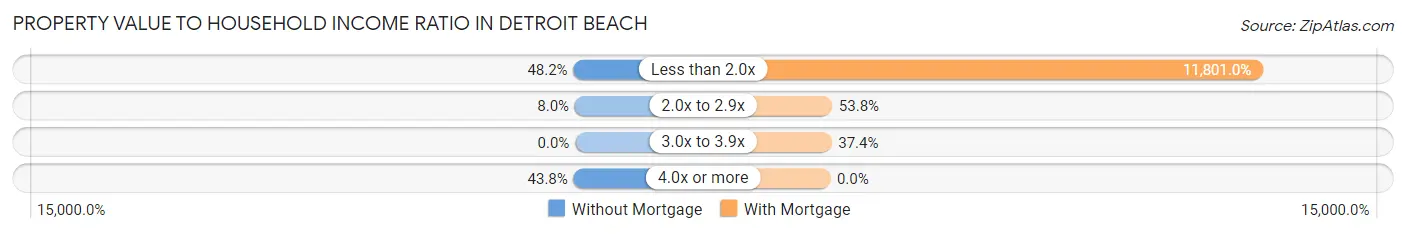
| Value-to-Income Ratio | Without Mortgage | With Mortgage |
| Less than 2.0x | 66 (48.2%) | 72,222 (11,801.0%) |
| 2.0x to 2.9x | 11 (8.0%) | 329 (53.8%) |
| 3.0x to 3.9x | 0 (0.0%) | 229 (37.4%) |
| 4.0x or more | 60 (43.8%) | 0 (0.0%) |
| Total | 137 (100.0%) | 612 (100.0%) |
Real Estate Taxes by Mortgage Status in Detroit Beach
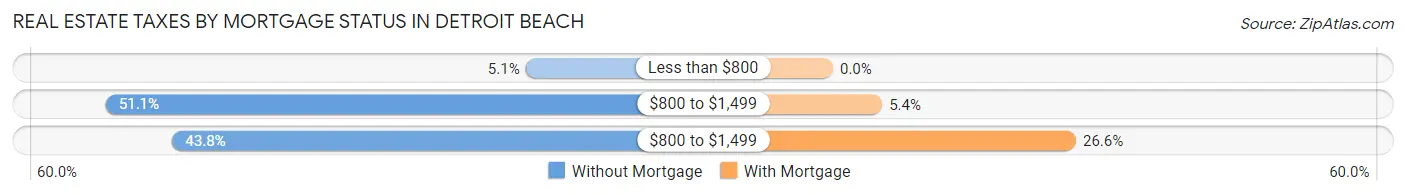
| Property Taxes | Without Mortgage | With Mortgage |
| Less than $800 | 7 (5.1%) | 0 (0.0%) |
| $800 to $1,499 | 70 (51.1%) | 33 (5.4%) |
| $800 to $1,499 | 60 (43.8%) | 163 (26.6%) |
| Total | 137 (100.0%) | 612 (100.0%) |
Health & Disability in Detroit Beach
Health Insurance Coverage by Age in Detroit Beach
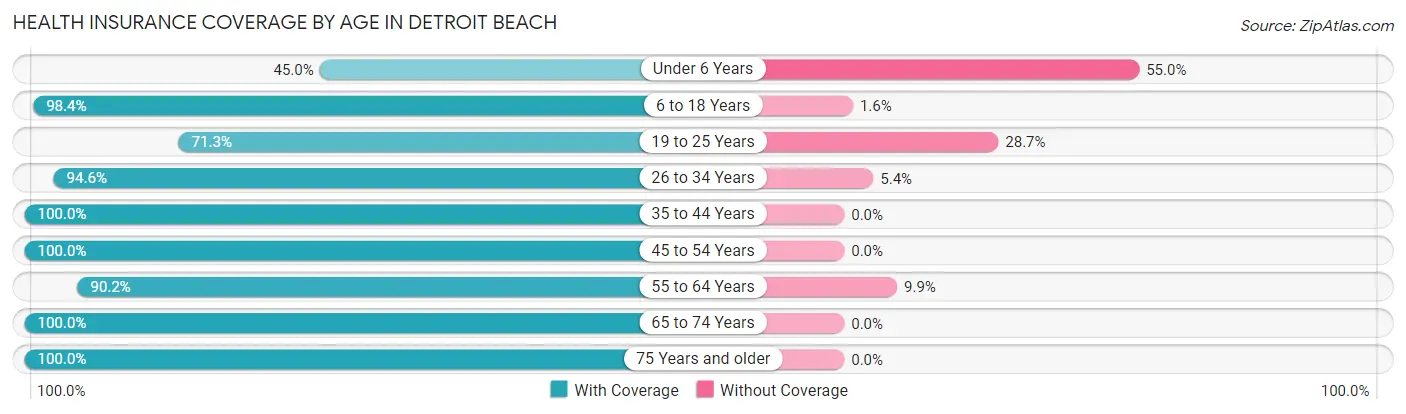
| Age Bracket | With Coverage | Without Coverage |
| Under 6 Years | 99 (45.0%) | 121 (55.0%) |
| 6 to 18 Years | 243 (98.4%) | 4 (1.6%) |
| 19 to 25 Years | 320 (71.3%) | 129 (28.7%) |
| 26 to 34 Years | 227 (94.6%) | 13 (5.4%) |
| 35 to 44 Years | 149 (100.0%) | 0 (0.0%) |
| 45 to 54 Years | 179 (100.0%) | 0 (0.0%) |
| 55 to 64 Years | 430 (90.1%) | 47 (9.9%) |
| 65 to 74 Years | 225 (100.0%) | 0 (0.0%) |
| 75 Years and older | 25 (100.0%) | 0 (0.0%) |
| Total | 1,897 (85.8%) | 314 (14.2%) |
Health Insurance Coverage by Citizenship Status in Detroit Beach
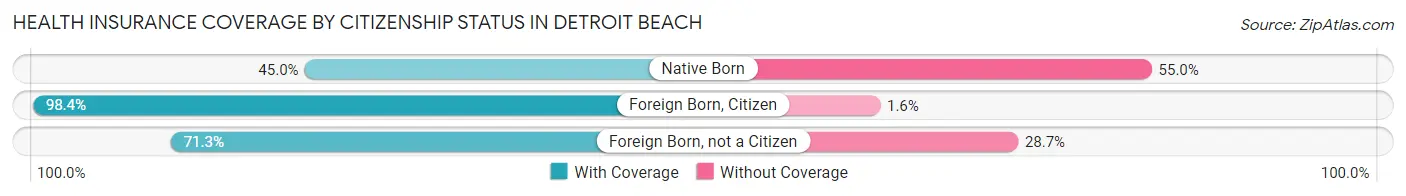
| Citizenship Status | With Coverage | Without Coverage |
| Native Born | 99 (45.0%) | 121 (55.0%) |
| Foreign Born, Citizen | 243 (98.4%) | 4 (1.6%) |
| Foreign Born, not a Citizen | 320 (71.3%) | 129 (28.7%) |
Health Insurance Coverage by Household Income in Detroit Beach
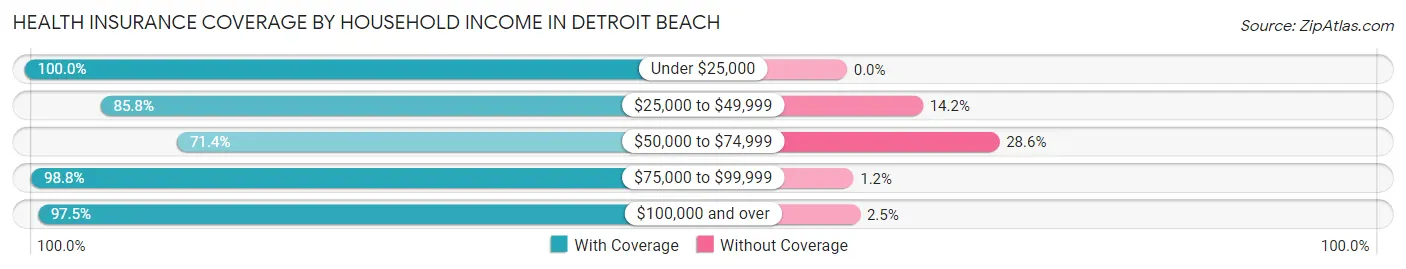
| Household Income | With Coverage | Without Coverage |
| Under $25,000 | 171 (100.0%) | 0 (0.0%) |
| $25,000 to $49,999 | 241 (85.8%) | 40 (14.2%) |
| $50,000 to $74,999 | 643 (71.4%) | 257 (28.6%) |
| $75,000 to $99,999 | 323 (98.8%) | 4 (1.2%) |
| $100,000 and over | 515 (97.5%) | 13 (2.5%) |
Public vs Private Health Insurance Coverage by Age in Detroit Beach
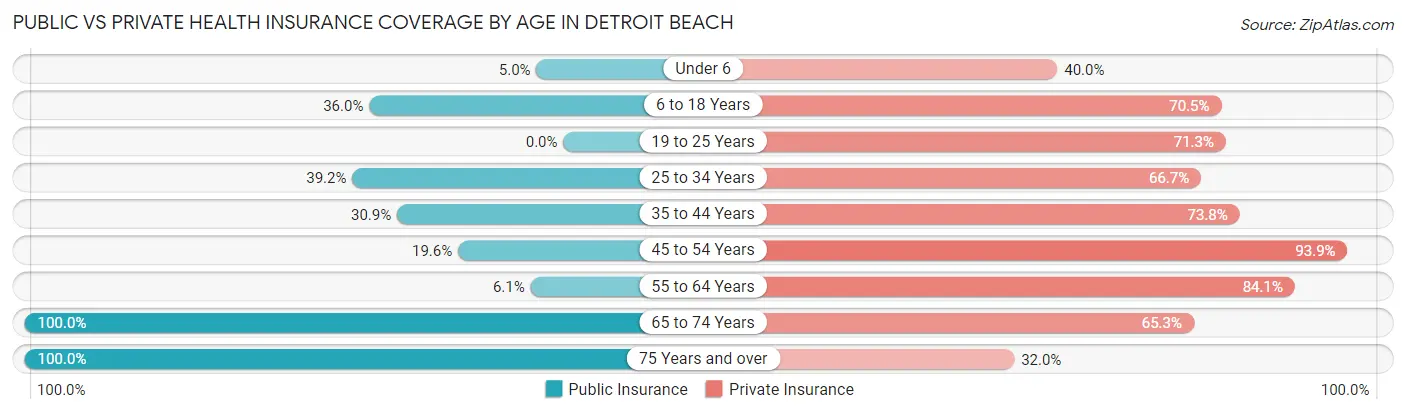
| Age Bracket | Public Insurance | Private Insurance |
| Under 6 | 11 (5.0%) | 88 (40.0%) |
| 6 to 18 Years | 89 (36.0%) | 174 (70.5%) |
| 19 to 25 Years | 0 (0.0%) | 320 (71.3%) |
| 25 to 34 Years | 94 (39.2%) | 160 (66.7%) |
| 35 to 44 Years | 46 (30.9%) | 110 (73.8%) |
| 45 to 54 Years | 35 (19.6%) | 168 (93.9%) |
| 55 to 64 Years | 29 (6.1%) | 401 (84.1%) |
| 65 to 74 Years | 225 (100.0%) | 147 (65.3%) |
| 75 Years and over | 25 (100.0%) | 8 (32.0%) |
| Total | 554 (25.1%) | 1,576 (71.3%) |
Disability Status by Sex by Age in Detroit Beach
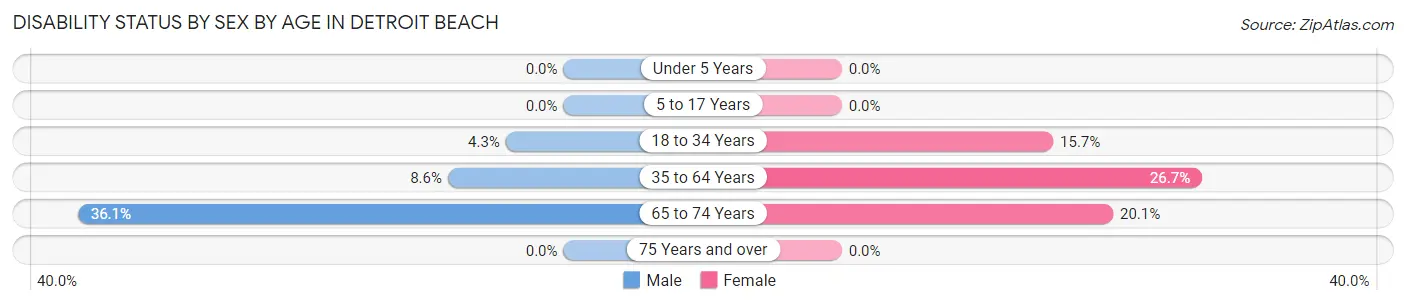
| Age Bracket | Male | Female |
| Under 5 Years | 0 (0.0%) | 0 (0.0%) |
| 5 to 17 Years | 0 (0.0%) | 0 (0.0%) |
| 18 to 34 Years | 19 (4.3%) | 48 (15.7%) |
| 35 to 64 Years | 37 (8.6%) | 100 (26.7%) |
| 65 to 74 Years | 31 (36.0%) | 28 (20.1%) |
| 75 Years and over | 0 (0.0%) | 0 (0.0%) |
Disability Class by Sex by Age in Detroit Beach
Disability Class: Hearing Difficulty
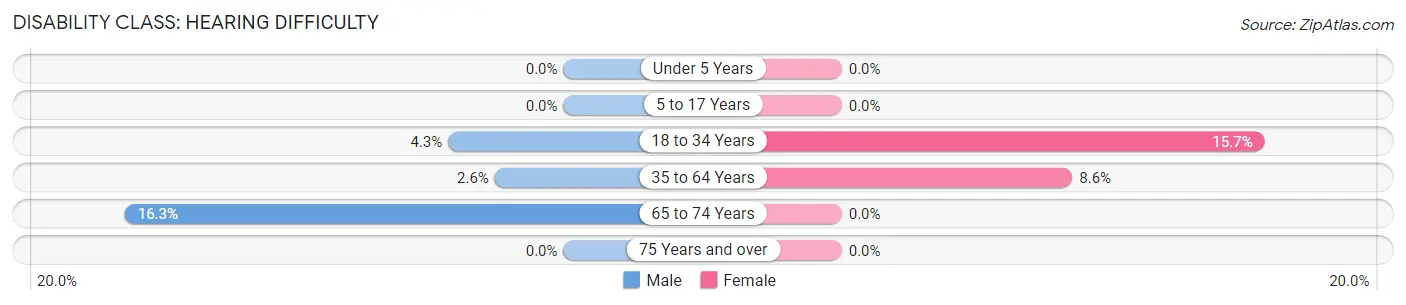
| Age Bracket | Male | Female |
| Under 5 Years | 0 (0.0%) | 0 (0.0%) |
| 5 to 17 Years | 0 (0.0%) | 0 (0.0%) |
| 18 to 34 Years | 19 (4.3%) | 48 (15.7%) |
| 35 to 64 Years | 11 (2.5%) | 32 (8.6%) |
| 65 to 74 Years | 14 (16.3%) | 0 (0.0%) |
| 75 Years and over | 0 (0.0%) | 0 (0.0%) |
Disability Class: Vision Difficulty
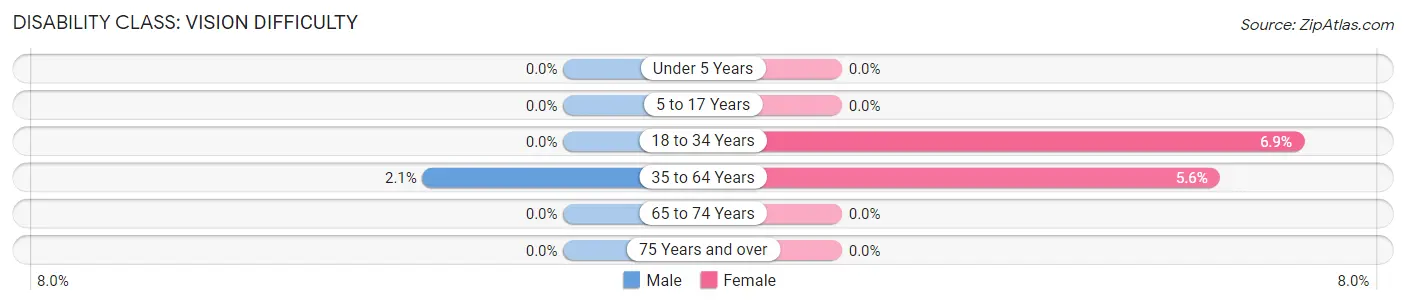
| Age Bracket | Male | Female |
| Under 5 Years | 0 (0.0%) | 0 (0.0%) |
| 5 to 17 Years | 0 (0.0%) | 0 (0.0%) |
| 18 to 34 Years | 0 (0.0%) | 21 (6.9%) |
| 35 to 64 Years | 9 (2.1%) | 21 (5.6%) |
| 65 to 74 Years | 0 (0.0%) | 0 (0.0%) |
| 75 Years and over | 0 (0.0%) | 0 (0.0%) |
Disability Class: Cognitive Difficulty
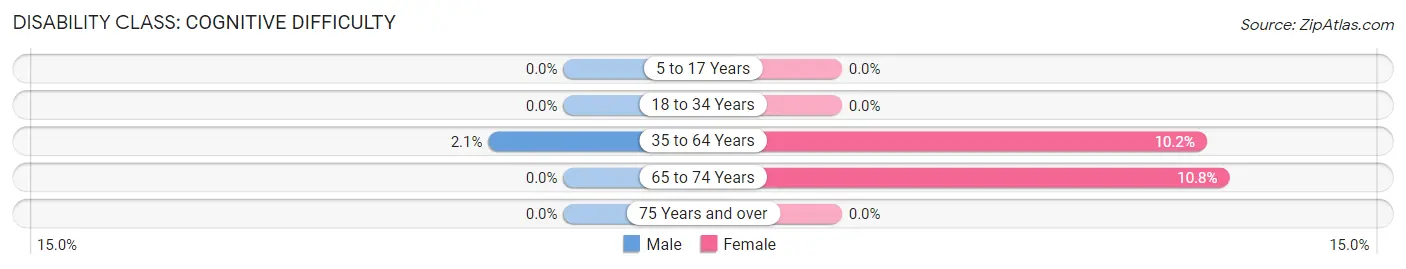
| Age Bracket | Male | Female |
| 5 to 17 Years | 0 (0.0%) | 0 (0.0%) |
| 18 to 34 Years | 0 (0.0%) | 0 (0.0%) |
| 35 to 64 Years | 9 (2.1%) | 38 (10.2%) |
| 65 to 74 Years | 0 (0.0%) | 15 (10.8%) |
| 75 Years and over | 0 (0.0%) | 0 (0.0%) |
Disability Class: Ambulatory Difficulty
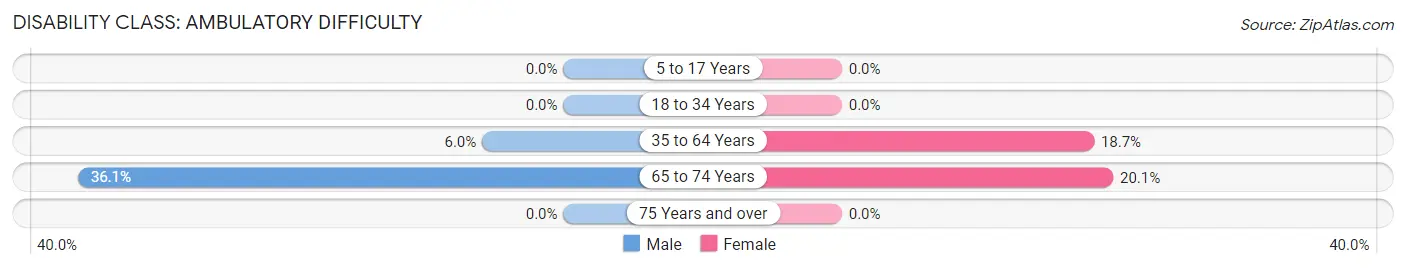
| Age Bracket | Male | Female |
| 5 to 17 Years | 0 (0.0%) | 0 (0.0%) |
| 18 to 34 Years | 0 (0.0%) | 0 (0.0%) |
| 35 to 64 Years | 26 (6.0%) | 70 (18.7%) |
| 65 to 74 Years | 31 (36.0%) | 28 (20.1%) |
| 75 Years and over | 0 (0.0%) | 0 (0.0%) |
Disability Class: Self-Care Difficulty
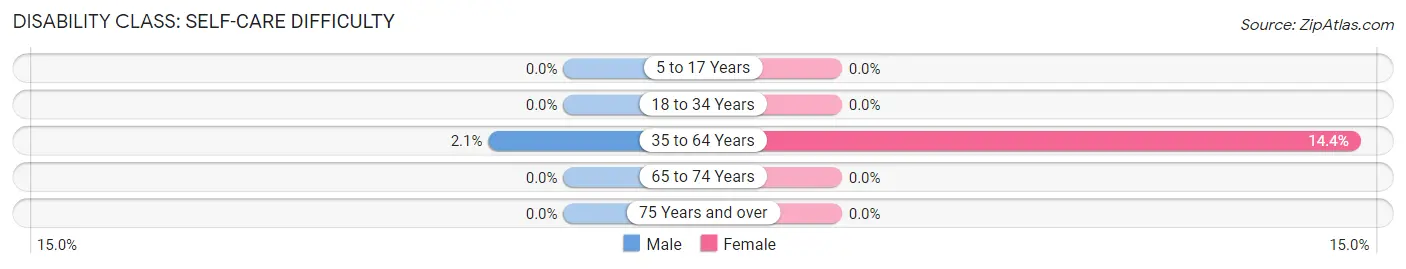
| Age Bracket | Male | Female |
| 5 to 17 Years | 0 (0.0%) | 0 (0.0%) |
| 18 to 34 Years | 0 (0.0%) | 0 (0.0%) |
| 35 to 64 Years | 9 (2.1%) | 54 (14.4%) |
| 65 to 74 Years | 0 (0.0%) | 0 (0.0%) |
| 75 Years and over | 0 (0.0%) | 0 (0.0%) |
Technology Access in Detroit Beach
Computing Device Access in Detroit Beach
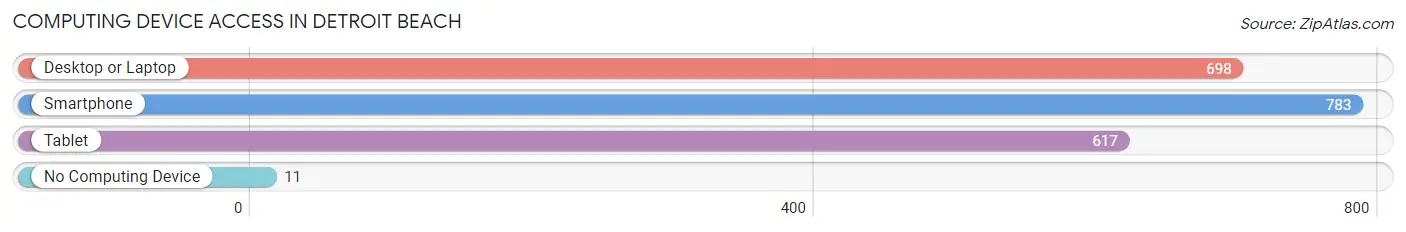
| Device Type | # Households | % Households |
| Desktop or Laptop | 698 | 82.7% |
| Smartphone | 783 | 92.8% |
| Tablet | 617 | 73.1% |
| No Computing Device | 11 | 1.3% |
| Total | 844 | 100.0% |
Internet Access in Detroit Beach
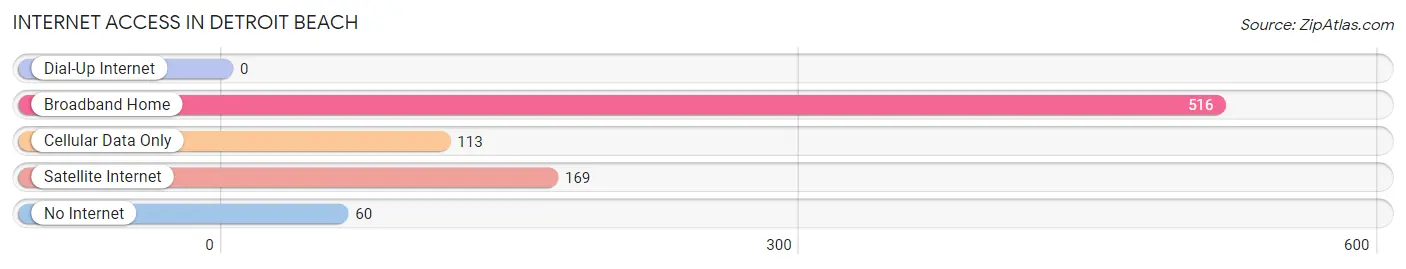
| Internet Type | # Households | % Households |
| Dial-Up Internet | 0 | 0.0% |
| Broadband Home | 516 | 61.1% |
| Cellular Data Only | 113 | 13.4% |
| Satellite Internet | 169 | 20.0% |
| No Internet | 60 | 7.1% |
| Total | 844 | 100.0% |
Detroit Beach Summary
History
Detroit Beach is a small community located in Monroe County, Michigan. It is situated on the western shore of Lake Erie, just south of the city of Detroit. The area was first settled in the early 1800s by French-Canadian fur traders and farmers. The community was originally known as “La Plage”, which translates to “the beach” in French.
In the late 1800s, the area began to attract more visitors as a summer resort destination. The Detroit Beach Hotel was built in 1891 and quickly became a popular destination for vacationers. The hotel was destroyed by a fire in the early 1900s, but the area continued to attract visitors.
In the 1920s, the area was developed as a residential community. The Detroit Beach Yacht Club was established in 1924 and the Detroit Beach Golf Course was built in 1926. The area was also home to a number of amusement parks, including the Detroit Beach Amusement Park, which opened in 1927.
The area experienced a decline in the 1950s and 1960s as the automobile industry in Detroit began to decline. The amusement parks closed and the Detroit Beach Hotel was demolished in the late 1960s.
In the late 1970s, the area began to experience a resurgence as a residential community. The Detroit Beach Yacht Club was renovated and the Detroit Beach Golf Course was expanded. The area also became a popular destination for fishing and boating.
Geography
Detroit Beach is located in Monroe County, Michigan. It is situated on the western shore of Lake Erie, just south of the city of Detroit. The area is bordered by the Detroit River to the north and the Huron River to the south.
The area is mostly flat, with some rolling hills. The terrain is mostly sandy, with some areas of marshland. The area is home to a number of parks, including the Detroit Beach Park, which offers a beach, picnic areas, and a playground.
Economy
The economy of Detroit Beach is largely based on tourism. The area is home to a number of hotels, restaurants, and other businesses that cater to visitors. The Detroit Beach Yacht Club and the Detroit Beach Golf Course are popular destinations for visitors.
The area is also home to a number of manufacturing and industrial businesses. The area is home to a number of automotive parts suppliers, as well as a number of other businesses that supply parts to the automotive industry.
Demographics
As of the 2010 census, the population of Detroit Beach was 2,845. The population is largely white (90.3%), with a small percentage of African Americans (4.2%) and Hispanics (2.2%). The median household income is $45,945, and the median age is 44.
The area is largely residential, with a small number of businesses. The area is home to a number of churches, including the Detroit Beach United Methodist Church and the Detroit Beach Baptist Church. The area is also home to a number of schools, including the Detroit Beach Elementary School and the Detroit Beach Middle School.
Common Questions
What is Per Capita Income in Detroit Beach?
Per Capita income in Detroit Beach is $29,310.
What is the Median Family Income in Detroit Beach?
Median Family Income in Detroit Beach is $60,515.
What is the Median Household income in Detroit Beach?
Median Household Income in Detroit Beach is $70,868.
What is Income or Wage Gap in Detroit Beach?
Income or Wage Gap in Detroit Beach is 69.5%.
Women in Detroit Beach earn 30.5 cents for every dollar earned by a man.
What is Inequality or Gini Index in Detroit Beach?
Inequality or Gini Index in Detroit Beach is 0.30.
What is the Total Population of Detroit Beach?
Total Population of Detroit Beach is 2,211.
What is the Total Male Population of Detroit Beach?
Total Male Population of Detroit Beach is 1,263.
What is the Total Female Population of Detroit Beach?
Total Female Population of Detroit Beach is 948.
What is the Ratio of Males per 100 Females in Detroit Beach?
There are 133.23 Males per 100 Females in Detroit Beach.
What is the Ratio of Females per 100 Males in Detroit Beach?
There are 75.06 Females per 100 Males in Detroit Beach.
What is the Median Population Age in Detroit Beach?
Median Population Age in Detroit Beach is 33.4 Years.
What is the Average Family Size in Detroit Beach
Average Family Size in Detroit Beach is 2.7 People.
What is the Average Household Size in Detroit Beach
Average Household Size in Detroit Beach is 2.6 People.
How Large is the Labor Force in Detroit Beach?
There are 1,130 People in the Labor Forcein in Detroit Beach.
What is the Percentage of People in the Labor Force in Detroit Beach?
61.9% of People are in the Labor Force in Detroit Beach.
What is the Unemployment Rate in Detroit Beach?
Unemployment Rate in Detroit Beach is 1.4%.