K I Sawyer, MI Map & Demographics
K I Sawyer Map
K I Sawyer Overview
$21,803
PER CAPITA INCOME
$62,250
AVG FAMILY INCOME
$52,301
AVG HOUSEHOLD INCOME
38.4%
WAGE / INCOME GAP [ % ]
61.6¢/ $1
WAGE / INCOME GAP [ $ ]
0.34
INEQUALITY / GINI INDEX
2,833
TOTAL POPULATION
1,447
MALE POPULATION
1,386
FEMALE POPULATION
104.40
MALES / 100 FEMALES
95.78
FEMALES / 100 MALES
32.2
MEDIAN AGE
3.8
AVG FAMILY SIZE
2.7
AVG HOUSEHOLD SIZE
1,185
LABOR FORCE [ PEOPLE ]
56.6%
PERCENT IN LABOR FORCE
4.7%
UNEMPLOYMENT RATE
Income in K I Sawyer
Income Overview in K I Sawyer
Per Capita Income in K I Sawyer is $21,803, while median incomes of families and households are $62,250 and $52,301 respectively.
| Characteristic | Number | Measure |
| Per Capita Income | 2,833 | $21,803 |
| Median Family Income | 559 | $62,250 |
| Mean Family Income | 559 | $68,435 |
| Median Household Income | 1,051 | $52,301 |
| Mean Household Income | 1,051 | $57,922 |
| Income Deficit | 559 | $0 |
| Wage / Income Gap (%) | 2,833 | 38.41% |
| Wage / Income Gap ($) | 2,833 | 61.59¢ per $1 |
| Gini / Inequality Index | 2,833 | 0.34 |
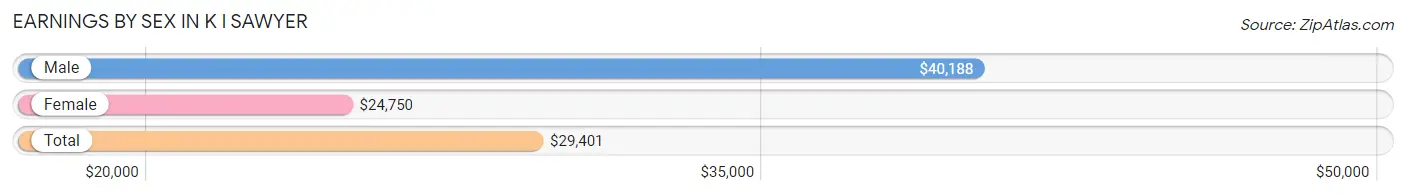
Earnings by Sex in K I Sawyer
Average Earnings in K I Sawyer are $29,401, $40,188 for men and $24,750 for women, a difference of 38.4%.
| Sex | Number | Average Earnings |
| Male | 698 (55.6%) | $40,188 |
| Female | 557 (44.4%) | $24,750 |
| Total | 1,255 (100.0%) | $29,401 |
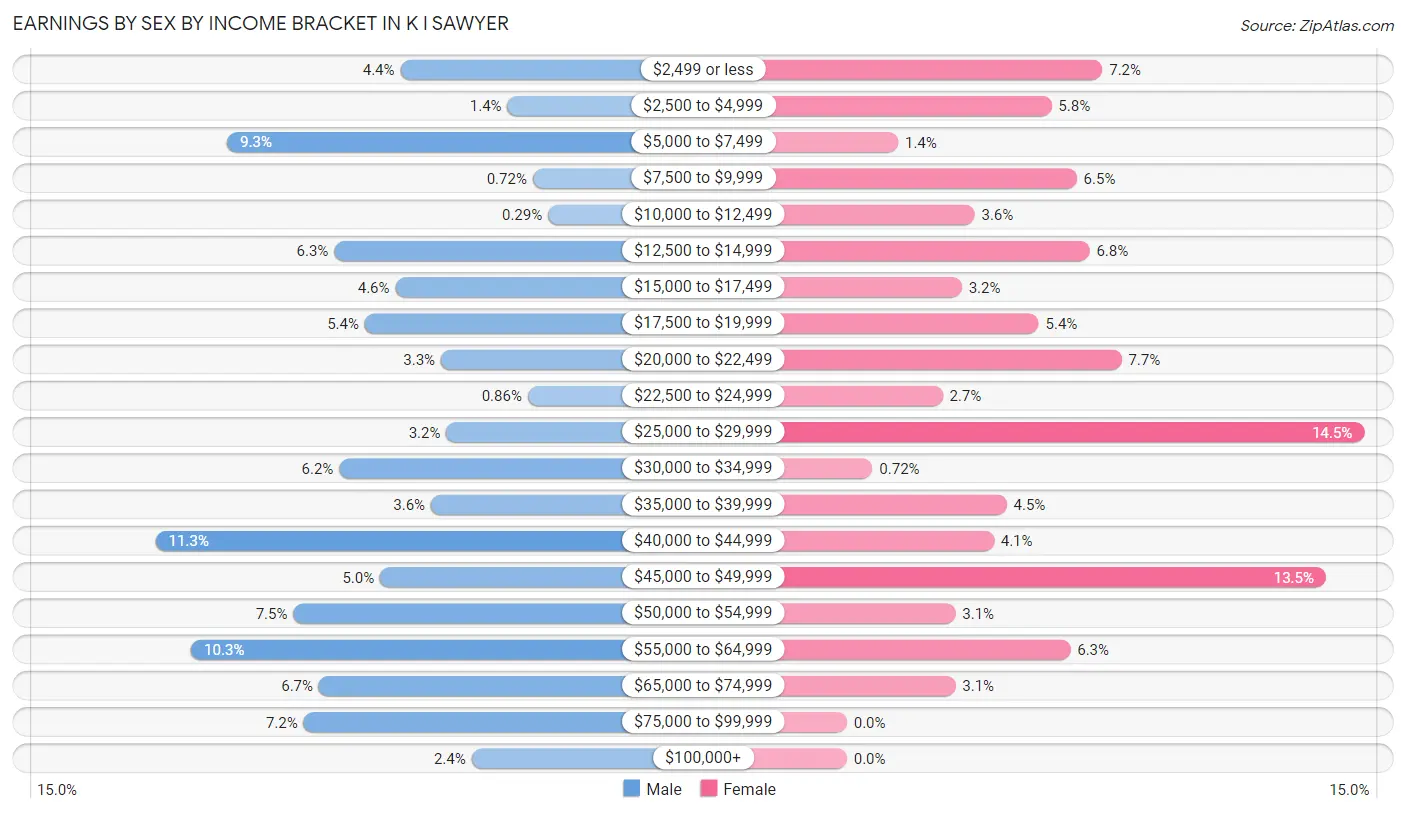
Earnings by Sex by Income Bracket in K I Sawyer
The most common earnings brackets in K I Sawyer are $40,000 to $44,999 for men (79 | 11.3%) and $25,000 to $29,999 for women (81 | 14.5%).
| Income | Male | Female |
| $2,499 or less | 31 (4.4%) | 40 (7.2%) |
| $2,500 to $4,999 | 10 (1.4%) | 32 (5.8%) |
| $5,000 to $7,499 | 65 (9.3%) | 8 (1.4%) |
| $7,500 to $9,999 | 5 (0.7%) | 36 (6.5%) |
| $10,000 to $12,499 | 2 (0.3%) | 20 (3.6%) |
| $12,500 to $14,999 | 44 (6.3%) | 38 (6.8%) |
| $15,000 to $17,499 | 32 (4.6%) | 18 (3.2%) |
| $17,500 to $19,999 | 38 (5.4%) | 30 (5.4%) |
| $20,000 to $22,499 | 23 (3.3%) | 43 (7.7%) |
| $22,500 to $24,999 | 6 (0.9%) | 15 (2.7%) |
| $25,000 to $29,999 | 22 (3.2%) | 81 (14.5%) |
| $30,000 to $34,999 | 43 (6.2%) | 4 (0.7%) |
| $35,000 to $39,999 | 25 (3.6%) | 25 (4.5%) |
| $40,000 to $44,999 | 79 (11.3%) | 23 (4.1%) |
| $45,000 to $49,999 | 35 (5.0%) | 75 (13.5%) |
| $50,000 to $54,999 | 52 (7.4%) | 17 (3.0%) |
| $55,000 to $64,999 | 72 (10.3%) | 35 (6.3%) |
| $65,000 to $74,999 | 47 (6.7%) | 17 (3.0%) |
| $75,000 to $99,999 | 50 (7.2%) | 0 (0.0%) |
| $100,000+ | 17 (2.4%) | 0 (0.0%) |
| Total | 698 (100.0%) | 557 (100.0%) |
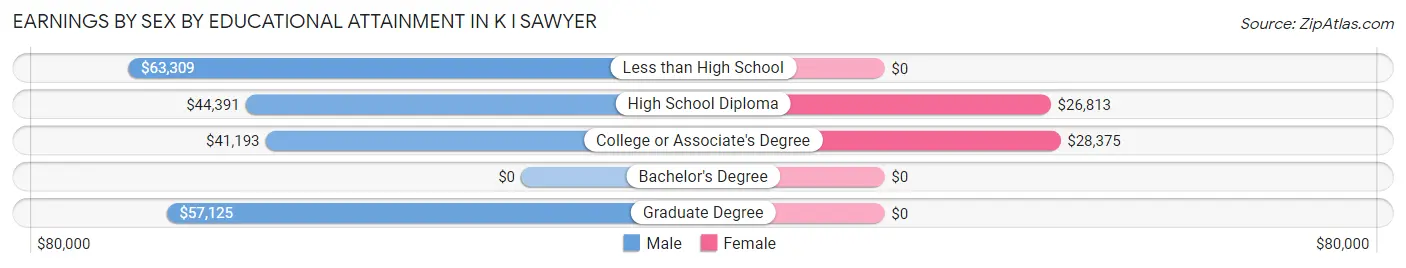
Earnings by Sex by Educational Attainment in K I Sawyer
Average earnings in K I Sawyer are $44,712 for men and $26,635 for women, a difference of 40.4%. Men with an educational attainment of less than high school enjoy the highest average annual earnings of $63,309, while those with college or associate's degree education earn the least with $41,193. Women with an educational attainment of college or associate's degree earn the most with the average annual earnings of $28,375, while those with high school diploma education have the smallest earnings of $26,813.
| Educational Attainment | Male Income | Female Income |
| Less than High School | $63,309 | $0 |
| High School Diploma | $44,391 | $26,813 |
| College or Associate's Degree | $41,193 | $28,375 |
| Bachelor's Degree | - | - |
| Graduate Degree | $57,125 | $0 |
| Total | $44,712 | $26,635 |
Family Income in K I Sawyer
Family Income Brackets in K I Sawyer
According to the K I Sawyer family income data, there are 153 families falling into the $50,000 to $74,999 income range, which is the most common income bracket and makes up 27.4% of all families. Conversely, the $200,000+ income bracket is the least frequent group with only 4 families (0.7%) belonging to this category.
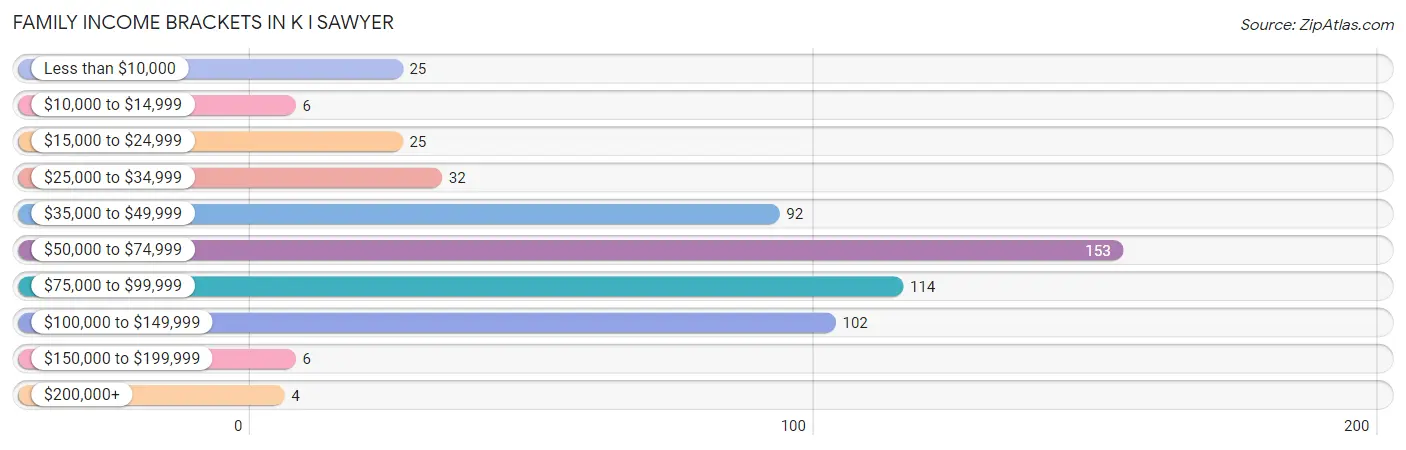
| Income Bracket | # Families | % Families |
| Less than $10,000 | 25 | 4.5% |
| $10,000 to $14,999 | 6 | 1.1% |
| $15,000 to $24,999 | 25 | 4.5% |
| $25,000 to $34,999 | 32 | 5.7% |
| $35,000 to $49,999 | 92 | 16.5% |
| $50,000 to $74,999 | 153 | 27.4% |
| $75,000 to $99,999 | 114 | 20.4% |
| $100,000 to $149,999 | 102 | 18.2% |
| $150,000 to $199,999 | 6 | 1.1% |
| $200,000+ | 4 | 0.7% |
Family Income by Famaliy Size in K I Sawyer
2-person families (216 | 38.6%) account for the highest median family income in K I Sawyer with $74,688 per family, while 2-person families (216 | 38.6%) have the highest median income of $37,344 per family member.
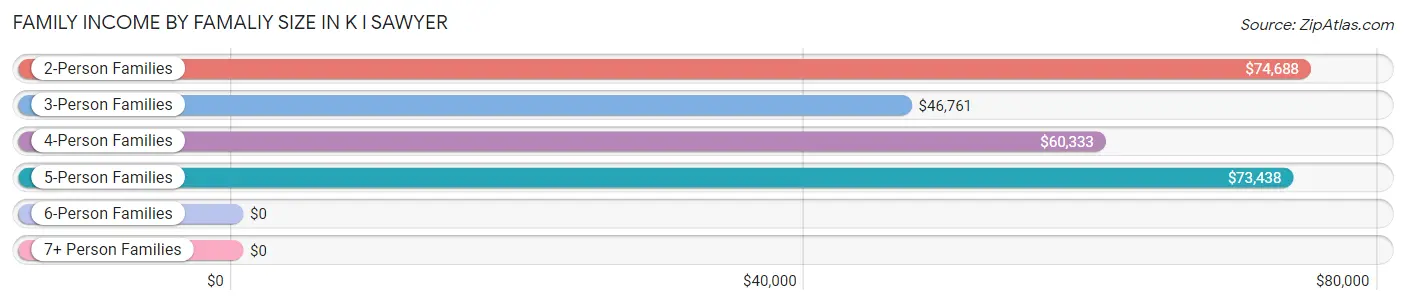
| Income Bracket | # Families | Median Income |
| 2-Person Families | 216 (38.6%) | $74,688 |
| 3-Person Families | 111 (19.9%) | $46,761 |
| 4-Person Families | 96 (17.2%) | $60,333 |
| 5-Person Families | 57 (10.2%) | $73,438 |
| 6-Person Families | 53 (9.5%) | $0 |
| 7+ Person Families | 26 (4.6%) | $0 |
| Total | 559 (100.0%) | $62,250 |
Family Income by Number of Earners in K I Sawyer
The median family income in K I Sawyer is $62,250, with families comprising 3+ earners (55) having the highest median family income of $116,417, while families with no earners (90) have the lowest median family income of $34,167, accounting for 9.8% and 16.1% of families, respectively.
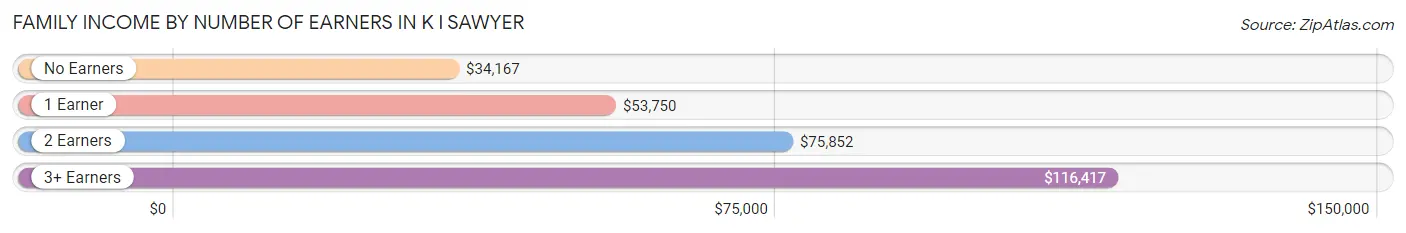
| Number of Earners | # Families | Median Income |
| No Earners | 90 (16.1%) | $34,167 |
| 1 Earner | 221 (39.5%) | $53,750 |
| 2 Earners | 193 (34.5%) | $75,852 |
| 3+ Earners | 55 (9.8%) | $116,417 |
| Total | 559 (100.0%) | $62,250 |
Household Income in K I Sawyer
Household Income Brackets in K I Sawyer
With 264 households falling in the category, the $50,000 to $74,999 income range is the most frequent in K I Sawyer, accounting for 25.1% of all households. In contrast, only 4 households (0.4%) fall into the $200,000+ income bracket, making it the least populous group.
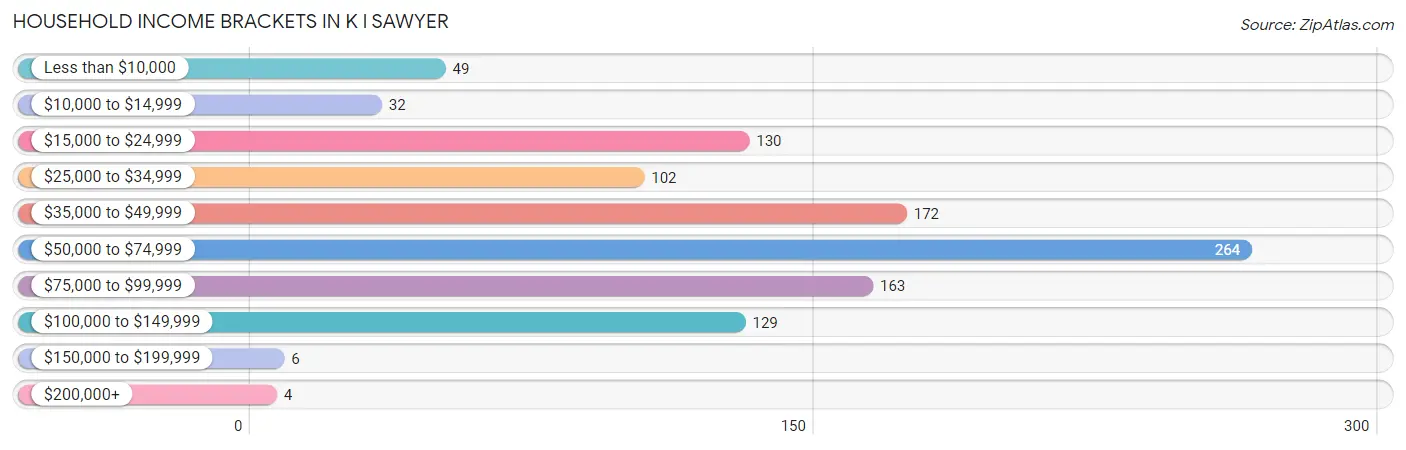
| Income Bracket | # Households | % Households |
| Less than $10,000 | 49 | 4.7% |
| $10,000 to $14,999 | 32 | 3.0% |
| $15,000 to $24,999 | 130 | 12.4% |
| $25,000 to $34,999 | 102 | 9.7% |
| $35,000 to $49,999 | 172 | 16.4% |
| $50,000 to $74,999 | 264 | 25.1% |
| $75,000 to $99,999 | 163 | 15.5% |
| $100,000 to $149,999 | 129 | 12.3% |
| $150,000 to $199,999 | 6 | 0.6% |
| $200,000+ | 4 | 0.4% |
Household Income by Householder Age in K I Sawyer
The median household income in K I Sawyer is $52,301, with the highest median household income of $59,815 found in the 25 to 44 years age bracket for the primary householder. A total of 418 households (39.8%) fall into this category. Meanwhile, the 15 to 24 years age bracket for the primary householder has the lowest median household income of $34,750, with 73 households (7.0%) in this group.
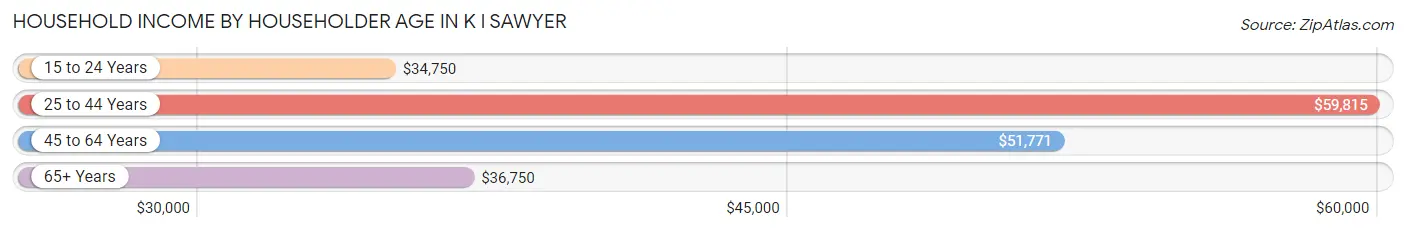
| Income Bracket | # Households | Median Income |
| 15 to 24 Years | 73 (7.0%) | $34,750 |
| 25 to 44 Years | 418 (39.8%) | $59,815 |
| 45 to 64 Years | 358 (34.1%) | $51,771 |
| 65+ Years | 202 (19.2%) | $36,750 |
| Total | 1,051 (100.0%) | $52,301 |
Poverty in K I Sawyer
Income Below Poverty by Sex and Age in K I Sawyer
With 15.8% poverty level for males and 17.5% for females among the residents of K I Sawyer, 6 to 11 year old males and 6 to 11 year old females are the most vulnerable to poverty, with 43 males (31.6%) and 42 females (50.0%) in their respective age groups living below the poverty level.
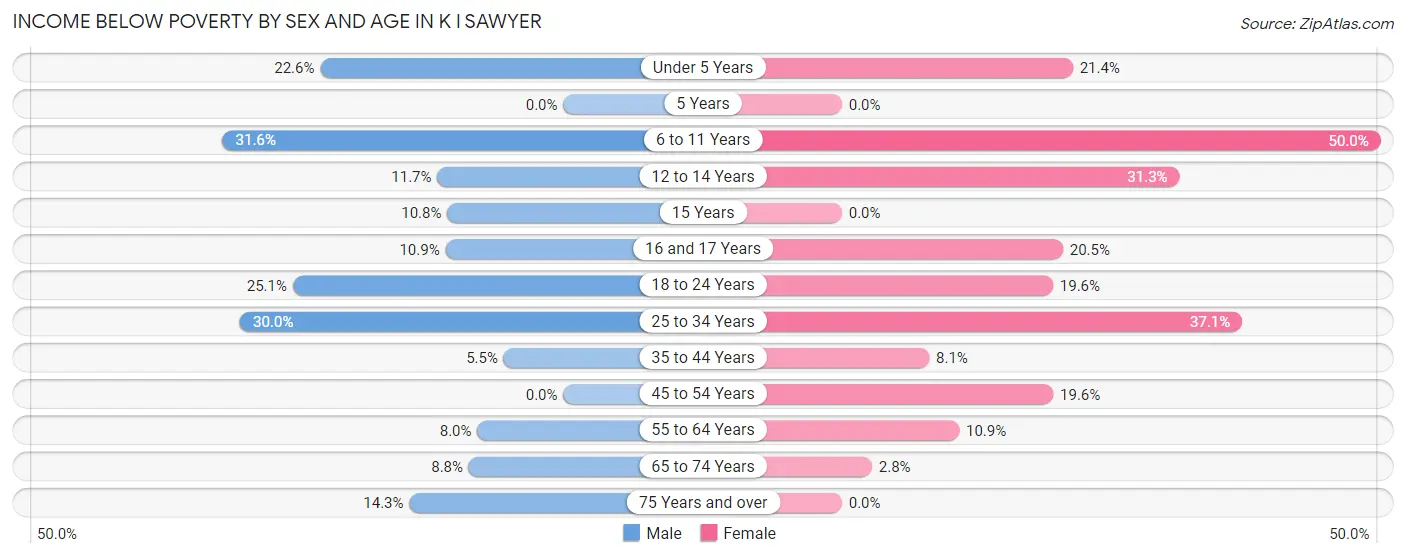
| Age Bracket | Male | Female |
| Under 5 Years | 30 (22.6%) | 15 (21.4%) |
| 5 Years | 0 (0.0%) | 0 (0.0%) |
| 6 to 11 Years | 43 (31.6%) | 42 (50.0%) |
| 12 to 14 Years | 9 (11.7%) | 26 (31.3%) |
| 15 Years | 7 (10.8%) | 0 (0.0%) |
| 16 and 17 Years | 7 (10.9%) | 8 (20.5%) |
| 18 to 24 Years | 56 (25.1%) | 29 (19.6%) |
| 25 to 34 Years | 42 (30.0%) | 52 (37.1%) |
| 35 to 44 Years | 11 (5.5%) | 20 (8.1%) |
| 45 to 54 Years | 0 (0.0%) | 30 (19.6%) |
| 55 to 64 Years | 13 (8.0%) | 16 (10.9%) |
| 65 to 74 Years | 5 (8.8%) | 5 (2.8%) |
| 75 Years and over | 5 (14.3%) | 0 (0.0%) |
| Total | 228 (15.8%) | 243 (17.5%) |
Income Above Poverty by Sex and Age in K I Sawyer
According to the poverty statistics in K I Sawyer, males aged 5 years and females aged 5 years are the age groups that are most secure financially, with 100.0% of males and 100.0% of females in these age groups living above the poverty line.
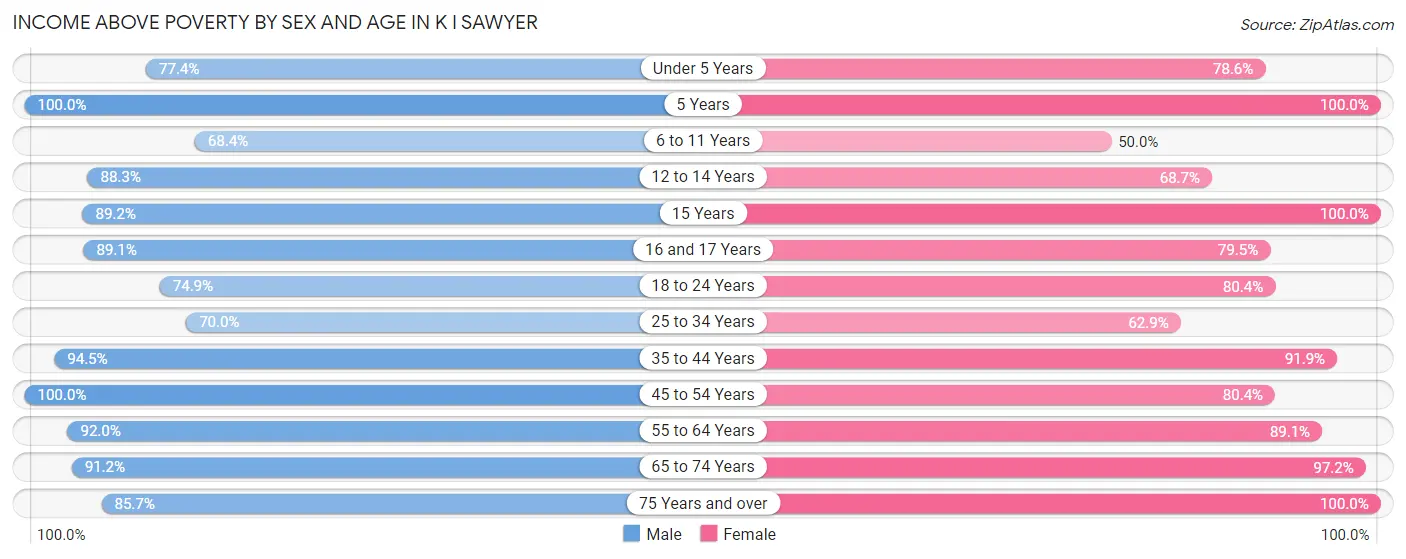
| Age Bracket | Male | Female |
| Under 5 Years | 103 (77.4%) | 55 (78.6%) |
| 5 Years | 31 (100.0%) | 18 (100.0%) |
| 6 to 11 Years | 93 (68.4%) | 42 (50.0%) |
| 12 to 14 Years | 68 (88.3%) | 57 (68.7%) |
| 15 Years | 58 (89.2%) | 43 (100.0%) |
| 16 and 17 Years | 57 (89.1%) | 31 (79.5%) |
| 18 to 24 Years | 167 (74.9%) | 119 (80.4%) |
| 25 to 34 Years | 98 (70.0%) | 88 (62.9%) |
| 35 to 44 Years | 188 (94.5%) | 227 (91.9%) |
| 45 to 54 Years | 123 (100.0%) | 123 (80.4%) |
| 55 to 64 Years | 150 (92.0%) | 131 (89.1%) |
| 65 to 74 Years | 52 (91.2%) | 174 (97.2%) |
| 75 Years and over | 30 (85.7%) | 35 (100.0%) |
| Total | 1,218 (84.2%) | 1,143 (82.5%) |
Income Below Poverty Among Married-Couple Families in K I Sawyer
The poverty statistics for married-couple families in K I Sawyer show that 7.0% or 26 of the total 371 families live below the poverty line. Families with 5 or more children have the highest poverty rate of 40.0%, comprising of 6 families. On the other hand, families with 1 or 2 children have the lowest poverty rate of 2.0%, which includes 3 families.
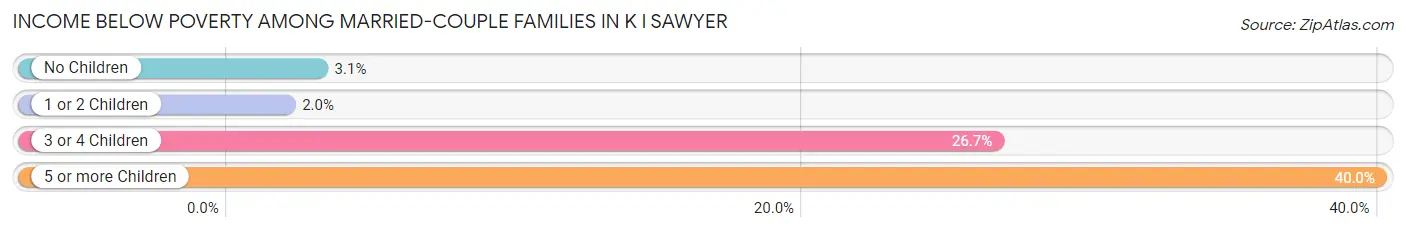
| Children | Above Poverty | Below Poverty |
| No Children | 155 (96.9%) | 5 (3.1%) |
| 1 or 2 Children | 148 (98.0%) | 3 (2.0%) |
| 3 or 4 Children | 33 (73.3%) | 12 (26.7%) |
| 5 or more Children | 9 (60.0%) | 6 (40.0%) |
| Total | 345 (93.0%) | 26 (7.0%) |
Income Below Poverty Among Single-Parent Households in K I Sawyer
According to the poverty data in K I Sawyer, 25.0% or 12 single-father households and 14.3% or 20 single-mother households are living below the poverty line. Among single-father households, those with 1 or 2 children have the highest poverty rate, with 12 households (25.0%) experiencing poverty. Likewise, among single-mother households, those with no children have the highest poverty rate, with 6 households (27.3%) falling below the poverty line.
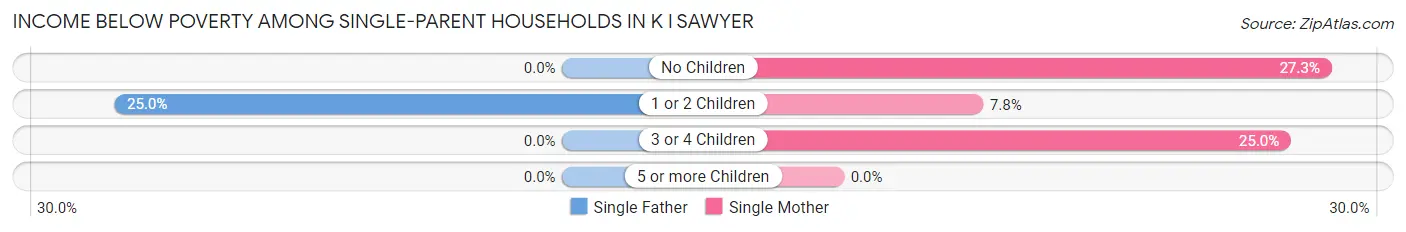
| Children | Single Father | Single Mother |
| No Children | 0 (0.0%) | 6 (27.3%) |
| 1 or 2 Children | 12 (25.0%) | 7 (7.8%) |
| 3 or 4 Children | 0 (0.0%) | 7 (25.0%) |
| 5 or more Children | 0 (0.0%) | 0 (0.0%) |
| Total | 12 (25.0%) | 20 (14.3%) |
Income Below Poverty Among Married-Couple vs Single-Parent Households in K I Sawyer
The poverty data for K I Sawyer shows that 26 of the married-couple family households (7.0%) and 32 of the single-parent households (17.0%) are living below the poverty level. Within the married-couple family households, those with 5 or more children have the highest poverty rate, with 6 households (40.0%) falling below the poverty line. Among the single-parent households, those with no children have the highest poverty rate, with 6 household (27.3%) living below poverty.
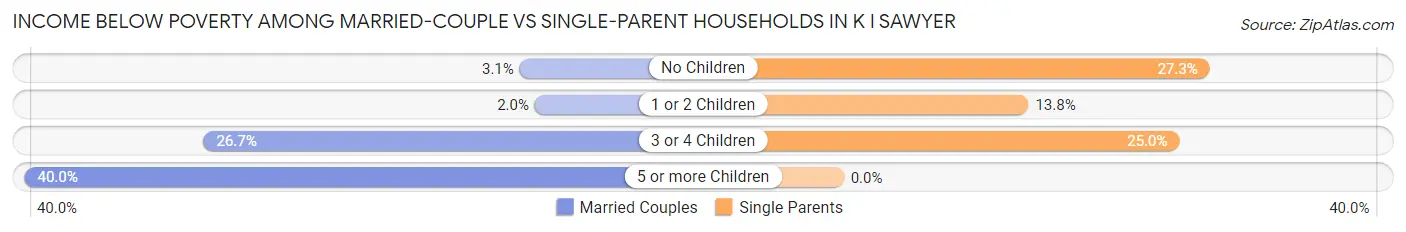
| Children | Married-Couple Families | Single-Parent Households |
| No Children | 5 (3.1%) | 6 (27.3%) |
| 1 or 2 Children | 3 (2.0%) | 19 (13.8%) |
| 3 or 4 Children | 12 (26.7%) | 7 (25.0%) |
| 5 or more Children | 6 (40.0%) | 0 (0.0%) |
| Total | 26 (7.0%) | 32 (17.0%) |
Race in K I Sawyer
The most populous races in K I Sawyer are White / Caucasian (2,276 | 80.3%), Two or more Races (248 | 8.7%), and Native / Alaskan (166 | 5.9%).
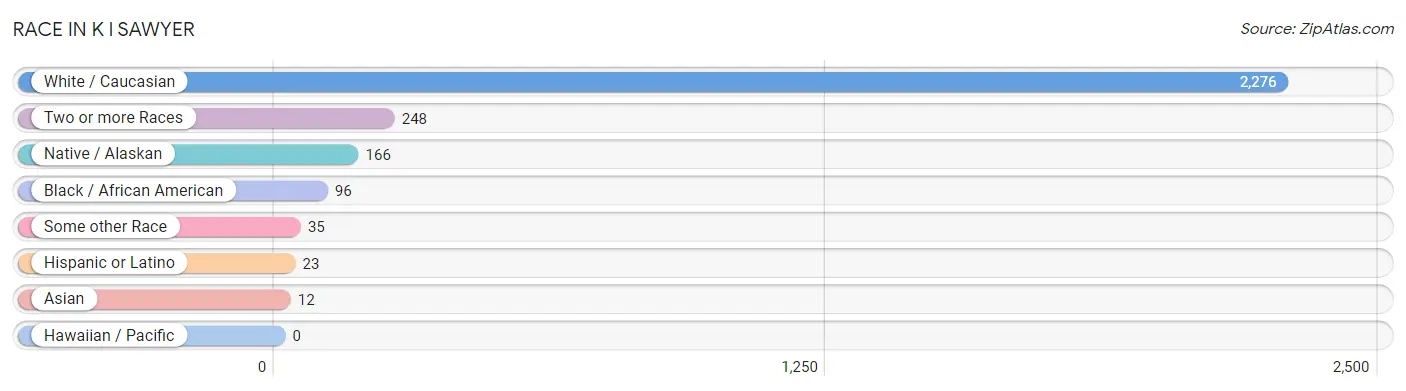
| Race | # Population | % Population |
| Asian | 12 | 0.4% |
| Black / African American | 96 | 3.4% |
| Hawaiian / Pacific | 0 | 0.0% |
| Hispanic or Latino | 23 | 0.8% |
| Native / Alaskan | 166 | 5.9% |
| White / Caucasian | 2,276 | 80.3% |
| Two or more Races | 248 | 8.7% |
| Some other Race | 35 | 1.2% |
| Total | 2,833 | 100.0% |
Ancestry in K I Sawyer
The most populous ancestries reported in K I Sawyer are German (715 | 25.2%), English (587 | 20.7%), Irish (332 | 11.7%), Finnish (210 | 7.4%), and Chippewa (163 | 5.8%), together accounting for 70.8% of all K I Sawyer residents.
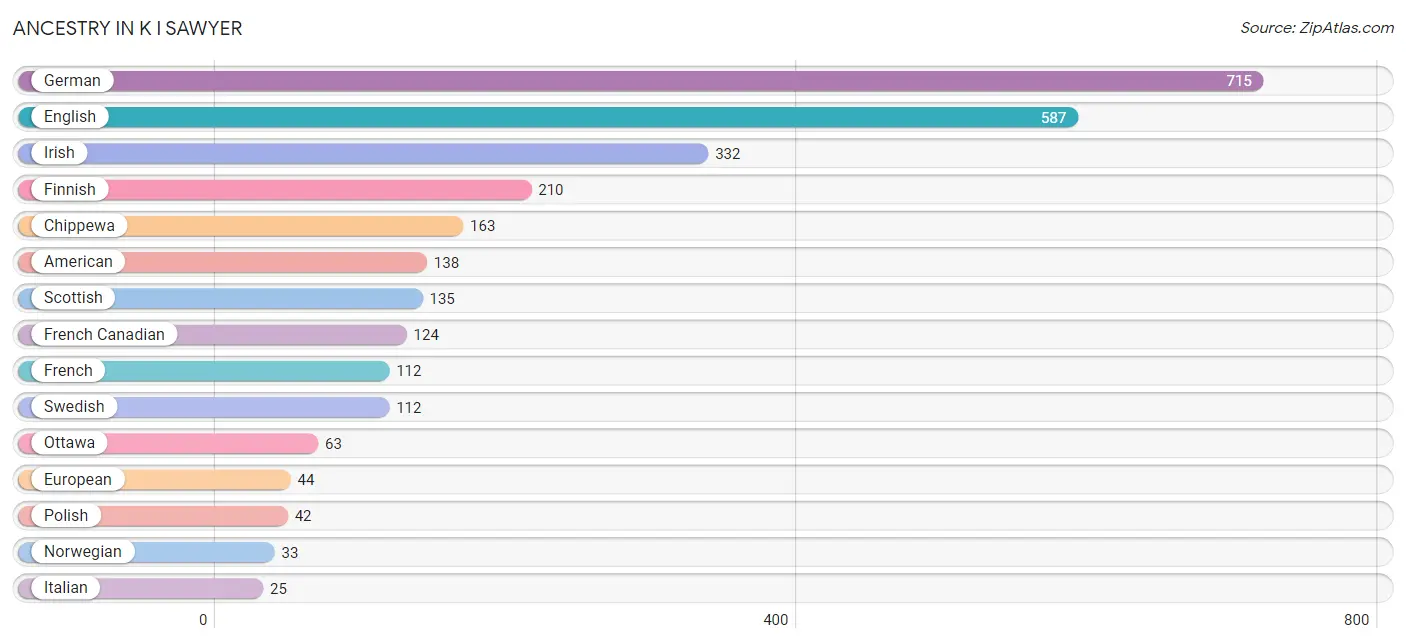
| Ancestry | # Population | % Population |
| American | 138 | 4.9% |
| Armenian | 6 | 0.2% |
| Austrian | 10 | 0.4% |
| Belgian | 6 | 0.2% |
| Bhutanese | 14 | 0.5% |
| Blackfeet | 22 | 0.8% |
| British | 8 | 0.3% |
| Bulgarian | 13 | 0.5% |
| Cherokee | 18 | 0.6% |
| Chippewa | 163 | 5.8% |
| Croatian | 24 | 0.9% |
| Czech | 3 | 0.1% |
| Danish | 10 | 0.4% |
| Dutch | 8 | 0.3% |
| Eastern European | 7 | 0.3% |
| English | 587 | 20.7% |
| Ethiopian | 6 | 0.2% |
| European | 44 | 1.5% |
| Finnish | 210 | 7.4% |
| French | 112 | 4.0% |
| French Canadian | 124 | 4.4% |
| German | 715 | 25.2% |
| Greek | 14 | 0.5% |
| Indian (Asian) | 5 | 0.2% |
| Irish | 332 | 11.7% |
| Italian | 25 | 0.9% |
| Korean | 16 | 0.6% |
| Lithuanian | 7 | 0.3% |
| Mexican | 6 | 0.2% |
| Native Hawaiian | 17 | 0.6% |
| Northern European | 8 | 0.3% |
| Norwegian | 33 | 1.2% |
| Ottawa | 63 | 2.2% |
| Polish | 42 | 1.5% |
| Potawatomi | 5 | 0.2% |
| Puerto Rican | 17 | 0.6% |
| Scotch-Irish | 22 | 0.8% |
| Scottish | 135 | 4.8% |
| Slovene | 22 | 0.8% |
| Subsaharan African | 6 | 0.2% |
| Swedish | 112 | 4.0% |
| Welsh | 7 | 0.3% |
| Yugoslavian | 4 | 0.1% | View All 43 Rows |
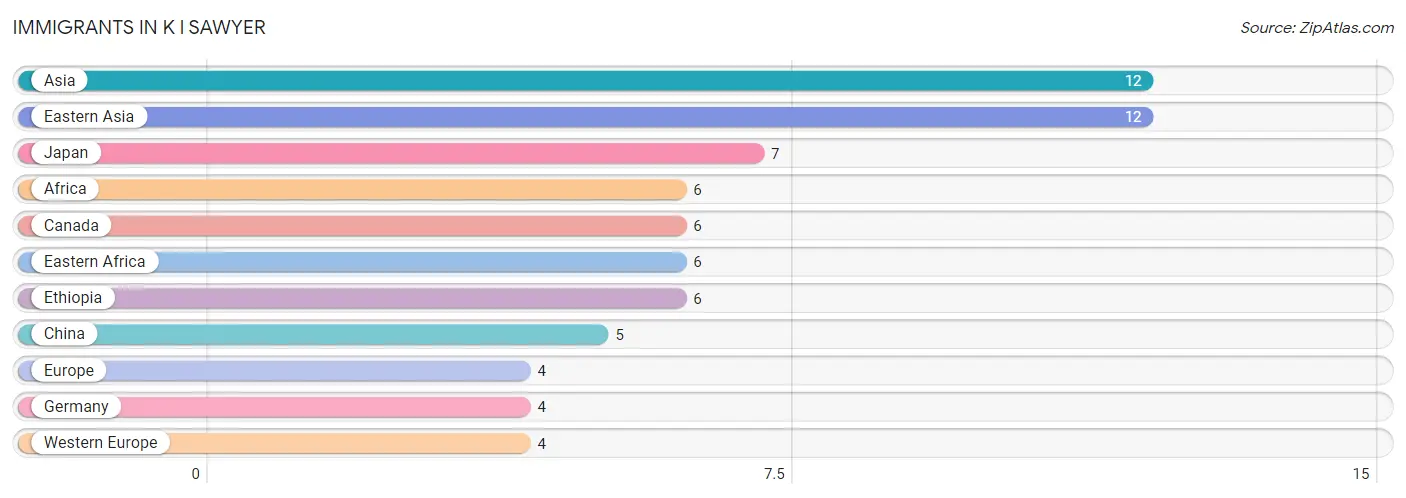
Immigrants in K I Sawyer
The most numerous immigrant groups reported in K I Sawyer came from Asia (12 | 0.4%), Eastern Asia (12 | 0.4%), Japan (7 | 0.3%), Africa (6 | 0.2%), and Canada (6 | 0.2%), together accounting for 1.5% of all K I Sawyer residents.
| Immigration Origin | # Population | % Population |
| Africa | 6 | 0.2% |
| Asia | 12 | 0.4% |
| Canada | 6 | 0.2% |
| China | 5 | 0.2% |
| Eastern Africa | 6 | 0.2% |
| Eastern Asia | 12 | 0.4% |
| Ethiopia | 6 | 0.2% |
| Europe | 4 | 0.1% |
| Germany | 4 | 0.1% |
| Japan | 7 | 0.3% |
| Western Europe | 4 | 0.1% | View All 11 Rows |
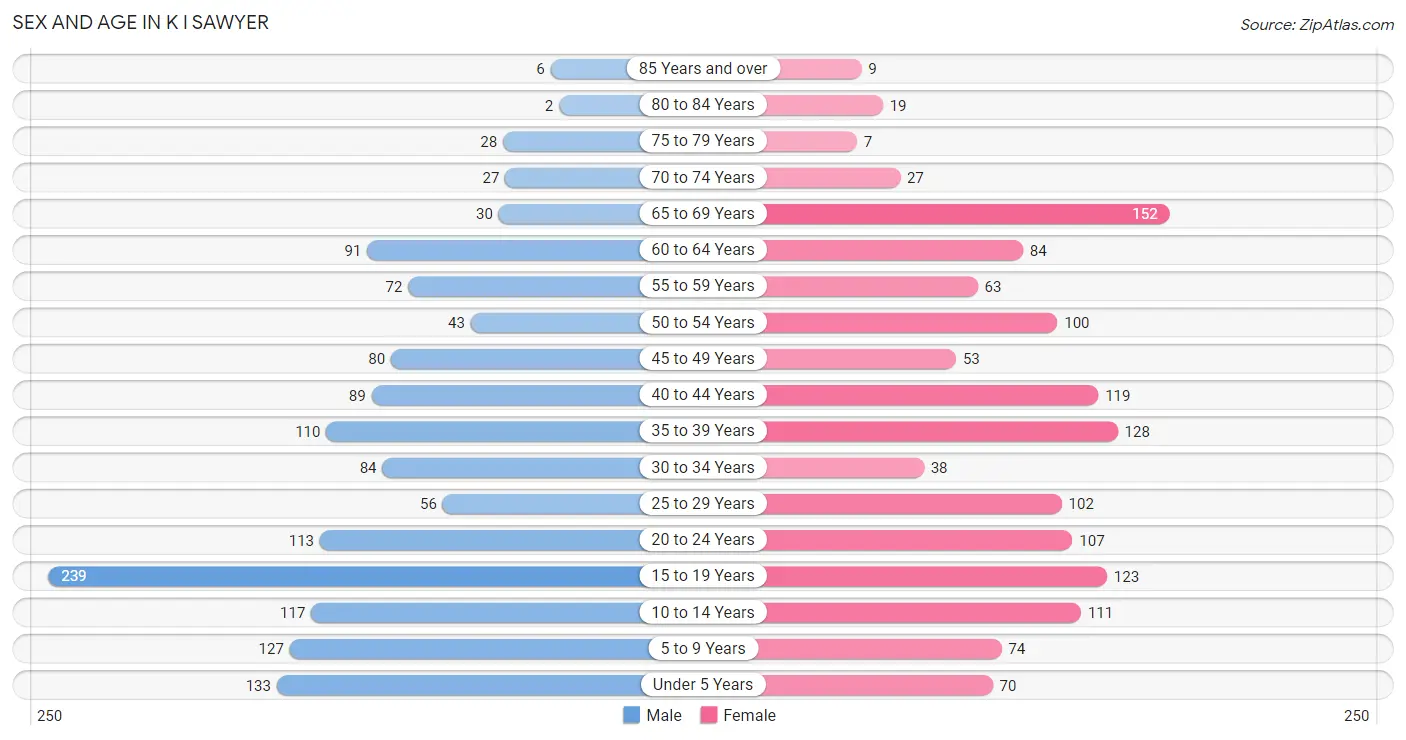
Sex and Age in K I Sawyer
Sex and Age in K I Sawyer
The most populous age groups in K I Sawyer are 15 to 19 Years (239 | 16.5%) for men and 65 to 69 Years (152 | 11.0%) for women.
| Age Bracket | Male | Female |
| Under 5 Years | 133 (9.2%) | 70 (5.1%) |
| 5 to 9 Years | 127 (8.8%) | 74 (5.3%) |
| 10 to 14 Years | 117 (8.1%) | 111 (8.0%) |
| 15 to 19 Years | 239 (16.5%) | 123 (8.9%) |
| 20 to 24 Years | 113 (7.8%) | 107 (7.7%) |
| 25 to 29 Years | 56 (3.9%) | 102 (7.4%) |
| 30 to 34 Years | 84 (5.8%) | 38 (2.7%) |
| 35 to 39 Years | 110 (7.6%) | 128 (9.2%) |
| 40 to 44 Years | 89 (6.1%) | 119 (8.6%) |
| 45 to 49 Years | 80 (5.5%) | 53 (3.8%) |
| 50 to 54 Years | 43 (3.0%) | 100 (7.2%) |
| 55 to 59 Years | 72 (5.0%) | 63 (4.5%) |
| 60 to 64 Years | 91 (6.3%) | 84 (6.1%) |
| 65 to 69 Years | 30 (2.1%) | 152 (11.0%) |
| 70 to 74 Years | 27 (1.9%) | 27 (1.9%) |
| 75 to 79 Years | 28 (1.9%) | 7 (0.5%) |
| 80 to 84 Years | 2 (0.1%) | 19 (1.4%) |
| 85 Years and over | 6 (0.4%) | 9 (0.6%) |
| Total | 1,447 (100.0%) | 1,386 (100.0%) |
Families and Households in K I Sawyer
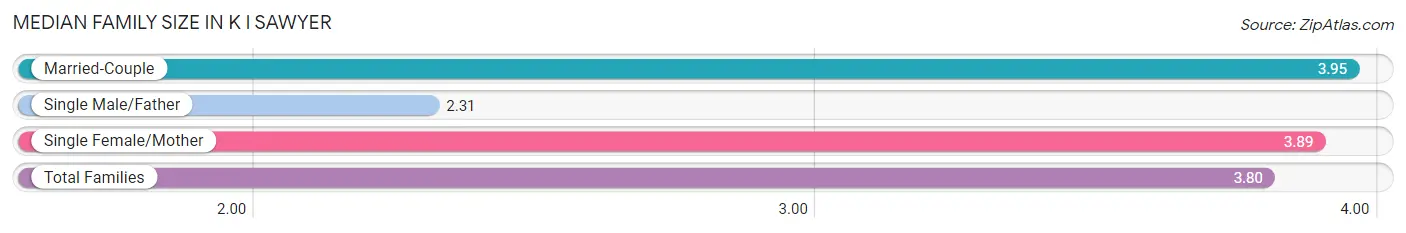
Median Family Size in K I Sawyer
The median family size in K I Sawyer is 3.80 persons per family, with married-couple families (371 | 66.4%) accounting for the largest median family size of 3.95 persons per family. On the other hand, single male/father families (48 | 8.6%) represent the smallest median family size with 2.31 persons per family.
| Family Type | # Families | Family Size |
| Married-Couple | 371 (66.4%) | 3.95 |
| Single Male/Father | 48 (8.6%) | 2.31 |
| Single Female/Mother | 140 (25.0%) | 3.89 |
| Total Families | 559 (100.0%) | 3.80 |
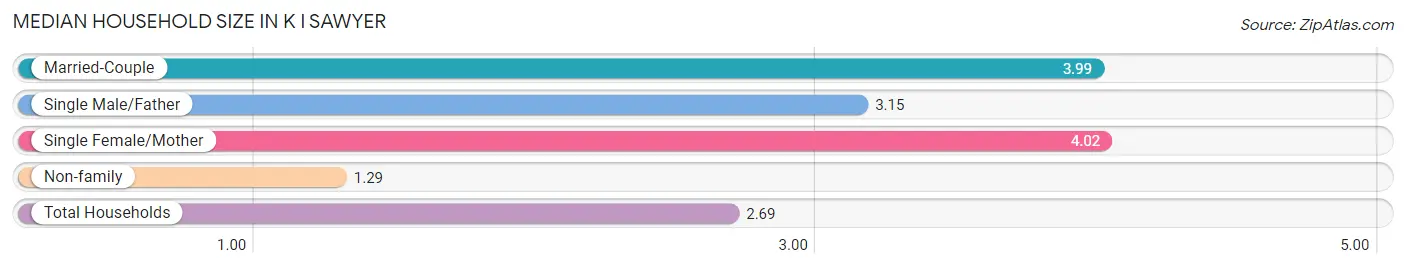
Median Household Size in K I Sawyer
The median household size in K I Sawyer is 2.69 persons per household, with single female/mother households (140 | 13.3%) accounting for the largest median household size of 4.02 persons per household. non-family households (492 | 46.8%) represent the smallest median household size with 1.29 persons per household.
| Household Type | # Households | Household Size |
| Married-Couple | 371 (35.3%) | 3.99 |
| Single Male/Father | 48 (4.6%) | 3.15 |
| Single Female/Mother | 140 (13.3%) | 4.02 |
| Non-family | 492 (46.8%) | 1.29 |
| Total Households | 1,051 (100.0%) | 2.69 |
Household Size by Marriage Status in K I Sawyer
Out of a total of 1,051 households in K I Sawyer, 559 (53.2%) are family households, while 492 (46.8%) are nonfamily households. The most numerous type of family households are 2-person households, comprising 177, and the most common type of nonfamily households are 1-person households, comprising 379.
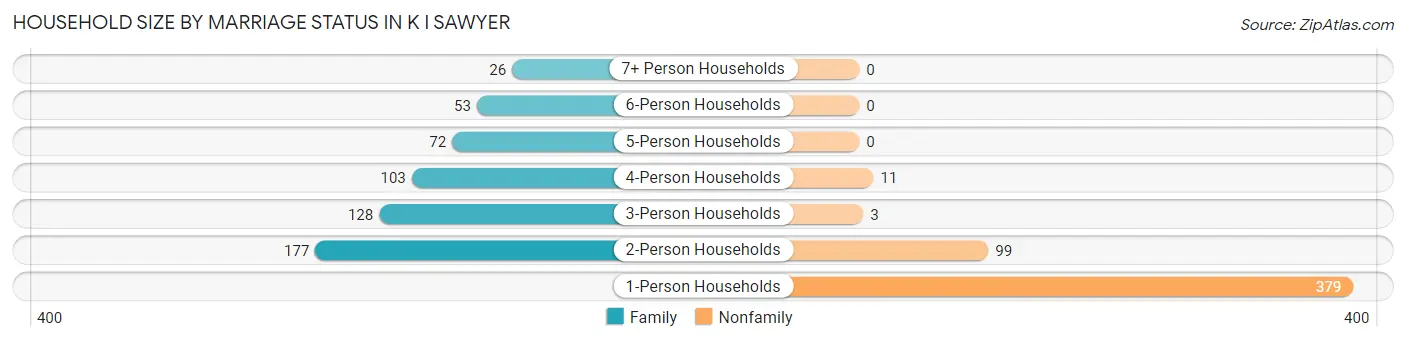
| Household Size | Family Households | Nonfamily Households |
| 1-Person Households | - | 379 (36.1%) |
| 2-Person Households | 177 (16.8%) | 99 (9.4%) |
| 3-Person Households | 128 (12.2%) | 3 (0.3%) |
| 4-Person Households | 103 (9.8%) | 11 (1.1%) |
| 5-Person Households | 72 (6.9%) | 0 (0.0%) |
| 6-Person Households | 53 (5.0%) | 0 (0.0%) |
| 7+ Person Households | 26 (2.5%) | 0 (0.0%) |
| Total | 559 (53.2%) | 492 (46.8%) |
Female Fertility in K I Sawyer
Fertility by Age in K I Sawyer
Average fertility rate in K I Sawyer is 38.0 births per 1,000 women. Women in the age bracket of 15 to 19 years have the highest fertility rate with 65.0 births per 1,000 women. Women in the age bracket of 20 to 34 years acount for 59.3% of all women with births.
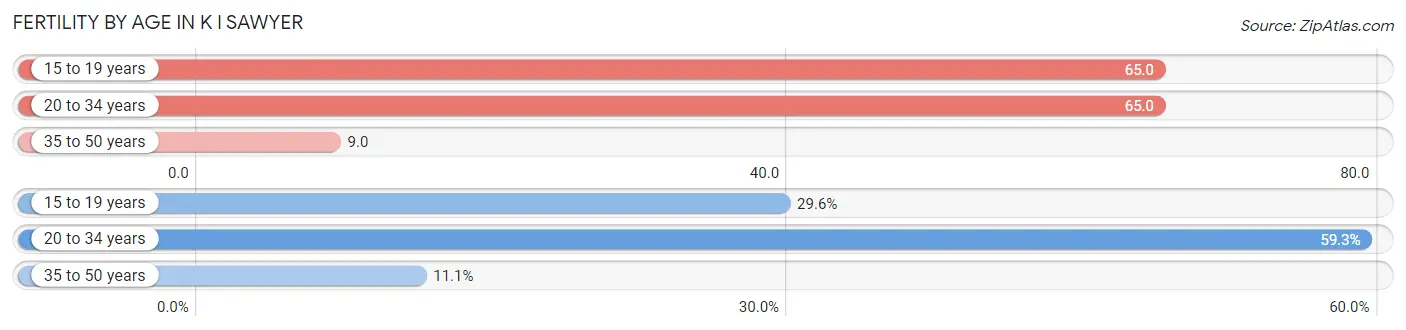
| Age Bracket | Women with Births | Births / 1,000 Women |
| 15 to 19 years | 8 (29.6%) | 65.0 |
| 20 to 34 years | 16 (59.3%) | 65.0 |
| 35 to 50 years | 3 (11.1%) | 9.0 |
| Total | 27 (100.0%) | 38.0 |
Fertility by Age by Marriage Status in K I Sawyer
14.8% of women with births (27) in K I Sawyer are married. The highest percentage of unmarried women with births falls into 15 to 19 years age bracket with 100.0% of them unmarried at the time of birth, while the lowest percentage of unmarried women with births belong to 20 to 34 years age bracket with 75.0% of them unmarried.
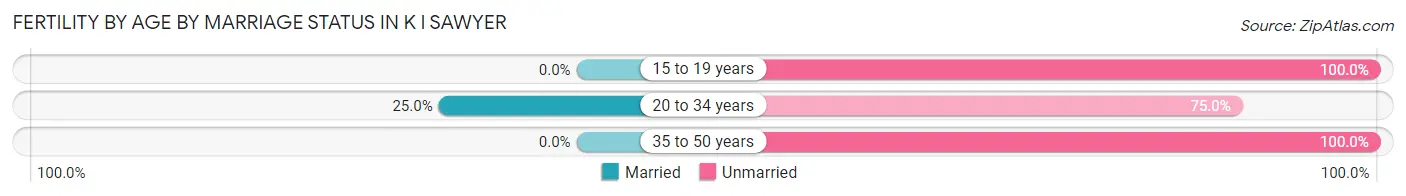
| Age Bracket | Married | Unmarried |
| 15 to 19 years | 0 (0.0%) | 8 (100.0%) |
| 20 to 34 years | 4 (25.0%) | 12 (75.0%) |
| 35 to 50 years | 0 (0.0%) | 3 (100.0%) |
| Total | 4 (14.8%) | 23 (85.2%) |
Fertility by Education in K I Sawyer
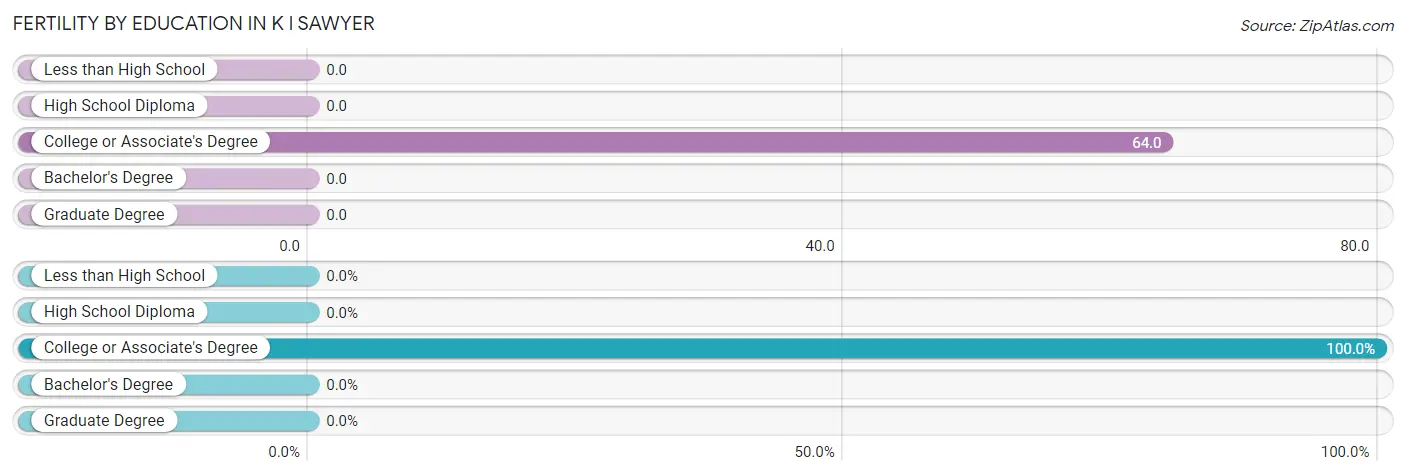
| Educational Attainment | Women with Births | Births / 1,000 Women |
| Less than High School | 0 (0.0%) | 0.0 |
| High School Diploma | 0 (0.0%) | 0.0 |
| College or Associate's Degree | 27 (100.0%) | 64.0 |
| Bachelor's Degree | 0 (0.0%) | 0.0 |
| Graduate Degree | 0 (0.0%) | 0.0 |
| Total | 27 (100.0%) | 38.0 |
Fertility by Education by Marriage Status in K I Sawyer
85.2% of women with births in K I Sawyer are unmarried. Women with the educational attainment of college or associate's degree are most likely to be married with 14.8% of them married at childbirth, while women with the educational attainment of college or associate's degree are least likely to be married with 85.2% of them unmarried at childbirth.
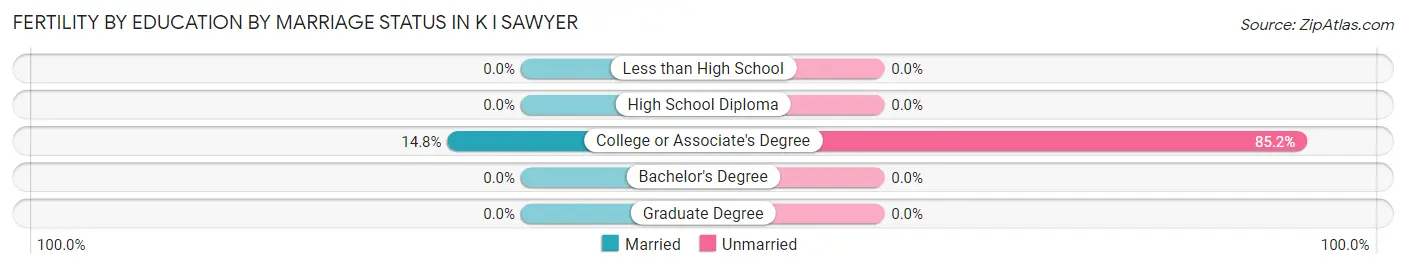
| Educational Attainment | Married | Unmarried |
| Less than High School | 0 (0.0%) | 0 (0.0%) |
| High School Diploma | 0 (0.0%) | 0 (0.0%) |
| College or Associate's Degree | 4 (14.8%) | 23 (85.2%) |
| Bachelor's Degree | 0 (0.0%) | 0 (0.0%) |
| Graduate Degree | 0 (0.0%) | 0 (0.0%) |
| Total | 4 (14.8%) | 23 (85.2%) |
Employment Characteristics in K I Sawyer
Employment by Class of Employer in K I Sawyer
Among the 1,090 employed individuals in K I Sawyer, private company employees (728 | 66.8%), local government employees (109 | 10.0%), and not-for-profit organizations (105 | 9.6%) make up the most common classes of employment.
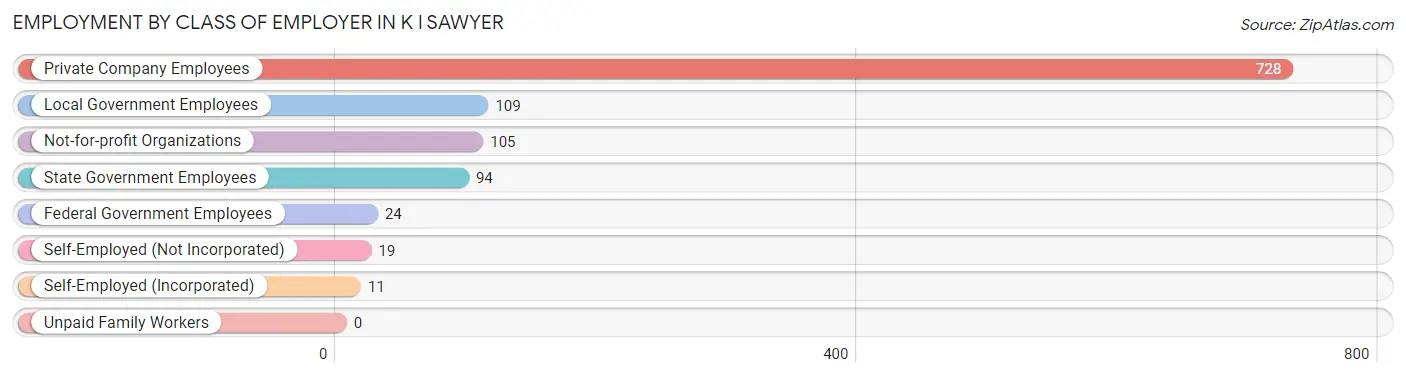
| Employer Class | # Employees | % Employees |
| Private Company Employees | 728 | 66.8% |
| Self-Employed (Incorporated) | 11 | 1.0% |
| Self-Employed (Not Incorporated) | 19 | 1.7% |
| Not-for-profit Organizations | 105 | 9.6% |
| Local Government Employees | 109 | 10.0% |
| State Government Employees | 94 | 8.6% |
| Federal Government Employees | 24 | 2.2% |
| Unpaid Family Workers | 0 | 0.0% |
| Total | 1,090 | 100.0% |
Employment Status by Age in K I Sawyer
According to the labor force statistics for K I Sawyer, out of the total population over 16 years of age (2,093), 56.6% or 1,185 individuals are in the labor force, with 4.7% or 56 of them unemployed. The age group with the highest labor force participation rate is 30 to 34 years, with 88.5% or 108 individuals in the labor force. Within the labor force, the 30 to 34 years age range has the highest percentage of unemployed individuals, with 11.1% or 12 of them being unemployed.
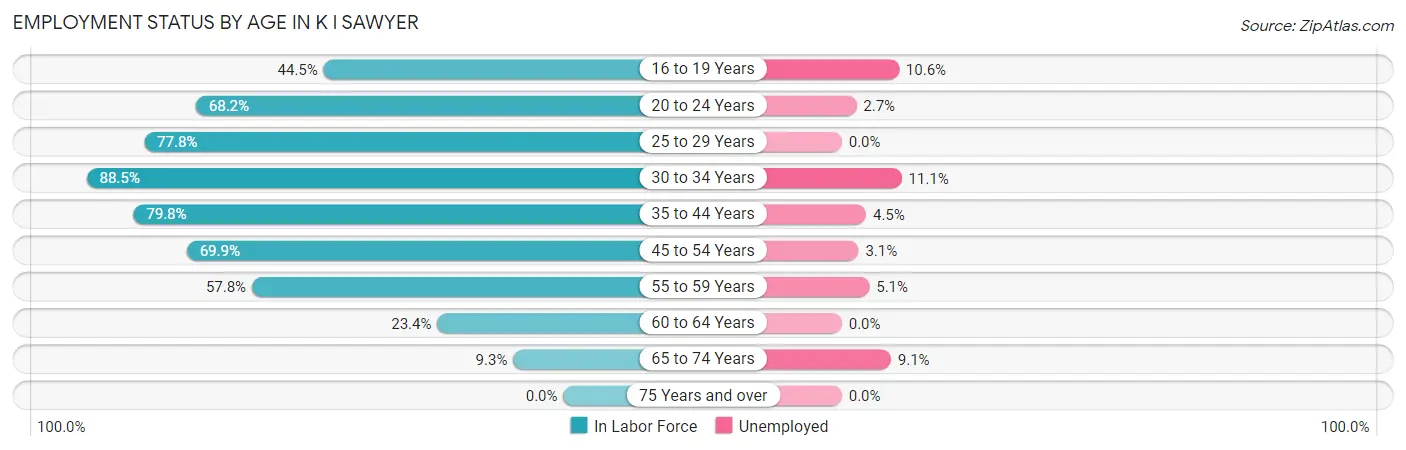
| Age Bracket | In Labor Force | Unemployed |
| 16 to 19 Years | 113 (44.5%) | 12 (10.6%) |
| 20 to 24 Years | 150 (68.2%) | 4 (2.7%) |
| 25 to 29 Years | 123 (77.8%) | 0 (0.0%) |
| 30 to 34 Years | 108 (88.5%) | 12 (11.1%) |
| 35 to 44 Years | 356 (79.8%) | 16 (4.5%) |
| 45 to 54 Years | 193 (69.9%) | 6 (3.1%) |
| 55 to 59 Years | 78 (57.8%) | 4 (5.1%) |
| 60 to 64 Years | 41 (23.4%) | 0 (0.0%) |
| 65 to 74 Years | 22 (9.3%) | 2 (9.1%) |
| 75 Years and over | 0 (0.0%) | 0 (0.0%) |
| Total | 1,185 (56.6%) | 56 (4.7%) |
Employment Status by Educational Attainment in K I Sawyer
According to labor force statistics for K I Sawyer, 68.5% of individuals (899) out of the total population between 25 and 64 years of age (1,312) are in the labor force, with 4.2% or 38 of them being unemployed. The group with the highest labor force participation rate are those with the educational attainment of bachelor's degree or higher, with 80.9% or 169 individuals in the labor force. Within the labor force, individuals with high school diploma education have the highest percentage of unemployment, with 6.0% or 15 of them being unemployed.
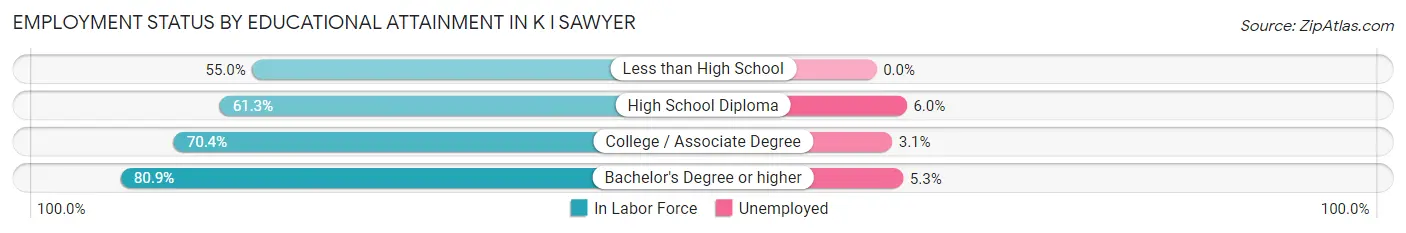
| Educational Attainment | In Labor Force | Unemployed |
| Less than High School | 33 (55.0%) | 0 (0.0%) |
| High School Diploma | 250 (61.3%) | 24 (6.0%) |
| College / Associate Degree | 447 (70.4%) | 20 (3.1%) |
| Bachelor's Degree or higher | 169 (80.9%) | 11 (5.3%) |
| Total | 899 (68.5%) | 55 (4.2%) |
Employment Occupations by Sex in K I Sawyer
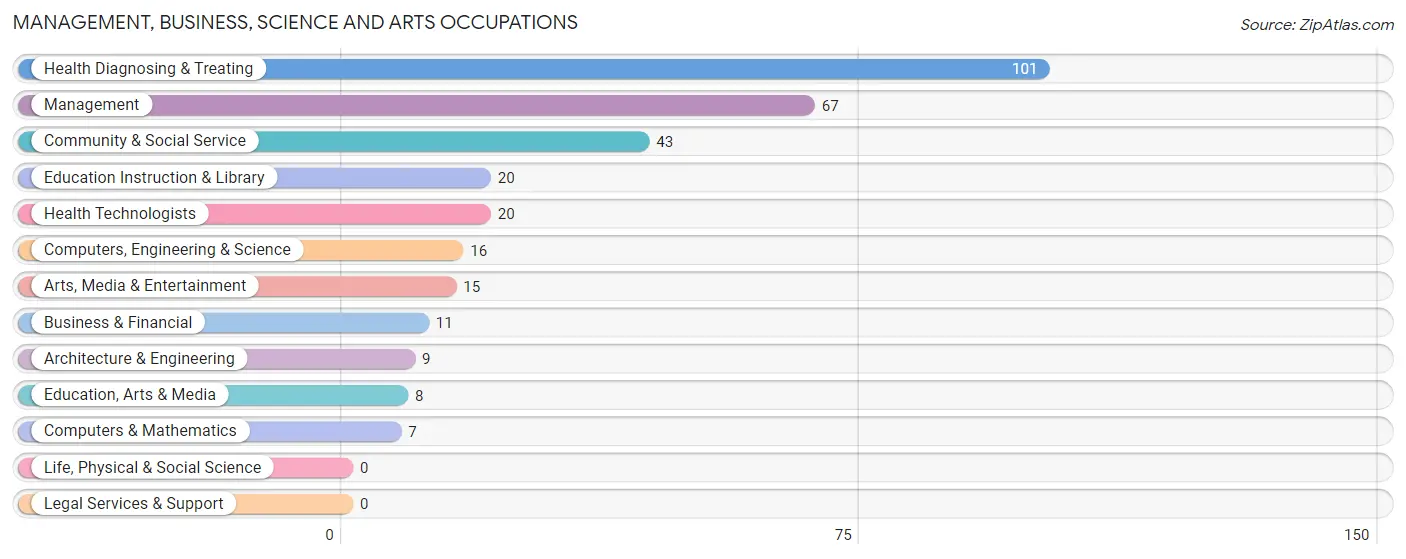
Management, Business, Science and Arts Occupations
The most common Management, Business, Science and Arts occupations in K I Sawyer are Health Diagnosing & Treating (101 | 8.9%), Management (67 | 5.9%), Community & Social Service (43 | 3.8%), Education Instruction & Library (20 | 1.8%), and Health Technologists (20 | 1.8%).
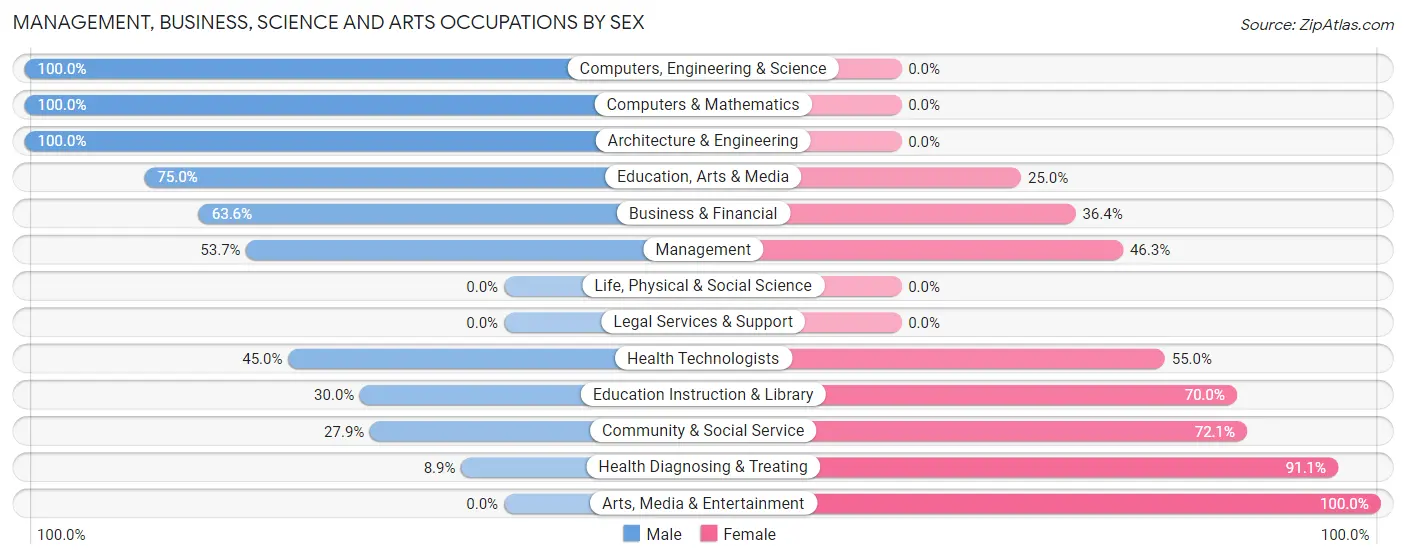
Management, Business, Science and Arts Occupations by Sex
Within the Management, Business, Science and Arts occupations in K I Sawyer, the most male-oriented occupations are Computers, Engineering & Science (100.0%), Computers & Mathematics (100.0%), and Architecture & Engineering (100.0%), while the most female-oriented occupations are Arts, Media & Entertainment (100.0%), Health Diagnosing & Treating (91.1%), and Community & Social Service (72.1%).
| Occupation | Male | Female |
| Management | 36 (53.7%) | 31 (46.3%) |
| Business & Financial | 7 (63.6%) | 4 (36.4%) |
| Computers, Engineering & Science | 16 (100.0%) | 0 (0.0%) |
| Computers & Mathematics | 7 (100.0%) | 0 (0.0%) |
| Architecture & Engineering | 9 (100.0%) | 0 (0.0%) |
| Life, Physical & Social Science | 0 (0.0%) | 0 (0.0%) |
| Community & Social Service | 12 (27.9%) | 31 (72.1%) |
| Education, Arts & Media | 6 (75.0%) | 2 (25.0%) |
| Legal Services & Support | 0 (0.0%) | 0 (0.0%) |
| Education Instruction & Library | 6 (30.0%) | 14 (70.0%) |
| Arts, Media & Entertainment | 0 (0.0%) | 15 (100.0%) |
| Health Diagnosing & Treating | 9 (8.9%) | 92 (91.1%) |
| Health Technologists | 9 (45.0%) | 11 (55.0%) |
| Total (Category) | 80 (33.6%) | 158 (66.4%) |
| Total (Overall) | 645 (57.2%) | 483 (42.8%) |
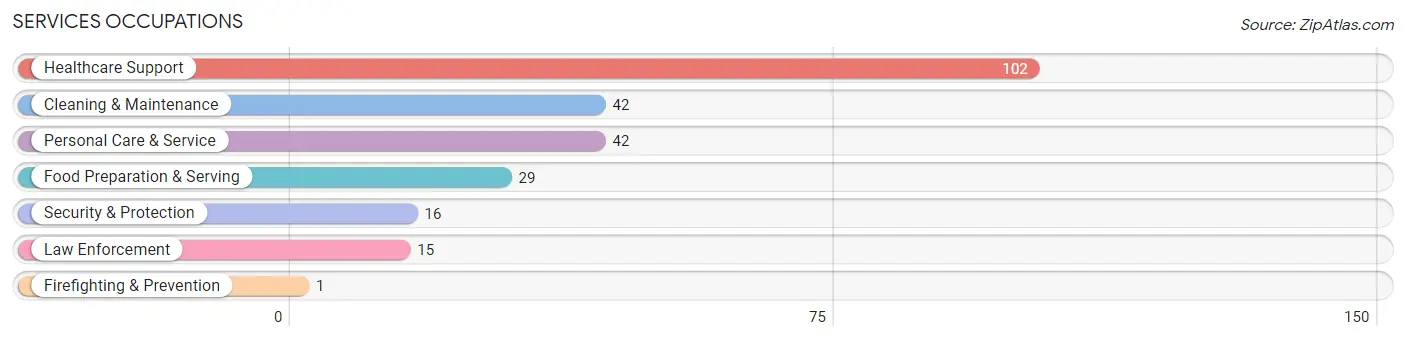
Services Occupations
The most common Services occupations in K I Sawyer are Healthcare Support (102 | 9.0%), Cleaning & Maintenance (42 | 3.7%), Personal Care & Service (42 | 3.7%), Food Preparation & Serving (29 | 2.6%), and Security & Protection (16 | 1.4%).
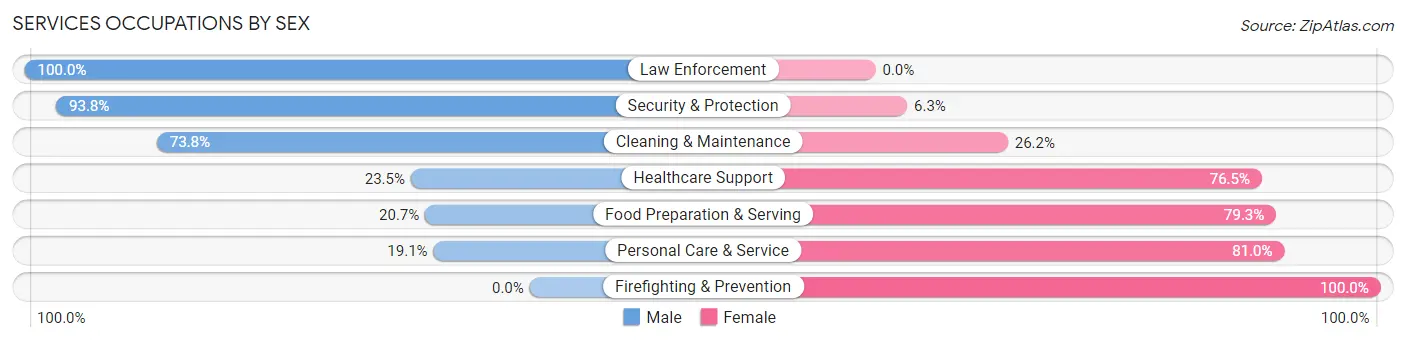
Services Occupations by Sex
Within the Services occupations in K I Sawyer, the most male-oriented occupations are Law Enforcement (100.0%), Security & Protection (93.8%), and Cleaning & Maintenance (73.8%), while the most female-oriented occupations are Firefighting & Prevention (100.0%), Personal Care & Service (80.9%), and Food Preparation & Serving (79.3%).
| Occupation | Male | Female |
| Healthcare Support | 24 (23.5%) | 78 (76.5%) |
| Security & Protection | 15 (93.8%) | 1 (6.2%) |
| Firefighting & Prevention | 0 (0.0%) | 1 (100.0%) |
| Law Enforcement | 15 (100.0%) | 0 (0.0%) |
| Food Preparation & Serving | 6 (20.7%) | 23 (79.3%) |
| Cleaning & Maintenance | 31 (73.8%) | 11 (26.2%) |
| Personal Care & Service | 8 (19.1%) | 34 (80.9%) |
| Total (Category) | 84 (36.4%) | 147 (63.6%) |
| Total (Overall) | 645 (57.2%) | 483 (42.8%) |
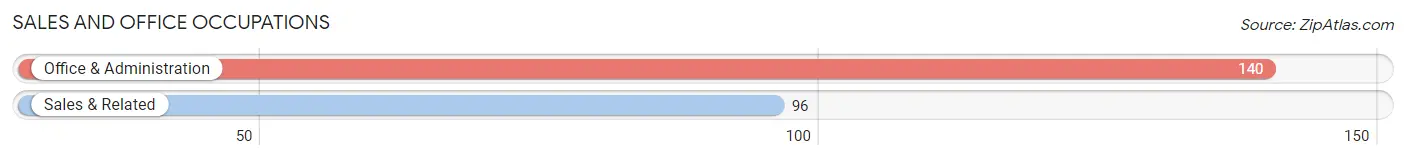
Sales and Office Occupations
The most common Sales and Office occupations in K I Sawyer are Office & Administration (140 | 12.4%), and Sales & Related (96 | 8.5%).
Sales and Office Occupations by Sex
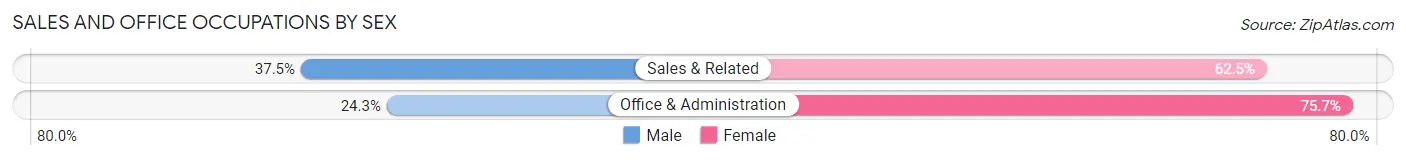
| Occupation | Male | Female |
| Sales & Related | 36 (37.5%) | 60 (62.5%) |
| Office & Administration | 34 (24.3%) | 106 (75.7%) |
| Total (Category) | 70 (29.7%) | 166 (70.3%) |
| Total (Overall) | 645 (57.2%) | 483 (42.8%) |
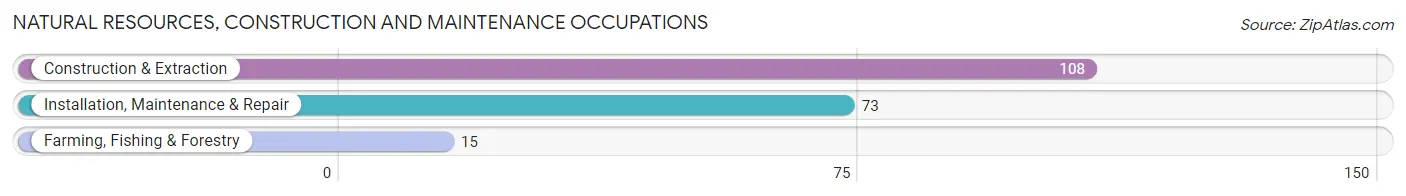
Natural Resources, Construction and Maintenance Occupations
The most common Natural Resources, Construction and Maintenance occupations in K I Sawyer are Construction & Extraction (108 | 9.6%), Installation, Maintenance & Repair (73 | 6.5%), and Farming, Fishing & Forestry (15 | 1.3%).
Natural Resources, Construction and Maintenance Occupations by Sex
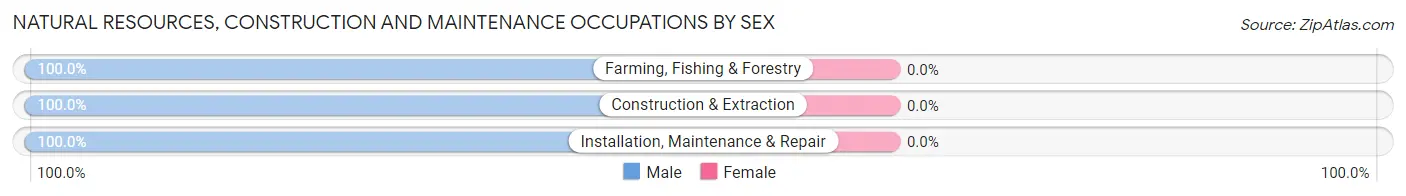
| Occupation | Male | Female |
| Farming, Fishing & Forestry | 15 (100.0%) | 0 (0.0%) |
| Construction & Extraction | 108 (100.0%) | 0 (0.0%) |
| Installation, Maintenance & Repair | 73 (100.0%) | 0 (0.0%) |
| Total (Category) | 196 (100.0%) | 0 (0.0%) |
| Total (Overall) | 645 (57.2%) | 483 (42.8%) |
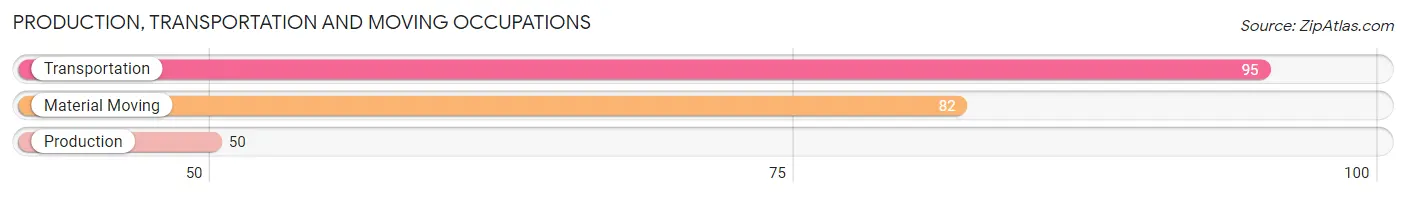
Production, Transportation and Moving Occupations
The most common Production, Transportation and Moving occupations in K I Sawyer are Transportation (95 | 8.4%), Material Moving (82 | 7.3%), and Production (50 | 4.4%).
Production, Transportation and Moving Occupations by Sex
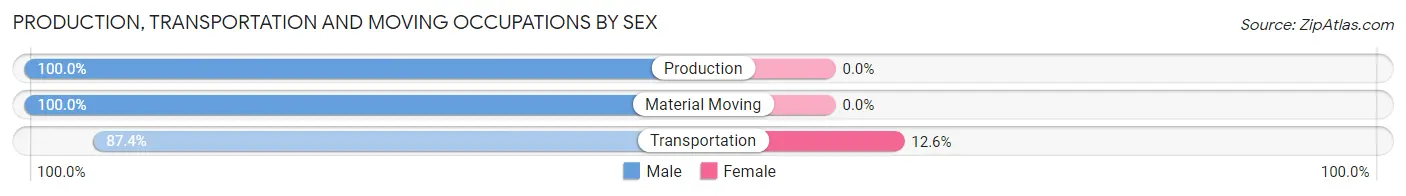
| Occupation | Male | Female |
| Production | 50 (100.0%) | 0 (0.0%) |
| Transportation | 83 (87.4%) | 12 (12.6%) |
| Material Moving | 82 (100.0%) | 0 (0.0%) |
| Total (Category) | 215 (94.7%) | 12 (5.3%) |
| Total (Overall) | 645 (57.2%) | 483 (42.8%) |
Employment Industries by Sex in K I Sawyer
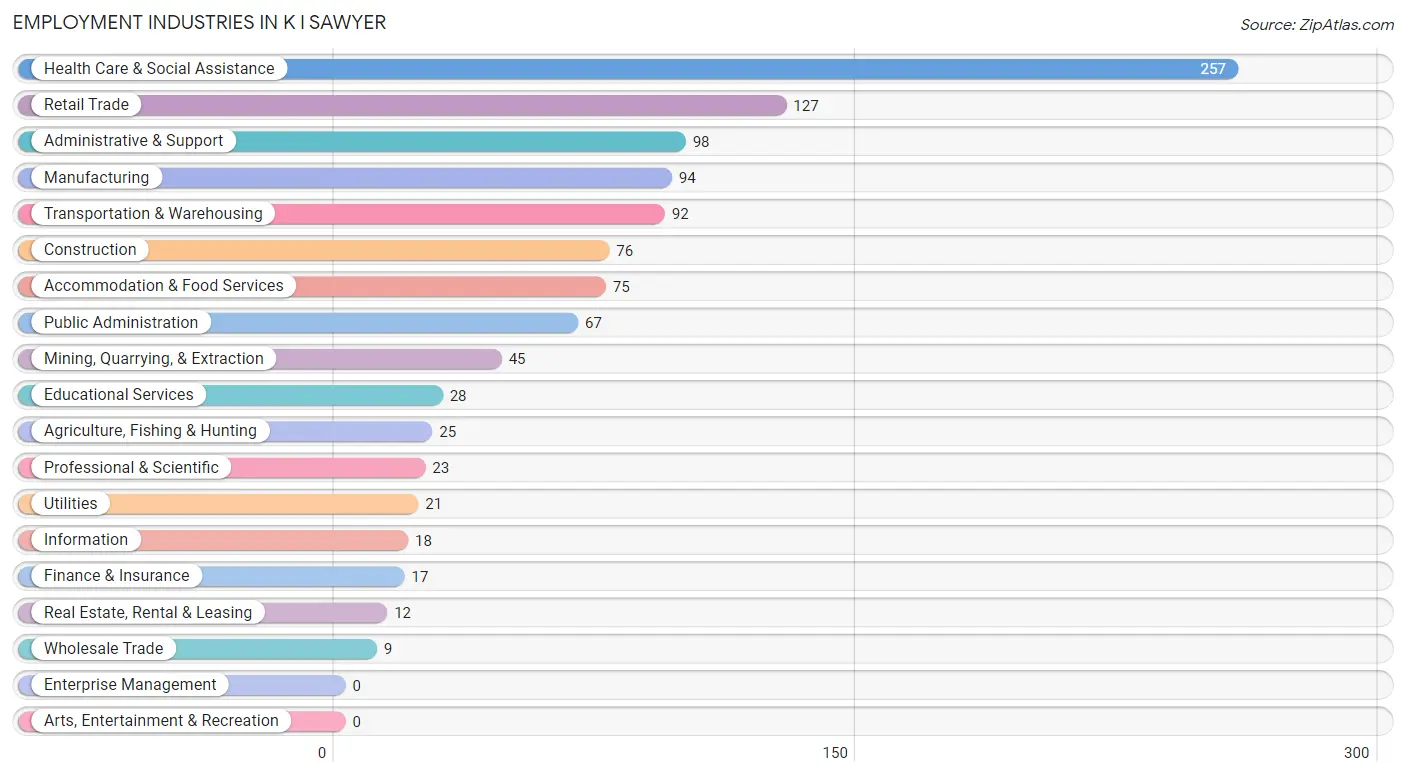
Employment Industries in K I Sawyer
The major employment industries in K I Sawyer include Health Care & Social Assistance (257 | 22.8%), Retail Trade (127 | 11.3%), Administrative & Support (98 | 8.7%), Manufacturing (94 | 8.3%), and Transportation & Warehousing (92 | 8.2%).
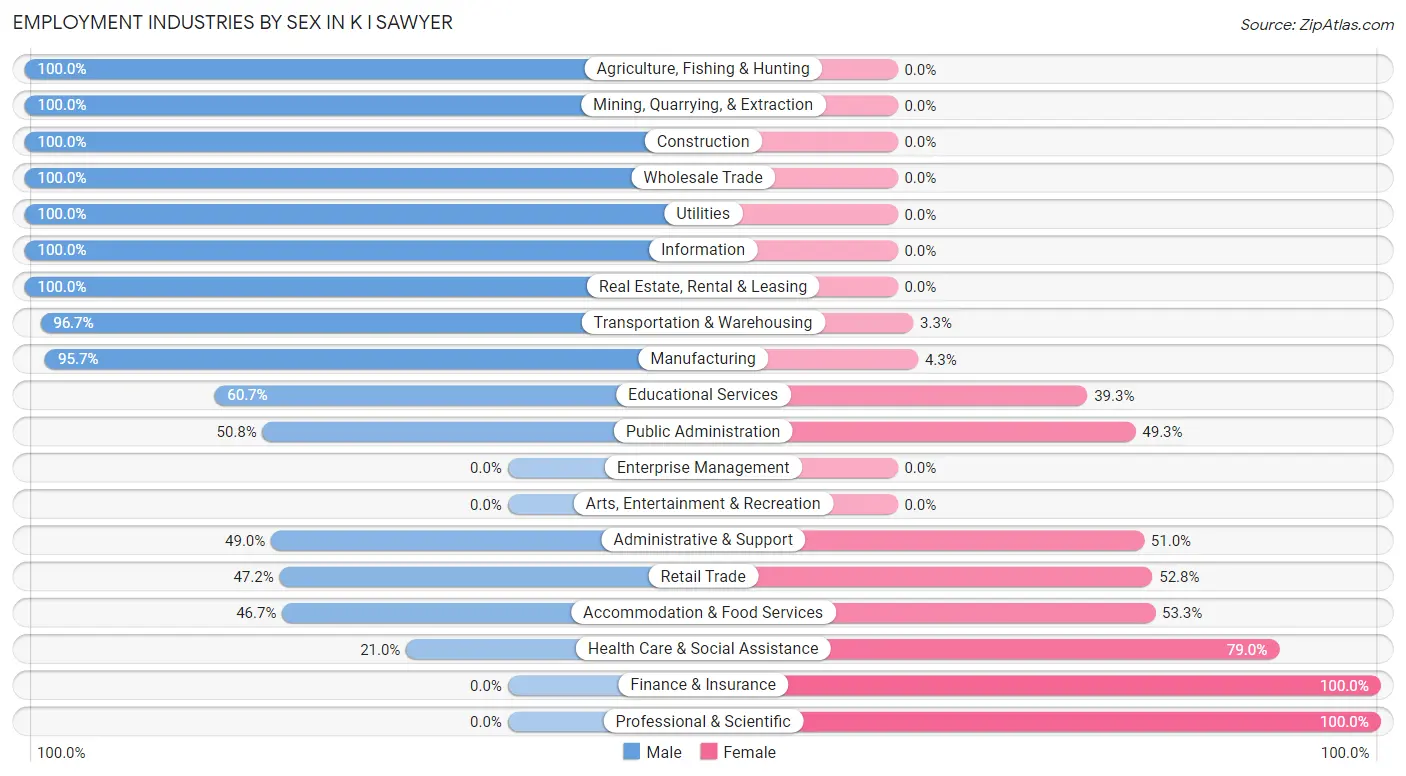
Employment Industries by Sex in K I Sawyer
The K I Sawyer industries that see more men than women are Agriculture, Fishing & Hunting (100.0%), Mining, Quarrying, & Extraction (100.0%), and Construction (100.0%), whereas the industries that tend to have a higher number of women are Finance & Insurance (100.0%), Professional & Scientific (100.0%), and Health Care & Social Assistance (79.0%).
| Industry | Male | Female |
| Agriculture, Fishing & Hunting | 25 (100.0%) | 0 (0.0%) |
| Mining, Quarrying, & Extraction | 45 (100.0%) | 0 (0.0%) |
| Construction | 76 (100.0%) | 0 (0.0%) |
| Manufacturing | 90 (95.7%) | 4 (4.3%) |
| Wholesale Trade | 9 (100.0%) | 0 (0.0%) |
| Retail Trade | 60 (47.2%) | 67 (52.8%) |
| Transportation & Warehousing | 89 (96.7%) | 3 (3.3%) |
| Utilities | 21 (100.0%) | 0 (0.0%) |
| Information | 18 (100.0%) | 0 (0.0%) |
| Finance & Insurance | 0 (0.0%) | 17 (100.0%) |
| Real Estate, Rental & Leasing | 12 (100.0%) | 0 (0.0%) |
| Professional & Scientific | 0 (0.0%) | 23 (100.0%) |
| Enterprise Management | 0 (0.0%) | 0 (0.0%) |
| Administrative & Support | 48 (49.0%) | 50 (51.0%) |
| Educational Services | 17 (60.7%) | 11 (39.3%) |
| Health Care & Social Assistance | 54 (21.0%) | 203 (79.0%) |
| Arts, Entertainment & Recreation | 0 (0.0%) | 0 (0.0%) |
| Accommodation & Food Services | 35 (46.7%) | 40 (53.3%) |
| Public Administration | 34 (50.7%) | 33 (49.2%) |
| Total | 645 (57.2%) | 483 (42.8%) |
Education in K I Sawyer
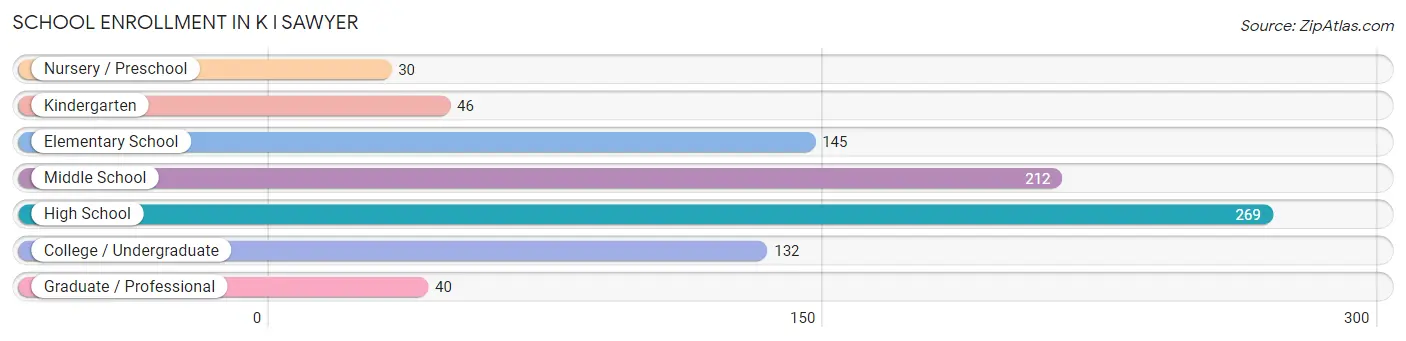
School Enrollment in K I Sawyer
The most common levels of schooling among the 874 students in K I Sawyer are high school (269 | 30.8%), middle school (212 | 24.3%), and elementary school (145 | 16.6%).
| School Level | # Students | % Students |
| Nursery / Preschool | 30 | 3.4% |
| Kindergarten | 46 | 5.3% |
| Elementary School | 145 | 16.6% |
| Middle School | 212 | 24.3% |
| High School | 269 | 30.8% |
| College / Undergraduate | 132 | 15.1% |
| Graduate / Professional | 40 | 4.6% |
| Total | 874 | 100.0% |
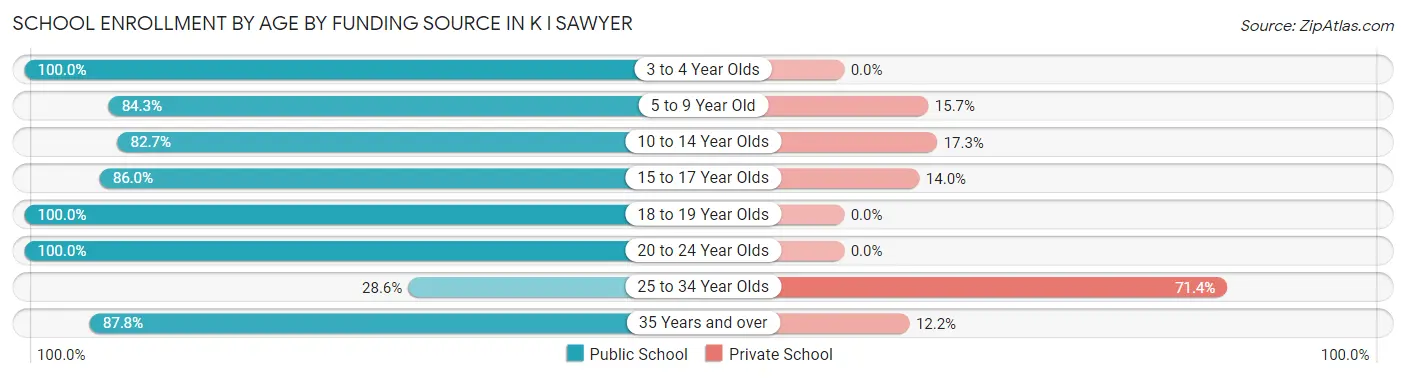
School Enrollment by Age by Funding Source in K I Sawyer
Out of a total of 874 students who are enrolled in schools in K I Sawyer, 116 (13.3%) attend a private institution, while the remaining 758 (86.7%) are enrolled in public schools. The age group of 25 to 34 year olds has the highest likelihood of being enrolled in private schools, with 10 (71.4% in the age bracket) enrolled. Conversely, the age group of 3 to 4 year olds has the lowest likelihood of being enrolled in a private school, with 17 (100.0% in the age bracket) attending a public institution.
| Age Bracket | Public School | Private School |
| 3 to 4 Year Olds | 17 (100.0%) | 0 (0.0%) |
| 5 to 9 Year Old | 156 (84.3%) | 29 (15.7%) |
| 10 to 14 Year Olds | 186 (82.7%) | 39 (17.3%) |
| 15 to 17 Year Olds | 178 (86.0%) | 29 (14.0%) |
| 18 to 19 Year Olds | 83 (100.0%) | 0 (0.0%) |
| 20 to 24 Year Olds | 69 (100.0%) | 0 (0.0%) |
| 25 to 34 Year Olds | 4 (28.6%) | 10 (71.4%) |
| 35 Years and over | 65 (87.8%) | 9 (12.2%) |
| Total | 758 (86.7%) | 116 (13.3%) |
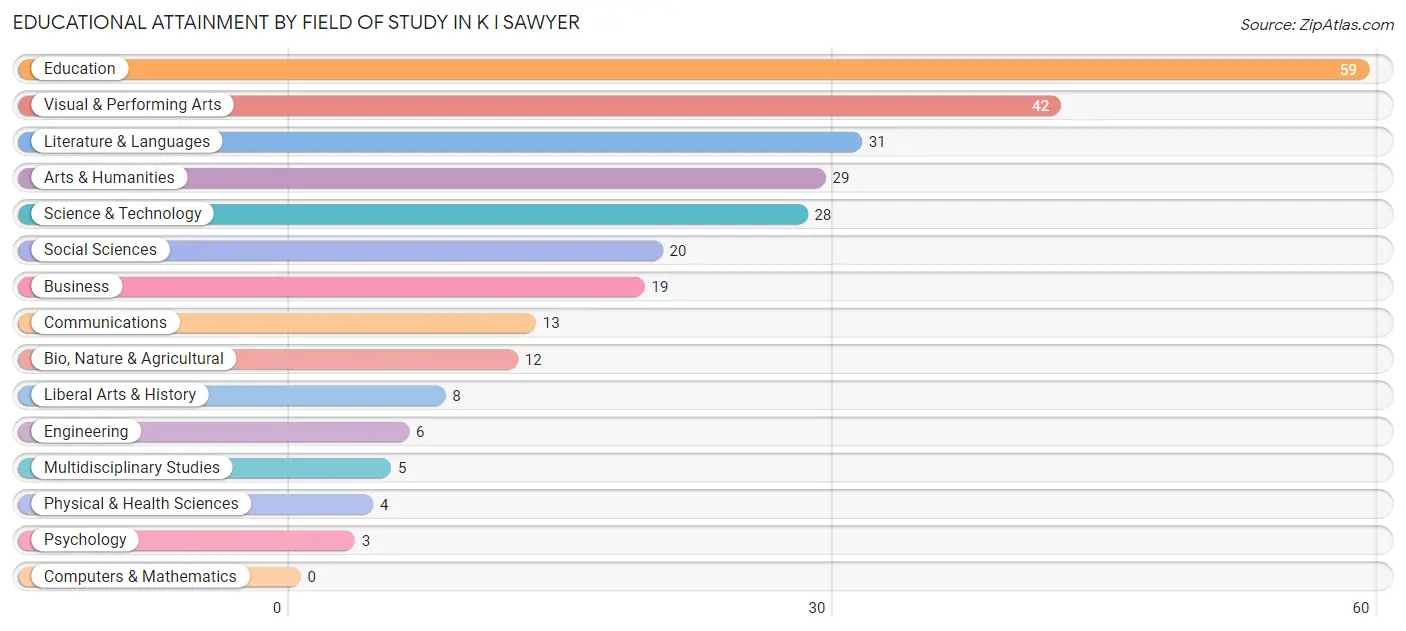
Educational Attainment by Field of Study in K I Sawyer
Education (59 | 21.1%), visual & performing arts (42 | 15.0%), literature & languages (31 | 11.1%), arts & humanities (29 | 10.4%), and science & technology (28 | 10.0%) are the most common fields of study among 279 individuals in K I Sawyer who have obtained a bachelor's degree or higher.
| Field of Study | # Graduates | % Graduates |
| Computers & Mathematics | 0 | 0.0% |
| Bio, Nature & Agricultural | 12 | 4.3% |
| Physical & Health Sciences | 4 | 1.4% |
| Psychology | 3 | 1.1% |
| Social Sciences | 20 | 7.2% |
| Engineering | 6 | 2.1% |
| Multidisciplinary Studies | 5 | 1.8% |
| Science & Technology | 28 | 10.0% |
| Business | 19 | 6.8% |
| Education | 59 | 21.1% |
| Literature & Languages | 31 | 11.1% |
| Liberal Arts & History | 8 | 2.9% |
| Visual & Performing Arts | 42 | 15.0% |
| Communications | 13 | 4.7% |
| Arts & Humanities | 29 | 10.4% |
| Total | 279 | 100.0% |
Transportation & Commute in K I Sawyer
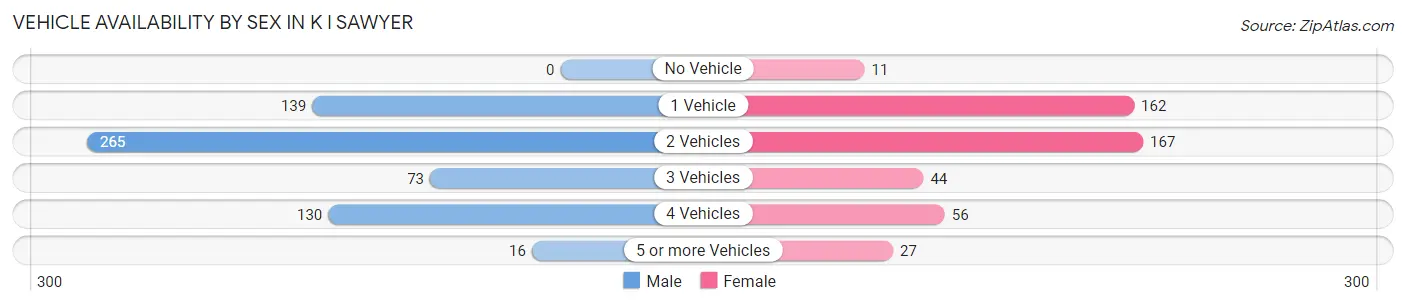
Vehicle Availability by Sex in K I Sawyer
The most prevalent vehicle ownership categories in K I Sawyer are males with 2 vehicles (265, accounting for 42.5%) and females with 2 vehicles (167, making up 56.8%).
| Vehicles Available | Male | Female |
| No Vehicle | 0 (0.0%) | 11 (2.4%) |
| 1 Vehicle | 139 (22.3%) | 162 (34.7%) |
| 2 Vehicles | 265 (42.5%) | 167 (35.8%) |
| 3 Vehicles | 73 (11.7%) | 44 (9.4%) |
| 4 Vehicles | 130 (20.9%) | 56 (12.0%) |
| 5 or more Vehicles | 16 (2.6%) | 27 (5.8%) |
| Total | 623 (100.0%) | 467 (100.0%) |
Commute Time in K I Sawyer
The most frequently occuring commute durations in K I Sawyer are 5 to 9 minutes (233 commuters, 22.0%), 10 to 14 minutes (194 commuters, 18.3%), and 30 to 34 minutes (191 commuters, 18.0%).
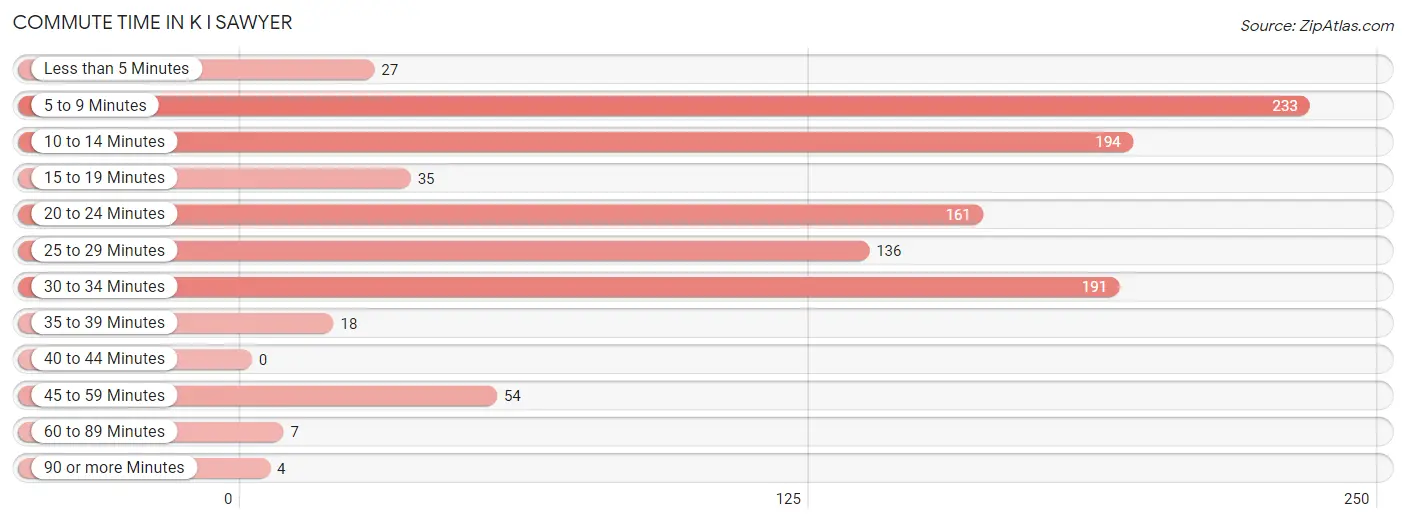
| Commute Time | # Commuters | % Commuters |
| Less than 5 Minutes | 27 | 2.5% |
| 5 to 9 Minutes | 233 | 22.0% |
| 10 to 14 Minutes | 194 | 18.3% |
| 15 to 19 Minutes | 35 | 3.3% |
| 20 to 24 Minutes | 161 | 15.2% |
| 25 to 29 Minutes | 136 | 12.8% |
| 30 to 34 Minutes | 191 | 18.0% |
| 35 to 39 Minutes | 18 | 1.7% |
| 40 to 44 Minutes | 0 | 0.0% |
| 45 to 59 Minutes | 54 | 5.1% |
| 60 to 89 Minutes | 7 | 0.7% |
| 90 or more Minutes | 4 | 0.4% |
Commute Time by Sex in K I Sawyer
The most common commute times in K I Sawyer are 5 to 9 minutes (170 commuters, 27.6%) for males and 20 to 24 minutes (118 commuters, 26.5%) for females.
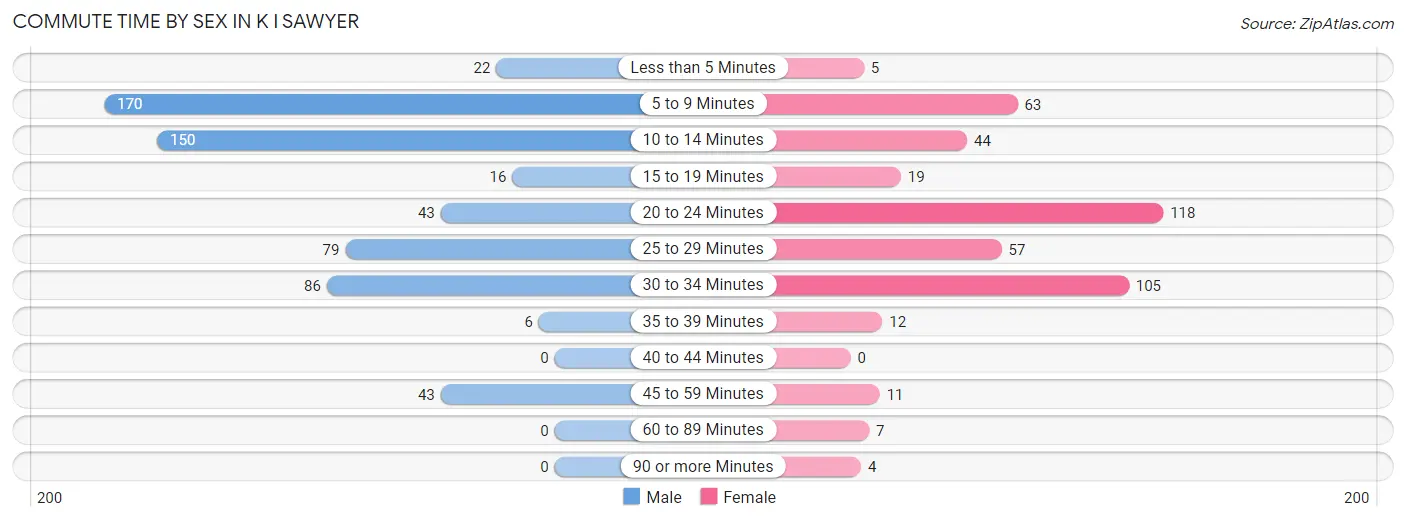
| Commute Time | Male | Female |
| Less than 5 Minutes | 22 (3.6%) | 5 (1.1%) |
| 5 to 9 Minutes | 170 (27.6%) | 63 (14.2%) |
| 10 to 14 Minutes | 150 (24.4%) | 44 (9.9%) |
| 15 to 19 Minutes | 16 (2.6%) | 19 (4.3%) |
| 20 to 24 Minutes | 43 (7.0%) | 118 (26.5%) |
| 25 to 29 Minutes | 79 (12.9%) | 57 (12.8%) |
| 30 to 34 Minutes | 86 (14.0%) | 105 (23.6%) |
| 35 to 39 Minutes | 6 (1.0%) | 12 (2.7%) |
| 40 to 44 Minutes | 0 (0.0%) | 0 (0.0%) |
| 45 to 59 Minutes | 43 (7.0%) | 11 (2.5%) |
| 60 to 89 Minutes | 0 (0.0%) | 7 (1.6%) |
| 90 or more Minutes | 0 (0.0%) | 4 (0.9%) |
Time of Departure to Work by Sex in K I Sawyer
The most frequent times of departure to work in K I Sawyer are 4:00 PM to 11:59 PM (79, 12.9%) for males and 8:00 AM to 8:29 AM (82, 18.4%) for females.
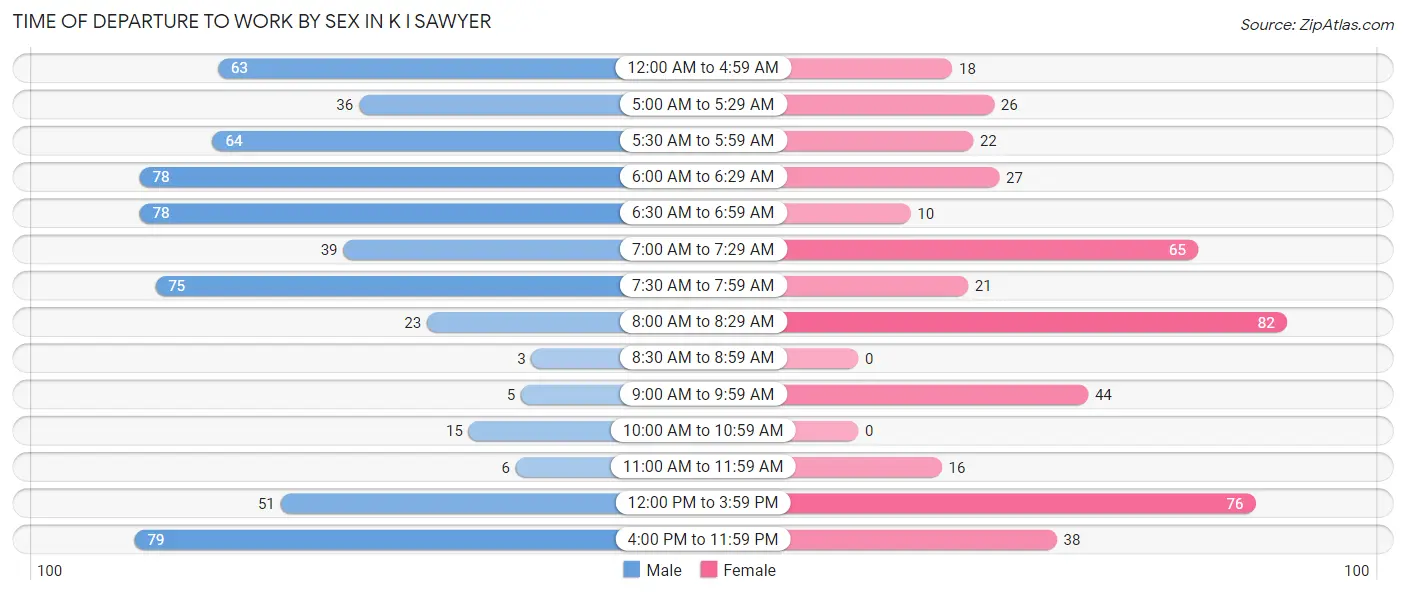
| Time of Departure | Male | Female |
| 12:00 AM to 4:59 AM | 63 (10.2%) | 18 (4.0%) |
| 5:00 AM to 5:29 AM | 36 (5.9%) | 26 (5.8%) |
| 5:30 AM to 5:59 AM | 64 (10.4%) | 22 (4.9%) |
| 6:00 AM to 6:29 AM | 78 (12.7%) | 27 (6.1%) |
| 6:30 AM to 6:59 AM | 78 (12.7%) | 10 (2.2%) |
| 7:00 AM to 7:29 AM | 39 (6.3%) | 65 (14.6%) |
| 7:30 AM to 7:59 AM | 75 (12.2%) | 21 (4.7%) |
| 8:00 AM to 8:29 AM | 23 (3.7%) | 82 (18.4%) |
| 8:30 AM to 8:59 AM | 3 (0.5%) | 0 (0.0%) |
| 9:00 AM to 9:59 AM | 5 (0.8%) | 44 (9.9%) |
| 10:00 AM to 10:59 AM | 15 (2.4%) | 0 (0.0%) |
| 11:00 AM to 11:59 AM | 6 (1.0%) | 16 (3.6%) |
| 12:00 PM to 3:59 PM | 51 (8.3%) | 76 (17.1%) |
| 4:00 PM to 11:59 PM | 79 (12.9%) | 38 (8.5%) |
| Total | 615 (100.0%) | 445 (100.0%) |
Housing Occupancy in K I Sawyer
Occupancy by Ownership in K I Sawyer
Of the total 1,051 dwellings in K I Sawyer, owner-occupied units account for 370 (35.2%), while renter-occupied units make up 681 (64.8%).
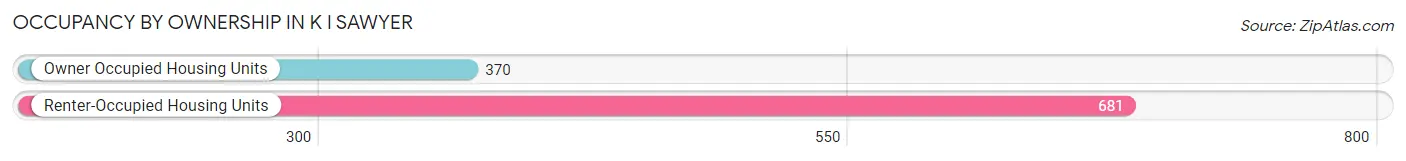
| Occupancy | # Housing Units | % Housing Units |
| Owner Occupied Housing Units | 370 | 35.2% |
| Renter-Occupied Housing Units | 681 | 64.8% |
| Total Occupied Housing Units | 1,051 | 100.0% |
Occupancy by Household Size in K I Sawyer
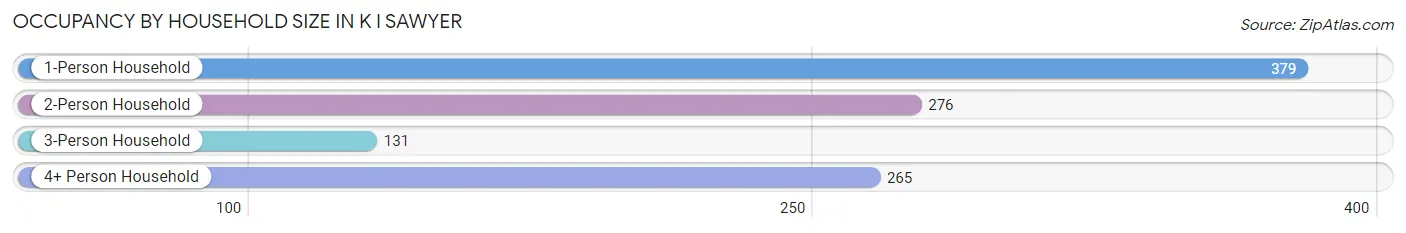
| Household Size | # Housing Units | % Housing Units |
| 1-Person Household | 379 | 36.1% |
| 2-Person Household | 276 | 26.3% |
| 3-Person Household | 131 | 12.5% |
| 4+ Person Household | 265 | 25.2% |
| Total Housing Units | 1,051 | 100.0% |
Occupancy by Ownership by Household Size in K I Sawyer
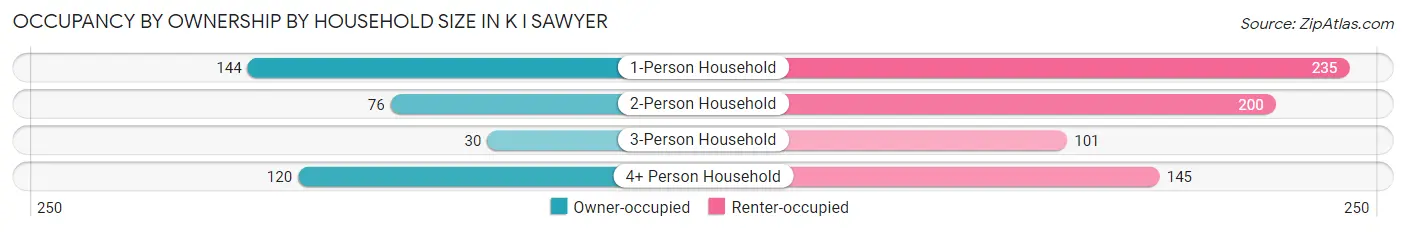
| Household Size | Owner-occupied | Renter-occupied |
| 1-Person Household | 144 (38.0%) | 235 (62.0%) |
| 2-Person Household | 76 (27.5%) | 200 (72.5%) |
| 3-Person Household | 30 (22.9%) | 101 (77.1%) |
| 4+ Person Household | 120 (45.3%) | 145 (54.7%) |
| Total Housing Units | 370 (35.2%) | 681 (64.8%) |
Occupancy by Educational Attainment in K I Sawyer
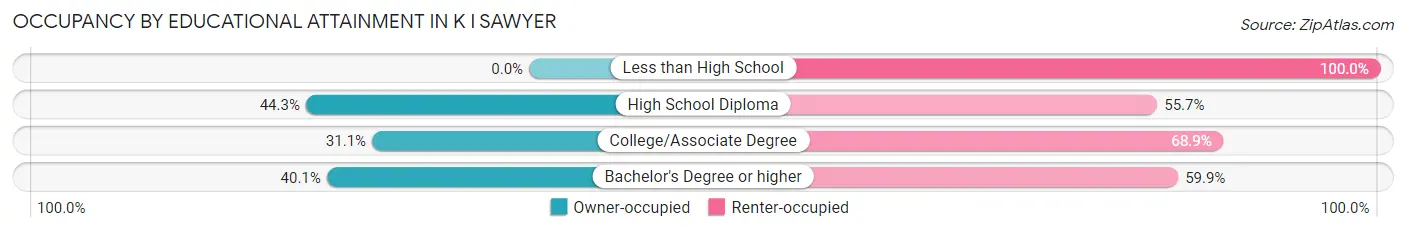
| Household Size | Owner-occupied | Renter-occupied |
| Less than High School | 0 (0.0%) | 37 (100.0%) |
| High School Diploma | 131 (44.3%) | 165 (55.7%) |
| College/Associate Degree | 170 (31.1%) | 376 (68.9%) |
| Bachelor's Degree or higher | 69 (40.1%) | 103 (59.9%) |
Occupancy by Age of Householder in K I Sawyer
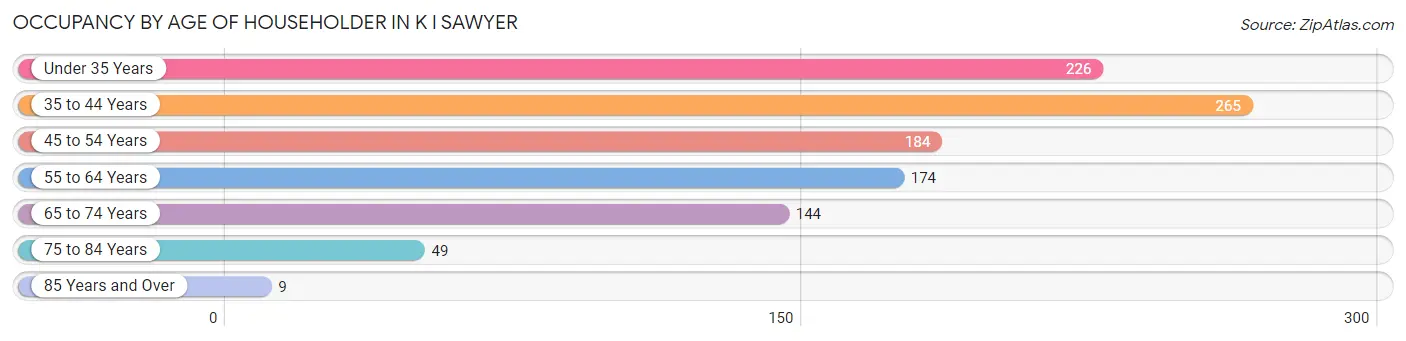
| Age Bracket | # Households | % Households |
| Under 35 Years | 226 | 21.5% |
| 35 to 44 Years | 265 | 25.2% |
| 45 to 54 Years | 184 | 17.5% |
| 55 to 64 Years | 174 | 16.6% |
| 65 to 74 Years | 144 | 13.7% |
| 75 to 84 Years | 49 | 4.7% |
| 85 Years and Over | 9 | 0.9% |
| Total | 1,051 | 100.0% |
Housing Finances in K I Sawyer
Median Income by Occupancy in K I Sawyer
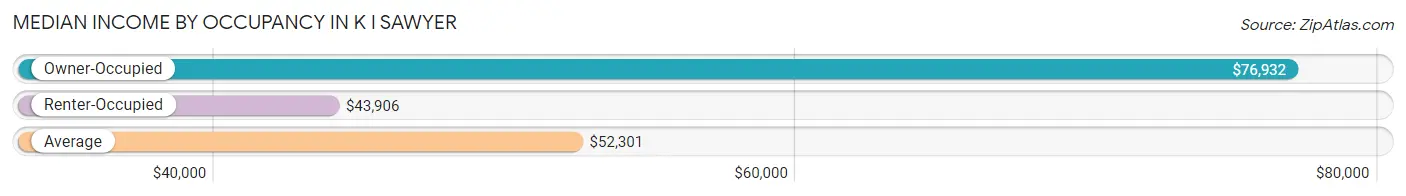
| Occupancy Type | # Households | Median Income |
| Owner-Occupied | 370 (35.2%) | $76,932 |
| Renter-Occupied | 681 (64.8%) | $43,906 |
| Average | 1,051 (100.0%) | $52,301 |
Occupancy by Householder Income Bracket in K I Sawyer
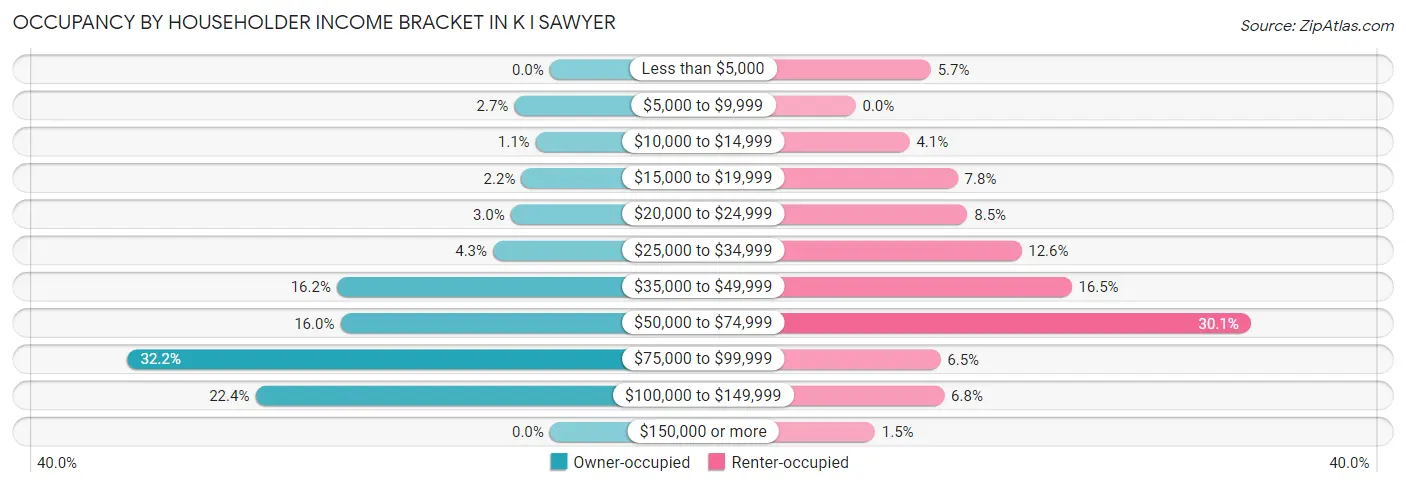
| Income Bracket | Owner-occupied | Renter-occupied |
| Less than $5,000 | 0 (0.0%) | 39 (5.7%) |
| $5,000 to $9,999 | 10 (2.7%) | 0 (0.0%) |
| $10,000 to $14,999 | 4 (1.1%) | 28 (4.1%) |
| $15,000 to $19,999 | 8 (2.2%) | 53 (7.8%) |
| $20,000 to $24,999 | 11 (3.0%) | 58 (8.5%) |
| $25,000 to $34,999 | 16 (4.3%) | 86 (12.6%) |
| $35,000 to $49,999 | 60 (16.2%) | 112 (16.5%) |
| $50,000 to $74,999 | 59 (16.0%) | 205 (30.1%) |
| $75,000 to $99,999 | 119 (32.2%) | 44 (6.5%) |
| $100,000 to $149,999 | 83 (22.4%) | 46 (6.8%) |
| $150,000 or more | 0 (0.0%) | 10 (1.5%) |
| Total | 370 (100.0%) | 681 (100.0%) |
Monthly Housing Cost Tiers in K I Sawyer
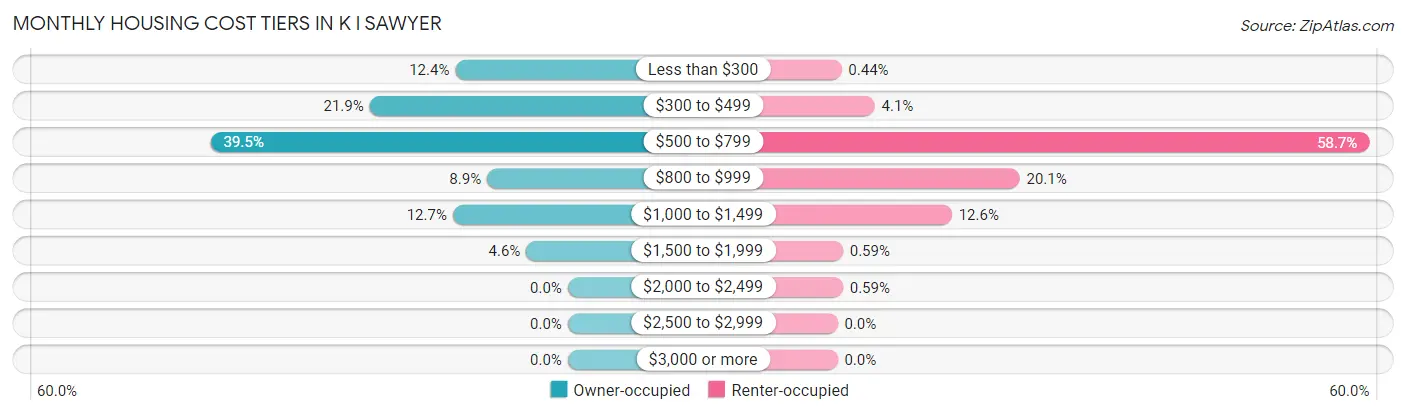
| Monthly Cost | Owner-occupied | Renter-occupied |
| Less than $300 | 46 (12.4%) | 3 (0.4%) |
| $300 to $499 | 81 (21.9%) | 28 (4.1%) |
| $500 to $799 | 146 (39.5%) | 400 (58.7%) |
| $800 to $999 | 33 (8.9%) | 137 (20.1%) |
| $1,000 to $1,499 | 47 (12.7%) | 86 (12.6%) |
| $1,500 to $1,999 | 17 (4.6%) | 4 (0.6%) |
| $2,000 to $2,499 | 0 (0.0%) | 4 (0.6%) |
| $2,500 to $2,999 | 0 (0.0%) | 0 (0.0%) |
| $3,000 or more | 0 (0.0%) | 0 (0.0%) |
| Total | 370 (100.0%) | 681 (100.0%) |
Physical Housing Characteristics in K I Sawyer
Housing Structures in K I Sawyer
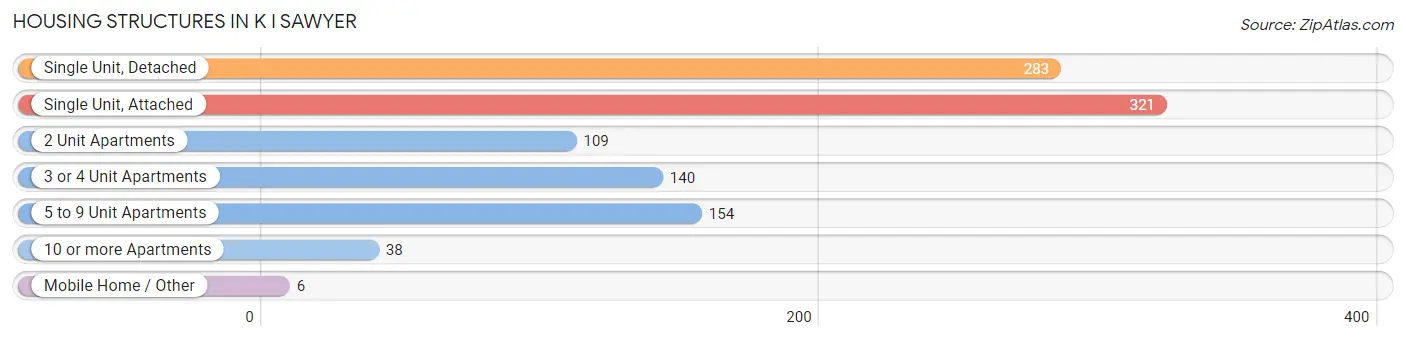
| Structure Type | # Housing Units | % Housing Units |
| Single Unit, Detached | 283 | 26.9% |
| Single Unit, Attached | 321 | 30.5% |
| 2 Unit Apartments | 109 | 10.4% |
| 3 or 4 Unit Apartments | 140 | 13.3% |
| 5 to 9 Unit Apartments | 154 | 14.6% |
| 10 or more Apartments | 38 | 3.6% |
| Mobile Home / Other | 6 | 0.6% |
| Total | 1,051 | 100.0% |
Housing Structures by Occupancy in K I Sawyer
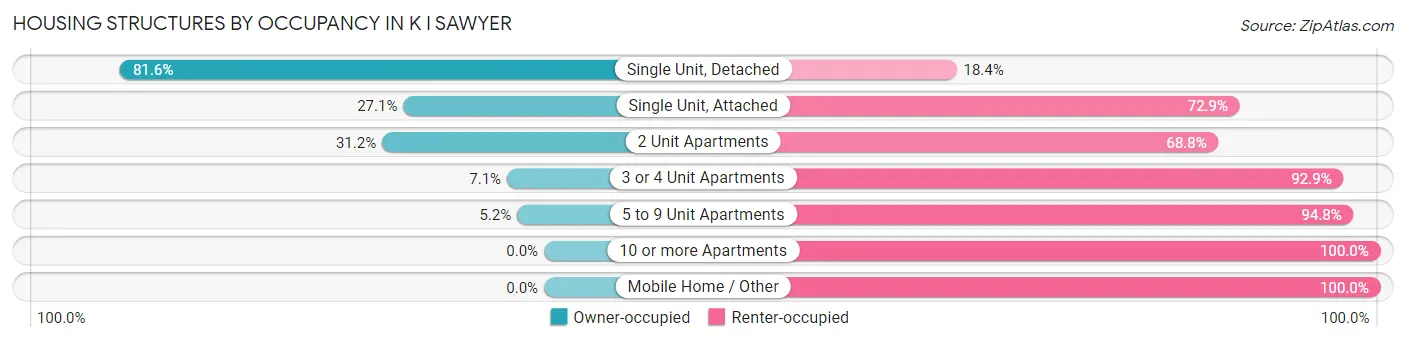
| Structure Type | Owner-occupied | Renter-occupied |
| Single Unit, Detached | 231 (81.6%) | 52 (18.4%) |
| Single Unit, Attached | 87 (27.1%) | 234 (72.9%) |
| 2 Unit Apartments | 34 (31.2%) | 75 (68.8%) |
| 3 or 4 Unit Apartments | 10 (7.1%) | 130 (92.9%) |
| 5 to 9 Unit Apartments | 8 (5.2%) | 146 (94.8%) |
| 10 or more Apartments | 0 (0.0%) | 38 (100.0%) |
| Mobile Home / Other | 0 (0.0%) | 6 (100.0%) |
| Total | 370 (35.2%) | 681 (64.8%) |
Housing Structures by Number of Rooms in K I Sawyer
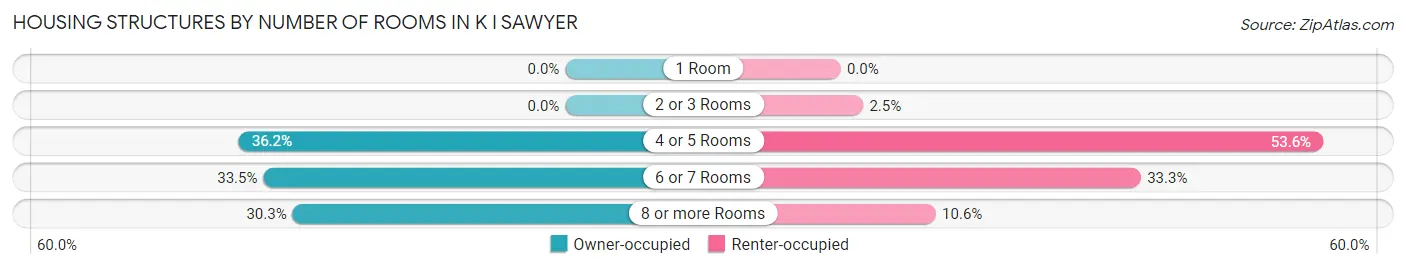
| Number of Rooms | Owner-occupied | Renter-occupied |
| 1 Room | 0 (0.0%) | 0 (0.0%) |
| 2 or 3 Rooms | 0 (0.0%) | 17 (2.5%) |
| 4 or 5 Rooms | 134 (36.2%) | 365 (53.6%) |
| 6 or 7 Rooms | 124 (33.5%) | 227 (33.3%) |
| 8 or more Rooms | 112 (30.3%) | 72 (10.6%) |
| Total | 370 (100.0%) | 681 (100.0%) |
Housing Structure by Heating Type in K I Sawyer
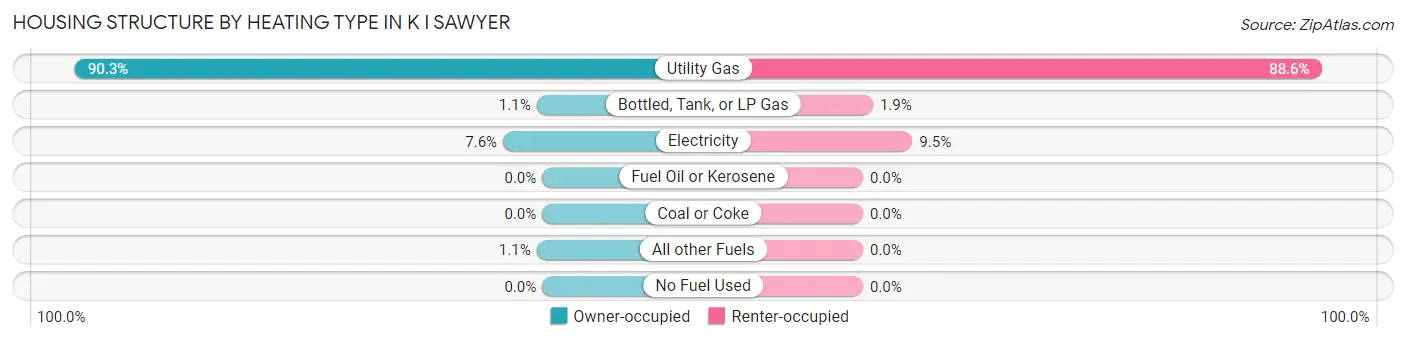
| Heating Type | Owner-occupied | Renter-occupied |
| Utility Gas | 334 (90.3%) | 603 (88.5%) |
| Bottled, Tank, or LP Gas | 4 (1.1%) | 13 (1.9%) |
| Electricity | 28 (7.6%) | 65 (9.5%) |
| Fuel Oil or Kerosene | 0 (0.0%) | 0 (0.0%) |
| Coal or Coke | 0 (0.0%) | 0 (0.0%) |
| All other Fuels | 4 (1.1%) | 0 (0.0%) |
| No Fuel Used | 0 (0.0%) | 0 (0.0%) |
| Total | 370 (100.0%) | 681 (100.0%) |
Household Vehicle Usage in K I Sawyer
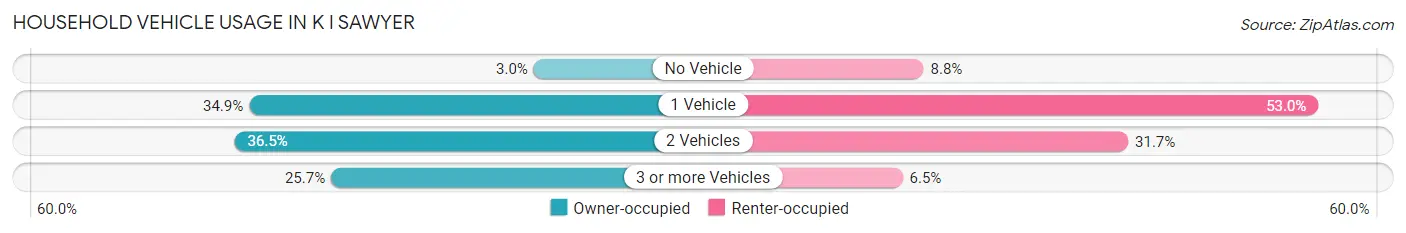
| Vehicles per Household | Owner-occupied | Renter-occupied |
| No Vehicle | 11 (3.0%) | 60 (8.8%) |
| 1 Vehicle | 129 (34.9%) | 361 (53.0%) |
| 2 Vehicles | 135 (36.5%) | 216 (31.7%) |
| 3 or more Vehicles | 95 (25.7%) | 44 (6.5%) |
| Total | 370 (100.0%) | 681 (100.0%) |
Real Estate & Mortgages in K I Sawyer
Real Estate and Mortgage Overview in K I Sawyer
| Characteristic | Without Mortgage | With Mortgage |
| Housing Units | 137 | 233 |
| Median Property Value | $56,800 | $72,500 |
| Median Household Income | $85,125 | $0 |
| Monthly Housing Costs | $466 | $0 |
| Real Estate Taxes | $815 | $51 |
Property Value by Mortgage Status in K I Sawyer
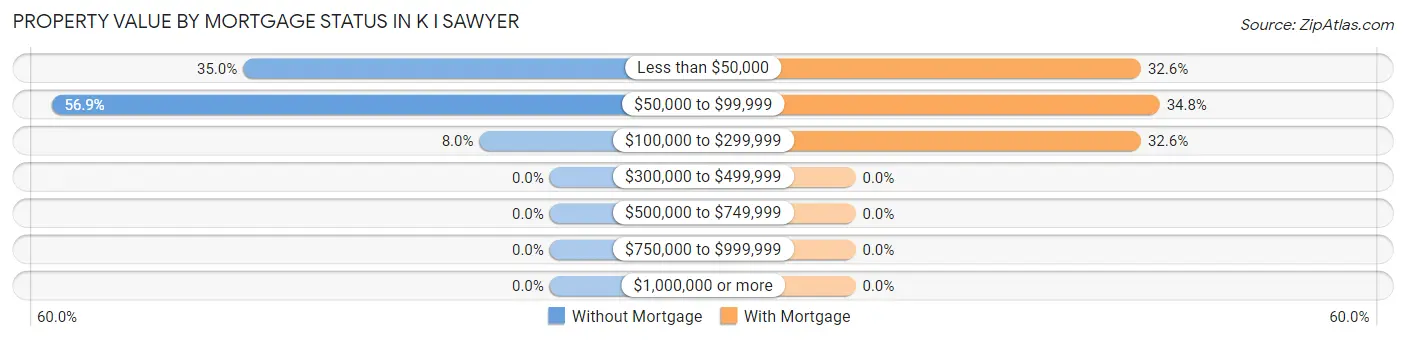
| Property Value | Without Mortgage | With Mortgage |
| Less than $50,000 | 48 (35.0%) | 76 (32.6%) |
| $50,000 to $99,999 | 78 (56.9%) | 81 (34.8%) |
| $100,000 to $299,999 | 11 (8.0%) | 76 (32.6%) |
| $300,000 to $499,999 | 0 (0.0%) | 0 (0.0%) |
| $500,000 to $749,999 | 0 (0.0%) | 0 (0.0%) |
| $750,000 to $999,999 | 0 (0.0%) | 0 (0.0%) |
| $1,000,000 or more | 0 (0.0%) | 0 (0.0%) |
| Total | 137 (100.0%) | 233 (100.0%) |
Household Income by Mortgage Status in K I Sawyer
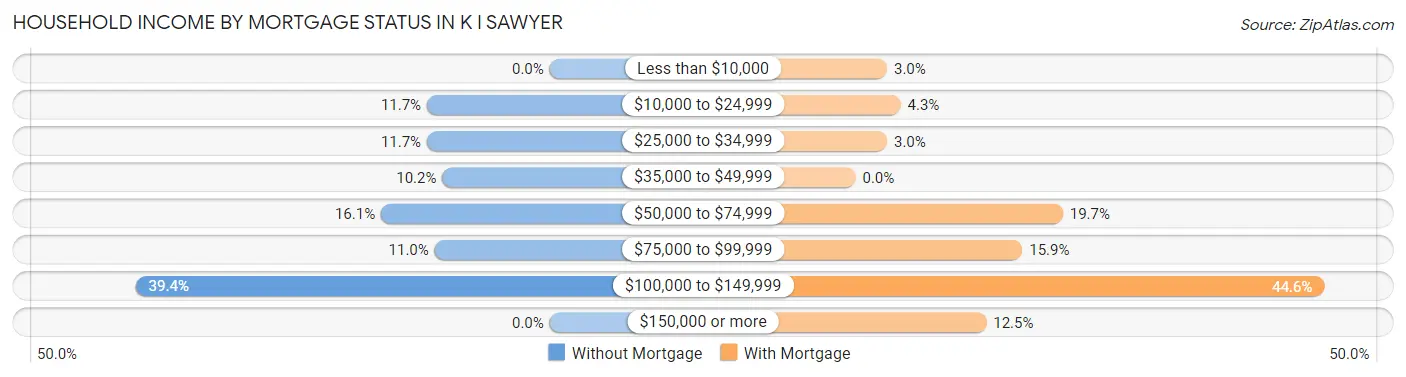
| Household Income | Without Mortgage | With Mortgage |
| Less than $10,000 | 0 (0.0%) | 7 (3.0%) |
| $10,000 to $24,999 | 16 (11.7%) | 10 (4.3%) |
| $25,000 to $34,999 | 16 (11.7%) | 7 (3.0%) |
| $35,000 to $49,999 | 14 (10.2%) | 0 (0.0%) |
| $50,000 to $74,999 | 22 (16.1%) | 46 (19.7%) |
| $75,000 to $99,999 | 15 (11.0%) | 37 (15.9%) |
| $100,000 to $149,999 | 54 (39.4%) | 104 (44.6%) |
| $150,000 or more | 0 (0.0%) | 29 (12.4%) |
| Total | 137 (100.0%) | 233 (100.0%) |
Property Value to Household Income Ratio in K I Sawyer
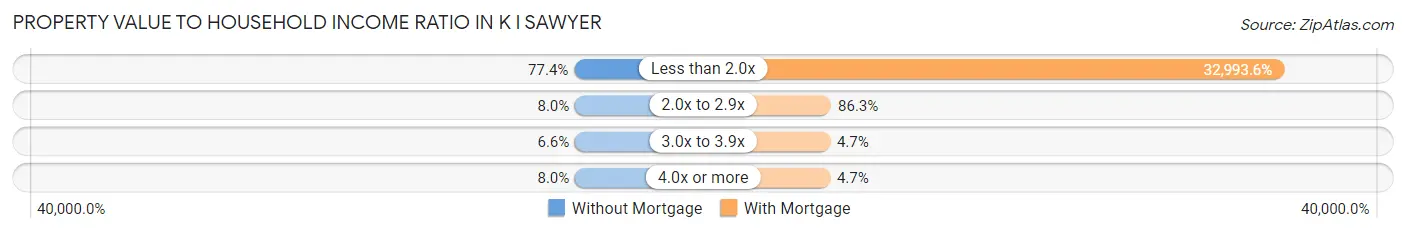
| Value-to-Income Ratio | Without Mortgage | With Mortgage |
| Less than 2.0x | 106 (77.4%) | 76,875 (32,993.6%) |
| 2.0x to 2.9x | 11 (8.0%) | 201 (86.3%) |
| 3.0x to 3.9x | 9 (6.6%) | 11 (4.7%) |
| 4.0x or more | 11 (8.0%) | 11 (4.7%) |
| Total | 137 (100.0%) | 233 (100.0%) |
Real Estate Taxes by Mortgage Status in K I Sawyer
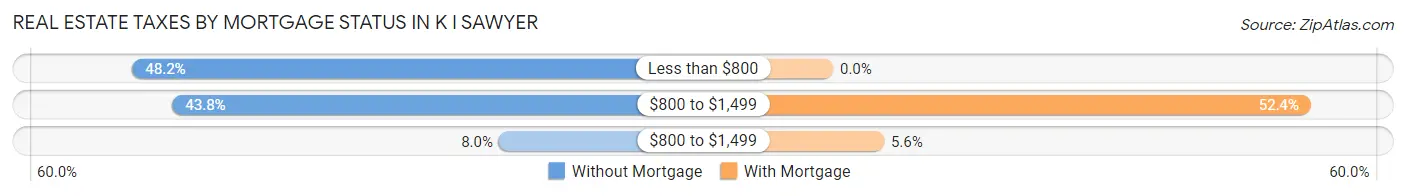
| Property Taxes | Without Mortgage | With Mortgage |
| Less than $800 | 66 (48.2%) | 0 (0.0%) |
| $800 to $1,499 | 60 (43.8%) | 122 (52.4%) |
| $800 to $1,499 | 11 (8.0%) | 13 (5.6%) |
| Total | 137 (100.0%) | 233 (100.0%) |
Health & Disability in K I Sawyer
Health Insurance Coverage by Age in K I Sawyer
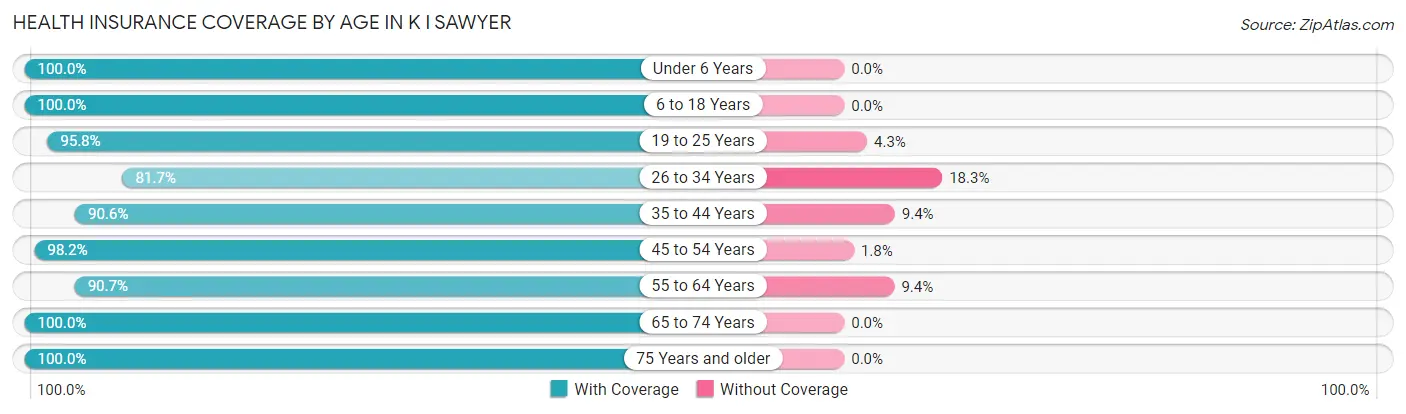
| Age Bracket | With Coverage | Without Coverage |
| Under 6 Years | 252 (100.0%) | 0 (0.0%) |
| 6 to 18 Years | 648 (100.0%) | 0 (0.0%) |
| 19 to 25 Years | 338 (95.8%) | 15 (4.3%) |
| 26 to 34 Years | 197 (81.7%) | 44 (18.3%) |
| 35 to 44 Years | 404 (90.6%) | 42 (9.4%) |
| 45 to 54 Years | 271 (98.2%) | 5 (1.8%) |
| 55 to 64 Years | 281 (90.6%) | 29 (9.3%) |
| 65 to 74 Years | 236 (100.0%) | 0 (0.0%) |
| 75 Years and older | 70 (100.0%) | 0 (0.0%) |
| Total | 2,697 (95.2%) | 135 (4.8%) |
Health Insurance Coverage by Citizenship Status in K I Sawyer
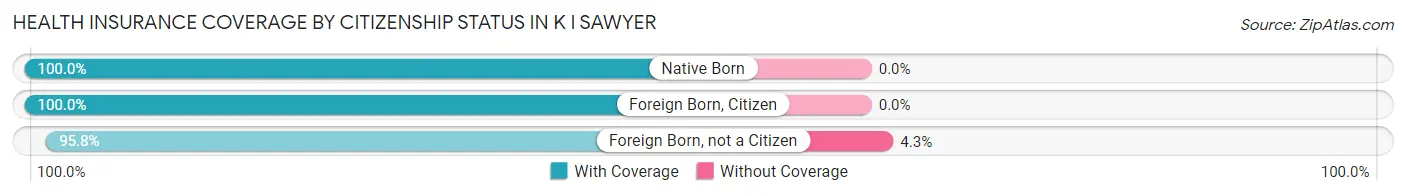
| Citizenship Status | With Coverage | Without Coverage |
| Native Born | 252 (100.0%) | 0 (0.0%) |
| Foreign Born, Citizen | 648 (100.0%) | 0 (0.0%) |
| Foreign Born, not a Citizen | 338 (95.8%) | 15 (4.3%) |
Health Insurance Coverage by Household Income in K I Sawyer
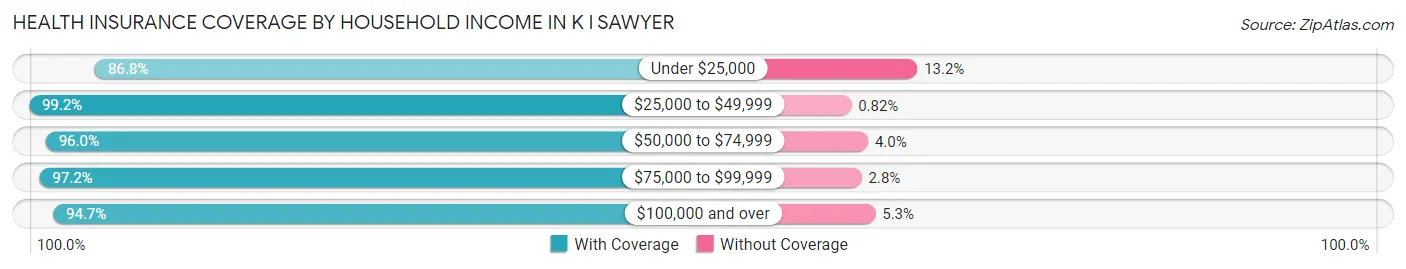
| Household Income | With Coverage | Without Coverage |
| Under $25,000 | 362 (86.8%) | 55 (13.2%) |
| $25,000 to $49,999 | 605 (99.2%) | 5 (0.8%) |
| $50,000 to $74,999 | 725 (96.0%) | 30 (4.0%) |
| $75,000 to $99,999 | 420 (97.2%) | 12 (2.8%) |
| $100,000 and over | 585 (94.7%) | 33 (5.3%) |
Public vs Private Health Insurance Coverage by Age in K I Sawyer
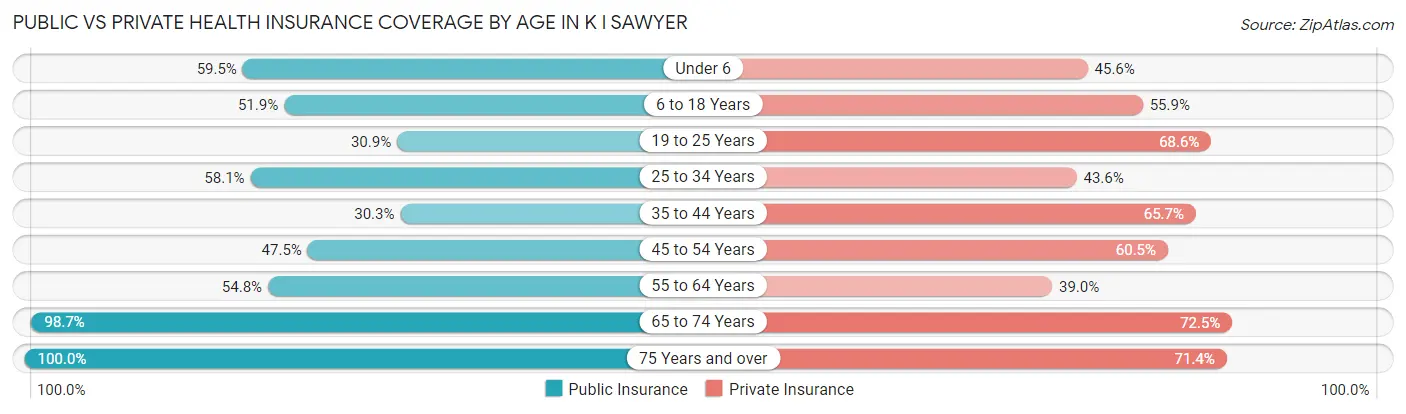
| Age Bracket | Public Insurance | Private Insurance |
| Under 6 | 150 (59.5%) | 115 (45.6%) |
| 6 to 18 Years | 336 (51.8%) | 362 (55.9%) |
| 19 to 25 Years | 109 (30.9%) | 242 (68.6%) |
| 25 to 34 Years | 140 (58.1%) | 105 (43.6%) |
| 35 to 44 Years | 135 (30.3%) | 293 (65.7%) |
| 45 to 54 Years | 131 (47.5%) | 167 (60.5%) |
| 55 to 64 Years | 170 (54.8%) | 121 (39.0%) |
| 65 to 74 Years | 233 (98.7%) | 171 (72.5%) |
| 75 Years and over | 70 (100.0%) | 50 (71.4%) |
| Total | 1,474 (52.0%) | 1,626 (57.4%) |
Disability Status by Sex by Age in K I Sawyer
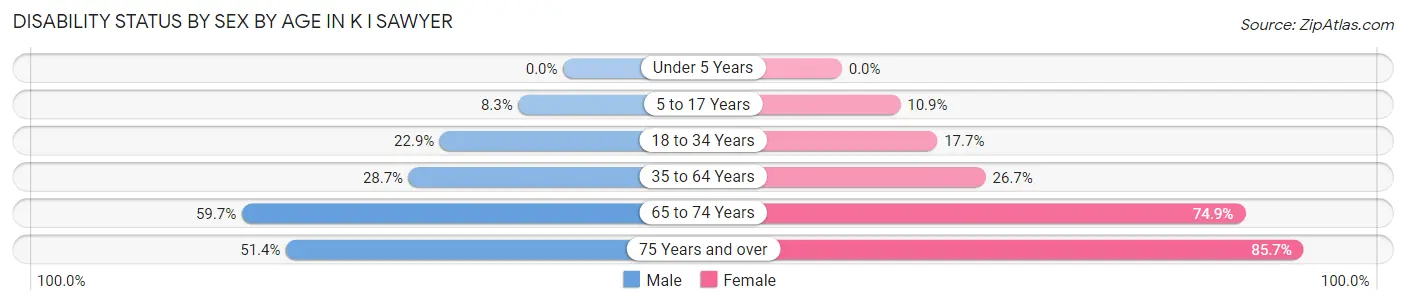
| Age Bracket | Male | Female |
| Under 5 Years | 0 (0.0%) | 0 (0.0%) |
| 5 to 17 Years | 31 (8.3%) | 29 (10.9%) |
| 18 to 34 Years | 83 (22.9%) | 51 (17.7%) |
| 35 to 64 Years | 139 (28.7%) | 146 (26.7%) |
| 65 to 74 Years | 34 (59.7%) | 134 (74.9%) |
| 75 Years and over | 18 (51.4%) | 30 (85.7%) |
Disability Class by Sex by Age in K I Sawyer
Disability Class: Hearing Difficulty
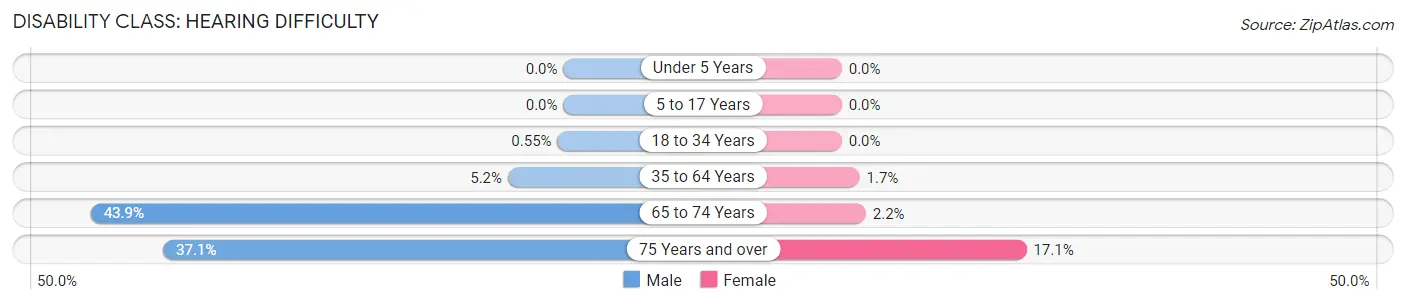
| Age Bracket | Male | Female |
| Under 5 Years | 0 (0.0%) | 0 (0.0%) |
| 5 to 17 Years | 0 (0.0%) | 0 (0.0%) |
| 18 to 34 Years | 2 (0.5%) | 0 (0.0%) |
| 35 to 64 Years | 25 (5.1%) | 9 (1.7%) |
| 65 to 74 Years | 25 (43.9%) | 4 (2.2%) |
| 75 Years and over | 13 (37.1%) | 6 (17.1%) |
Disability Class: Vision Difficulty
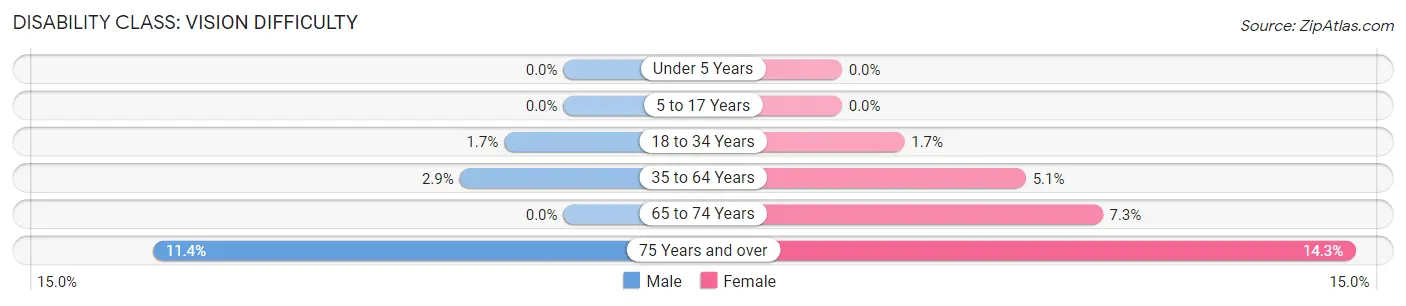
| Age Bracket | Male | Female |
| Under 5 Years | 0 (0.0%) | 0 (0.0%) |
| 5 to 17 Years | 0 (0.0%) | 0 (0.0%) |
| 18 to 34 Years | 6 (1.7%) | 5 (1.7%) |
| 35 to 64 Years | 14 (2.9%) | 28 (5.1%) |
| 65 to 74 Years | 0 (0.0%) | 13 (7.3%) |
| 75 Years and over | 4 (11.4%) | 5 (14.3%) |
Disability Class: Cognitive Difficulty
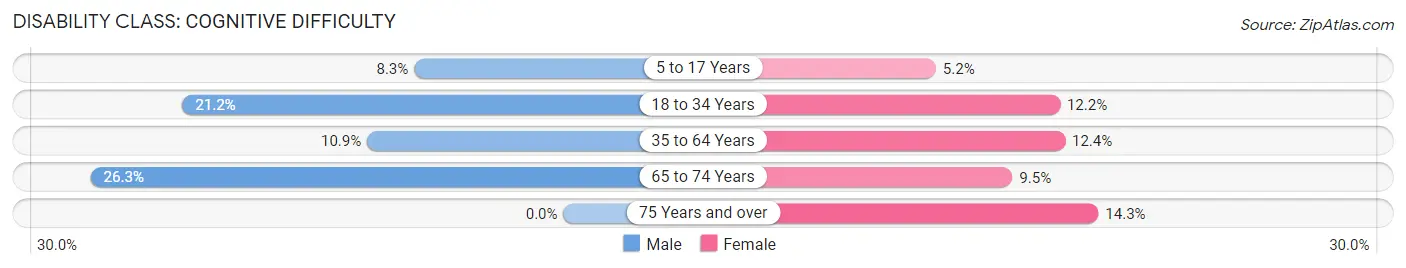
| Age Bracket | Male | Female |
| 5 to 17 Years | 31 (8.3%) | 14 (5.2%) |
| 18 to 34 Years | 77 (21.2%) | 35 (12.1%) |
| 35 to 64 Years | 53 (10.9%) | 68 (12.4%) |
| 65 to 74 Years | 15 (26.3%) | 17 (9.5%) |
| 75 Years and over | 0 (0.0%) | 5 (14.3%) |
Disability Class: Ambulatory Difficulty
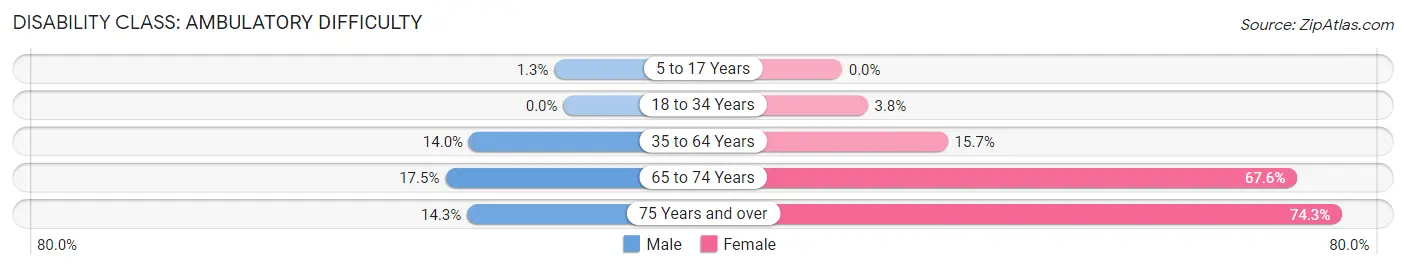
| Age Bracket | Male | Female |
| 5 to 17 Years | 5 (1.3%) | 0 (0.0%) |
| 18 to 34 Years | 0 (0.0%) | 11 (3.8%) |
| 35 to 64 Years | 68 (14.0%) | 86 (15.7%) |
| 65 to 74 Years | 10 (17.5%) | 121 (67.6%) |
| 75 Years and over | 5 (14.3%) | 26 (74.3%) |
Disability Class: Self-Care Difficulty
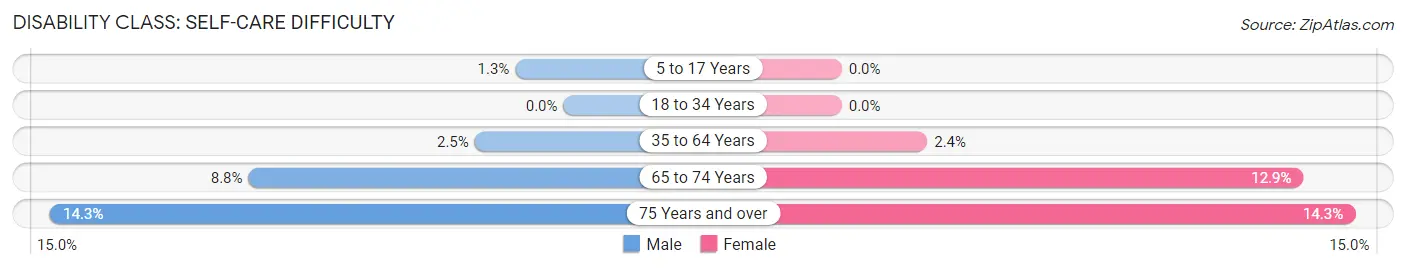
| Age Bracket | Male | Female |
| 5 to 17 Years | 5 (1.3%) | 0 (0.0%) |
| 18 to 34 Years | 0 (0.0%) | 0 (0.0%) |
| 35 to 64 Years | 12 (2.5%) | 13 (2.4%) |
| 65 to 74 Years | 5 (8.8%) | 23 (12.9%) |
| 75 Years and over | 5 (14.3%) | 5 (14.3%) |
Technology Access in K I Sawyer
Computing Device Access in K I Sawyer
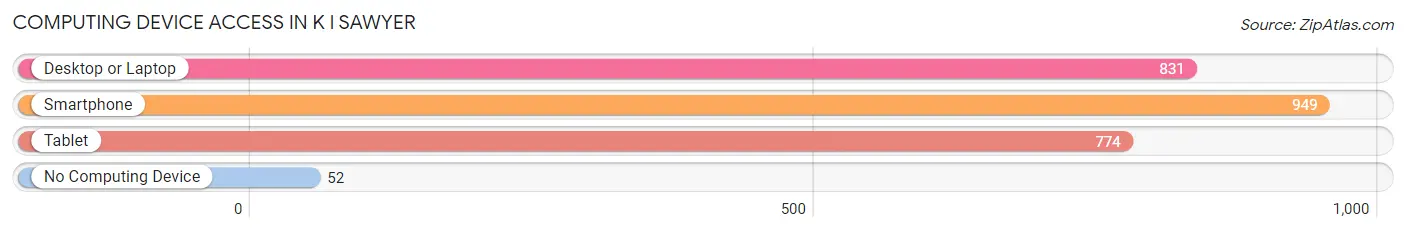
| Device Type | # Households | % Households |
| Desktop or Laptop | 831 | 79.1% |
| Smartphone | 949 | 90.3% |
| Tablet | 774 | 73.6% |
| No Computing Device | 52 | 5.0% |
| Total | 1,051 | 100.0% |
Internet Access in K I Sawyer
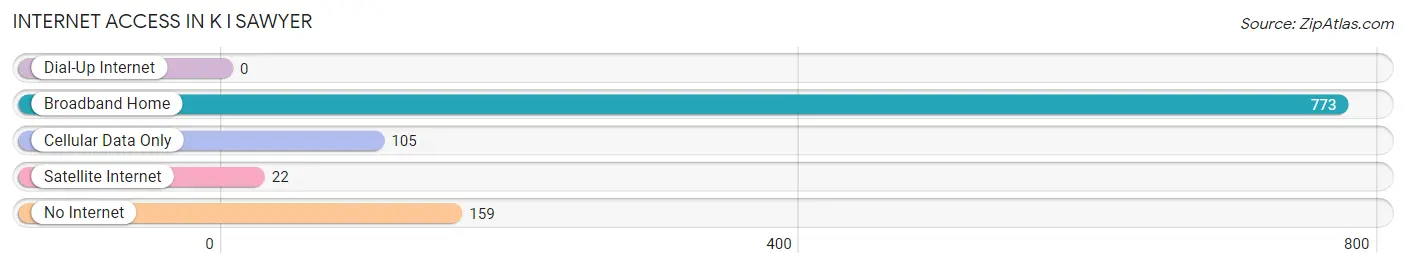
| Internet Type | # Households | % Households |
| Dial-Up Internet | 0 | 0.0% |
| Broadband Home | 773 | 73.6% |
| Cellular Data Only | 105 | 10.0% |
| Satellite Internet | 22 | 2.1% |
| No Internet | 159 | 15.1% |
| Total | 1,051 | 100.0% |
K I Sawyer Summary
Sawyer is a small unincorporated community located in Berrien County, Michigan. It is situated in the southwestern corner of the county, just north of the Indiana border. The community is located along the banks of the St. Joseph River, and is home to a population of approximately 1,000 people.
History
Sawyer was first settled in the early 1800s by a group of settlers from New York. The community was named after the first settler, William Sawyer, who arrived in the area in 1836. The first post office was established in 1837, and the first school was built in 1845.
In the late 1800s, Sawyer became a popular destination for vacationers from Chicago and other nearby cities. The community was known for its beautiful scenery and its proximity to the St. Joseph River.
In the early 1900s, Sawyer began to experience a period of growth and development. The community was home to several businesses, including a sawmill, a grist mill, a general store, and a hotel. The town also had a train station, which allowed for easy access to the nearby cities of Chicago and South Bend.
Geography
Sawyer is located in the southwestern corner of Berrien County, Michigan. It is situated along the banks of the St. Joseph River, and is bordered by the cities of Niles and Buchanan to the north, and the towns of New Buffalo and Three Oaks to the south. The community is located approximately 40 miles from the city of Chicago, and is accessible via Interstate 94.
The terrain of Sawyer is mostly flat, with some rolling hills in the surrounding area. The climate is generally mild, with hot summers and cold winters.
Economy
The economy of Sawyer is largely based on agriculture and tourism. The town is home to several farms, which produce a variety of crops, including corn, soybeans, and wheat. The town is also home to several wineries, which produce a variety of wines.
The town is also a popular destination for tourists, who come to enjoy the scenic beauty of the St. Joseph River and the surrounding area. The town is home to several restaurants, shops, and other attractions, which attract visitors from all over the region.
Demographics
As of the 2010 census, the population of Sawyer was 1,000. The racial makeup of the town was 97.2% White, 0.7% African American, 0.3% Native American, 0.2% Asian, 0.1% Pacific Islander, and 1.5% from other races. The median household income was $45,000, and the median home value was $125,000.
Conclusion
Sawyer is a small unincorporated community located in Berrien County, Michigan. It is situated along the banks of the St. Joseph River, and is home to a population of approximately 1,000 people. The economy of Sawyer is largely based on agriculture and tourism, and the town is a popular destination for visitors from all over the region. The racial makeup of the town is mostly White, with a small percentage of African American, Native American, Asian, and Pacific Islander residents.
Common Questions
What is Per Capita Income in K I Sawyer?
Per Capita income in K I Sawyer is $21,803.
What is the Median Family Income in K I Sawyer?
Median Family Income in K I Sawyer is $62,250.
What is the Median Household income in K I Sawyer?
Median Household Income in K I Sawyer is $52,301.
What is Income or Wage Gap in K I Sawyer?
Income or Wage Gap in K I Sawyer is 38.4%.
Women in K I Sawyer earn 61.6 cents for every dollar earned by a man.
What is Inequality or Gini Index in K I Sawyer?
Inequality or Gini Index in K I Sawyer is 0.34.
What is the Total Population of K I Sawyer?
Total Population of K I Sawyer is 2,833.
What is the Total Male Population of K I Sawyer?
Total Male Population of K I Sawyer is 1,447.
What is the Total Female Population of K I Sawyer?
Total Female Population of K I Sawyer is 1,386.
What is the Ratio of Males per 100 Females in K I Sawyer?
There are 104.40 Males per 100 Females in K I Sawyer.
What is the Ratio of Females per 100 Males in K I Sawyer?
There are 95.78 Females per 100 Males in K I Sawyer.
What is the Median Population Age in K I Sawyer?
Median Population Age in K I Sawyer is 32.2 Years.
What is the Average Family Size in K I Sawyer
Average Family Size in K I Sawyer is 3.8 People.
What is the Average Household Size in K I Sawyer
Average Household Size in K I Sawyer is 2.7 People.
How Large is the Labor Force in K I Sawyer?
There are 1,185 People in the Labor Forcein in K I Sawyer.
What is the Percentage of People in the Labor Force in K I Sawyer?
56.6% of People are in the Labor Force in K I Sawyer.
What is the Unemployment Rate in K I Sawyer?
Unemployment Rate in K I Sawyer is 4.7%.