Zip Codes with the Highest Percentage of Population with a Degree in Visual and Performing Arts in Sterling Heights, MI
RELATED REPORTS & OPTIONS
Visual and Performing Arts
Sterling Heights
Compare Zip Codes
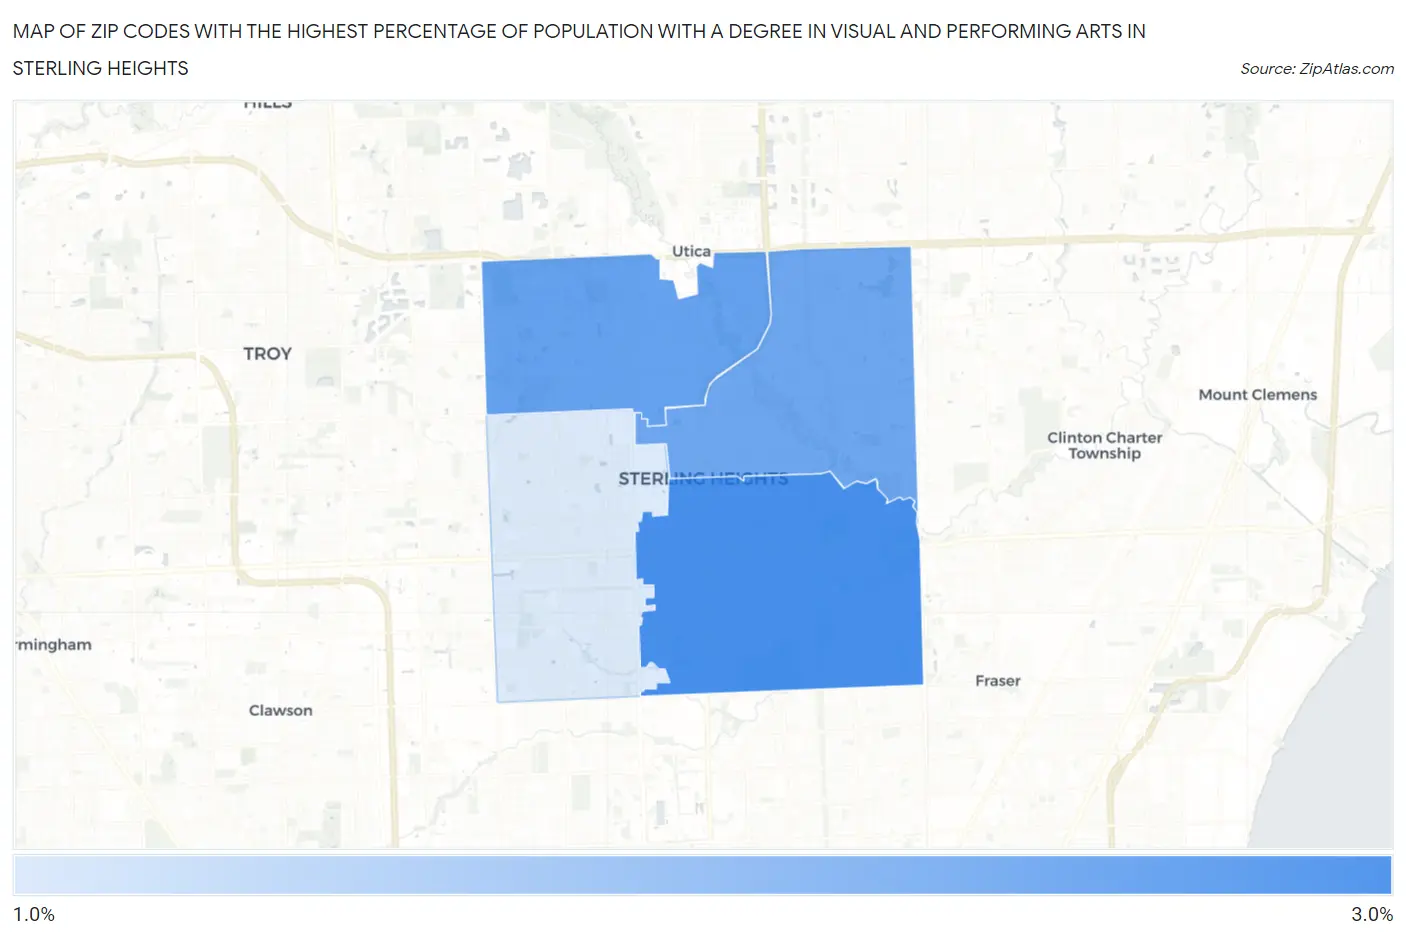
Map of Zip Codes with the Highest Percentage of Population with a Degree in Visual and Performing Arts in Sterling Heights
1.5%
2.8%
Zip Codes with the Highest Percentage of Population with a Degree in Visual and Performing Arts in Sterling Heights, MI
| Zip Code | % Graduates | vs State | vs National | |
| 1. | 48312 | 2.8% | 3.4%(-0.635)#408 | 4.3%(-1.49)#13,620 |
| 2. | 48314 | 2.5% | 3.4%(-0.886)#442 | 4.3%(-1.74)#14,559 |
| 3. | 48313 | 2.4% | 3.4%(-0.977)#465 | 4.3%(-1.83)#14,899 |
| 4. | 48310 | 1.5% | 3.4%(-1.91)#637 | 4.3%(-2.76)#18,205 |
1
Common Questions
What are the Top 3 Zip Codes with the Highest Percentage of Population with a Degree in Visual and Performing Arts in Sterling Heights, MI?
Top 3 Zip Codes with the Highest Percentage of Population with a Degree in Visual and Performing Arts in Sterling Heights, MI are:
What zip code has the Highest Percentage of Population with a Degree in Visual and Performing Arts in Sterling Heights, MI?
48312 has the Highest Percentage of Population with a Degree in Visual and Performing Arts in Sterling Heights, MI with 2.8%.
What is the Percentage of Population with a Degree in Visual and Performing Arts in Sterling Heights, MI?
Percentage of Population with a Degree in Visual and Performing Arts in Sterling Heights is 2.3%.
What is the Percentage of Population with a Degree in Visual and Performing Arts in Michigan?
Percentage of Population with a Degree in Visual and Performing Arts in Michigan is 3.4%.
What is the Percentage of Population with a Degree in Visual and Performing Arts in the United States?
Percentage of Population with a Degree in Visual and Performing Arts in the United States is 4.3%.