Zip Codes with the Highest Percentage of Population with a Degree in Visual and Performing Arts in Lansing, MI
RELATED REPORTS & OPTIONS
Visual and Performing Arts
Lansing
Compare Zip Codes
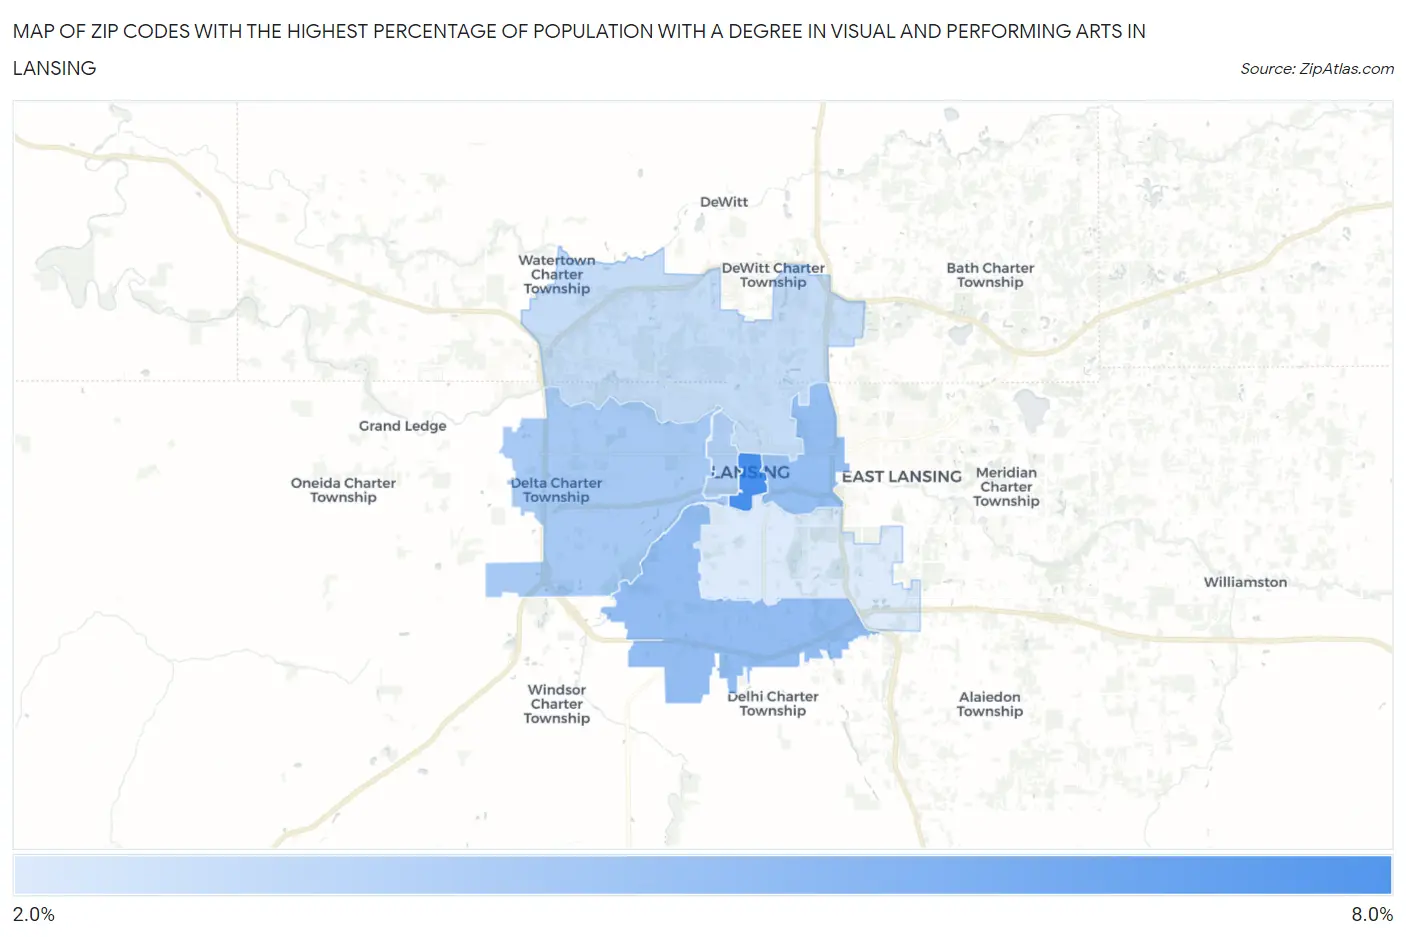
Map of Zip Codes with the Highest Percentage of Population with a Degree in Visual and Performing Arts in Lansing
3.0%
7.8%
Zip Codes with the Highest Percentage of Population with a Degree in Visual and Performing Arts in Lansing, MI
| Zip Code | % Graduates | vs State | vs National | |
| 1. | 48933 | 7.8% | 3.4%(+4.35)#65 | 4.3%(+3.50)#3,016 |
| 2. | 48911 | 5.3% | 3.4%(+1.92)#138 | 4.3%(+1.07)#6,002 |
| 3. | 48912 | 5.2% | 3.4%(+1.83)#150 | 4.3%(+0.981)#6,183 |
| 4. | 48917 | 4.6% | 3.4%(+1.23)#186 | 4.3%(+0.384)#7,454 |
| 5. | 48915 | 4.3% | 3.4%(+0.942)#209 | 4.3%(+0.092)#8,233 |
| 6. | 48906 | 3.7% | 3.4%(+0.274)#280 | 4.3%(-0.576)#10,248 |
| 7. | 48910 | 3.0% | 3.4%(-0.446)#377 | 4.3%(-1.30)#12,902 |
1
Common Questions
What are the Top 5 Zip Codes with the Highest Percentage of Population with a Degree in Visual and Performing Arts in Lansing, MI?
Top 5 Zip Codes with the Highest Percentage of Population with a Degree in Visual and Performing Arts in Lansing, MI are:
What zip code has the Highest Percentage of Population with a Degree in Visual and Performing Arts in Lansing, MI?
48933 has the Highest Percentage of Population with a Degree in Visual and Performing Arts in Lansing, MI with 7.8%.
What is the Percentage of Population with a Degree in Visual and Performing Arts in Lansing, MI?
Percentage of Population with a Degree in Visual and Performing Arts in Lansing is 4.2%.
What is the Percentage of Population with a Degree in Visual and Performing Arts in Michigan?
Percentage of Population with a Degree in Visual and Performing Arts in Michigan is 3.4%.
What is the Percentage of Population with a Degree in Visual and Performing Arts in the United States?
Percentage of Population with a Degree in Visual and Performing Arts in the United States is 4.3%.