Zip Codes with the Highest Percentage of Population with a Degree in Visual and Performing Arts in Redford, MI
RELATED REPORTS & OPTIONS
Visual and Performing Arts
Redford
Compare Zip Codes
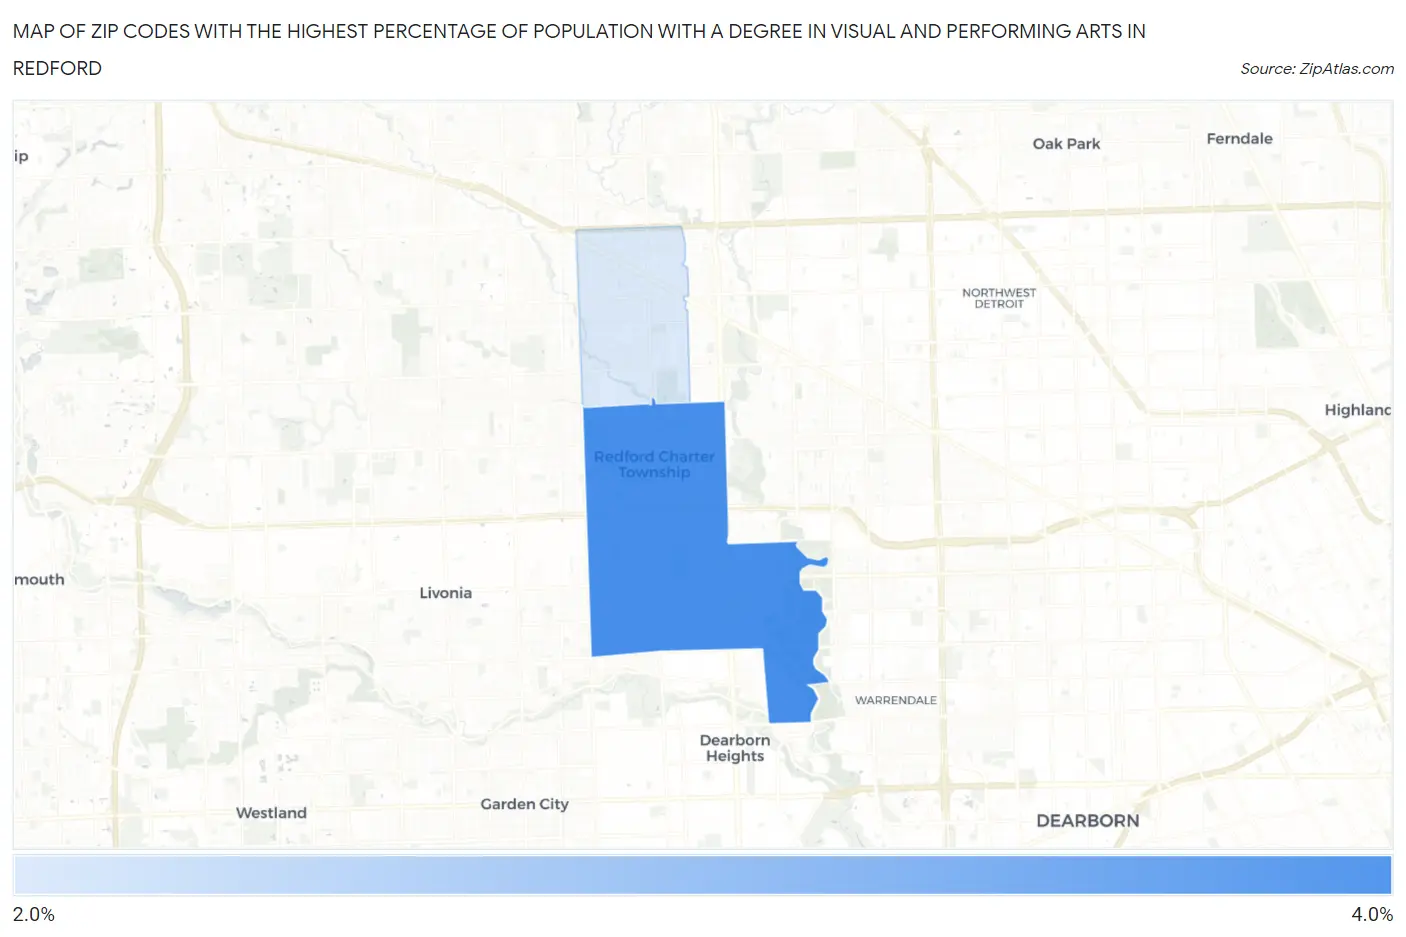
Map of Zip Codes with the Highest Percentage of Population with a Degree in Visual and Performing Arts in Redford
2.5%
3.6%
Zip Codes with the Highest Percentage of Population with a Degree in Visual and Performing Arts in Redford, MI
| Zip Code | % Graduates | vs State | vs National | |
| 1. | 48239 | 3.6% | 3.4%(+0.178)#294 | 4.3%(-0.672)#10,560 |
| 2. | 48240 | 2.5% | 3.4%(-0.891)#443 | 4.3%(-1.74)#14,572 |
1
Common Questions
What are the Top Zip Codes with the Highest Percentage of Population with a Degree in Visual and Performing Arts in Redford, MI?
Top Zip Codes with the Highest Percentage of Population with a Degree in Visual and Performing Arts in Redford, MI are:
What zip code has the Highest Percentage of Population with a Degree in Visual and Performing Arts in Redford, MI?
48239 has the Highest Percentage of Population with a Degree in Visual and Performing Arts in Redford, MI with 3.6%.
What is the Percentage of Population with a Degree in Visual and Performing Arts in Michigan?
Percentage of Population with a Degree in Visual and Performing Arts in Michigan is 3.4%.
What is the Percentage of Population with a Degree in Visual and Performing Arts in the United States?
Percentage of Population with a Degree in Visual and Performing Arts in the United States is 4.3%.