Ludington, MI Map & Demographics
Ludington Map
Ludington Overview
$30,385
PER CAPITA INCOME
$75,521
AVG FAMILY INCOME
$49,503
AVG HOUSEHOLD INCOME
37.6%
WAGE / INCOME GAP [ % ]
62.4¢/ $1
WAGE / INCOME GAP [ $ ]
$13,970
FAMILY INCOME DEFICIT
0.44
INEQUALITY / GINI INDEX
7,691
TOTAL POPULATION
3,808
MALE POPULATION
3,883
FEMALE POPULATION
98.07
MALES / 100 FEMALES
101.97
FEMALES / 100 MALES
42.3
MEDIAN AGE
3.0
AVG FAMILY SIZE
2.2
AVG HOUSEHOLD SIZE
3,136
LABOR FORCE [ PEOPLE ]
51.0%
PERCENT IN LABOR FORCE
4.1%
UNEMPLOYMENT RATE
Ludington Zip Codes
Ludington Area Codes
Income in Ludington
Income Overview in Ludington
Per Capita Income in Ludington is $30,385, while median incomes of families and households are $75,521 and $49,503 respectively.
| Characteristic | Number | Measure |
| Per Capita Income | 7,691 | $30,385 |
| Median Family Income | 1,852 | $75,521 |
| Mean Family Income | 1,852 | $87,606 |
| Median Household Income | 3,469 | $49,503 |
| Mean Household Income | 3,469 | $66,614 |
| Income Deficit | 1,852 | $13,970 |
| Wage / Income Gap (%) | 7,691 | 37.59% |
| Wage / Income Gap ($) | 7,691 | 62.41¢ per $1 |
| Gini / Inequality Index | 7,691 | 0.44 |
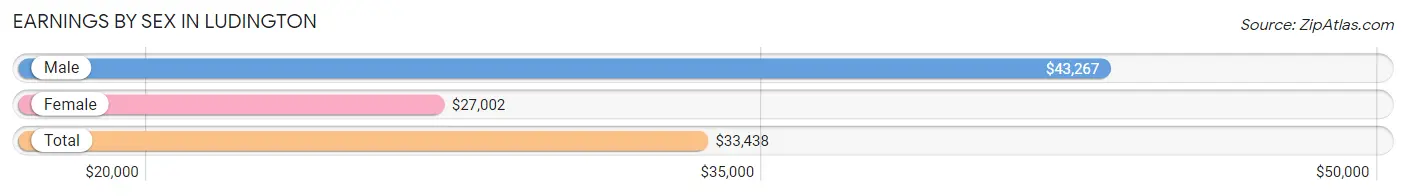
Earnings by Sex in Ludington
Average Earnings in Ludington are $33,438, $43,267 for men and $27,002 for women, a difference of 37.6%.
| Sex | Number | Average Earnings |
| Male | 1,500 (45.9%) | $43,267 |
| Female | 1,771 (54.1%) | $27,002 |
| Total | 3,271 (100.0%) | $33,438 |
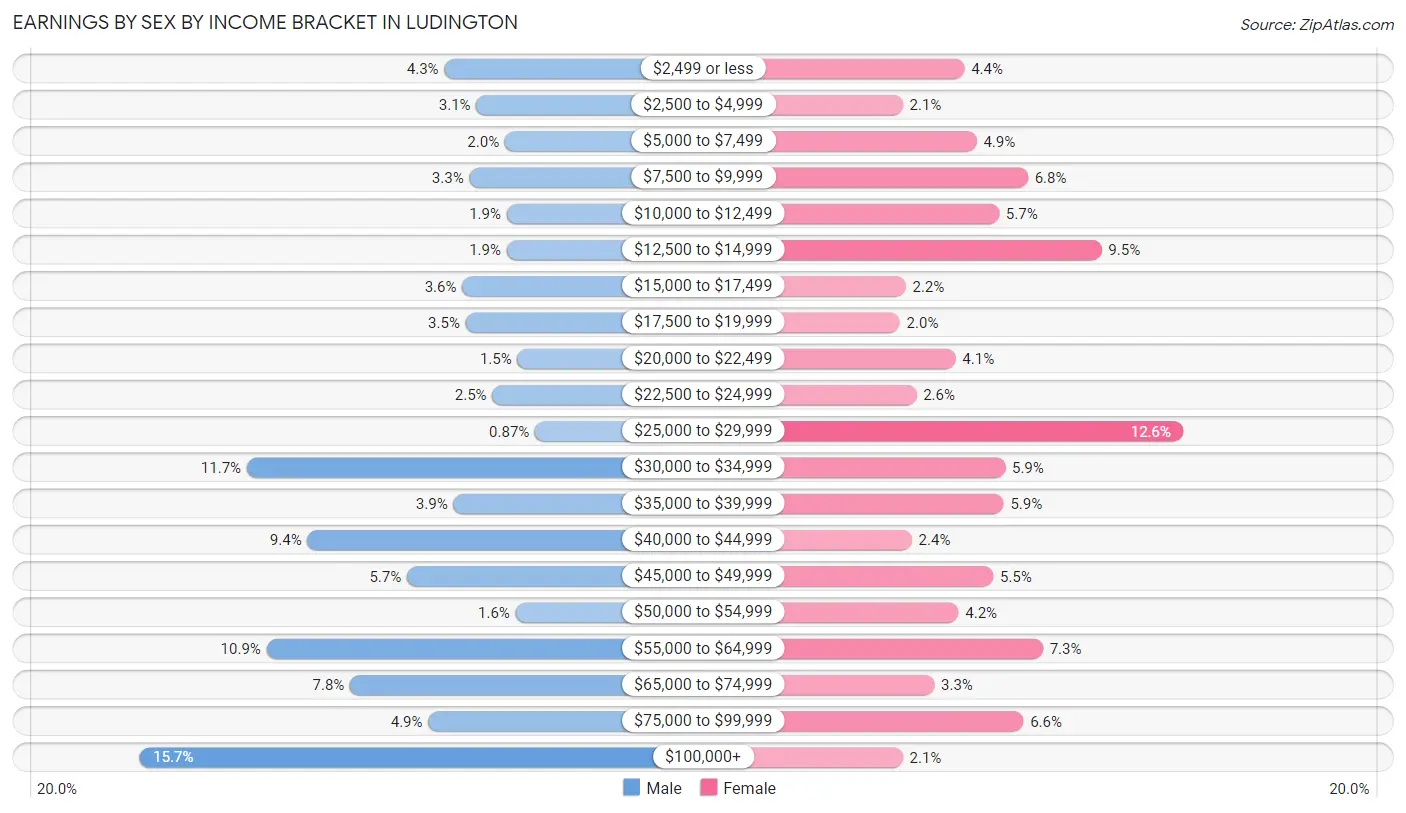
Earnings by Sex by Income Bracket in Ludington
The most common earnings brackets in Ludington are $100,000+ for men (235 | 15.7%) and $25,000 to $29,999 for women (223 | 12.6%).
| Income | Male | Female |
| $2,499 or less | 64 (4.3%) | 78 (4.4%) |
| $2,500 to $4,999 | 46 (3.1%) | 37 (2.1%) |
| $5,000 to $7,499 | 30 (2.0%) | 86 (4.9%) |
| $7,500 to $9,999 | 50 (3.3%) | 120 (6.8%) |
| $10,000 to $12,499 | 29 (1.9%) | 101 (5.7%) |
| $12,500 to $14,999 | 29 (1.9%) | 169 (9.5%) |
| $15,000 to $17,499 | 54 (3.6%) | 39 (2.2%) |
| $17,500 to $19,999 | 52 (3.5%) | 35 (2.0%) |
| $20,000 to $22,499 | 23 (1.5%) | 72 (4.1%) |
| $22,500 to $24,999 | 37 (2.5%) | 46 (2.6%) |
| $25,000 to $29,999 | 13 (0.9%) | 223 (12.6%) |
| $30,000 to $34,999 | 175 (11.7%) | 105 (5.9%) |
| $35,000 to $39,999 | 59 (3.9%) | 104 (5.9%) |
| $40,000 to $44,999 | 141 (9.4%) | 43 (2.4%) |
| $45,000 to $49,999 | 85 (5.7%) | 97 (5.5%) |
| $50,000 to $54,999 | 24 (1.6%) | 74 (4.2%) |
| $55,000 to $64,999 | 164 (10.9%) | 130 (7.3%) |
| $65,000 to $74,999 | 117 (7.8%) | 58 (3.3%) |
| $75,000 to $99,999 | 73 (4.9%) | 117 (6.6%) |
| $100,000+ | 235 (15.7%) | 37 (2.1%) |
| Total | 1,500 (100.0%) | 1,771 (100.0%) |
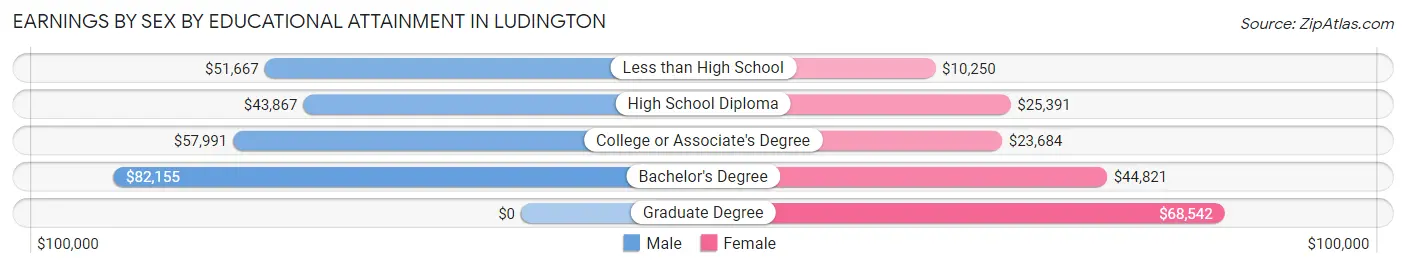
Earnings by Sex by Educational Attainment in Ludington
Average earnings in Ludington are $50,781 for men and $27,461 for women, a difference of 45.9%. Men with an educational attainment of bachelor's degree enjoy the highest average annual earnings of $82,155, while those with high school diploma education earn the least with $43,867. Women with an educational attainment of graduate degree earn the most with the average annual earnings of $68,542, while those with less than high school education have the smallest earnings of $10,250.
| Educational Attainment | Male Income | Female Income |
| Less than High School | $51,667 | $10,250 |
| High School Diploma | $43,867 | $25,391 |
| College or Associate's Degree | $57,991 | $23,684 |
| Bachelor's Degree | $82,155 | $44,821 |
| Graduate Degree | - | - |
| Total | $50,781 | $27,461 |
Family Income in Ludington
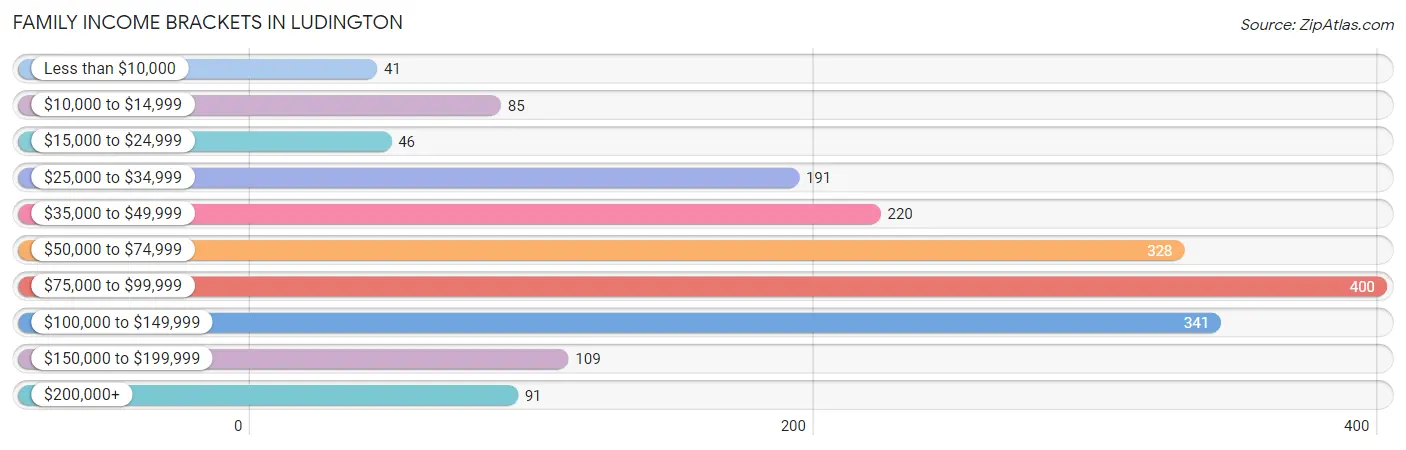
Family Income Brackets in Ludington
According to the Ludington family income data, there are 400 families falling into the $75,000 to $99,999 income range, which is the most common income bracket and makes up 21.6% of all families. Conversely, the less than $10,000 income bracket is the least frequent group with only 41 families (2.2%) belonging to this category.
| Income Bracket | # Families | % Families |
| Less than $10,000 | 41 | 2.2% |
| $10,000 to $14,999 | 85 | 4.6% |
| $15,000 to $24,999 | 46 | 2.5% |
| $25,000 to $34,999 | 191 | 10.3% |
| $35,000 to $49,999 | 220 | 11.9% |
| $50,000 to $74,999 | 328 | 17.7% |
| $75,000 to $99,999 | 400 | 21.6% |
| $100,000 to $149,999 | 341 | 18.4% |
| $150,000 to $199,999 | 109 | 5.9% |
| $200,000+ | 91 | 4.9% |
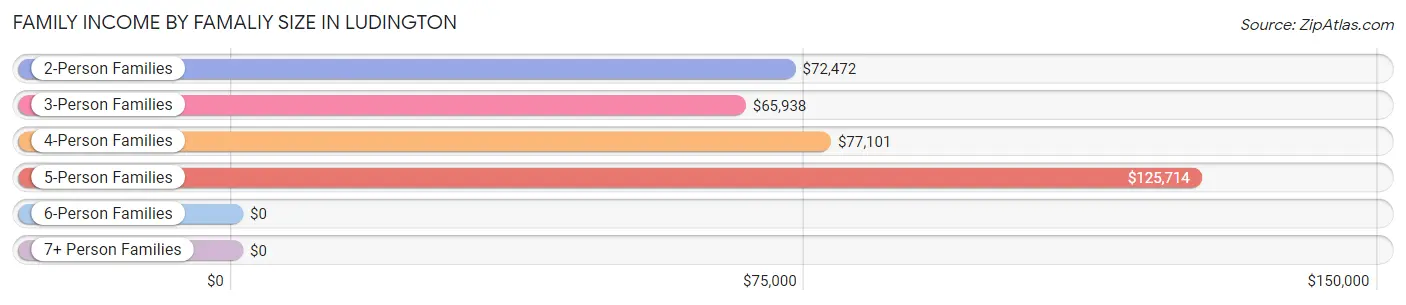
Family Income by Famaliy Size in Ludington
5-person families (172 | 9.3%) account for the highest median family income in Ludington with $125,714 per family, while 2-person families (950 | 51.3%) have the highest median income of $36,236 per family member.
| Income Bracket | # Families | Median Income |
| 2-Person Families | 950 (51.3%) | $72,472 |
| 3-Person Families | 496 (26.8%) | $65,938 |
| 4-Person Families | 127 (6.9%) | $77,101 |
| 5-Person Families | 172 (9.3%) | $125,714 |
| 6-Person Families | 13 (0.7%) | $0 |
| 7+ Person Families | 94 (5.1%) | $0 |
| Total | 1,852 (100.0%) | $75,521 |
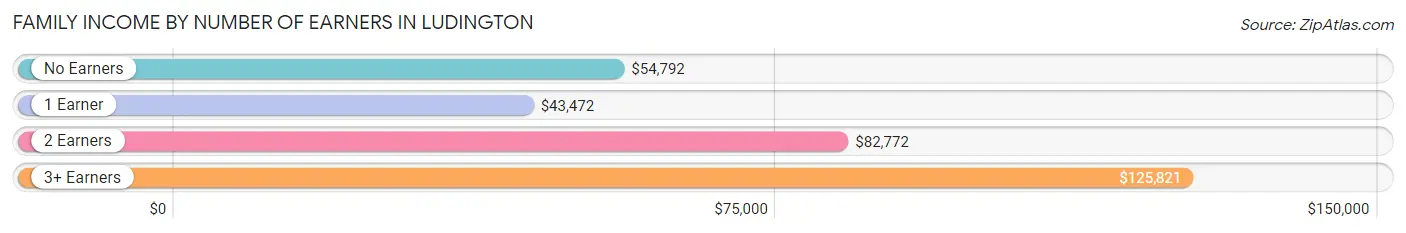
Family Income by Number of Earners in Ludington
The median family income in Ludington is $75,521, with families comprising 3+ earners (219) having the highest median family income of $125,821, while families with 1 earner (523) have the lowest median family income of $43,472, accounting for 11.8% and 28.2% of families, respectively.
| Number of Earners | # Families | Median Income |
| No Earners | 451 (24.3%) | $54,792 |
| 1 Earner | 523 (28.2%) | $43,472 |
| 2 Earners | 659 (35.6%) | $82,772 |
| 3+ Earners | 219 (11.8%) | $125,821 |
| Total | 1,852 (100.0%) | $75,521 |
Household Income in Ludington
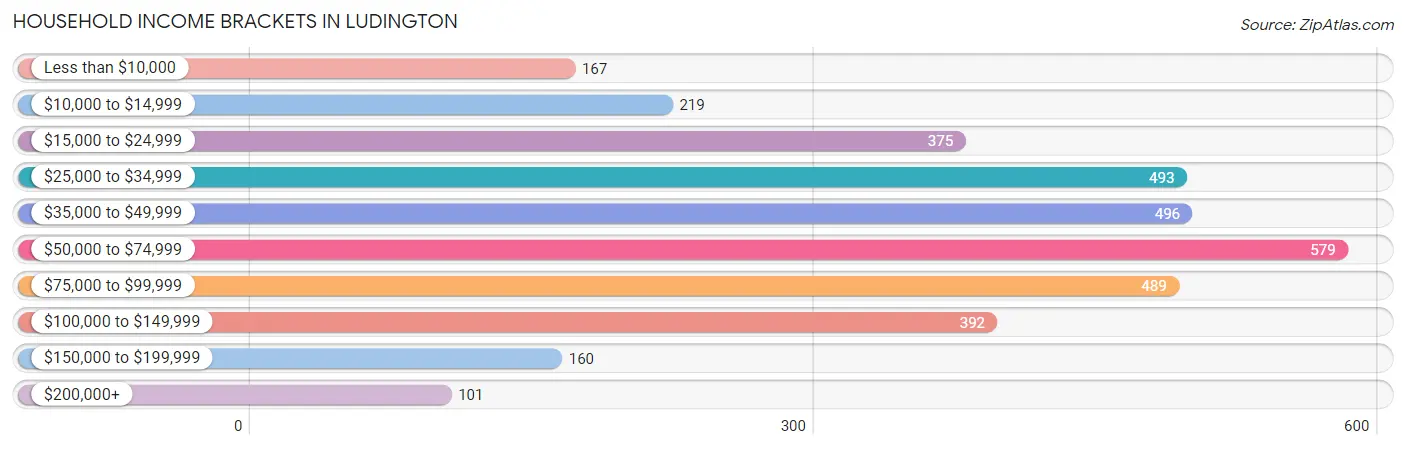
Household Income Brackets in Ludington
With 579 households falling in the category, the $50,000 to $74,999 income range is the most frequent in Ludington, accounting for 16.7% of all households. In contrast, only 101 households (2.9%) fall into the $200,000+ income bracket, making it the least populous group.
| Income Bracket | # Households | % Households |
| Less than $10,000 | 167 | 4.8% |
| $10,000 to $14,999 | 219 | 6.3% |
| $15,000 to $24,999 | 375 | 10.8% |
| $25,000 to $34,999 | 493 | 14.2% |
| $35,000 to $49,999 | 496 | 14.3% |
| $50,000 to $74,999 | 579 | 16.7% |
| $75,000 to $99,999 | 489 | 14.1% |
| $100,000 to $149,999 | 392 | 11.3% |
| $150,000 to $199,999 | 160 | 4.6% |
| $200,000+ | 101 | 2.9% |
Household Income by Householder Age in Ludington
The median household income in Ludington is $49,503, with the highest median household income of $66,310 found in the 45 to 64 years age bracket for the primary householder. A total of 816 households (23.5%) fall into this category. Meanwhile, the 15 to 24 years age bracket for the primary householder has the lowest median household income of $0, with 71 households (2.1%) in this group.
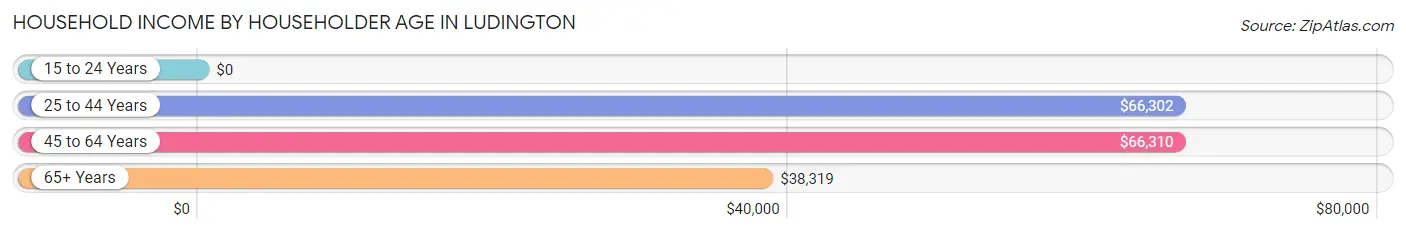
| Income Bracket | # Households | Median Income |
| 15 to 24 Years | 71 (2.1%) | $0 |
| 25 to 44 Years | 1,067 (30.8%) | $66,302 |
| 45 to 64 Years | 816 (23.5%) | $66,310 |
| 65+ Years | 1,515 (43.7%) | $38,319 |
| Total | 3,469 (100.0%) | $49,503 |
Poverty in Ludington
Income Below Poverty by Sex and Age in Ludington
With 20.6% poverty level for males and 19.7% for females among the residents of Ludington, 15 year old males and under 5 year old females are the most vulnerable to poverty, with 39 males (78.0%) and 38 females (52.8%) in their respective age groups living below the poverty level.
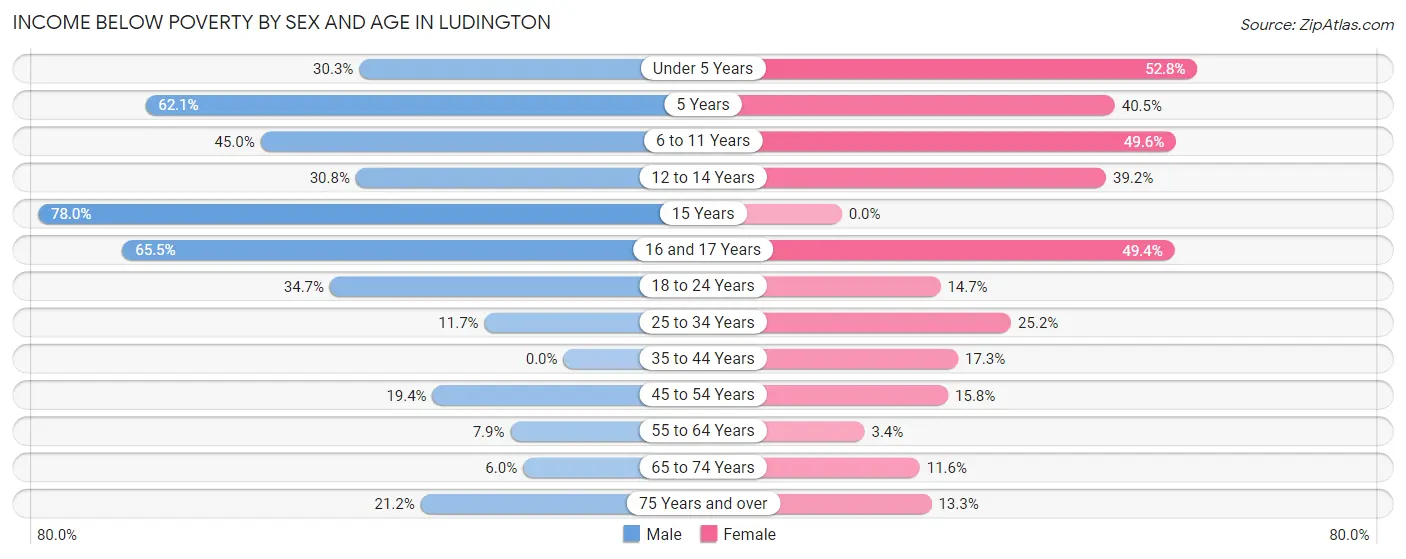
| Age Bracket | Male | Female |
| Under 5 Years | 84 (30.3%) | 38 (52.8%) |
| 5 Years | 54 (62.1%) | 15 (40.5%) |
| 6 to 11 Years | 170 (45.0%) | 138 (49.6%) |
| 12 to 14 Years | 37 (30.8%) | 62 (39.2%) |
| 15 Years | 39 (78.0%) | 0 (0.0%) |
| 16 and 17 Years | 55 (65.5%) | 42 (49.4%) |
| 18 to 24 Years | 95 (34.7%) | 29 (14.6%) |
| 25 to 34 Years | 49 (11.7%) | 128 (25.2%) |
| 35 to 44 Years | 0 (0.0%) | 82 (17.3%) |
| 45 to 54 Years | 63 (19.4%) | 45 (15.8%) |
| 55 to 64 Years | 29 (7.9%) | 16 (3.4%) |
| 65 to 74 Years | 41 (6.0%) | 66 (11.6%) |
| 75 Years and over | 56 (21.2%) | 71 (13.3%) |
| Total | 772 (20.6%) | 732 (19.7%) |
Income Above Poverty by Sex and Age in Ludington
According to the poverty statistics in Ludington, males aged 35 to 44 years and females aged 15 years are the age groups that are most secure financially, with 100.0% of males and 100.0% of females in these age groups living above the poverty line.
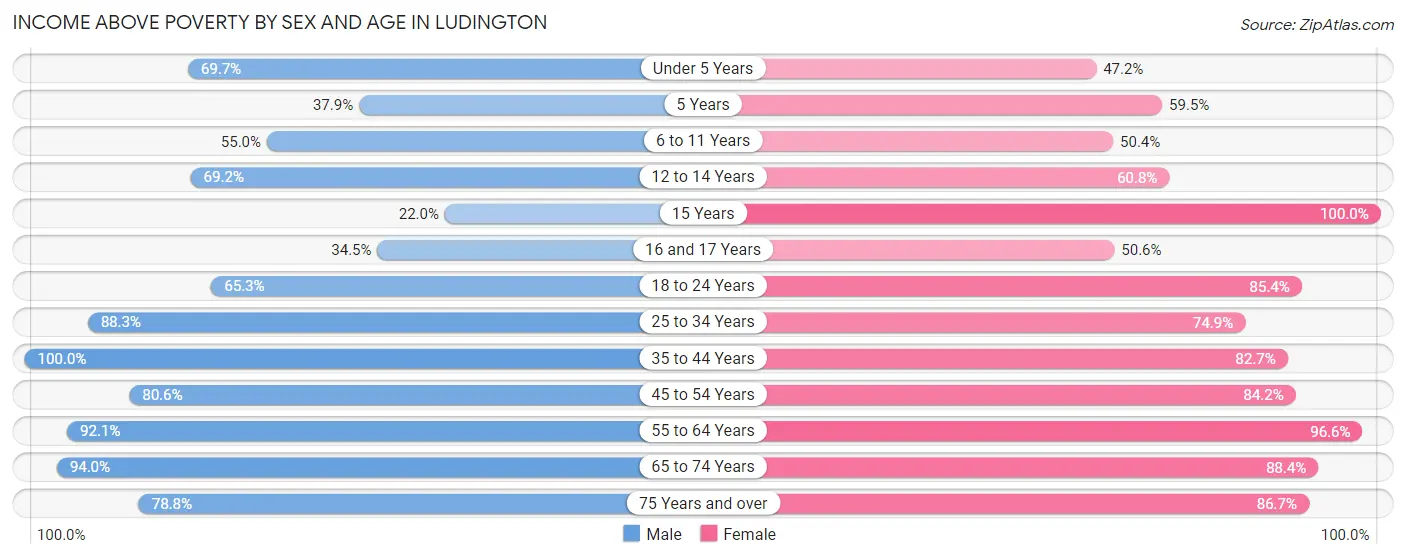
| Age Bracket | Male | Female |
| Under 5 Years | 193 (69.7%) | 34 (47.2%) |
| 5 Years | 33 (37.9%) | 22 (59.5%) |
| 6 to 11 Years | 208 (55.0%) | 140 (50.4%) |
| 12 to 14 Years | 83 (69.2%) | 96 (60.8%) |
| 15 Years | 11 (22.0%) | 49 (100.0%) |
| 16 and 17 Years | 29 (34.5%) | 43 (50.6%) |
| 18 to 24 Years | 179 (65.3%) | 169 (85.4%) |
| 25 to 34 Years | 369 (88.3%) | 381 (74.9%) |
| 35 to 44 Years | 413 (100.0%) | 393 (82.7%) |
| 45 to 54 Years | 261 (80.6%) | 240 (84.2%) |
| 55 to 64 Years | 339 (92.1%) | 458 (96.6%) |
| 65 to 74 Years | 643 (94.0%) | 504 (88.4%) |
| 75 Years and over | 208 (78.8%) | 462 (86.7%) |
| Total | 2,969 (79.4%) | 2,991 (80.3%) |
Income Below Poverty Among Married-Couple Families in Ludington
The poverty statistics for married-couple families in Ludington show that 7.9% or 114 of the total 1,452 families live below the poverty line. Families with 5 or more children have the highest poverty rate of 100.0%, comprising of 52 families. On the other hand, families with 1 or 2 children have the lowest poverty rate of 0.0%, which includes 0 families.
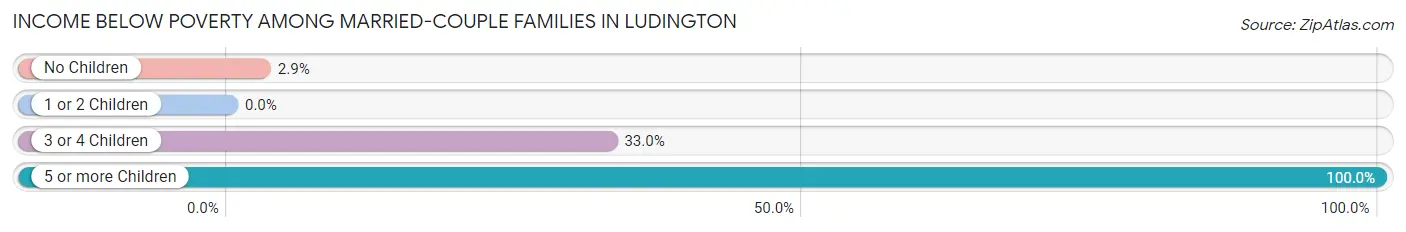
| Children | Above Poverty | Below Poverty |
| No Children | 883 (97.1%) | 26 (2.9%) |
| 1 or 2 Children | 382 (100.0%) | 0 (0.0%) |
| 3 or 4 Children | 73 (67.0%) | 36 (33.0%) |
| 5 or more Children | 0 (0.0%) | 52 (100.0%) |
| Total | 1,338 (92.1%) | 114 (7.9%) |
Income Below Poverty Among Single-Parent Households in Ludington
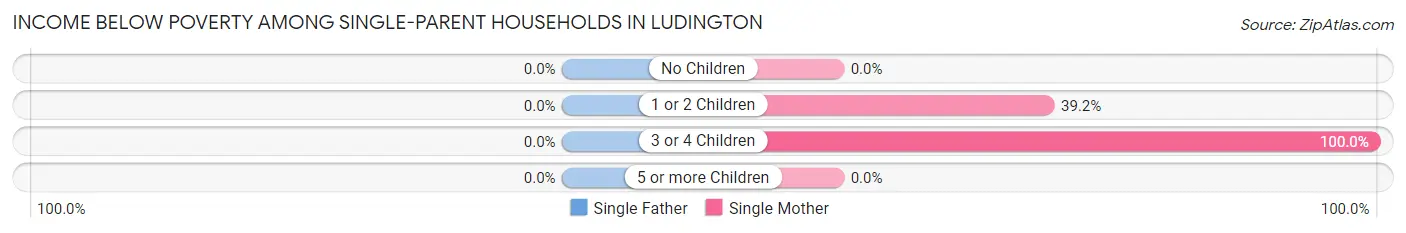
| Children | Single Father | Single Mother |
| No Children | 0 (0.0%) | 0 (0.0%) |
| 1 or 2 Children | 0 (0.0%) | 69 (39.2%) |
| 3 or 4 Children | 0 (0.0%) | 49 (100.0%) |
| 5 or more Children | 0 (0.0%) | 0 (0.0%) |
| Total | 0 (0.0%) | 118 (35.3%) |
Income Below Poverty Among Married-Couple vs Single-Parent Households in Ludington
The poverty data for Ludington shows that 114 of the married-couple family households (7.9%) and 118 of the single-parent households (29.5%) are living below the poverty level. Within the married-couple family households, those with 5 or more children have the highest poverty rate, with 52 households (100.0%) falling below the poverty line. Among the single-parent households, those with 3 or 4 children have the highest poverty rate, with 49 household (100.0%) living below poverty.
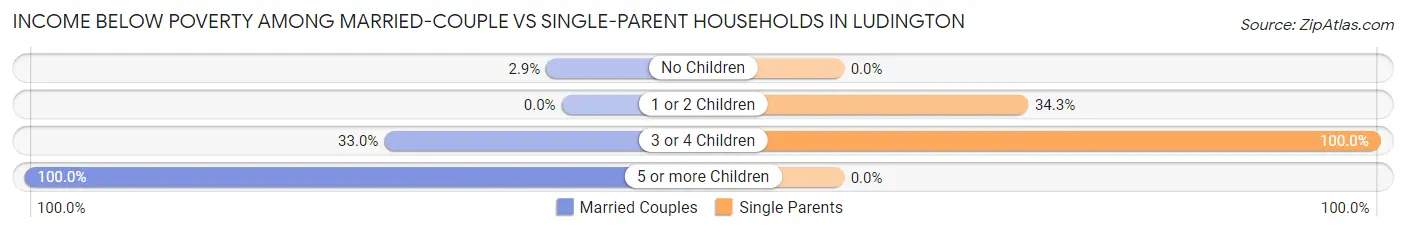
| Children | Married-Couple Families | Single-Parent Households |
| No Children | 26 (2.9%) | 0 (0.0%) |
| 1 or 2 Children | 0 (0.0%) | 69 (34.3%) |
| 3 or 4 Children | 36 (33.0%) | 49 (100.0%) |
| 5 or more Children | 52 (100.0%) | 0 (0.0%) |
| Total | 114 (7.9%) | 118 (29.5%) |
Race in Ludington
The most populous races in Ludington are White / Caucasian (7,020 | 91.3%), Hispanic or Latino (371 | 4.8%), and Two or more Races (287 | 3.7%).
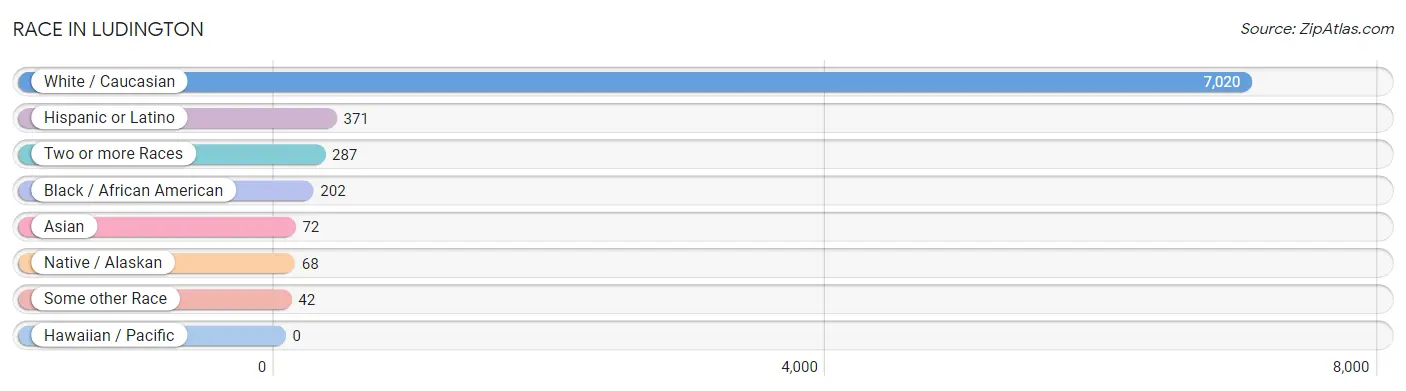
| Race | # Population | % Population |
| Asian | 72 | 0.9% |
| Black / African American | 202 | 2.6% |
| Hawaiian / Pacific | 0 | 0.0% |
| Hispanic or Latino | 371 | 4.8% |
| Native / Alaskan | 68 | 0.9% |
| White / Caucasian | 7,020 | 91.3% |
| Two or more Races | 287 | 3.7% |
| Some other Race | 42 | 0.5% |
| Total | 7,691 | 100.0% |
Ancestry in Ludington
The most populous ancestries reported in Ludington are German (2,503 | 32.5%), Irish (957 | 12.4%), English (893 | 11.6%), Polish (669 | 8.7%), and Mexican (312 | 4.1%), together accounting for 69.4% of all Ludington residents.
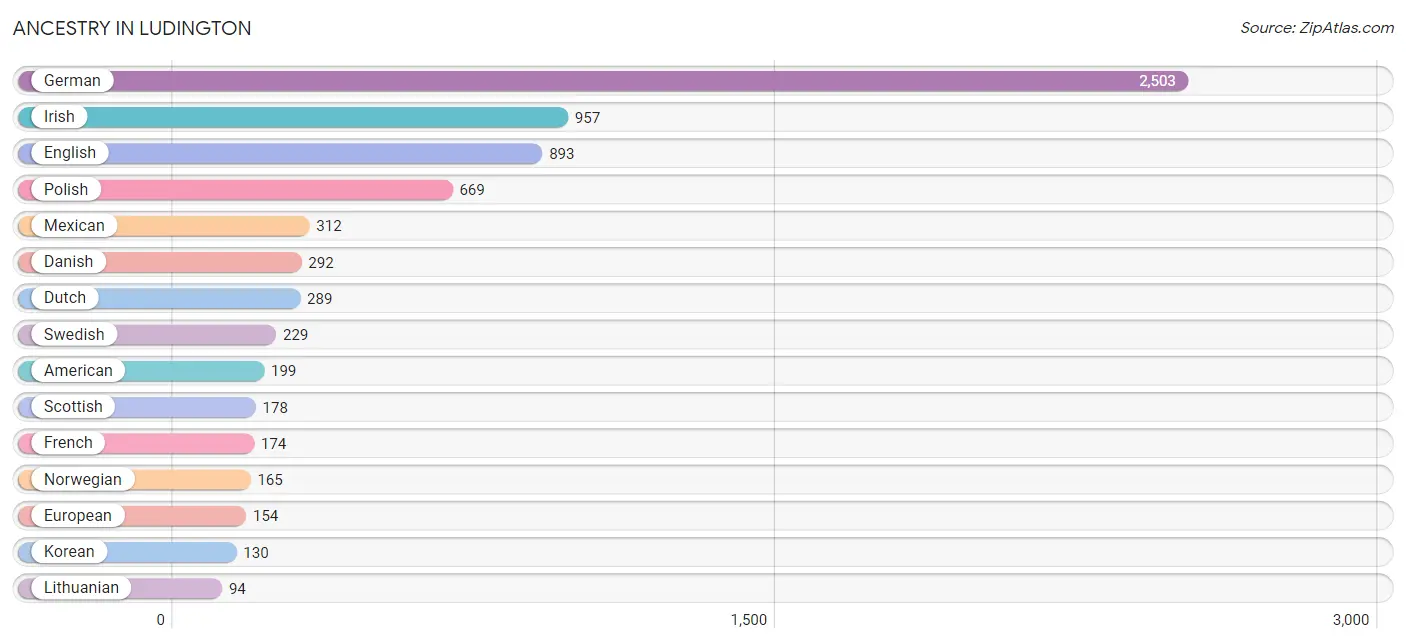
| Ancestry | # Population | % Population |
| American | 199 | 2.6% |
| Austrian | 20 | 0.3% |
| Belgian | 10 | 0.1% |
| British | 15 | 0.2% |
| Central American | 13 | 0.2% |
| Central American Indian | 13 | 0.2% |
| Chippewa | 33 | 0.4% |
| Czech | 69 | 0.9% |
| Danish | 292 | 3.8% |
| Dutch | 289 | 3.8% |
| English | 893 | 11.6% |
| European | 154 | 2.0% |
| Finnish | 8 | 0.1% |
| French | 174 | 2.3% |
| French Canadian | 51 | 0.7% |
| German | 2,503 | 32.5% |
| Greek | 20 | 0.3% |
| Guatemalan | 13 | 0.2% |
| Hungarian | 49 | 0.6% |
| Irish | 957 | 12.4% |
| Italian | 40 | 0.5% |
| Japanese | 3 | 0.0% |
| Korean | 130 | 1.7% |
| Latvian | 15 | 0.2% |
| Lithuanian | 94 | 1.2% |
| Mexican | 312 | 4.1% |
| Northern European | 12 | 0.2% |
| Norwegian | 165 | 2.1% |
| Ottawa | 59 | 0.8% |
| Polish | 669 | 8.7% |
| Russian | 17 | 0.2% |
| Scandinavian | 12 | 0.2% |
| Scotch-Irish | 31 | 0.4% |
| Scottish | 178 | 2.3% |
| Sioux | 37 | 0.5% |
| Spaniard | 46 | 0.6% |
| Swedish | 229 | 3.0% |
| Swiss | 15 | 0.2% |
| Thai | 46 | 0.6% |
| Ukrainian | 8 | 0.1% |
| Welsh | 39 | 0.5% |
| Yugoslavian | 28 | 0.4% | View All 42 Rows |
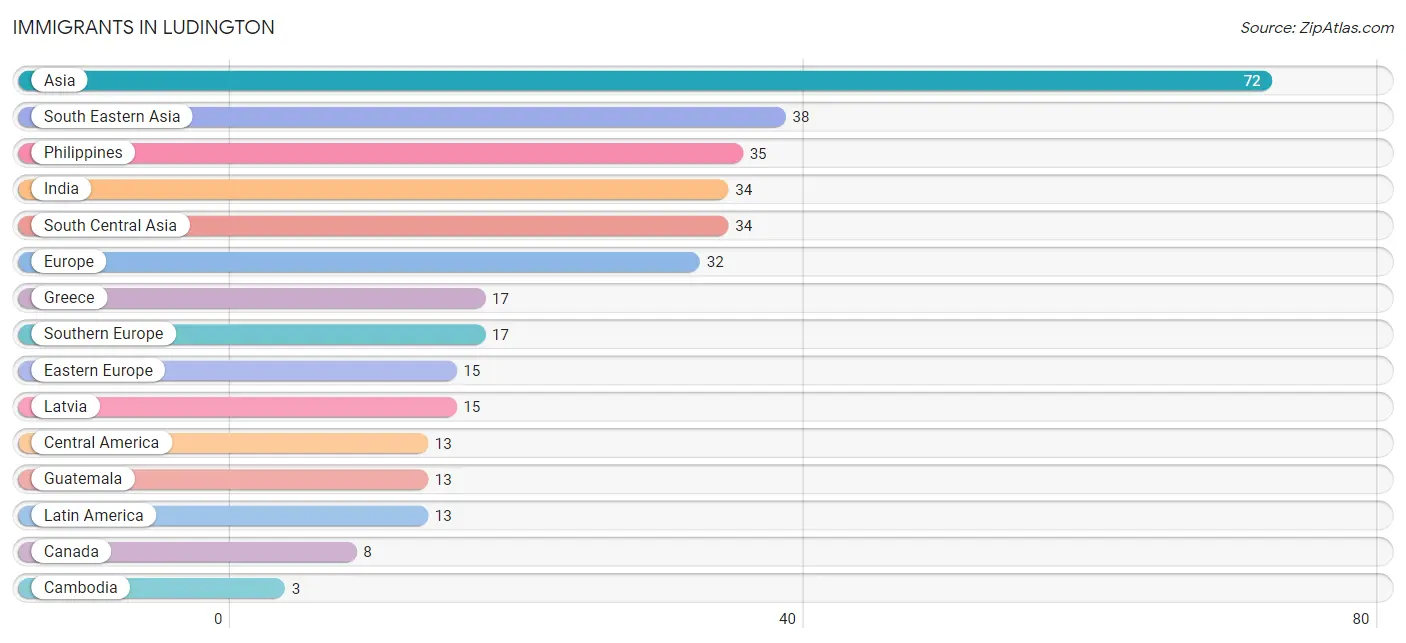
Immigrants in Ludington
The most numerous immigrant groups reported in Ludington came from Asia (72 | 0.9%), South Eastern Asia (38 | 0.5%), Philippines (35 | 0.5%), India (34 | 0.4%), and South Central Asia (34 | 0.4%), together accounting for 2.8% of all Ludington residents.
| Immigration Origin | # Population | % Population |
| Asia | 72 | 0.9% |
| Cambodia | 3 | 0.0% |
| Canada | 8 | 0.1% |
| Central America | 13 | 0.2% |
| Eastern Europe | 15 | 0.2% |
| Europe | 32 | 0.4% |
| Greece | 17 | 0.2% |
| Guatemala | 13 | 0.2% |
| India | 34 | 0.4% |
| Latin America | 13 | 0.2% |
| Latvia | 15 | 0.2% |
| Philippines | 35 | 0.5% |
| South Central Asia | 34 | 0.4% |
| South Eastern Asia | 38 | 0.5% |
| Southern Europe | 17 | 0.2% | View All 15 Rows |
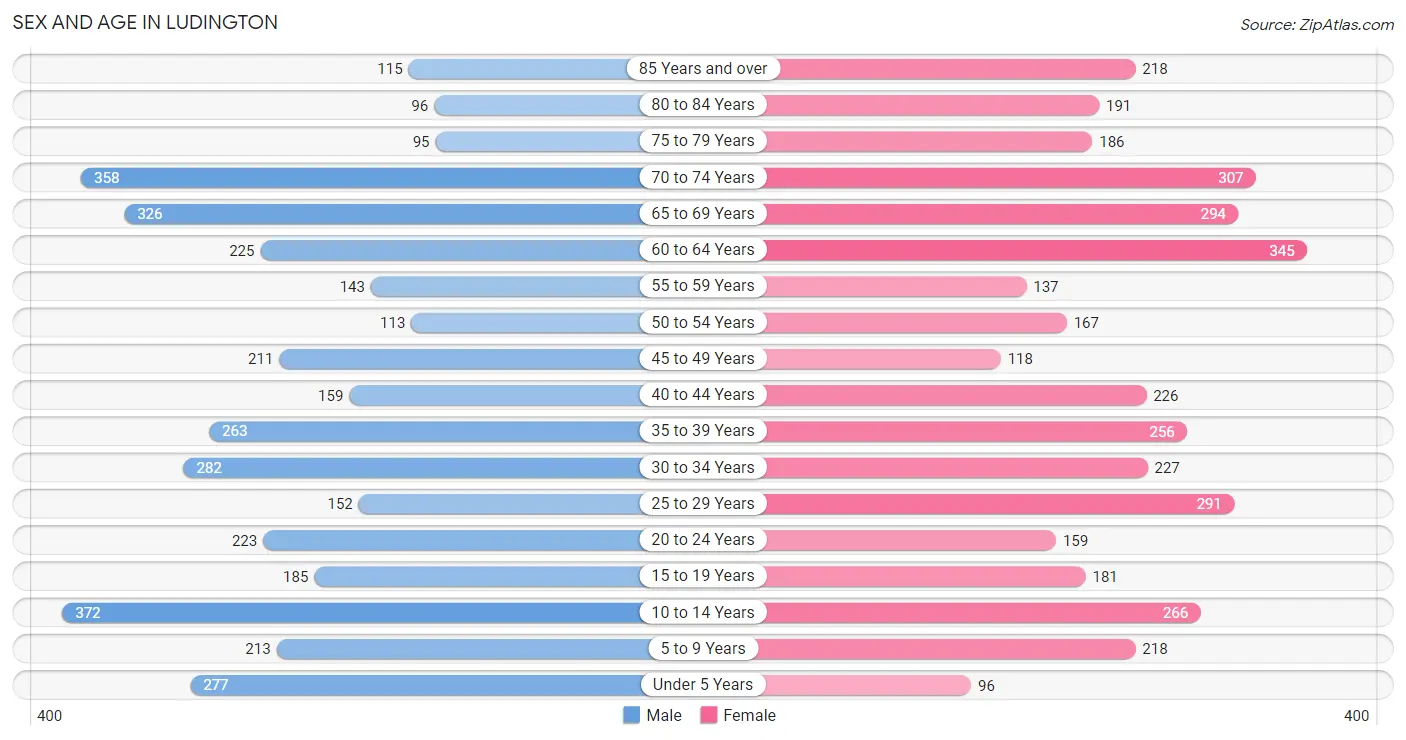
Sex and Age in Ludington
Sex and Age in Ludington
The most populous age groups in Ludington are 10 to 14 Years (372 | 9.8%) for men and 60 to 64 Years (345 | 8.9%) for women.
| Age Bracket | Male | Female |
| Under 5 Years | 277 (7.3%) | 96 (2.5%) |
| 5 to 9 Years | 213 (5.6%) | 218 (5.6%) |
| 10 to 14 Years | 372 (9.8%) | 266 (6.9%) |
| 15 to 19 Years | 185 (4.9%) | 181 (4.7%) |
| 20 to 24 Years | 223 (5.9%) | 159 (4.1%) |
| 25 to 29 Years | 152 (4.0%) | 291 (7.5%) |
| 30 to 34 Years | 282 (7.4%) | 227 (5.9%) |
| 35 to 39 Years | 263 (6.9%) | 256 (6.6%) |
| 40 to 44 Years | 159 (4.2%) | 226 (5.8%) |
| 45 to 49 Years | 211 (5.5%) | 118 (3.0%) |
| 50 to 54 Years | 113 (3.0%) | 167 (4.3%) |
| 55 to 59 Years | 143 (3.8%) | 137 (3.5%) |
| 60 to 64 Years | 225 (5.9%) | 345 (8.9%) |
| 65 to 69 Years | 326 (8.6%) | 294 (7.6%) |
| 70 to 74 Years | 358 (9.4%) | 307 (7.9%) |
| 75 to 79 Years | 95 (2.5%) | 186 (4.8%) |
| 80 to 84 Years | 96 (2.5%) | 191 (4.9%) |
| 85 Years and over | 115 (3.0%) | 218 (5.6%) |
| Total | 3,808 (100.0%) | 3,883 (100.0%) |
Families and Households in Ludington
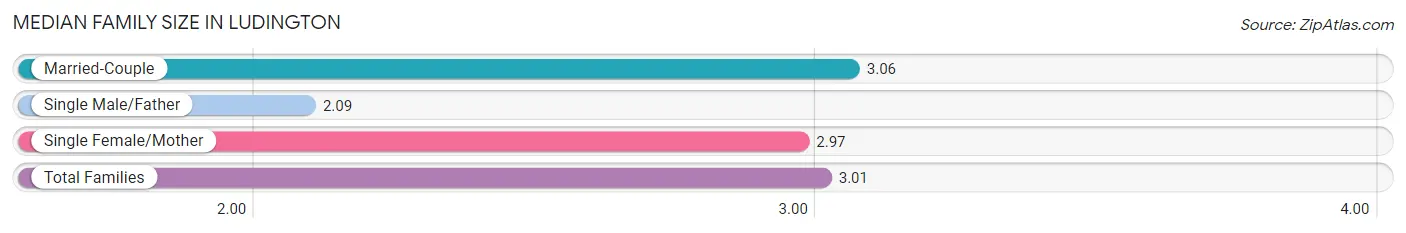
Median Family Size in Ludington
The median family size in Ludington is 3.01 persons per family, with married-couple families (1,452 | 78.4%) accounting for the largest median family size of 3.06 persons per family. On the other hand, single male/father families (66 | 3.6%) represent the smallest median family size with 2.09 persons per family.
| Family Type | # Families | Family Size |
| Married-Couple | 1,452 (78.4%) | 3.06 |
| Single Male/Father | 66 (3.6%) | 2.09 |
| Single Female/Mother | 334 (18.0%) | 2.97 |
| Total Families | 1,852 (100.0%) | 3.01 |
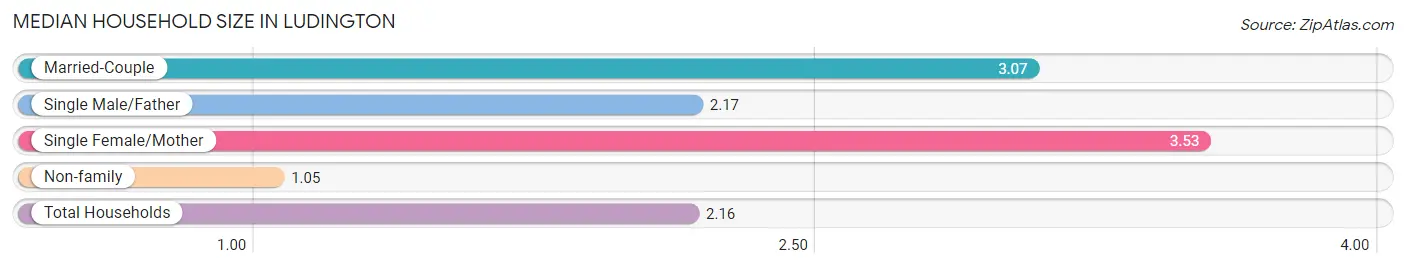
Median Household Size in Ludington
The median household size in Ludington is 2.16 persons per household, with single female/mother households (334 | 9.6%) accounting for the largest median household size of 3.53 persons per household. non-family households (1,617 | 46.6%) represent the smallest median household size with 1.05 persons per household.
| Household Type | # Households | Household Size |
| Married-Couple | 1,452 (41.9%) | 3.07 |
| Single Male/Father | 66 (1.9%) | 2.17 |
| Single Female/Mother | 334 (9.6%) | 3.53 |
| Non-family | 1,617 (46.6%) | 1.05 |
| Total Households | 3,469 (100.0%) | 2.16 |
Household Size by Marriage Status in Ludington
Out of a total of 3,469 households in Ludington, 1,852 (53.4%) are family households, while 1,617 (46.6%) are nonfamily households. The most numerous type of family households are 2-person households, comprising 898, and the most common type of nonfamily households are 1-person households, comprising 1,556.
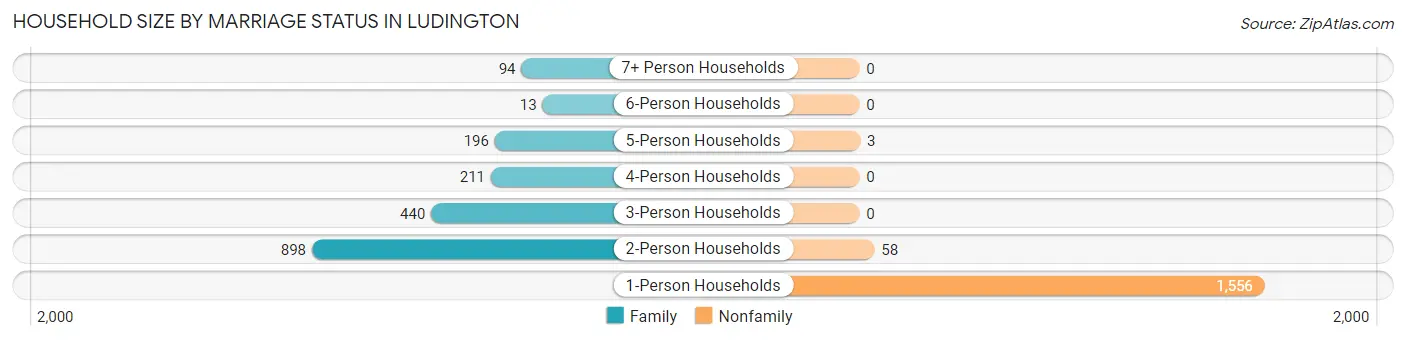
| Household Size | Family Households | Nonfamily Households |
| 1-Person Households | - | 1,556 (44.9%) |
| 2-Person Households | 898 (25.9%) | 58 (1.7%) |
| 3-Person Households | 440 (12.7%) | 0 (0.0%) |
| 4-Person Households | 211 (6.1%) | 0 (0.0%) |
| 5-Person Households | 196 (5.7%) | 3 (0.1%) |
| 6-Person Households | 13 (0.4%) | 0 (0.0%) |
| 7+ Person Households | 94 (2.7%) | 0 (0.0%) |
| Total | 1,852 (53.4%) | 1,617 (46.6%) |
Female Fertility in Ludington
Fertility by Age in Ludington
Average fertility rate in Ludington is 5.0 births per 1,000 women. Women in the age bracket of 20 to 34 years have the highest fertility rate with 12.0 births per 1,000 women. Women in the age bracket of 20 to 34 years acount for 100.0% of all women with births.
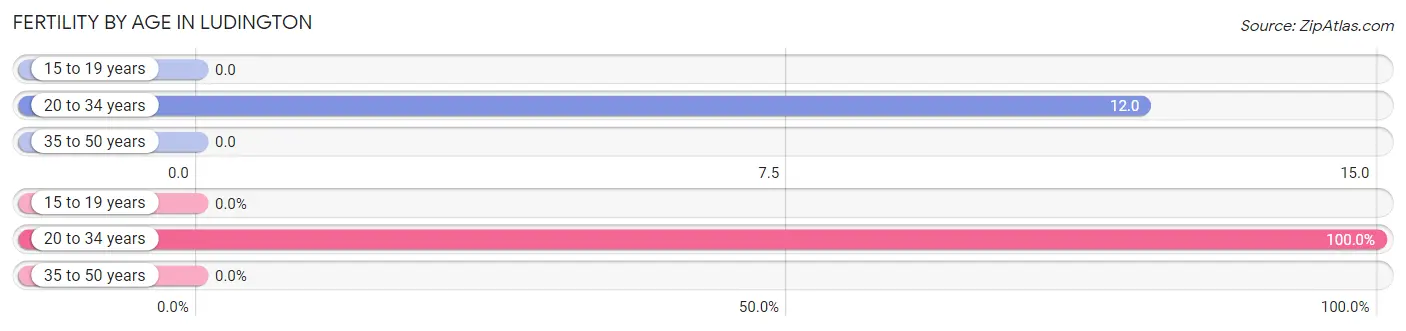
| Age Bracket | Women with Births | Births / 1,000 Women |
| 15 to 19 years | 0 (0.0%) | 0.0 |
| 20 to 34 years | 8 (100.0%) | 12.0 |
| 35 to 50 years | 0 (0.0%) | 0.0 |
| Total | 8 (100.0%) | 5.0 |
Fertility by Age by Marriage Status in Ludington
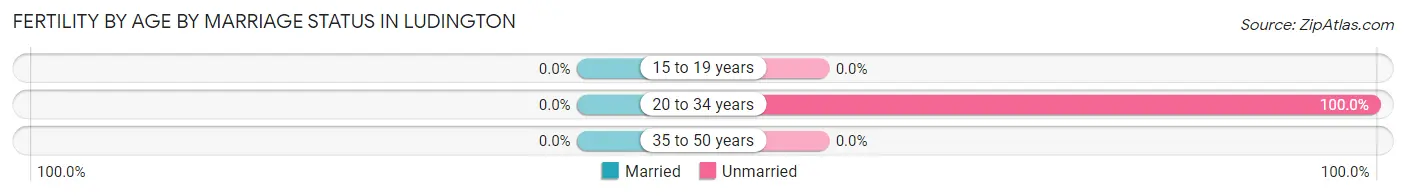
| Age Bracket | Married | Unmarried |
| 15 to 19 years | 0 (0.0%) | 0 (0.0%) |
| 20 to 34 years | 0 (0.0%) | 8 (100.0%) |
| 35 to 50 years | 0 (0.0%) | 0 (0.0%) |
| Total | 0 (0.0%) | 8 (100.0%) |
Fertility by Education in Ludington
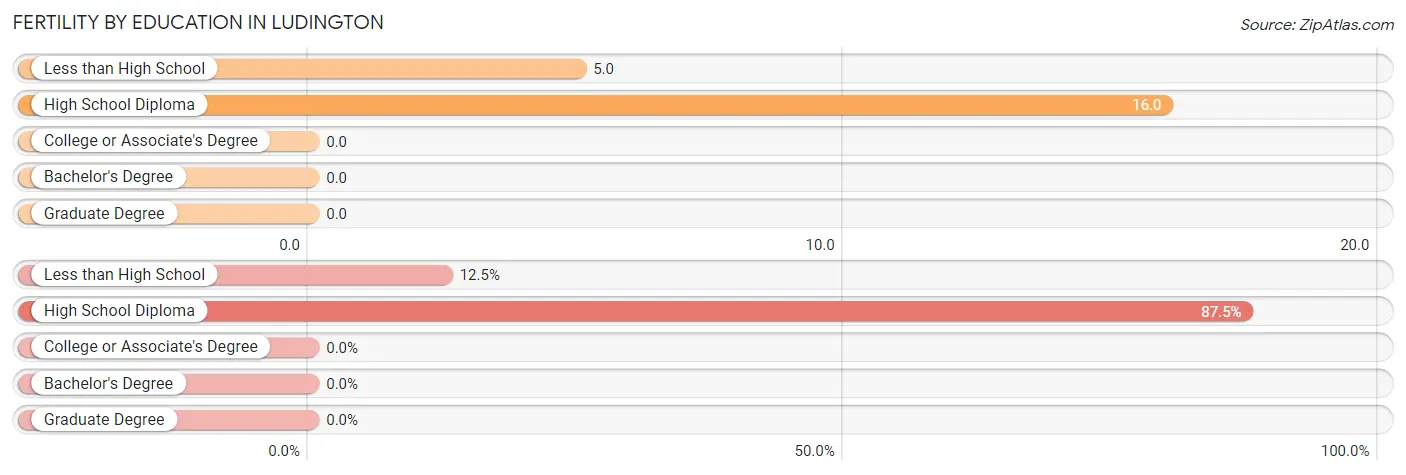
| Educational Attainment | Women with Births | Births / 1,000 Women |
| Less than High School | 1 (12.5%) | 5.0 |
| High School Diploma | 7 (87.5%) | 16.0 |
| College or Associate's Degree | 0 (0.0%) | 0.0 |
| Bachelor's Degree | 0 (0.0%) | 0.0 |
| Graduate Degree | 0 (0.0%) | 0.0 |
| Total | 8 (100.0%) | 5.0 |
Fertility by Education by Marriage Status in Ludington
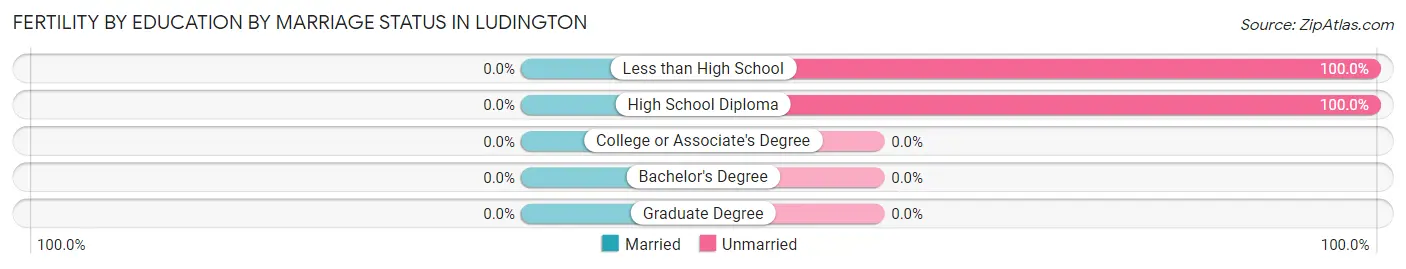
| Educational Attainment | Married | Unmarried |
| Less than High School | 0 (0.0%) | 1 (100.0%) |
| High School Diploma | 0 (0.0%) | 7 (100.0%) |
| College or Associate's Degree | 0 (0.0%) | 0 (0.0%) |
| Bachelor's Degree | 0 (0.0%) | 0 (0.0%) |
| Graduate Degree | 0 (0.0%) | 0 (0.0%) |
| Total | 0 (0.0%) | 8 (100.0%) |
Employment Characteristics in Ludington
Employment by Class of Employer in Ludington
Among the 2,969 employed individuals in Ludington, private company employees (2,157 | 72.7%), local government employees (269 | 9.1%), and not-for-profit organizations (218 | 7.3%) make up the most common classes of employment.
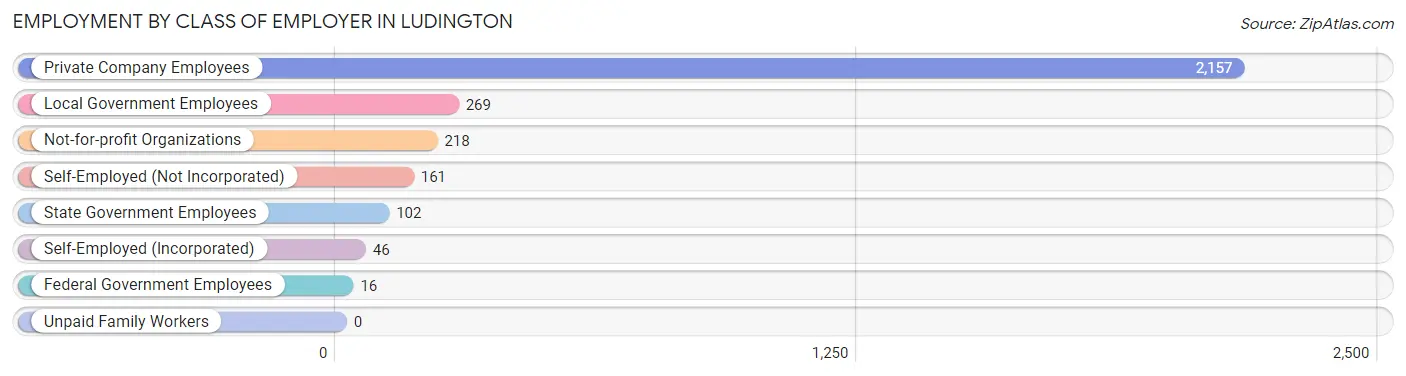
| Employer Class | # Employees | % Employees |
| Private Company Employees | 2,157 | 72.7% |
| Self-Employed (Incorporated) | 46 | 1.5% |
| Self-Employed (Not Incorporated) | 161 | 5.4% |
| Not-for-profit Organizations | 218 | 7.3% |
| Local Government Employees | 269 | 9.1% |
| State Government Employees | 102 | 3.4% |
| Federal Government Employees | 16 | 0.5% |
| Unpaid Family Workers | 0 | 0.0% |
| Total | 2,969 | 100.0% |
Employment Status by Age in Ludington
According to the labor force statistics for Ludington, out of the total population over 16 years of age (6,150), 51.0% or 3,136 individuals are in the labor force, with 4.1% or 129 of them unemployed. The age group with the highest labor force participation rate is 30 to 34 years, with 93.3% or 475 individuals in the labor force. Within the labor force, the 75 years and over age range has the highest percentage of unemployed individuals, with 48.4% or 15 of them being unemployed.
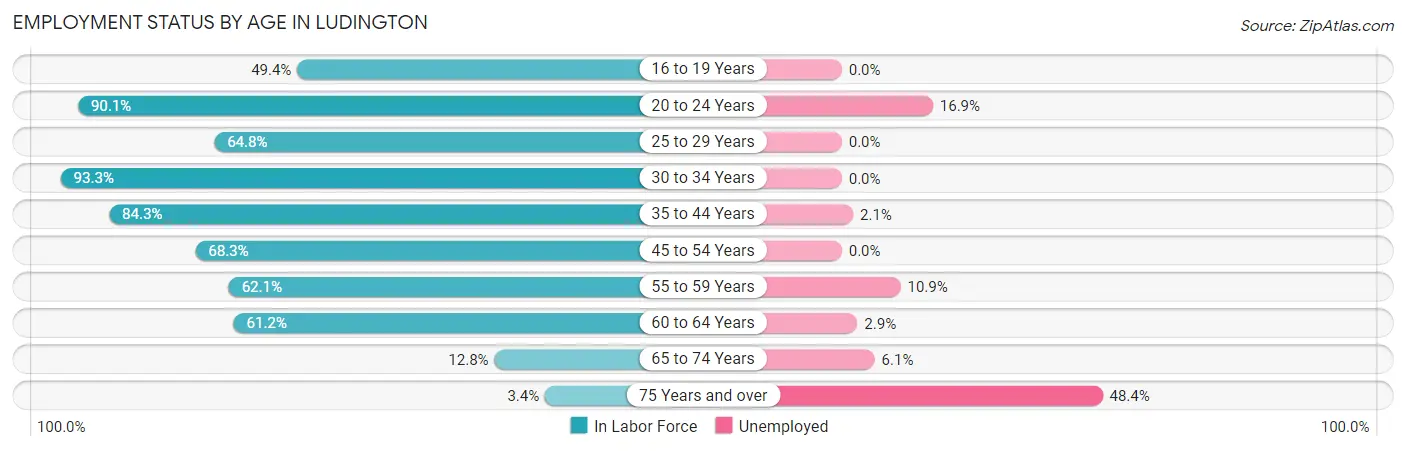
| Age Bracket | In Labor Force | Unemployed |
| 16 to 19 Years | 132 (49.4%) | 0 (0.0%) |
| 20 to 24 Years | 344 (90.1%) | 58 (16.9%) |
| 25 to 29 Years | 287 (64.8%) | 0 (0.0%) |
| 30 to 34 Years | 475 (93.3%) | 0 (0.0%) |
| 35 to 44 Years | 762 (84.3%) | 16 (2.1%) |
| 45 to 54 Years | 416 (68.3%) | 0 (0.0%) |
| 55 to 59 Years | 174 (62.1%) | 19 (10.9%) |
| 60 to 64 Years | 349 (61.2%) | 10 (2.9%) |
| 65 to 74 Years | 164 (12.8%) | 10 (6.1%) |
| 75 Years and over | 31 (3.4%) | 15 (48.4%) |
| Total | 3,136 (51.0%) | 129 (4.1%) |
Employment Status by Educational Attainment in Ludington
According to labor force statistics for Ludington, 74.3% of individuals (2,463) out of the total population between 25 and 64 years of age (3,315) are in the labor force, with 1.8% or 44 of them being unemployed. The group with the highest labor force participation rate are those with the educational attainment of bachelor's degree or higher, with 91.2% or 727 individuals in the labor force. Within the labor force, individuals with high school diploma education have the highest percentage of unemployment, with 2.5% or 19 of them being unemployed.
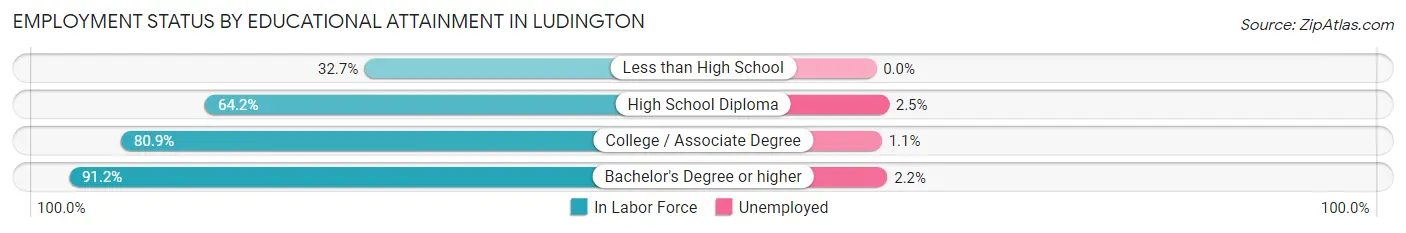
| Educational Attainment | In Labor Force | Unemployed |
| Less than High School | 72 (32.7%) | 0 (0.0%) |
| High School Diploma | 747 (64.2%) | 29 (2.5%) |
| College / Associate Degree | 917 (80.9%) | 12 (1.1%) |
| Bachelor's Degree or higher | 727 (91.2%) | 18 (2.2%) |
| Total | 2,463 (74.3%) | 60 (1.8%) |
Employment Occupations by Sex in Ludington
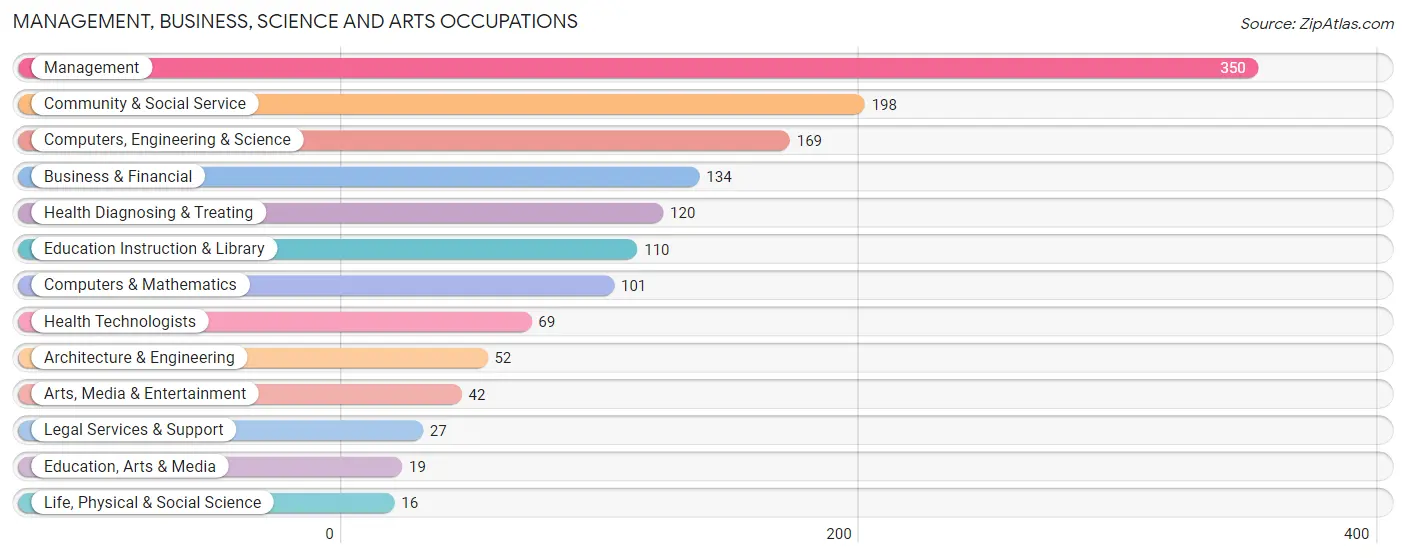
Management, Business, Science and Arts Occupations
The most common Management, Business, Science and Arts occupations in Ludington are Management (350 | 11.6%), Community & Social Service (198 | 6.6%), Computers, Engineering & Science (169 | 5.6%), Business & Financial (134 | 4.5%), and Health Diagnosing & Treating (120 | 4.0%).
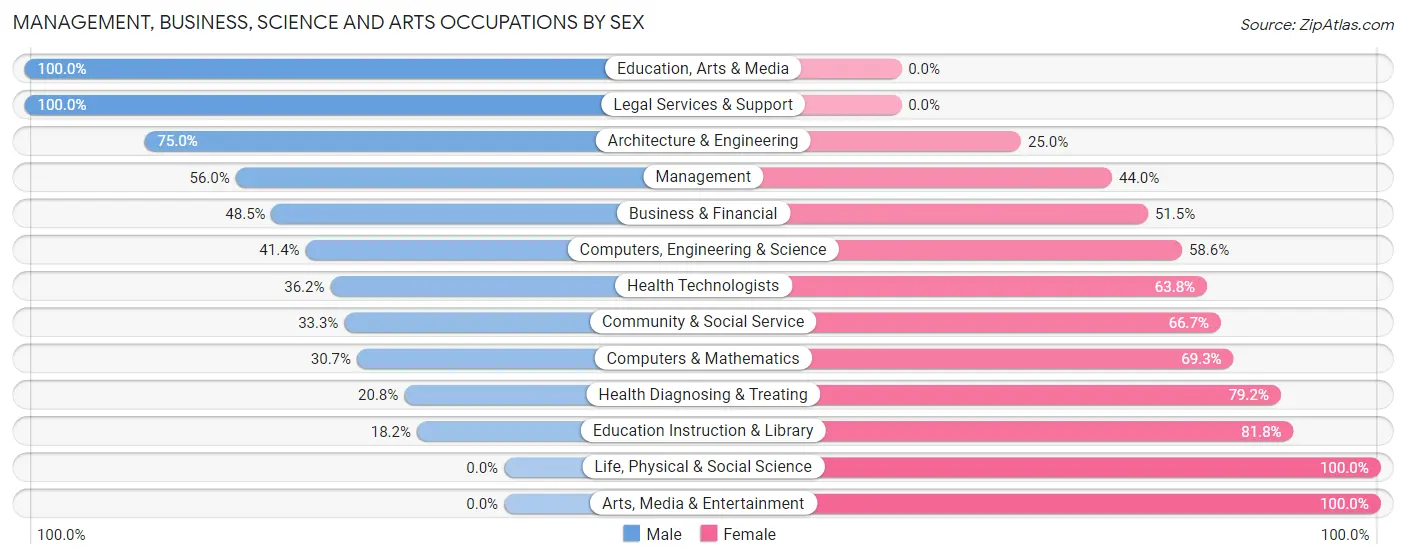
Management, Business, Science and Arts Occupations by Sex
Within the Management, Business, Science and Arts occupations in Ludington, the most male-oriented occupations are Education, Arts & Media (100.0%), Legal Services & Support (100.0%), and Architecture & Engineering (75.0%), while the most female-oriented occupations are Life, Physical & Social Science (100.0%), Arts, Media & Entertainment (100.0%), and Education Instruction & Library (81.8%).
| Occupation | Male | Female |
| Management | 196 (56.0%) | 154 (44.0%) |
| Business & Financial | 65 (48.5%) | 69 (51.5%) |
| Computers, Engineering & Science | 70 (41.4%) | 99 (58.6%) |
| Computers & Mathematics | 31 (30.7%) | 70 (69.3%) |
| Architecture & Engineering | 39 (75.0%) | 13 (25.0%) |
| Life, Physical & Social Science | 0 (0.0%) | 16 (100.0%) |
| Community & Social Service | 66 (33.3%) | 132 (66.7%) |
| Education, Arts & Media | 19 (100.0%) | 0 (0.0%) |
| Legal Services & Support | 27 (100.0%) | 0 (0.0%) |
| Education Instruction & Library | 20 (18.2%) | 90 (81.8%) |
| Arts, Media & Entertainment | 0 (0.0%) | 42 (100.0%) |
| Health Diagnosing & Treating | 25 (20.8%) | 95 (79.2%) |
| Health Technologists | 25 (36.2%) | 44 (63.8%) |
| Total (Category) | 422 (43.5%) | 549 (56.5%) |
| Total (Overall) | 1,400 (46.6%) | 1,606 (53.4%) |
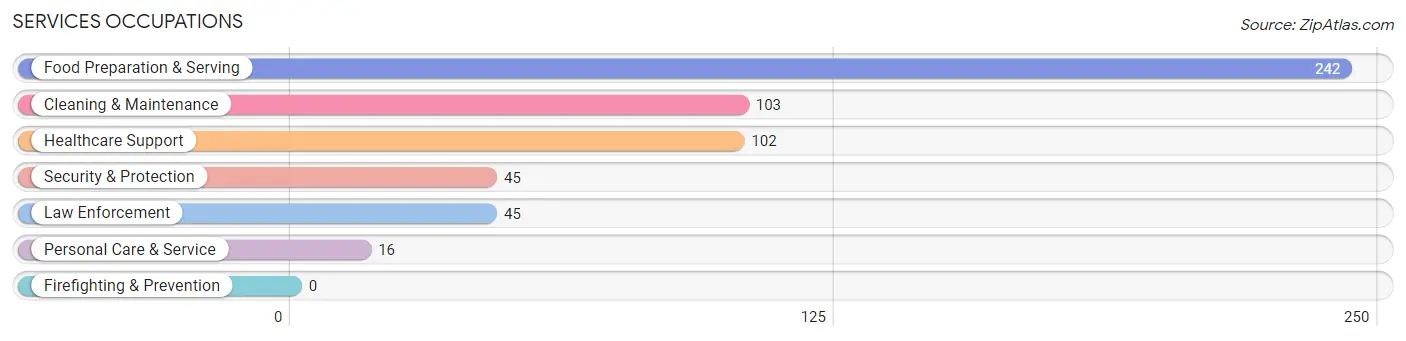
Services Occupations
The most common Services occupations in Ludington are Food Preparation & Serving (242 | 8.1%), Cleaning & Maintenance (103 | 3.4%), Healthcare Support (102 | 3.4%), Security & Protection (45 | 1.5%), and Law Enforcement (45 | 1.5%).
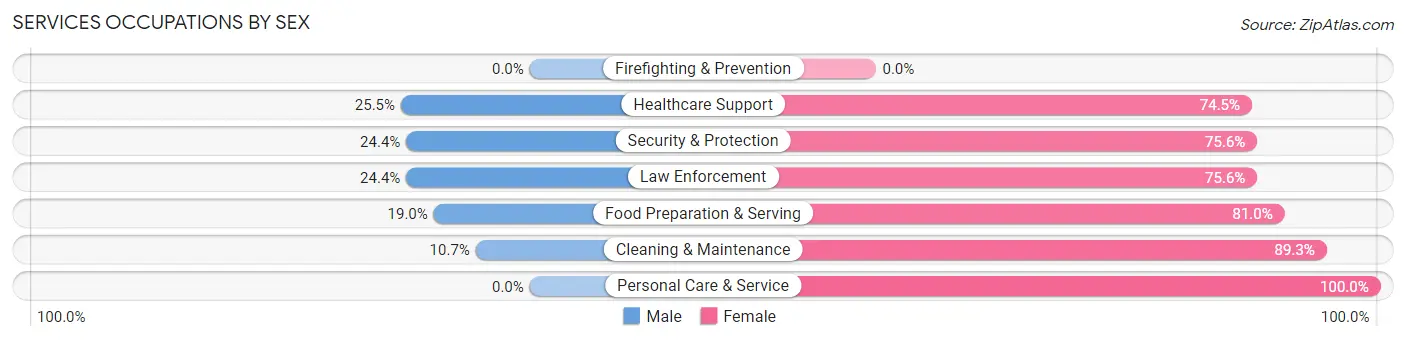
Services Occupations by Sex
Within the Services occupations in Ludington, the most male-oriented occupations are Healthcare Support (25.5%), Security & Protection (24.4%), and Law Enforcement (24.4%), while the most female-oriented occupations are Personal Care & Service (100.0%), Cleaning & Maintenance (89.3%), and Food Preparation & Serving (81.0%).
| Occupation | Male | Female |
| Healthcare Support | 26 (25.5%) | 76 (74.5%) |
| Security & Protection | 11 (24.4%) | 34 (75.6%) |
| Firefighting & Prevention | 0 (0.0%) | 0 (0.0%) |
| Law Enforcement | 11 (24.4%) | 34 (75.6%) |
| Food Preparation & Serving | 46 (19.0%) | 196 (81.0%) |
| Cleaning & Maintenance | 11 (10.7%) | 92 (89.3%) |
| Personal Care & Service | 0 (0.0%) | 16 (100.0%) |
| Total (Category) | 94 (18.5%) | 414 (81.5%) |
| Total (Overall) | 1,400 (46.6%) | 1,606 (53.4%) |
Sales and Office Occupations
The most common Sales and Office occupations in Ludington are Office & Administration (373 | 12.4%), and Sales & Related (255 | 8.5%).

Sales and Office Occupations by Sex

| Occupation | Male | Female |
| Sales & Related | 166 (65.1%) | 89 (34.9%) |
| Office & Administration | 91 (24.4%) | 282 (75.6%) |
| Total (Category) | 257 (40.9%) | 371 (59.1%) |
| Total (Overall) | 1,400 (46.6%) | 1,606 (53.4%) |
Natural Resources, Construction and Maintenance Occupations
The most common Natural Resources, Construction and Maintenance occupations in Ludington are Construction & Extraction (150 | 5.0%), and Installation, Maintenance & Repair (119 | 4.0%).
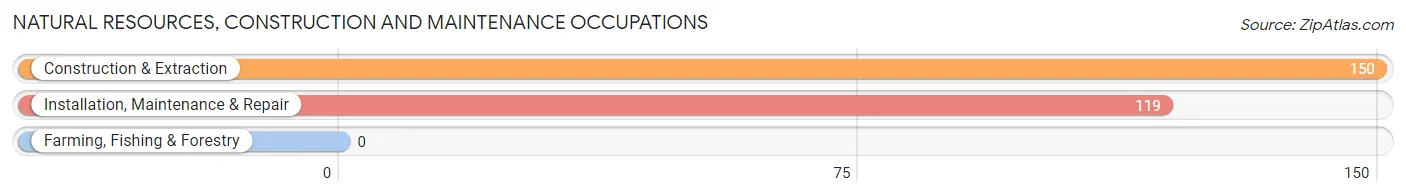
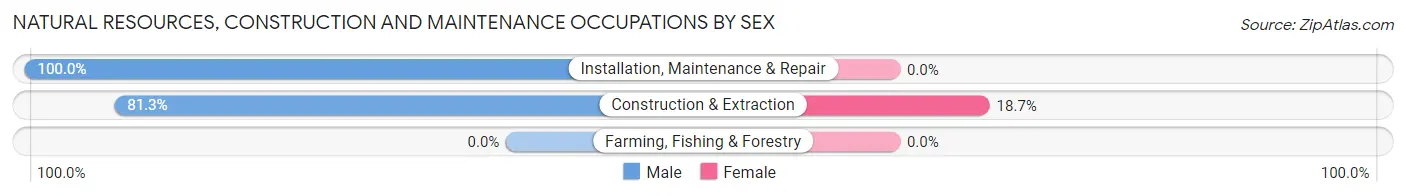
Natural Resources, Construction and Maintenance Occupations by Sex
| Occupation | Male | Female |
| Farming, Fishing & Forestry | 0 (0.0%) | 0 (0.0%) |
| Construction & Extraction | 122 (81.3%) | 28 (18.7%) |
| Installation, Maintenance & Repair | 119 (100.0%) | 0 (0.0%) |
| Total (Category) | 241 (89.6%) | 28 (10.4%) |
| Total (Overall) | 1,400 (46.6%) | 1,606 (53.4%) |
Production, Transportation and Moving Occupations
The most common Production, Transportation and Moving occupations in Ludington are Production (301 | 10.0%), Material Moving (219 | 7.3%), and Transportation (110 | 3.7%).
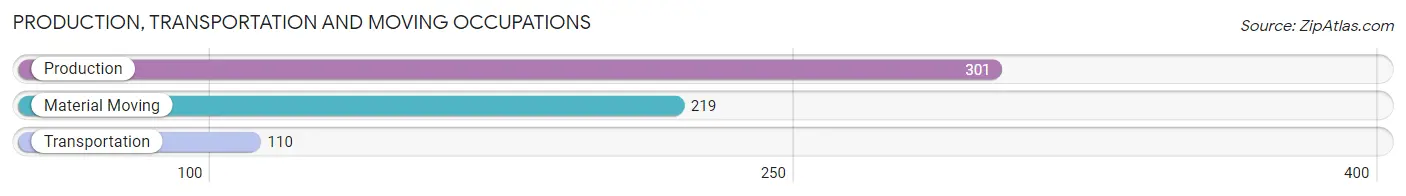
Production, Transportation and Moving Occupations by Sex
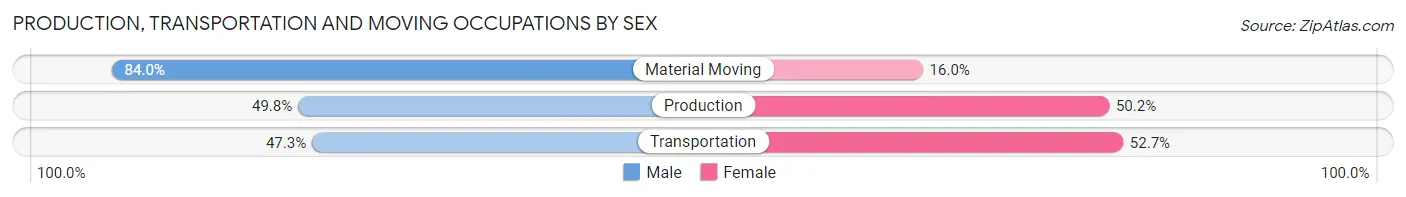
| Occupation | Male | Female |
| Production | 150 (49.8%) | 151 (50.2%) |
| Transportation | 52 (47.3%) | 58 (52.7%) |
| Material Moving | 184 (84.0%) | 35 (16.0%) |
| Total (Category) | 386 (61.3%) | 244 (38.7%) |
| Total (Overall) | 1,400 (46.6%) | 1,606 (53.4%) |
Employment Industries by Sex in Ludington
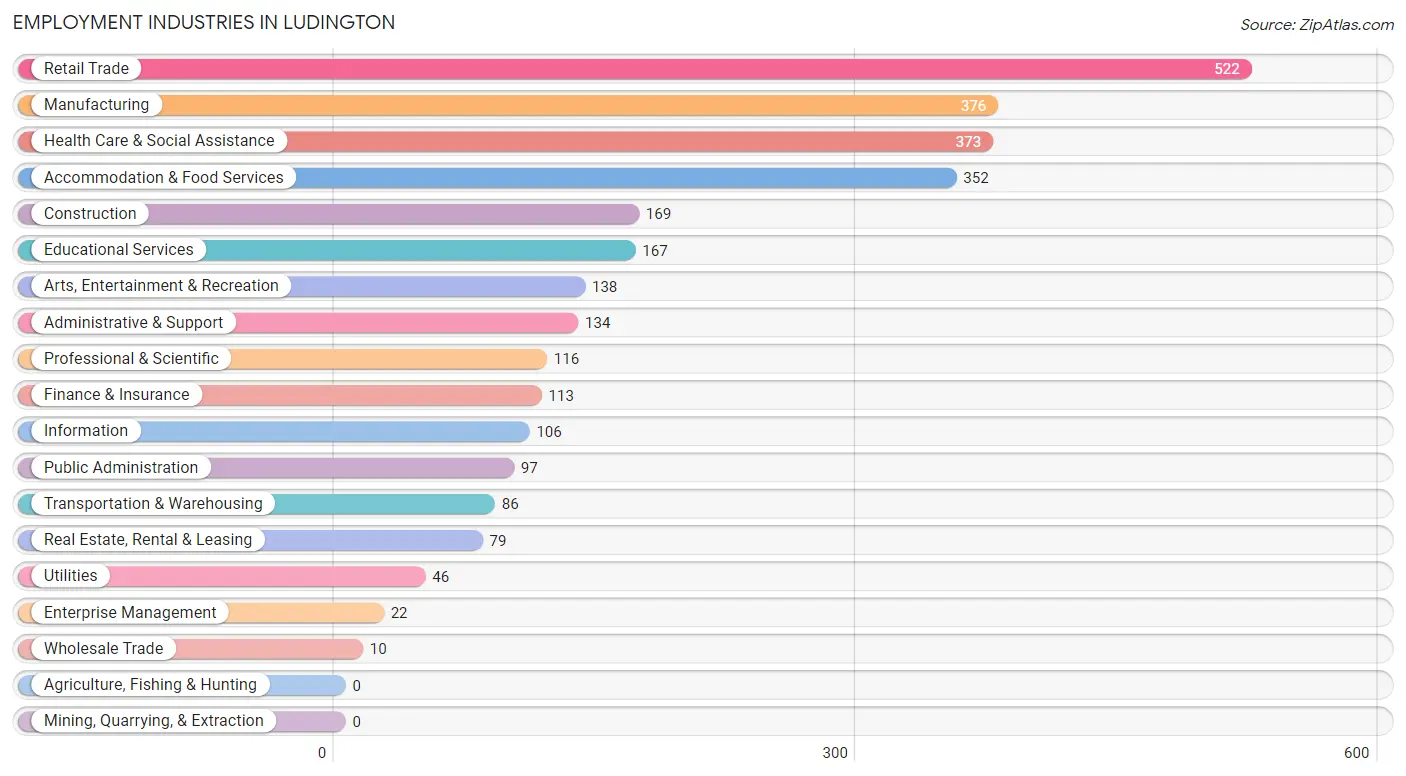
Employment Industries in Ludington
The major employment industries in Ludington include Retail Trade (522 | 17.4%), Manufacturing (376 | 12.5%), Health Care & Social Assistance (373 | 12.4%), Accommodation & Food Services (352 | 11.7%), and Construction (169 | 5.6%).
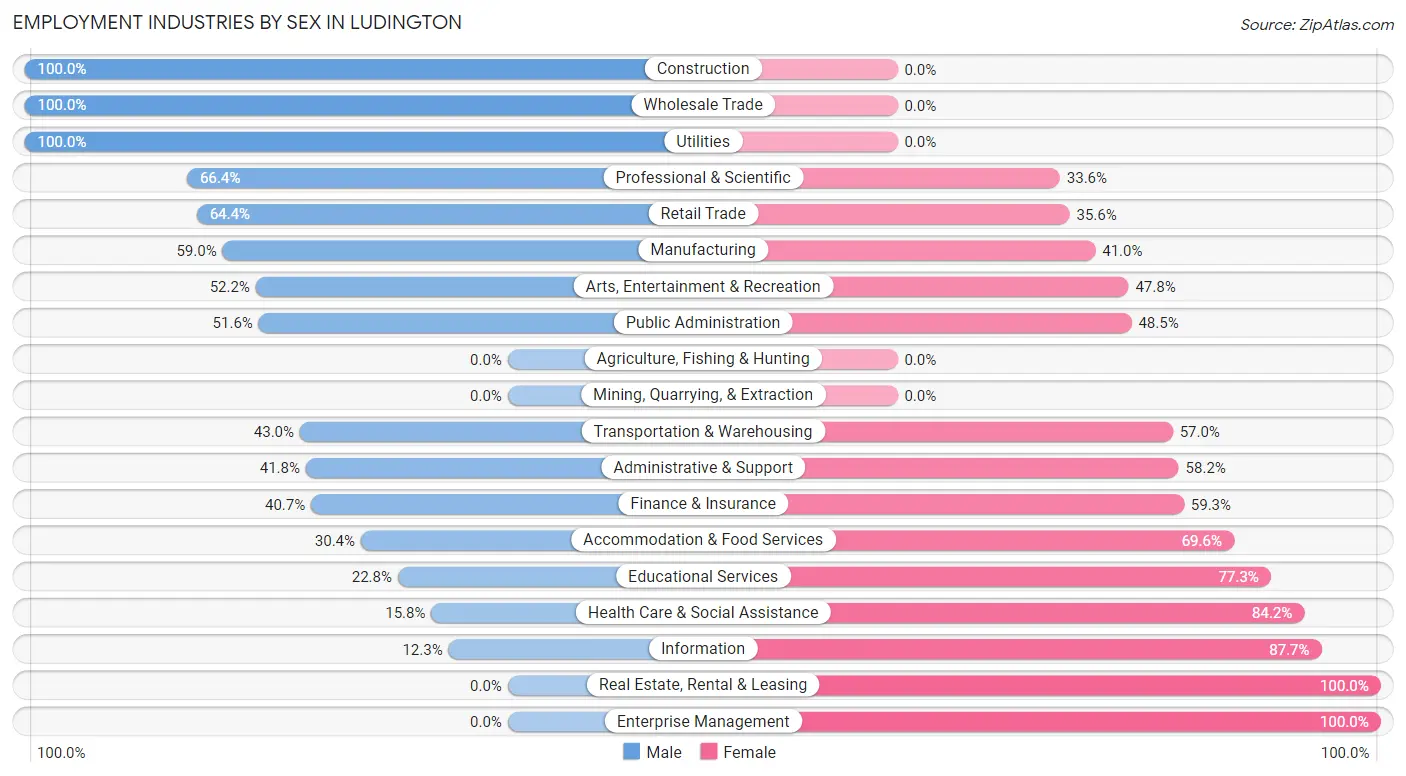
Employment Industries by Sex in Ludington
The Ludington industries that see more men than women are Construction (100.0%), Wholesale Trade (100.0%), and Utilities (100.0%), whereas the industries that tend to have a higher number of women are Real Estate, Rental & Leasing (100.0%), Enterprise Management (100.0%), and Information (87.7%).
| Industry | Male | Female |
| Agriculture, Fishing & Hunting | 0 (0.0%) | 0 (0.0%) |
| Mining, Quarrying, & Extraction | 0 (0.0%) | 0 (0.0%) |
| Construction | 169 (100.0%) | 0 (0.0%) |
| Manufacturing | 222 (59.0%) | 154 (41.0%) |
| Wholesale Trade | 10 (100.0%) | 0 (0.0%) |
| Retail Trade | 336 (64.4%) | 186 (35.6%) |
| Transportation & Warehousing | 37 (43.0%) | 49 (57.0%) |
| Utilities | 46 (100.0%) | 0 (0.0%) |
| Information | 13 (12.3%) | 93 (87.7%) |
| Finance & Insurance | 46 (40.7%) | 67 (59.3%) |
| Real Estate, Rental & Leasing | 0 (0.0%) | 79 (100.0%) |
| Professional & Scientific | 77 (66.4%) | 39 (33.6%) |
| Enterprise Management | 0 (0.0%) | 22 (100.0%) |
| Administrative & Support | 56 (41.8%) | 78 (58.2%) |
| Educational Services | 38 (22.8%) | 129 (77.2%) |
| Health Care & Social Assistance | 59 (15.8%) | 314 (84.2%) |
| Arts, Entertainment & Recreation | 72 (52.2%) | 66 (47.8%) |
| Accommodation & Food Services | 107 (30.4%) | 245 (69.6%) |
| Public Administration | 50 (51.5%) | 47 (48.4%) |
| Total | 1,400 (46.6%) | 1,606 (53.4%) |
Education in Ludington
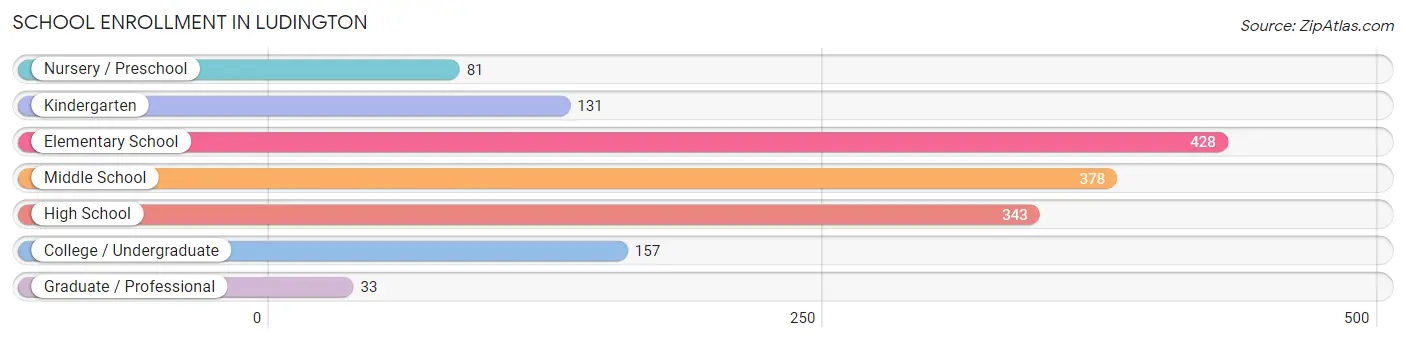
School Enrollment in Ludington
The most common levels of schooling among the 1,551 students in Ludington are elementary school (428 | 27.6%), middle school (378 | 24.4%), and high school (343 | 22.1%).
| School Level | # Students | % Students |
| Nursery / Preschool | 81 | 5.2% |
| Kindergarten | 131 | 8.5% |
| Elementary School | 428 | 27.6% |
| Middle School | 378 | 24.4% |
| High School | 343 | 22.1% |
| College / Undergraduate | 157 | 10.1% |
| Graduate / Professional | 33 | 2.1% |
| Total | 1,551 | 100.0% |
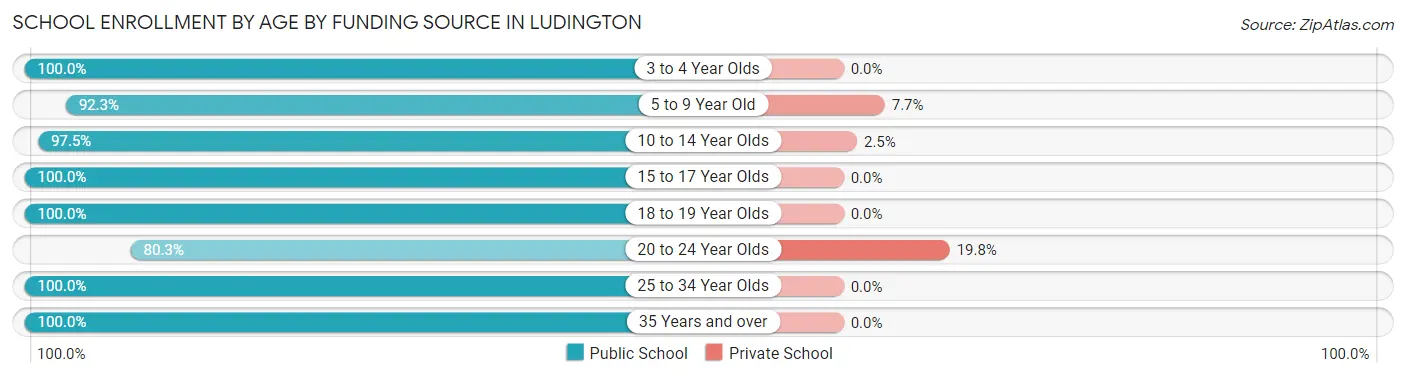
School Enrollment by Age by Funding Source in Ludington
Out of a total of 1,551 students who are enrolled in schools in Ludington, 64 (4.1%) attend a private institution, while the remaining 1,487 (95.9%) are enrolled in public schools. The age group of 20 to 24 year olds has the highest likelihood of being enrolled in private schools, with 16 (19.8% in the age bracket) enrolled. Conversely, the age group of 3 to 4 year olds has the lowest likelihood of being enrolled in a private school, with 52 (100.0% in the age bracket) attending a public institution.
| Age Bracket | Public School | Private School |
| 3 to 4 Year Olds | 52 (100.0%) | 0 (0.0%) |
| 5 to 9 Year Old | 398 (92.3%) | 33 (7.7%) |
| 10 to 14 Year Olds | 587 (97.5%) | 15 (2.5%) |
| 15 to 17 Year Olds | 268 (100.0%) | 0 (0.0%) |
| 18 to 19 Year Olds | 8 (100.0%) | 0 (0.0%) |
| 20 to 24 Year Olds | 65 (80.2%) | 16 (19.8%) |
| 25 to 34 Year Olds | 81 (100.0%) | 0 (0.0%) |
| 35 Years and over | 28 (100.0%) | 0 (0.0%) |
| Total | 1,487 (95.9%) | 64 (4.1%) |
Educational Attainment by Field of Study in Ludington
Education (417 | 26.3%), business (340 | 21.5%), science & technology (153 | 9.7%), arts & humanities (134 | 8.5%), and visual & performing arts (120 | 7.6%) are the most common fields of study among 1,584 individuals in Ludington who have obtained a bachelor's degree or higher.
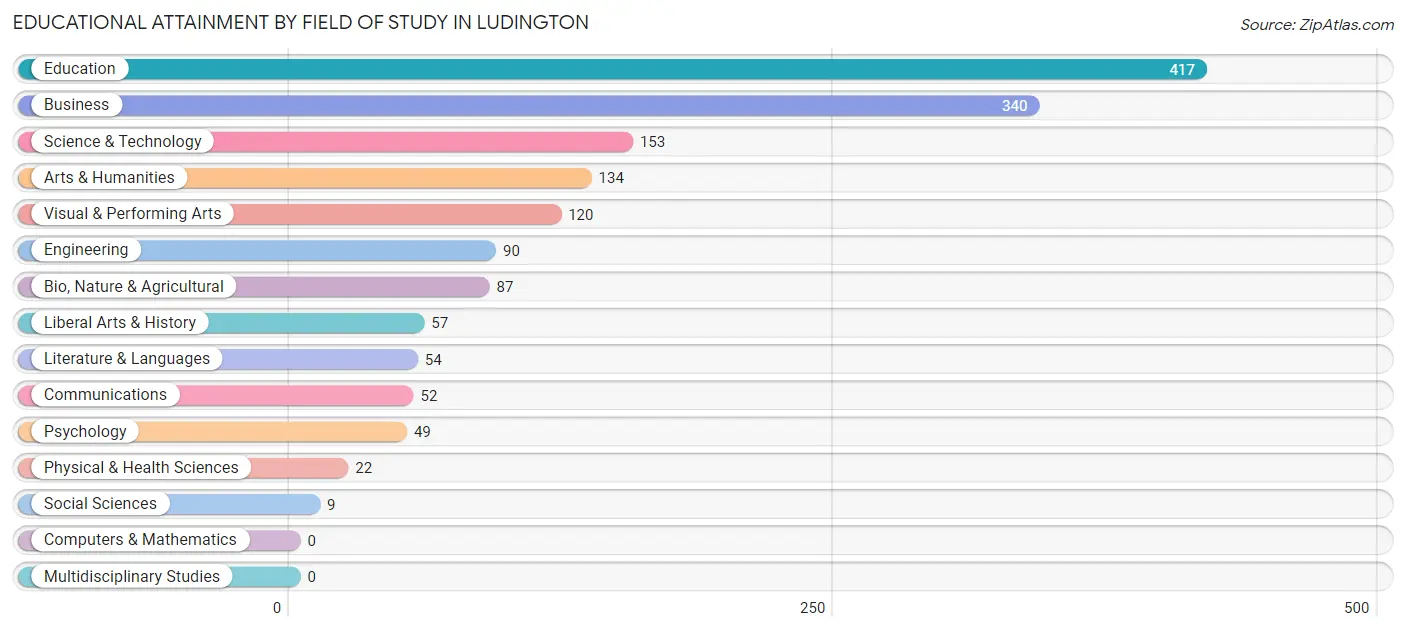
| Field of Study | # Graduates | % Graduates |
| Computers & Mathematics | 0 | 0.0% |
| Bio, Nature & Agricultural | 87 | 5.5% |
| Physical & Health Sciences | 22 | 1.4% |
| Psychology | 49 | 3.1% |
| Social Sciences | 9 | 0.6% |
| Engineering | 90 | 5.7% |
| Multidisciplinary Studies | 0 | 0.0% |
| Science & Technology | 153 | 9.7% |
| Business | 340 | 21.5% |
| Education | 417 | 26.3% |
| Literature & Languages | 54 | 3.4% |
| Liberal Arts & History | 57 | 3.6% |
| Visual & Performing Arts | 120 | 7.6% |
| Communications | 52 | 3.3% |
| Arts & Humanities | 134 | 8.5% |
| Total | 1,584 | 100.0% |
Transportation & Commute in Ludington
Vehicle Availability by Sex in Ludington
The most prevalent vehicle ownership categories in Ludington are males with 2 vehicles (799, accounting for 57.6%) and females with 2 vehicles (624, making up 50.5%).
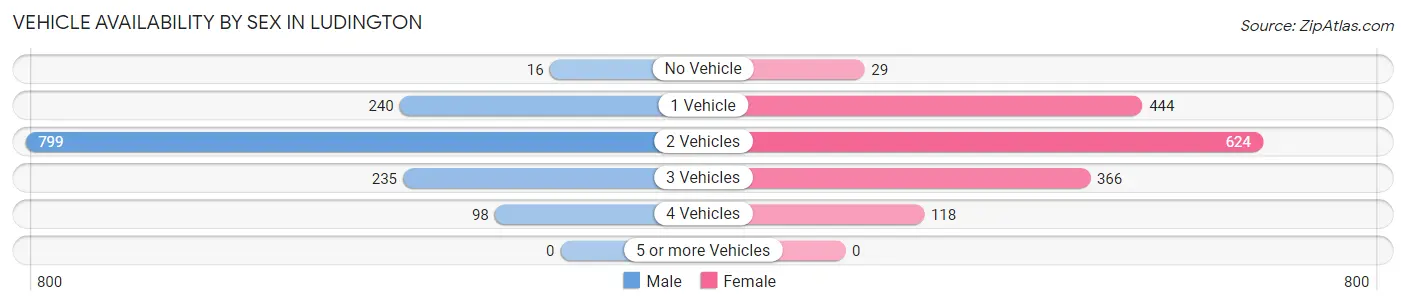
| Vehicles Available | Male | Female |
| No Vehicle | 16 (1.1%) | 29 (1.8%) |
| 1 Vehicle | 240 (17.3%) | 444 (28.1%) |
| 2 Vehicles | 799 (57.6%) | 624 (39.5%) |
| 3 Vehicles | 235 (16.9%) | 366 (23.2%) |
| 4 Vehicles | 98 (7.1%) | 118 (7.5%) |
| 5 or more Vehicles | 0 (0.0%) | 0 (0.0%) |
| Total | 1,388 (100.0%) | 1,581 (100.0%) |
Commute Time in Ludington
The most frequently occuring commute durations in Ludington are 5 to 9 minutes (1,043 commuters, 37.8%), 10 to 14 minutes (591 commuters, 21.4%), and 15 to 19 minutes (494 commuters, 17.9%).
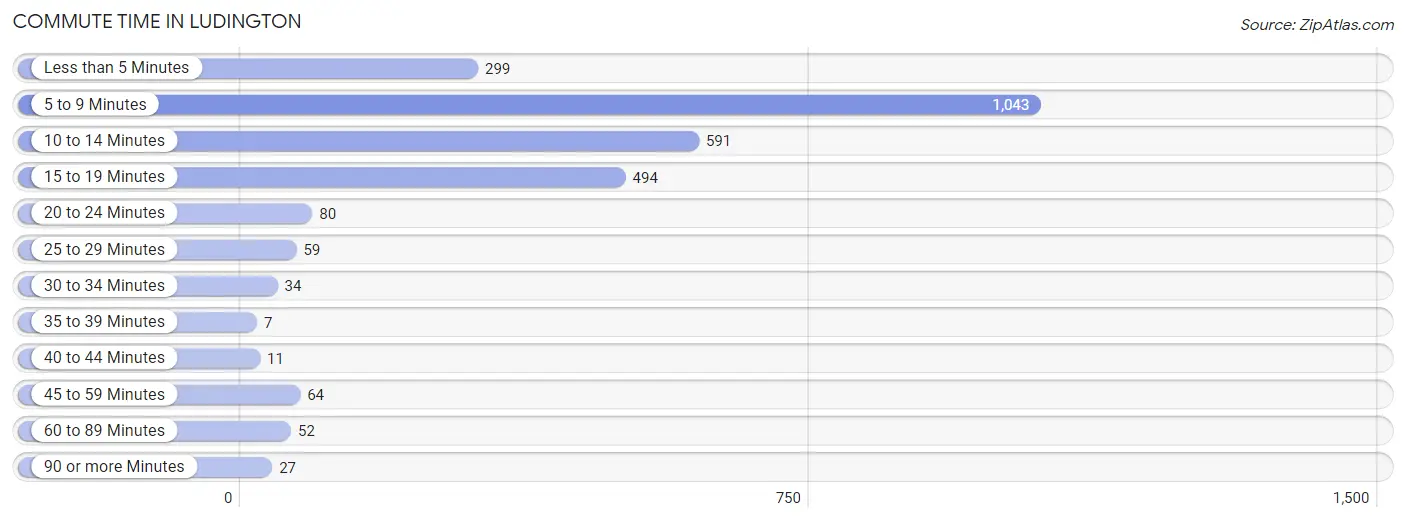
| Commute Time | # Commuters | % Commuters |
| Less than 5 Minutes | 299 | 10.8% |
| 5 to 9 Minutes | 1,043 | 37.8% |
| 10 to 14 Minutes | 591 | 21.4% |
| 15 to 19 Minutes | 494 | 17.9% |
| 20 to 24 Minutes | 80 | 2.9% |
| 25 to 29 Minutes | 59 | 2.1% |
| 30 to 34 Minutes | 34 | 1.2% |
| 35 to 39 Minutes | 7 | 0.3% |
| 40 to 44 Minutes | 11 | 0.4% |
| 45 to 59 Minutes | 64 | 2.3% |
| 60 to 89 Minutes | 52 | 1.9% |
| 90 or more Minutes | 27 | 1.0% |
Commute Time by Sex in Ludington
The most common commute times in Ludington are 5 to 9 minutes (421 commuters, 32.9%) for males and 5 to 9 minutes (622 commuters, 42.0%) for females.
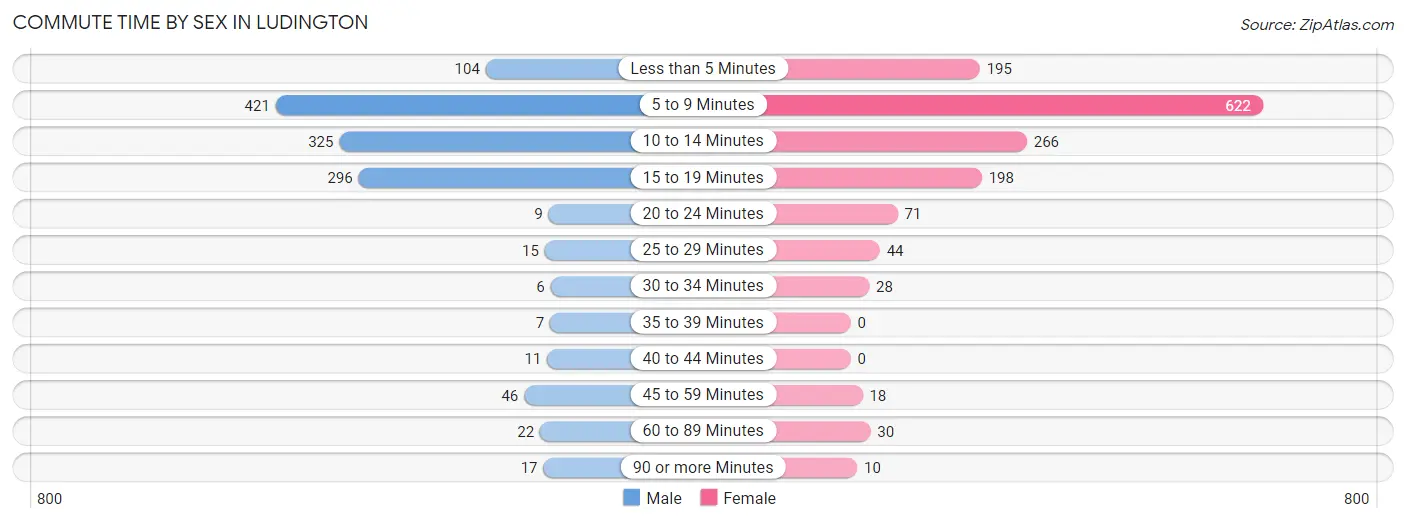
| Commute Time | Male | Female |
| Less than 5 Minutes | 104 (8.1%) | 195 (13.2%) |
| 5 to 9 Minutes | 421 (32.9%) | 622 (42.0%) |
| 10 to 14 Minutes | 325 (25.4%) | 266 (17.9%) |
| 15 to 19 Minutes | 296 (23.1%) | 198 (13.4%) |
| 20 to 24 Minutes | 9 (0.7%) | 71 (4.8%) |
| 25 to 29 Minutes | 15 (1.2%) | 44 (3.0%) |
| 30 to 34 Minutes | 6 (0.5%) | 28 (1.9%) |
| 35 to 39 Minutes | 7 (0.5%) | 0 (0.0%) |
| 40 to 44 Minutes | 11 (0.9%) | 0 (0.0%) |
| 45 to 59 Minutes | 46 (3.6%) | 18 (1.2%) |
| 60 to 89 Minutes | 22 (1.7%) | 30 (2.0%) |
| 90 or more Minutes | 17 (1.3%) | 10 (0.7%) |
Time of Departure to Work by Sex in Ludington
The most frequent times of departure to work in Ludington are 4:00 PM to 11:59 PM (217, 17.0%) for males and 7:30 AM to 7:59 AM (203, 13.7%) for females.
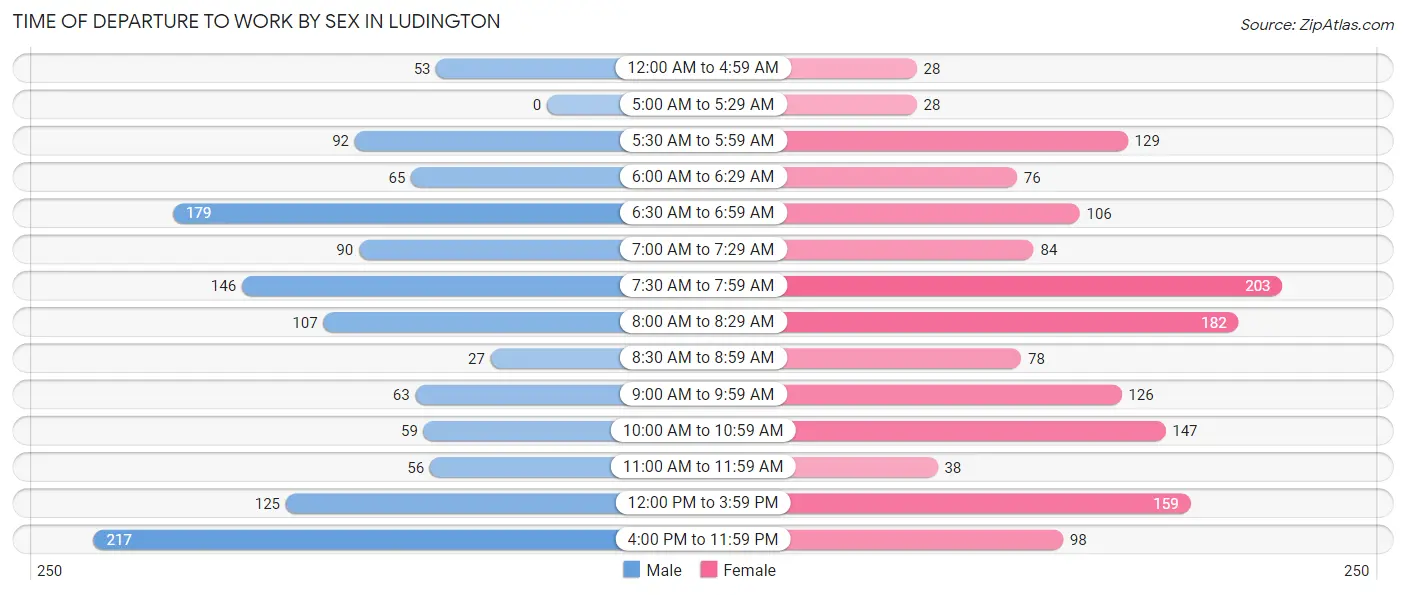
| Time of Departure | Male | Female |
| 12:00 AM to 4:59 AM | 53 (4.1%) | 28 (1.9%) |
| 5:00 AM to 5:29 AM | 0 (0.0%) | 28 (1.9%) |
| 5:30 AM to 5:59 AM | 92 (7.2%) | 129 (8.7%) |
| 6:00 AM to 6:29 AM | 65 (5.1%) | 76 (5.1%) |
| 6:30 AM to 6:59 AM | 179 (14.0%) | 106 (7.1%) |
| 7:00 AM to 7:29 AM | 90 (7.0%) | 84 (5.7%) |
| 7:30 AM to 7:59 AM | 146 (11.4%) | 203 (13.7%) |
| 8:00 AM to 8:29 AM | 107 (8.4%) | 182 (12.3%) |
| 8:30 AM to 8:59 AM | 27 (2.1%) | 78 (5.3%) |
| 9:00 AM to 9:59 AM | 63 (4.9%) | 126 (8.5%) |
| 10:00 AM to 10:59 AM | 59 (4.6%) | 147 (9.9%) |
| 11:00 AM to 11:59 AM | 56 (4.4%) | 38 (2.6%) |
| 12:00 PM to 3:59 PM | 125 (9.8%) | 159 (10.7%) |
| 4:00 PM to 11:59 PM | 217 (17.0%) | 98 (6.6%) |
| Total | 1,279 (100.0%) | 1,482 (100.0%) |
Housing Occupancy in Ludington
Occupancy by Ownership in Ludington
Of the total 3,469 dwellings in Ludington, owner-occupied units account for 2,023 (58.3%), while renter-occupied units make up 1,446 (41.7%).
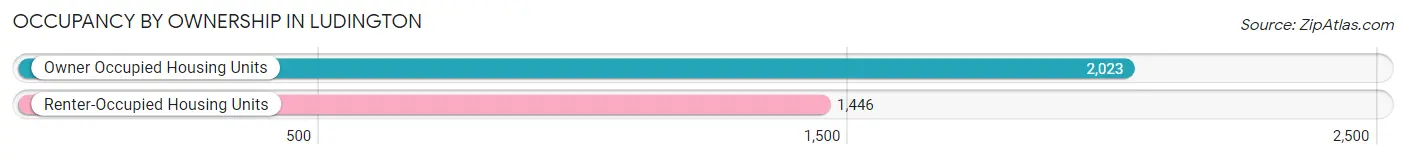
| Occupancy | # Housing Units | % Housing Units |
| Owner Occupied Housing Units | 2,023 | 58.3% |
| Renter-Occupied Housing Units | 1,446 | 41.7% |
| Total Occupied Housing Units | 3,469 | 100.0% |
Occupancy by Household Size in Ludington
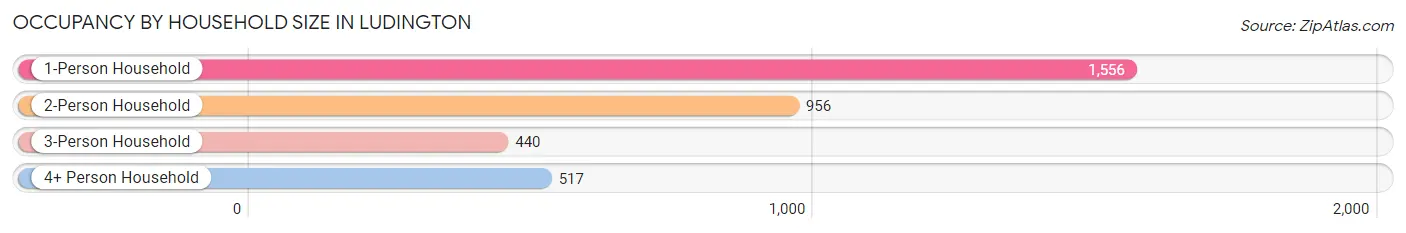
| Household Size | # Housing Units | % Housing Units |
| 1-Person Household | 1,556 | 44.9% |
| 2-Person Household | 956 | 27.6% |
| 3-Person Household | 440 | 12.7% |
| 4+ Person Household | 517 | 14.9% |
| Total Housing Units | 3,469 | 100.0% |
Occupancy by Ownership by Household Size in Ludington
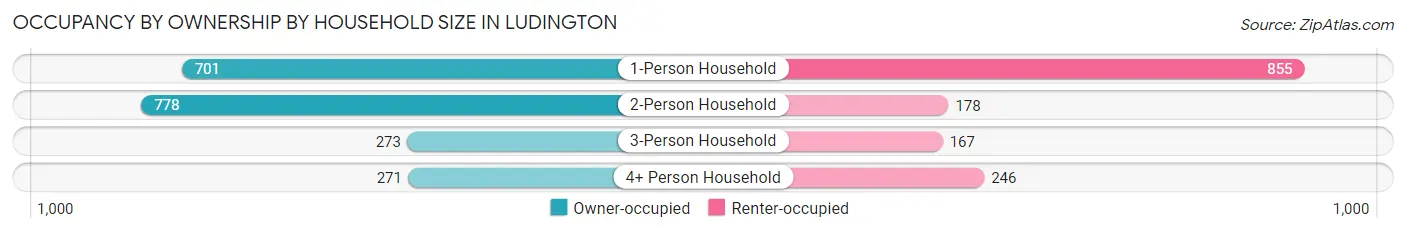
| Household Size | Owner-occupied | Renter-occupied |
| 1-Person Household | 701 (45.1%) | 855 (54.9%) |
| 2-Person Household | 778 (81.4%) | 178 (18.6%) |
| 3-Person Household | 273 (62.1%) | 167 (38.0%) |
| 4+ Person Household | 271 (52.4%) | 246 (47.6%) |
| Total Housing Units | 2,023 (58.3%) | 1,446 (41.7%) |
Occupancy by Educational Attainment in Ludington
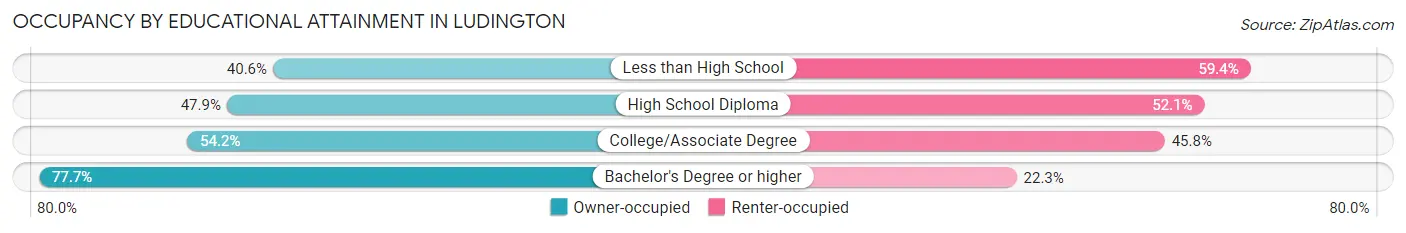
| Household Size | Owner-occupied | Renter-occupied |
| Less than High School | 65 (40.6%) | 95 (59.4%) |
| High School Diploma | 546 (47.9%) | 593 (52.1%) |
| College/Associate Degree | 634 (54.2%) | 535 (45.8%) |
| Bachelor's Degree or higher | 778 (77.7%) | 223 (22.3%) |
Occupancy by Age of Householder in Ludington
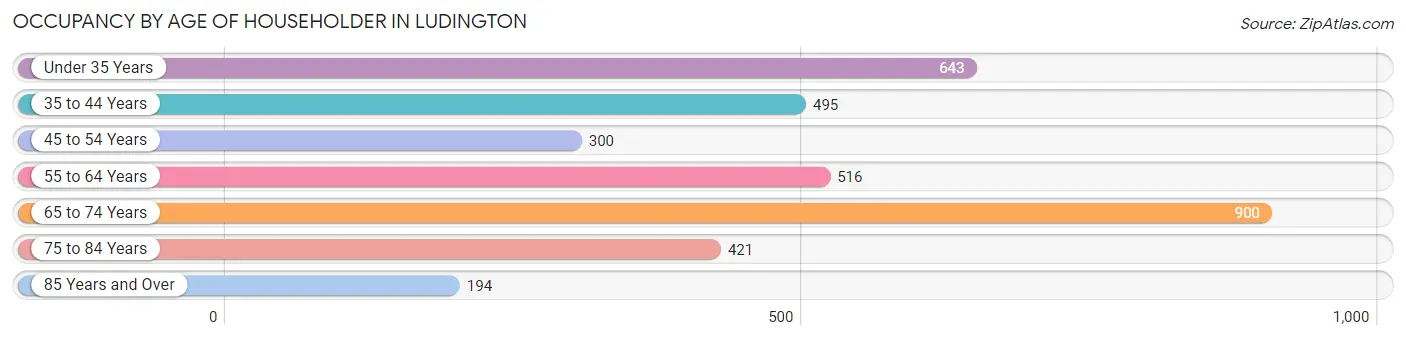
| Age Bracket | # Households | % Households |
| Under 35 Years | 643 | 18.5% |
| 35 to 44 Years | 495 | 14.3% |
| 45 to 54 Years | 300 | 8.6% |
| 55 to 64 Years | 516 | 14.9% |
| 65 to 74 Years | 900 | 25.9% |
| 75 to 84 Years | 421 | 12.1% |
| 85 Years and Over | 194 | 5.6% |
| Total | 3,469 | 100.0% |
Housing Finances in Ludington
Median Income by Occupancy in Ludington
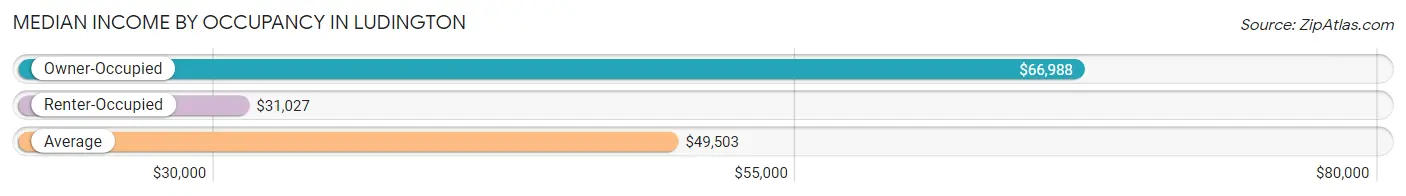
| Occupancy Type | # Households | Median Income |
| Owner-Occupied | 2,023 (58.3%) | $66,988 |
| Renter-Occupied | 1,446 (41.7%) | $31,027 |
| Average | 3,469 (100.0%) | $49,503 |
Occupancy by Householder Income Bracket in Ludington
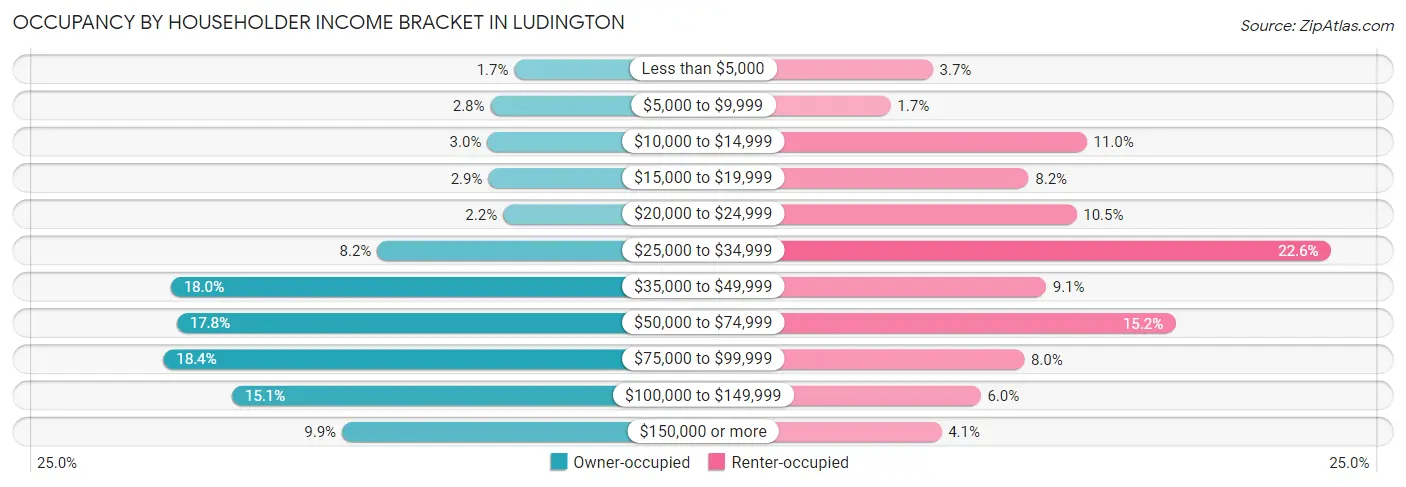
| Income Bracket | Owner-occupied | Renter-occupied |
| Less than $5,000 | 34 (1.7%) | 53 (3.7%) |
| $5,000 to $9,999 | 57 (2.8%) | 24 (1.7%) |
| $10,000 to $14,999 | 60 (3.0%) | 159 (11.0%) |
| $15,000 to $19,999 | 59 (2.9%) | 119 (8.2%) |
| $20,000 to $24,999 | 45 (2.2%) | 152 (10.5%) |
| $25,000 to $34,999 | 166 (8.2%) | 327 (22.6%) |
| $35,000 to $49,999 | 365 (18.0%) | 131 (9.1%) |
| $50,000 to $74,999 | 359 (17.7%) | 220 (15.2%) |
| $75,000 to $99,999 | 372 (18.4%) | 116 (8.0%) |
| $100,000 to $149,999 | 306 (15.1%) | 86 (5.9%) |
| $150,000 or more | 200 (9.9%) | 59 (4.1%) |
| Total | 2,023 (100.0%) | 1,446 (100.0%) |
Monthly Housing Cost Tiers in Ludington
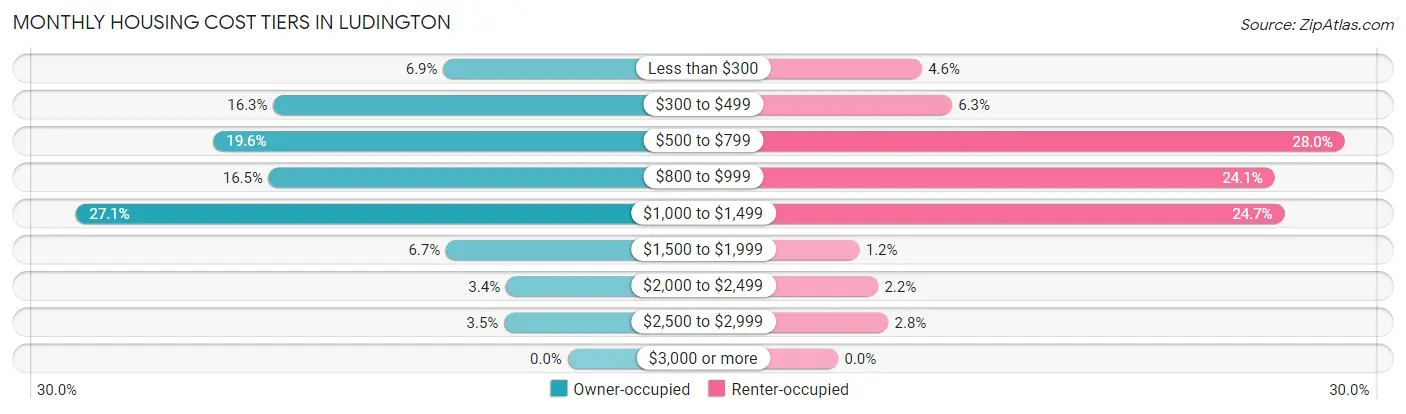
| Monthly Cost | Owner-occupied | Renter-occupied |
| Less than $300 | 139 (6.9%) | 67 (4.6%) |
| $300 to $499 | 329 (16.3%) | 91 (6.3%) |
| $500 to $799 | 396 (19.6%) | 405 (28.0%) |
| $800 to $999 | 334 (16.5%) | 349 (24.1%) |
| $1,000 to $1,499 | 549 (27.1%) | 357 (24.7%) |
| $1,500 to $1,999 | 136 (6.7%) | 17 (1.2%) |
| $2,000 to $2,499 | 69 (3.4%) | 32 (2.2%) |
| $2,500 to $2,999 | 71 (3.5%) | 40 (2.8%) |
| $3,000 or more | 0 (0.0%) | 0 (0.0%) |
| Total | 2,023 (100.0%) | 1,446 (100.0%) |
Physical Housing Characteristics in Ludington
Housing Structures in Ludington
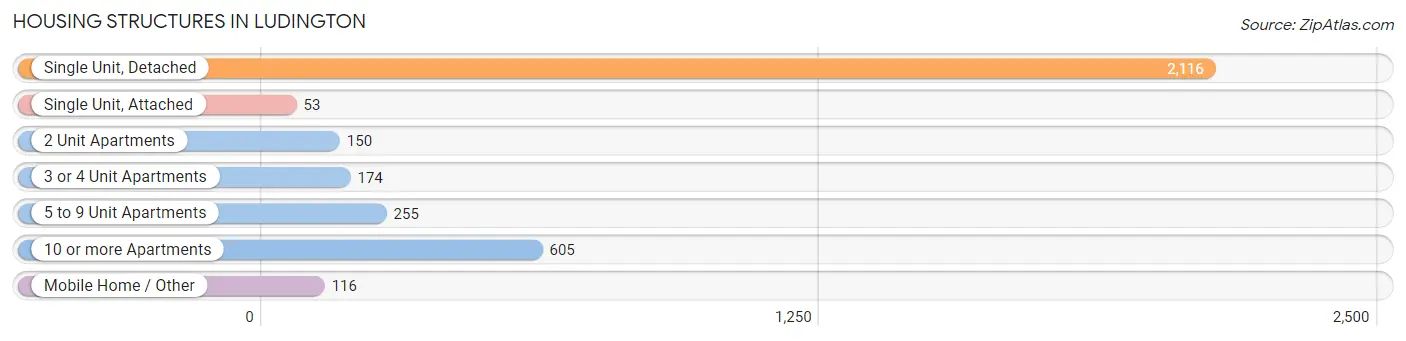
| Structure Type | # Housing Units | % Housing Units |
| Single Unit, Detached | 2,116 | 61.0% |
| Single Unit, Attached | 53 | 1.5% |
| 2 Unit Apartments | 150 | 4.3% |
| 3 or 4 Unit Apartments | 174 | 5.0% |
| 5 to 9 Unit Apartments | 255 | 7.3% |
| 10 or more Apartments | 605 | 17.4% |
| Mobile Home / Other | 116 | 3.3% |
| Total | 3,469 | 100.0% |
Housing Structures by Occupancy in Ludington
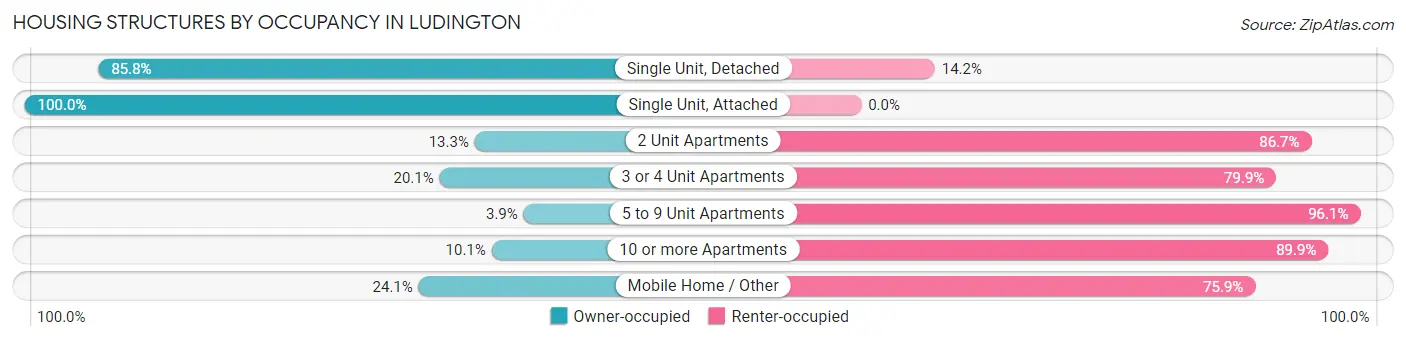
| Structure Type | Owner-occupied | Renter-occupied |
| Single Unit, Detached | 1,816 (85.8%) | 300 (14.2%) |
| Single Unit, Attached | 53 (100.0%) | 0 (0.0%) |
| 2 Unit Apartments | 20 (13.3%) | 130 (86.7%) |
| 3 or 4 Unit Apartments | 35 (20.1%) | 139 (79.9%) |
| 5 to 9 Unit Apartments | 10 (3.9%) | 245 (96.1%) |
| 10 or more Apartments | 61 (10.1%) | 544 (89.9%) |
| Mobile Home / Other | 28 (24.1%) | 88 (75.9%) |
| Total | 2,023 (58.3%) | 1,446 (41.7%) |
Housing Structures by Number of Rooms in Ludington
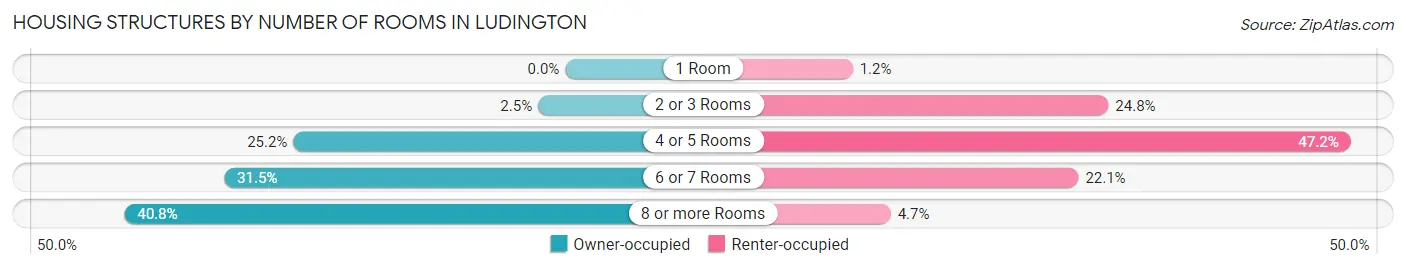
| Number of Rooms | Owner-occupied | Renter-occupied |
| 1 Room | 0 (0.0%) | 17 (1.2%) |
| 2 or 3 Rooms | 51 (2.5%) | 359 (24.8%) |
| 4 or 5 Rooms | 509 (25.2%) | 683 (47.2%) |
| 6 or 7 Rooms | 638 (31.5%) | 319 (22.1%) |
| 8 or more Rooms | 825 (40.8%) | 68 (4.7%) |
| Total | 2,023 (100.0%) | 1,446 (100.0%) |
Housing Structure by Heating Type in Ludington
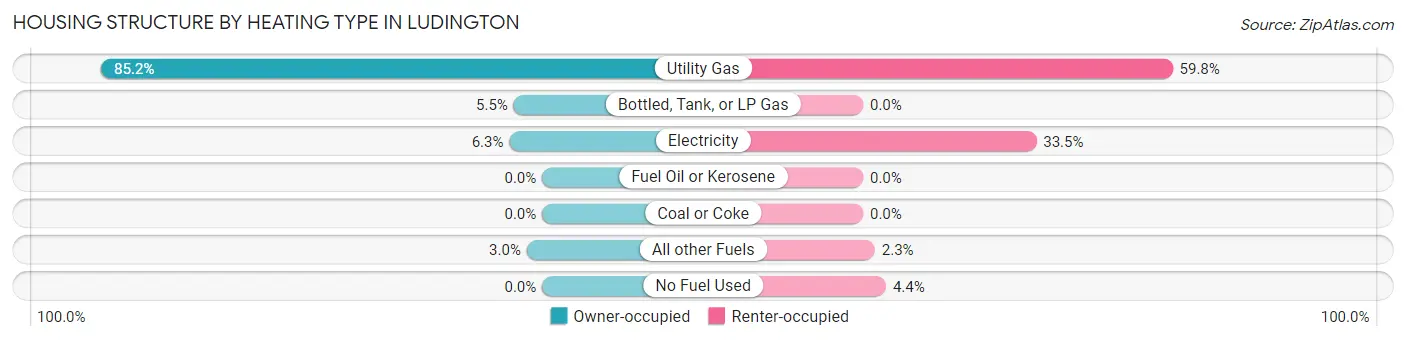
| Heating Type | Owner-occupied | Renter-occupied |
| Utility Gas | 1,724 (85.2%) | 865 (59.8%) |
| Bottled, Tank, or LP Gas | 111 (5.5%) | 0 (0.0%) |
| Electricity | 128 (6.3%) | 484 (33.5%) |
| Fuel Oil or Kerosene | 0 (0.0%) | 0 (0.0%) |
| Coal or Coke | 0 (0.0%) | 0 (0.0%) |
| All other Fuels | 60 (3.0%) | 33 (2.3%) |
| No Fuel Used | 0 (0.0%) | 64 (4.4%) |
| Total | 2,023 (100.0%) | 1,446 (100.0%) |
Household Vehicle Usage in Ludington
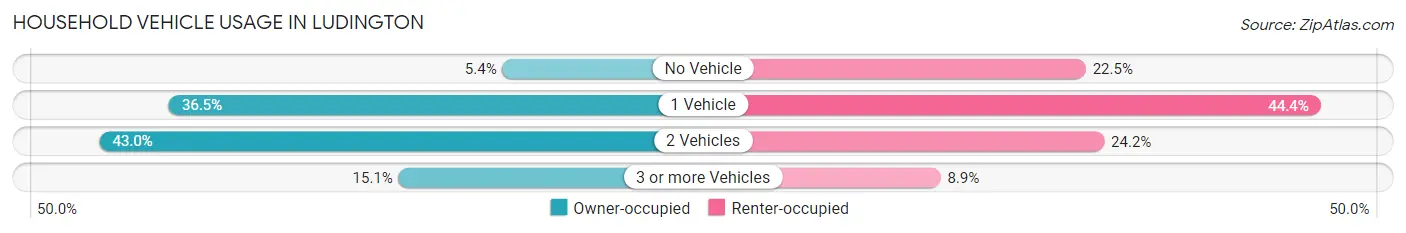
| Vehicles per Household | Owner-occupied | Renter-occupied |
| No Vehicle | 109 (5.4%) | 325 (22.5%) |
| 1 Vehicle | 739 (36.5%) | 642 (44.4%) |
| 2 Vehicles | 870 (43.0%) | 350 (24.2%) |
| 3 or more Vehicles | 305 (15.1%) | 129 (8.9%) |
| Total | 2,023 (100.0%) | 1,446 (100.0%) |
Real Estate & Mortgages in Ludington
Real Estate and Mortgage Overview in Ludington
| Characteristic | Without Mortgage | With Mortgage |
| Housing Units | 815 | 1,208 |
| Median Property Value | $166,700 | $178,100 |
| Median Household Income | $53,750 | $186 |
| Monthly Housing Costs | $473 | $0 |
| Real Estate Taxes | $2,314 | $26 |
Property Value by Mortgage Status in Ludington
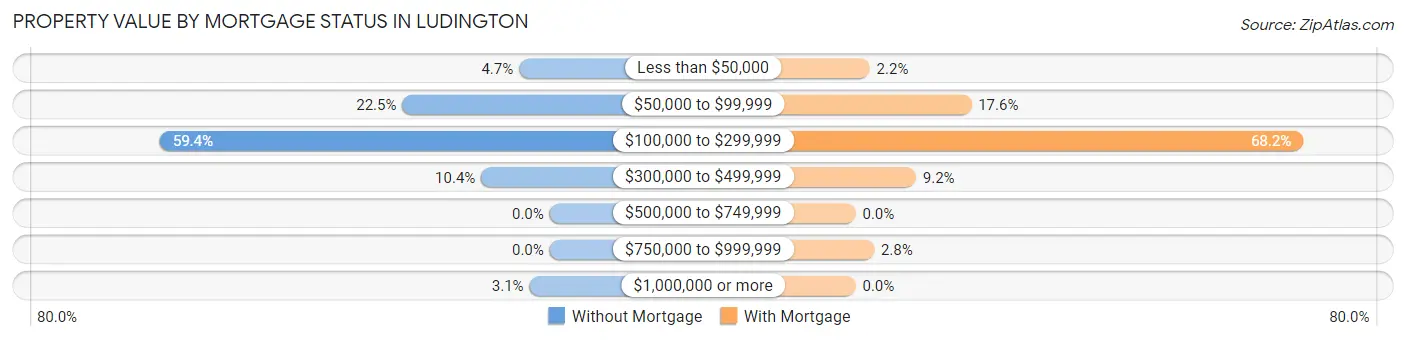
| Property Value | Without Mortgage | With Mortgage |
| Less than $50,000 | 38 (4.7%) | 26 (2.1%) |
| $50,000 to $99,999 | 183 (22.5%) | 213 (17.6%) |
| $100,000 to $299,999 | 484 (59.4%) | 824 (68.2%) |
| $300,000 to $499,999 | 85 (10.4%) | 111 (9.2%) |
| $500,000 to $749,999 | 0 (0.0%) | 0 (0.0%) |
| $750,000 to $999,999 | 0 (0.0%) | 34 (2.8%) |
| $1,000,000 or more | 25 (3.1%) | 0 (0.0%) |
| Total | 815 (100.0%) | 1,208 (100.0%) |
Household Income by Mortgage Status in Ludington
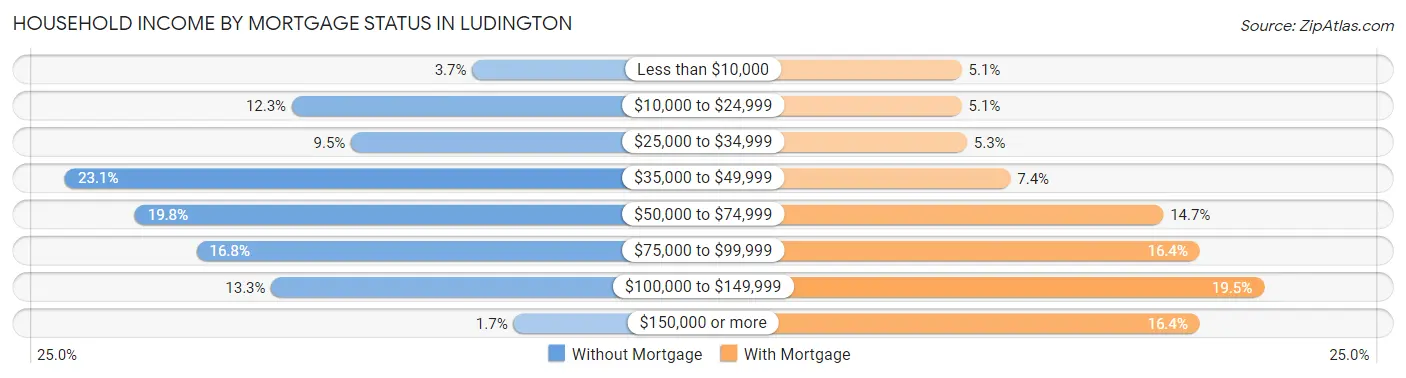
| Household Income | Without Mortgage | With Mortgage |
| Less than $10,000 | 30 (3.7%) | 61 (5.1%) |
| $10,000 to $24,999 | 100 (12.3%) | 61 (5.1%) |
| $25,000 to $34,999 | 77 (9.5%) | 64 (5.3%) |
| $35,000 to $49,999 | 188 (23.1%) | 89 (7.4%) |
| $50,000 to $74,999 | 161 (19.8%) | 177 (14.6%) |
| $75,000 to $99,999 | 137 (16.8%) | 198 (16.4%) |
| $100,000 to $149,999 | 108 (13.3%) | 235 (19.5%) |
| $150,000 or more | 14 (1.7%) | 198 (16.4%) |
| Total | 815 (100.0%) | 1,208 (100.0%) |
Property Value to Household Income Ratio in Ludington
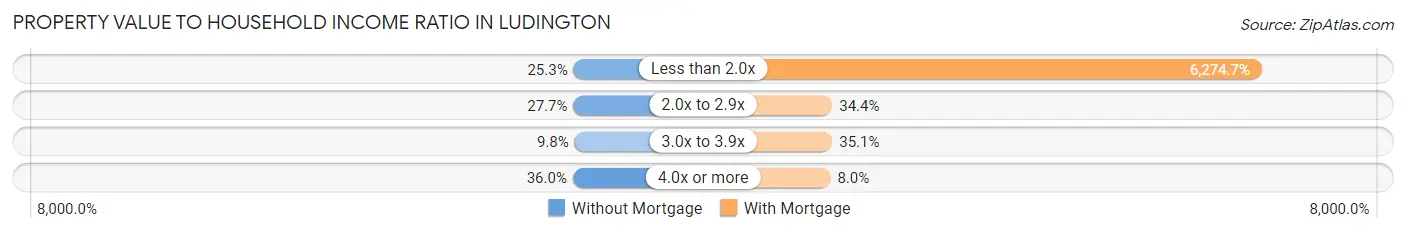
| Value-to-Income Ratio | Without Mortgage | With Mortgage |
| Less than 2.0x | 206 (25.3%) | 75,798 (6,274.7%) |
| 2.0x to 2.9x | 226 (27.7%) | 416 (34.4%) |
| 3.0x to 3.9x | 80 (9.8%) | 424 (35.1%) |
| 4.0x or more | 293 (35.9%) | 97 (8.0%) |
| Total | 815 (100.0%) | 1,208 (100.0%) |
Real Estate Taxes by Mortgage Status in Ludington
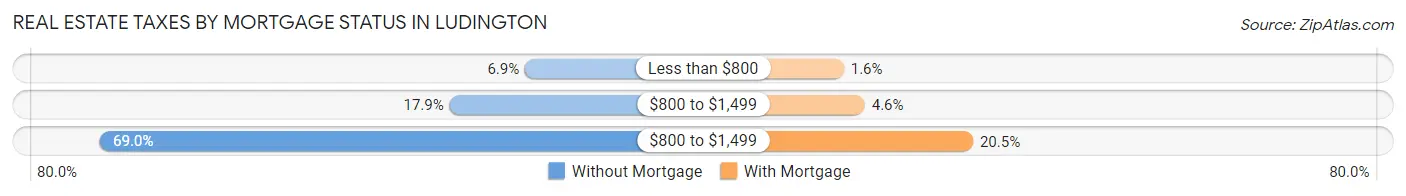
| Property Taxes | Without Mortgage | With Mortgage |
| Less than $800 | 56 (6.9%) | 19 (1.6%) |
| $800 to $1,499 | 146 (17.9%) | 56 (4.6%) |
| $800 to $1,499 | 562 (69.0%) | 247 (20.4%) |
| Total | 815 (100.0%) | 1,208 (100.0%) |
Health & Disability in Ludington
Health Insurance Coverage by Age in Ludington
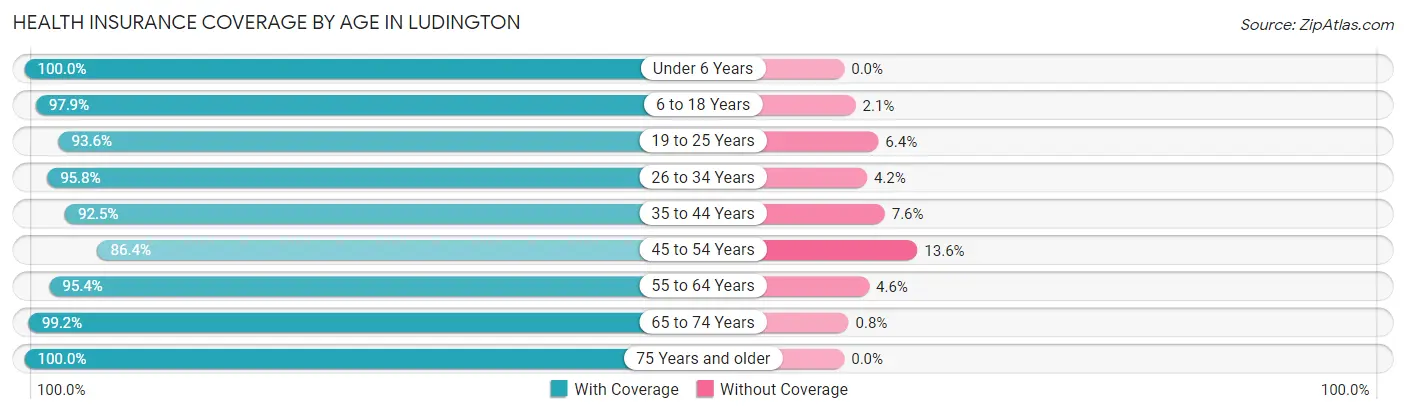
| Age Bracket | With Coverage | Without Coverage |
| Under 6 Years | 497 (100.0%) | 0 (0.0%) |
| 6 to 18 Years | 1,209 (97.9%) | 26 (2.1%) |
| 19 to 25 Years | 515 (93.6%) | 35 (6.4%) |
| 26 to 34 Years | 792 (95.8%) | 35 (4.2%) |
| 35 to 44 Years | 821 (92.4%) | 67 (7.5%) |
| 45 to 54 Years | 526 (86.4%) | 83 (13.6%) |
| 55 to 64 Years | 803 (95.4%) | 39 (4.6%) |
| 65 to 74 Years | 1,244 (99.2%) | 10 (0.8%) |
| 75 Years and older | 797 (100.0%) | 0 (0.0%) |
| Total | 7,204 (96.1%) | 295 (3.9%) |
Health Insurance Coverage by Citizenship Status in Ludington
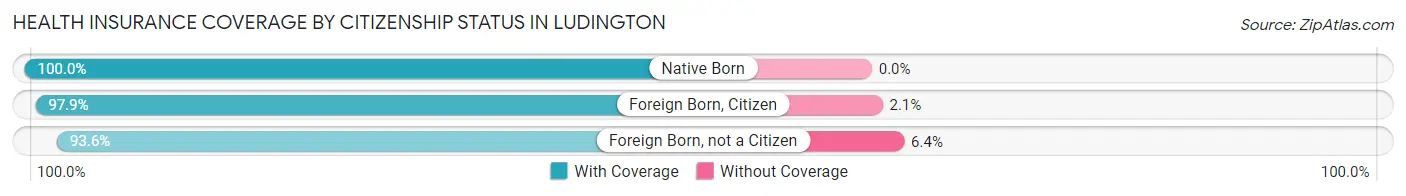
| Citizenship Status | With Coverage | Without Coverage |
| Native Born | 497 (100.0%) | 0 (0.0%) |
| Foreign Born, Citizen | 1,209 (97.9%) | 26 (2.1%) |
| Foreign Born, not a Citizen | 515 (93.6%) | 35 (6.4%) |
Health Insurance Coverage by Household Income in Ludington
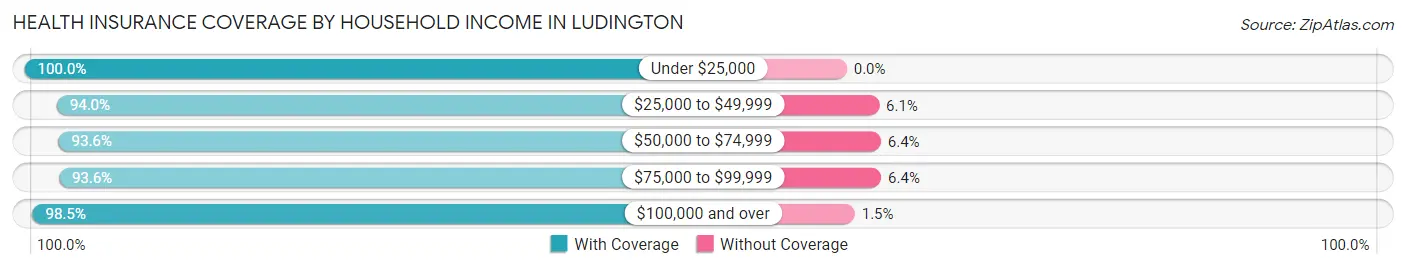
| Household Income | With Coverage | Without Coverage |
| Under $25,000 | 1,404 (100.0%) | 0 (0.0%) |
| $25,000 to $49,999 | 1,646 (94.0%) | 106 (6.0%) |
| $50,000 to $74,999 | 1,130 (93.6%) | 77 (6.4%) |
| $75,000 to $99,999 | 1,235 (93.6%) | 85 (6.4%) |
| $100,000 and over | 1,768 (98.5%) | 27 (1.5%) |
Public vs Private Health Insurance Coverage by Age in Ludington
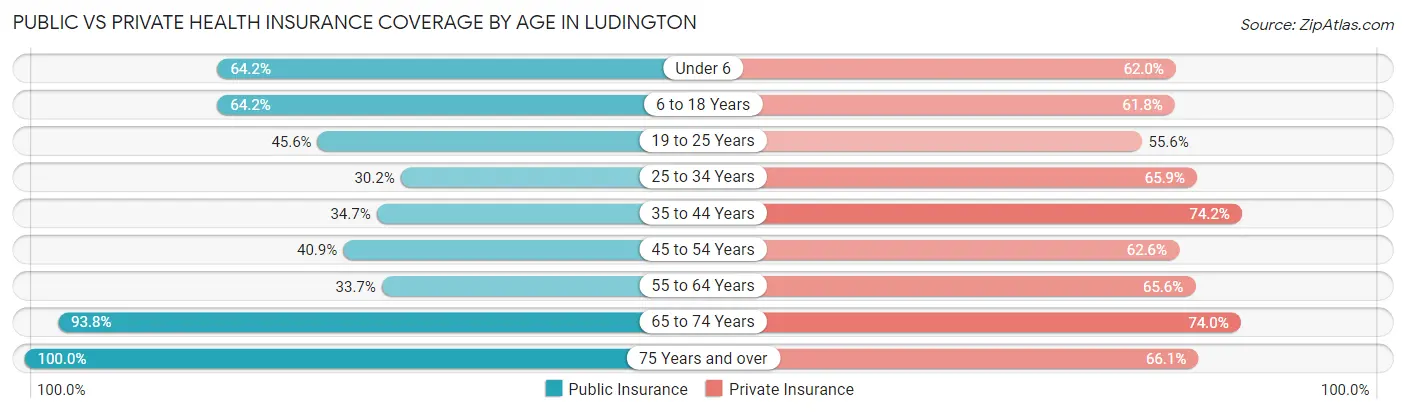
| Age Bracket | Public Insurance | Private Insurance |
| Under 6 | 319 (64.2%) | 308 (62.0%) |
| 6 to 18 Years | 793 (64.2%) | 763 (61.8%) |
| 19 to 25 Years | 251 (45.6%) | 306 (55.6%) |
| 25 to 34 Years | 250 (30.2%) | 545 (65.9%) |
| 35 to 44 Years | 308 (34.7%) | 659 (74.2%) |
| 45 to 54 Years | 249 (40.9%) | 381 (62.6%) |
| 55 to 64 Years | 284 (33.7%) | 552 (65.6%) |
| 65 to 74 Years | 1,176 (93.8%) | 928 (74.0%) |
| 75 Years and over | 797 (100.0%) | 527 (66.1%) |
| Total | 4,427 (59.0%) | 4,969 (66.3%) |
Disability Status by Sex by Age in Ludington
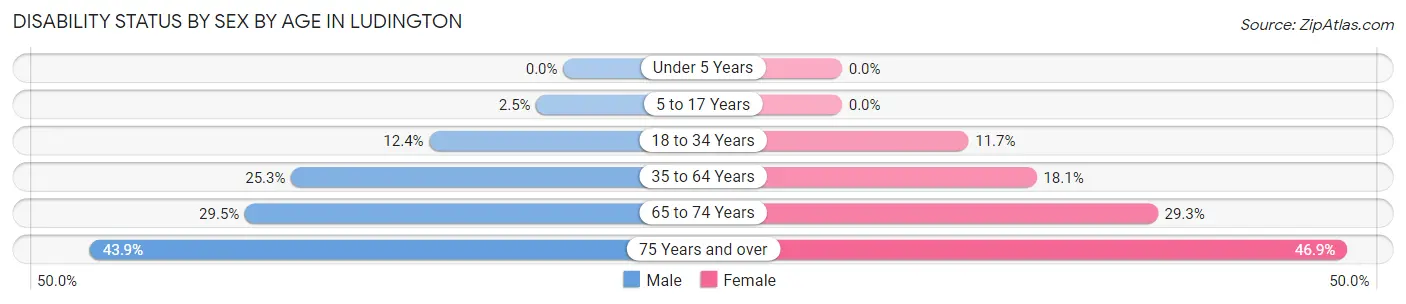
| Age Bracket | Male | Female |
| Under 5 Years | 0 (0.0%) | 0 (0.0%) |
| 5 to 17 Years | 18 (2.5%) | 0 (0.0%) |
| 18 to 34 Years | 86 (12.4%) | 83 (11.7%) |
| 35 to 64 Years | 279 (25.3%) | 223 (18.1%) |
| 65 to 74 Years | 202 (29.5%) | 167 (29.3%) |
| 75 Years and over | 116 (43.9%) | 250 (46.9%) |
Disability Class by Sex by Age in Ludington
Disability Class: Hearing Difficulty
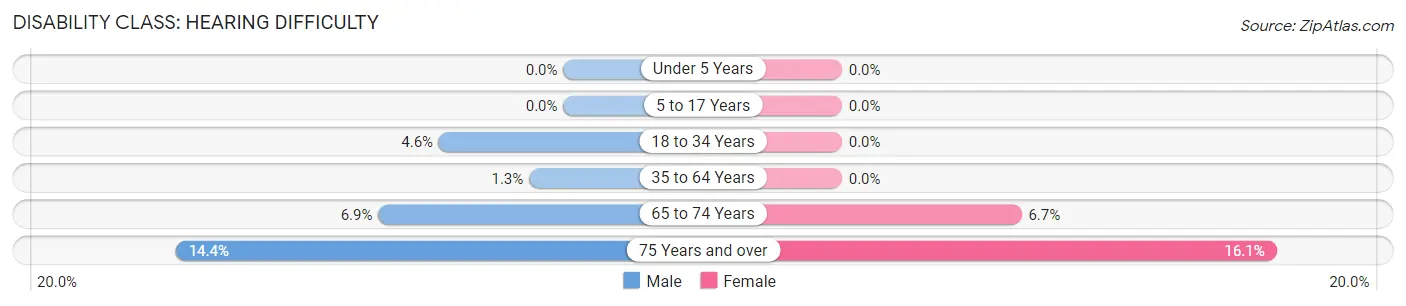
| Age Bracket | Male | Female |
| Under 5 Years | 0 (0.0%) | 0 (0.0%) |
| 5 to 17 Years | 0 (0.0%) | 0 (0.0%) |
| 18 to 34 Years | 32 (4.6%) | 0 (0.0%) |
| 35 to 64 Years | 14 (1.3%) | 0 (0.0%) |
| 65 to 74 Years | 47 (6.9%) | 38 (6.7%) |
| 75 Years and over | 38 (14.4%) | 86 (16.1%) |
Disability Class: Vision Difficulty
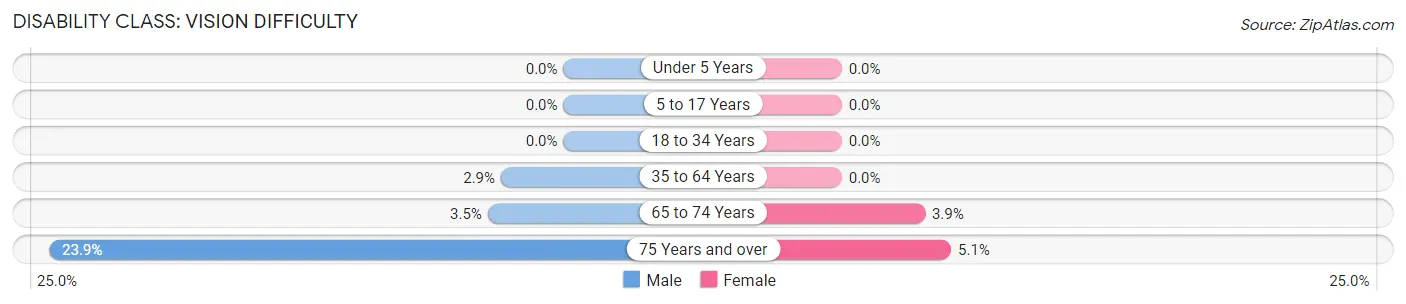
| Age Bracket | Male | Female |
| Under 5 Years | 0 (0.0%) | 0 (0.0%) |
| 5 to 17 Years | 0 (0.0%) | 0 (0.0%) |
| 18 to 34 Years | 0 (0.0%) | 0 (0.0%) |
| 35 to 64 Years | 32 (2.9%) | 0 (0.0%) |
| 65 to 74 Years | 24 (3.5%) | 22 (3.9%) |
| 75 Years and over | 63 (23.9%) | 27 (5.1%) |
Disability Class: Cognitive Difficulty
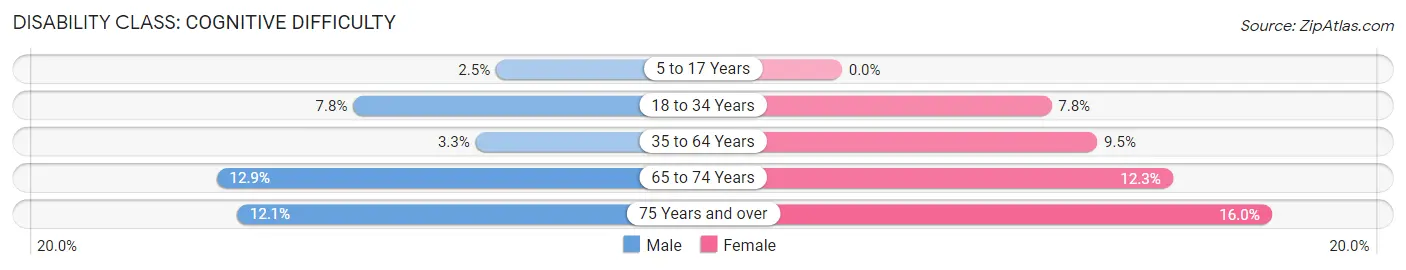
| Age Bracket | Male | Female |
| 5 to 17 Years | 18 (2.5%) | 0 (0.0%) |
| 18 to 34 Years | 54 (7.8%) | 55 (7.8%) |
| 35 to 64 Years | 36 (3.3%) | 117 (9.5%) |
| 65 to 74 Years | 88 (12.9%) | 70 (12.3%) |
| 75 Years and over | 32 (12.1%) | 85 (16.0%) |
Disability Class: Ambulatory Difficulty
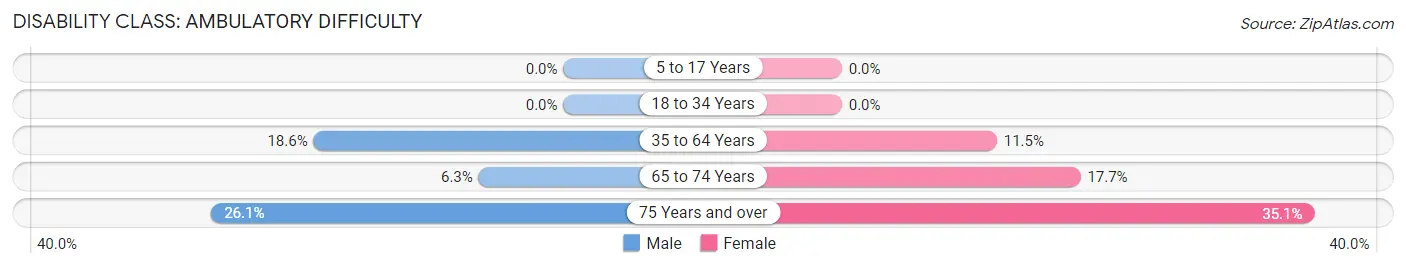
| Age Bracket | Male | Female |
| 5 to 17 Years | 0 (0.0%) | 0 (0.0%) |
| 18 to 34 Years | 0 (0.0%) | 0 (0.0%) |
| 35 to 64 Years | 205 (18.5%) | 142 (11.5%) |
| 65 to 74 Years | 43 (6.3%) | 101 (17.7%) |
| 75 Years and over | 69 (26.1%) | 187 (35.1%) |
Disability Class: Self-Care Difficulty
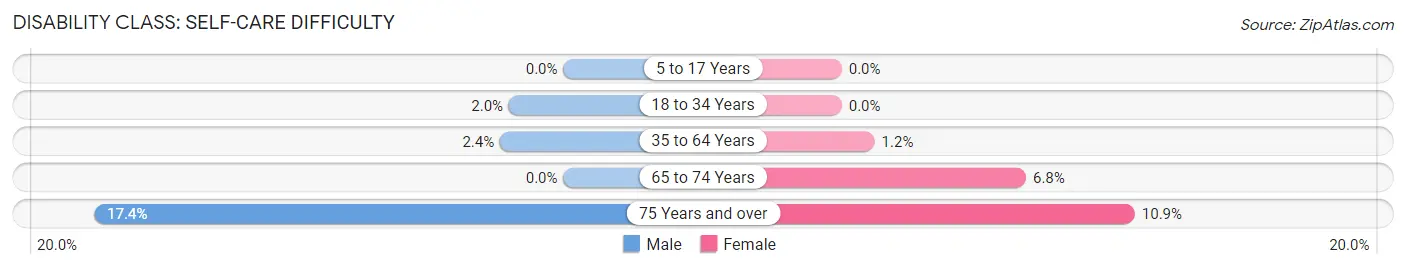
| Age Bracket | Male | Female |
| 5 to 17 Years | 0 (0.0%) | 0 (0.0%) |
| 18 to 34 Years | 14 (2.0%) | 0 (0.0%) |
| 35 to 64 Years | 26 (2.4%) | 15 (1.2%) |
| 65 to 74 Years | 0 (0.0%) | 39 (6.8%) |
| 75 Years and over | 46 (17.4%) | 58 (10.9%) |
Technology Access in Ludington
Computing Device Access in Ludington
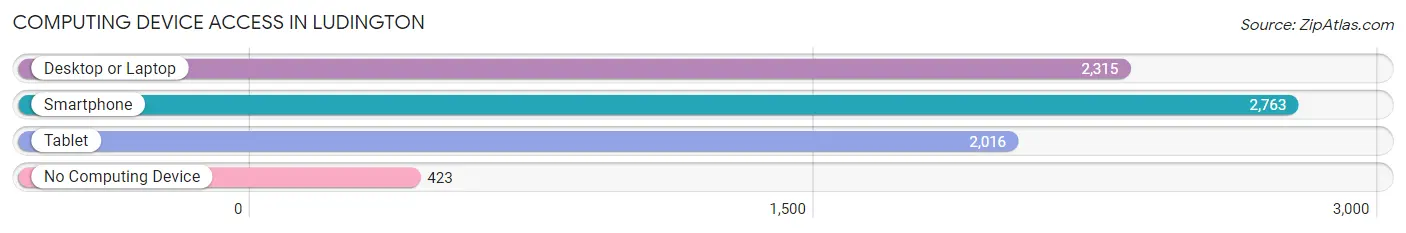
| Device Type | # Households | % Households |
| Desktop or Laptop | 2,315 | 66.7% |
| Smartphone | 2,763 | 79.6% |
| Tablet | 2,016 | 58.1% |
| No Computing Device | 423 | 12.2% |
| Total | 3,469 | 100.0% |
Internet Access in Ludington
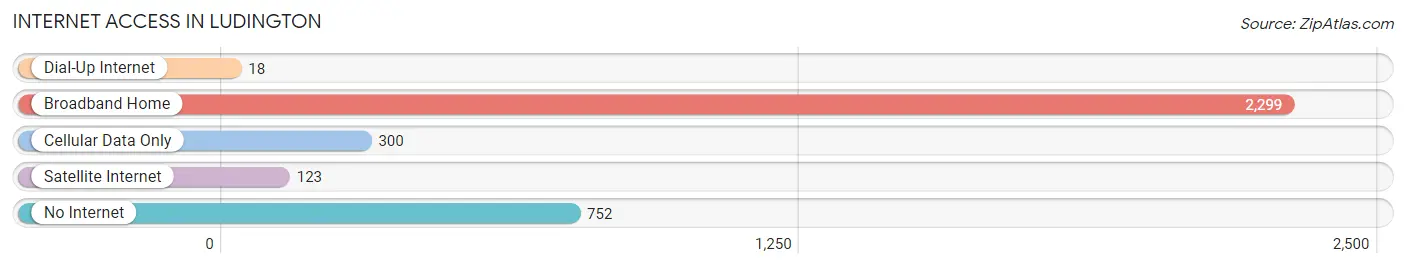
| Internet Type | # Households | % Households |
| Dial-Up Internet | 18 | 0.5% |
| Broadband Home | 2,299 | 66.3% |
| Cellular Data Only | 300 | 8.6% |
| Satellite Internet | 123 | 3.5% |
| No Internet | 752 | 21.7% |
| Total | 3,469 | 100.0% |
Ludington Summary
Ludington is a city located in Mason County, Michigan, United States. It is the county seat of Mason County and is located along the shores of Lake Michigan. The population was 8,076 at the 2010 census. It is the largest city in Mason County and is part of the larger Ludington-Scottville Micropolitan Statistical Area.
History
The area that is now Ludington was originally inhabited by the Anishinaabe people, who were part of the Ojibwe nation. The first European settlers arrived in the area in the early 19th century, and the city was founded in 1873. The city was named after James Ludington, a lumber baron who had a major influence on the development of the area.
The city quickly grew as a lumbering center, and by the late 19th century, it was one of the largest ports on Lake Michigan. The city was also a major center for shipbuilding, and several ships were built in the city during the late 19th and early 20th centuries.
In the early 20th century, the city began to diversify its economy, and it became a major tourist destination. The city is now home to several popular attractions, including the S.S. Badger car ferry, the Ludington State Park, and the Big Sable Point Lighthouse.
Geography
Ludington is located at the mouth of the Pere Marquette River, which empties into Lake Michigan. The city is located on the eastern shore of Lake Michigan, about 50 miles (80 km) north of Muskegon.
The city has a total area of 8.2 square miles (21.2 km2), of which 7.9 square miles (20.5 km2) is land and 0.3 square miles (0.7 km2) is water.
Economy
Ludington's economy is largely based on tourism and manufacturing. The city is home to several popular tourist attractions, including the S.S. Badger car ferry, the Ludington State Park, and the Big Sable Point Lighthouse. The city is also home to several manufacturing companies, including a paper mill, a steel mill, and a plastics plant.
Demographics
As of the 2010 census, there were 8,076 people, 3,541 households, and 2,092 families residing in the city. The population density was 1,022.3 people per square mile (395.2/km2). There were 3,945 housing units at an average density of 498.3 per square mile (192.3/km2). The racial makeup of the city was 94.2% White, 1.3% African American, 0.7% Native American, 0.7% Asian, 0.1% Pacific Islander, 1.2% from other races, and 2.0% from two or more races. Hispanic or Latino of any race were 4.2% of the population.
There were 3,541 households, out of which 28.2% had children under the age of 18 living with them, 41.2% were married couples living together, 14.2% had a female householder with no husband present, and 39.7% were non-families. 33.2% of all households were made up of individuals, and 14.2% had someone living alone who was 65 years of age or older. The average household size was 2.27 and the average family size was 2.88.
In the city, the population was spread out, with 24.2% under the age of 18, 8.2% from 18 to 24, 26.2% from 25 to 44, 23.2% from 45 to 64, and 18.2% who were 65 years of age or older. The median age was 38 years. For every 100 females, there were 91.2 males. For every 100 females age 18 and over, there were 87.2 males.
The median income for a household in the city was $31,944, and the median income for a family was $41,944. Males had a median income of $31,944 versus $22,944 for females. The per capita income for the city was $17,944. About 11.2% of families and 14.2% of the population were below the poverty line, including 19.2% of those under age 18 and 8.2% of those age 65 or over.
Common Questions
What is Per Capita Income in Ludington?
Per Capita income in Ludington is $30,385.
What is the Median Family Income in Ludington?
Median Family Income in Ludington is $75,521.
What is the Median Household income in Ludington?
Median Household Income in Ludington is $49,503.
What is Income or Wage Gap in Ludington?
Income or Wage Gap in Ludington is 37.6%.
Women in Ludington earn 62.4 cents for every dollar earned by a man.
What is Family Income Deficit in Ludington?
Family Income Deficit in Ludington is $13,970.
Families that are below poverty line in Ludington earn $13,970 less on average than the poverty threshold level.
What is Inequality or Gini Index in Ludington?
Inequality or Gini Index in Ludington is 0.44.
What is the Total Population of Ludington?
Total Population of Ludington is 7,691.
What is the Total Male Population of Ludington?
Total Male Population of Ludington is 3,808.
What is the Total Female Population of Ludington?
Total Female Population of Ludington is 3,883.
What is the Ratio of Males per 100 Females in Ludington?
There are 98.07 Males per 100 Females in Ludington.
What is the Ratio of Females per 100 Males in Ludington?
There are 101.97 Females per 100 Males in Ludington.
What is the Median Population Age in Ludington?
Median Population Age in Ludington is 42.3 Years.
What is the Average Family Size in Ludington
Average Family Size in Ludington is 3.0 People.
What is the Average Household Size in Ludington
Average Household Size in Ludington is 2.2 People.
How Large is the Labor Force in Ludington?
There are 3,136 People in the Labor Forcein in Ludington.
What is the Percentage of People in the Labor Force in Ludington?
51.0% of People are in the Labor Force in Ludington.
What is the Unemployment Rate in Ludington?
Unemployment Rate in Ludington is 4.1%.