Zip Codes with the Highest Percentage of Population with a Degree in Visual and Performing Arts in Northville, MI
RELATED REPORTS & OPTIONS
Visual and Performing Arts
Northville
Compare Zip Codes
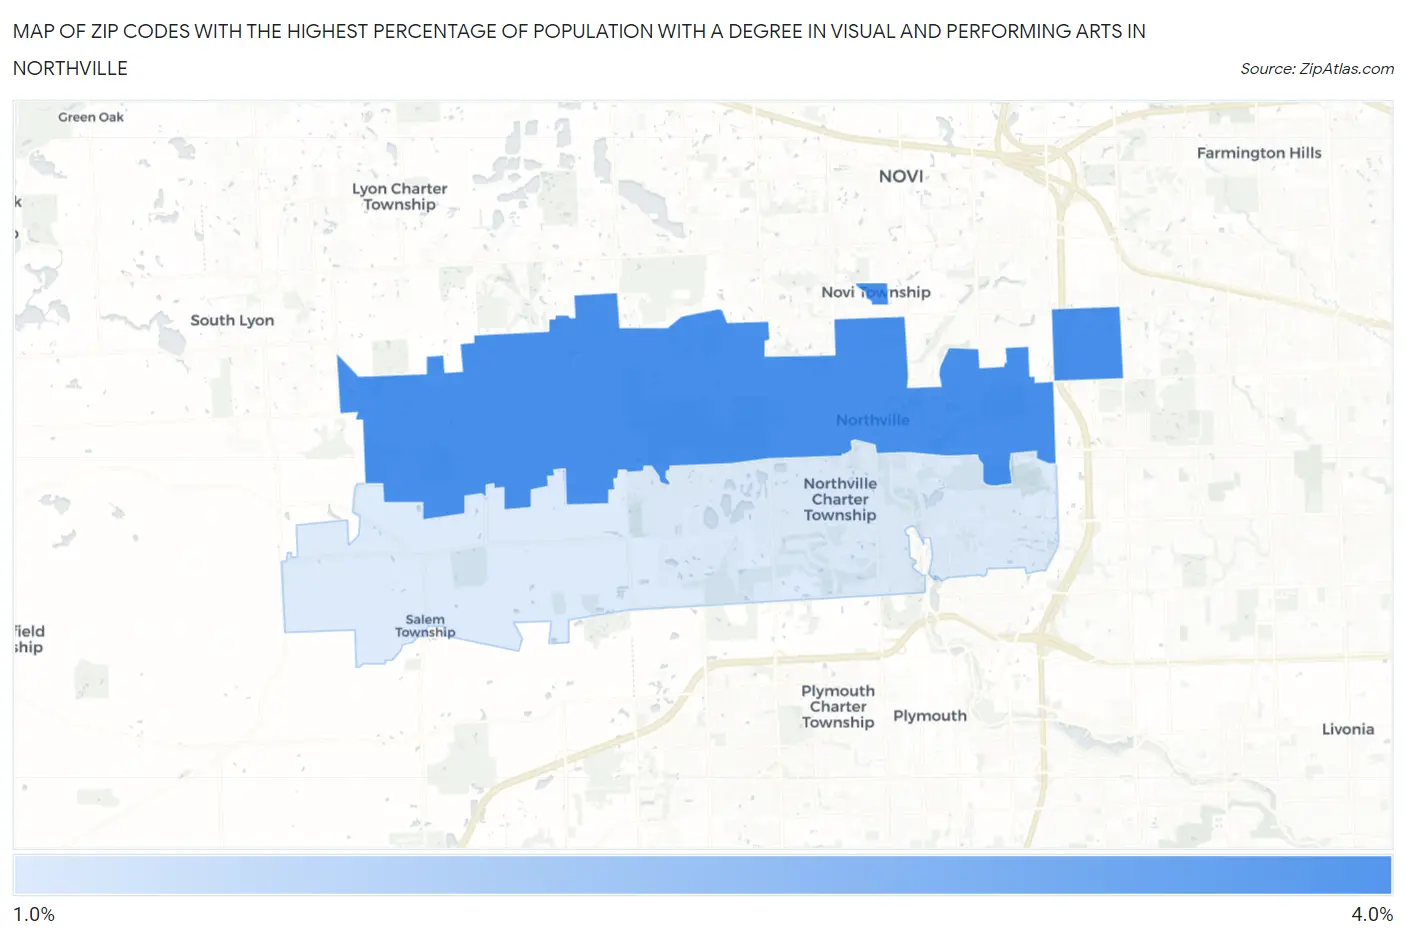
Map of Zip Codes with the Highest Percentage of Population with a Degree in Visual and Performing Arts in Northville
1.4%
3.7%
Zip Codes with the Highest Percentage of Population with a Degree in Visual and Performing Arts in Northville, MI
| Zip Code | % Graduates | vs State | vs National | |
| 1. | 48167 | 3.7% | 3.4%(+0.302)#274 | 4.3%(-0.548)#10,142 |
| 2. | 48168 | 1.4% | 3.4%(-1.99)#648 | 4.3%(-2.84)#18,432 |
1
Common Questions
What are the Top Zip Codes with the Highest Percentage of Population with a Degree in Visual and Performing Arts in Northville, MI?
Top Zip Codes with the Highest Percentage of Population with a Degree in Visual and Performing Arts in Northville, MI are:
What zip code has the Highest Percentage of Population with a Degree in Visual and Performing Arts in Northville, MI?
48167 has the Highest Percentage of Population with a Degree in Visual and Performing Arts in Northville, MI with 3.7%.
What is the Percentage of Population with a Degree in Visual and Performing Arts in Northville, MI?
Percentage of Population with a Degree in Visual and Performing Arts in Northville is 3.7%.
What is the Percentage of Population with a Degree in Visual and Performing Arts in Michigan?
Percentage of Population with a Degree in Visual and Performing Arts in Michigan is 3.4%.
What is the Percentage of Population with a Degree in Visual and Performing Arts in the United States?
Percentage of Population with a Degree in Visual and Performing Arts in the United States is 4.3%.