Zip Codes with the Highest Percentage of Population with a Degree in Visual and Performing Arts in Pontiac, MI
RELATED REPORTS & OPTIONS
Visual and Performing Arts
Pontiac
Compare Zip Codes
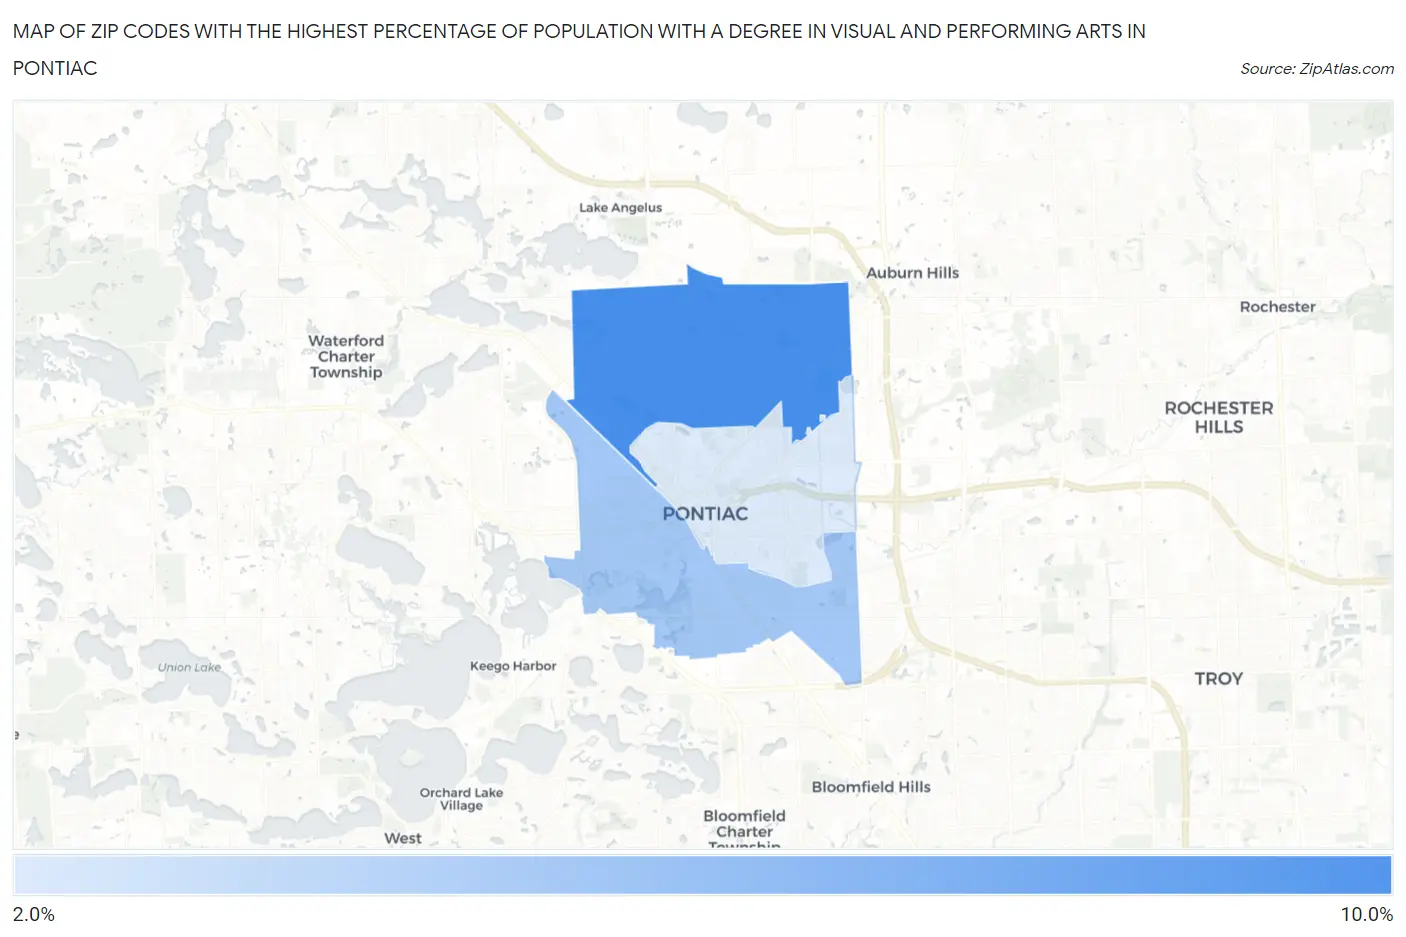
Map of Zip Codes with the Highest Percentage of Population with a Degree in Visual and Performing Arts in Pontiac
2.7%
9.9%
Zip Codes with the Highest Percentage of Population with a Degree in Visual and Performing Arts in Pontiac, MI
| Zip Code | % Graduates | vs State | vs National | |
| 1. | 48340 | 9.9% | 3.4%(+6.47)#26 | 4.3%(+5.62)#1,881 |
| 2. | 48341 | 5.4% | 3.4%(+2.01)#131 | 4.3%(+1.16)#5,824 |
| 3. | 48342 | 2.7% | 3.4%(-0.699)#417 | 4.3%(-1.55)#13,886 |
1
Common Questions
What are the Top Zip Codes with the Highest Percentage of Population with a Degree in Visual and Performing Arts in Pontiac, MI?
Top Zip Codes with the Highest Percentage of Population with a Degree in Visual and Performing Arts in Pontiac, MI are:
What zip code has the Highest Percentage of Population with a Degree in Visual and Performing Arts in Pontiac, MI?
48340 has the Highest Percentage of Population with a Degree in Visual and Performing Arts in Pontiac, MI with 9.9%.
What is the Percentage of Population with a Degree in Visual and Performing Arts in Pontiac, MI?
Percentage of Population with a Degree in Visual and Performing Arts in Pontiac is 6.6%.
What is the Percentage of Population with a Degree in Visual and Performing Arts in Michigan?
Percentage of Population with a Degree in Visual and Performing Arts in Michigan is 3.4%.
What is the Percentage of Population with a Degree in Visual and Performing Arts in the United States?
Percentage of Population with a Degree in Visual and Performing Arts in the United States is 4.3%.