Zip Codes with the Highest Percentage of Population with a Degree in Visual and Performing Arts in Michigan
RELATED REPORTS & OPTIONS
Visual and Performing Arts
Michigan
Compare Zip Codes
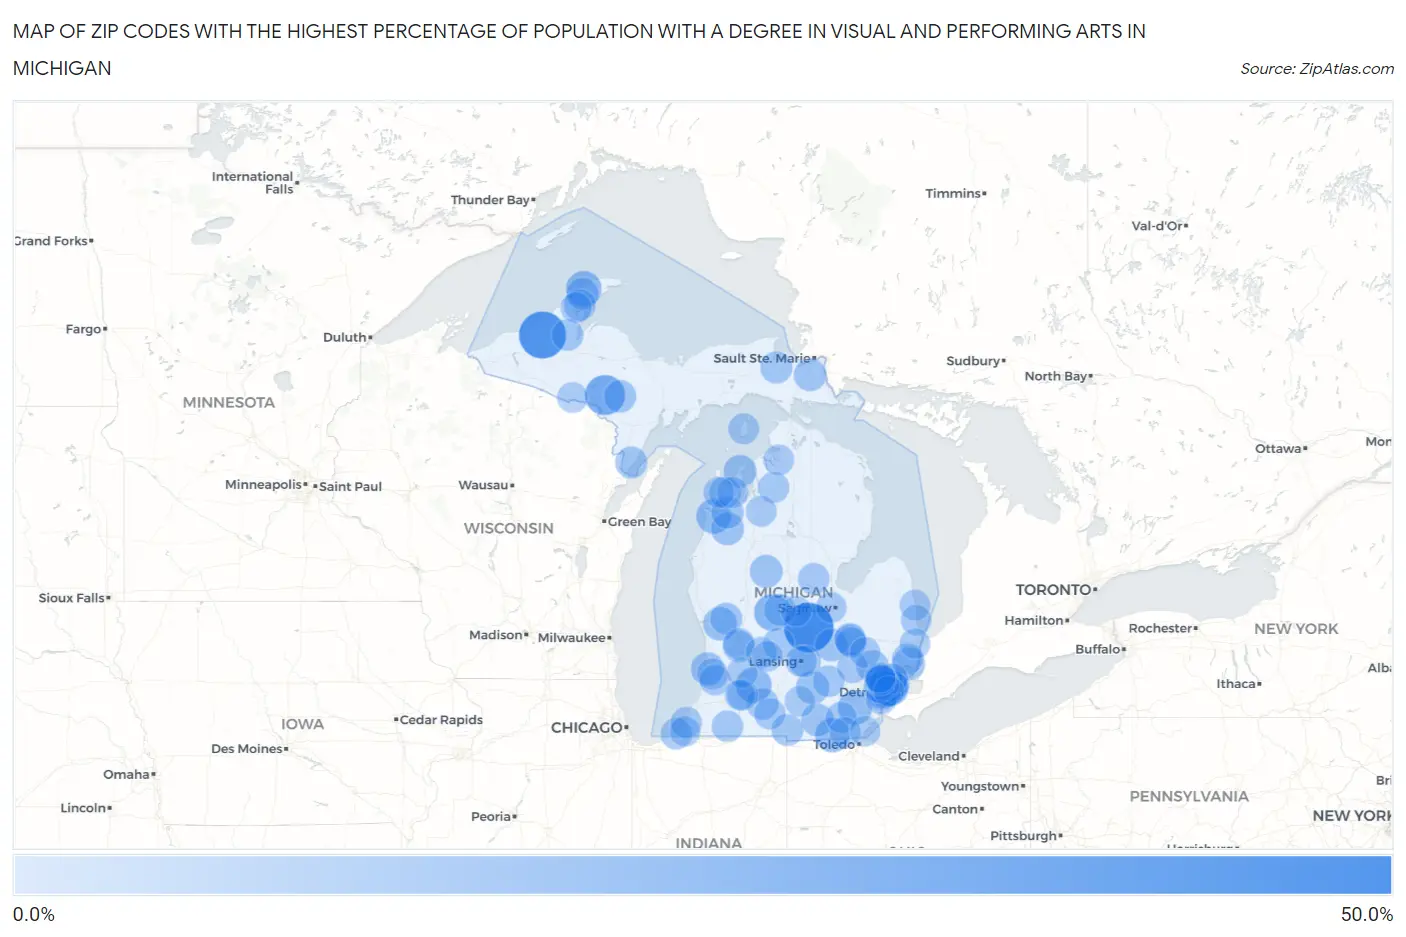
Map of Zip Codes with the Highest Percentage of Population with a Degree in Visual and Performing Arts in Michigan
0.0%
50.0%
Zip Codes with the Highest Percentage of Population with a Degree in Visual and Performing Arts in Michigan
| Zip Code | % Graduates | vs State | vs National | |
| 1. | 48807 | 42.3% | 3.4%(+38.9)#1 | 4.3%(+38.1)#116 |
| 2. | 49929 | 37.5% | 3.4%(+34.1)#2 | 4.3%(+33.2)#133 |
| 3. | 49881 | 24.3% | 3.4%(+20.9)#3 | 4.3%(+20.1)#329 |
| 4. | 48852 | 18.2% | 3.4%(+14.8)#4 | 4.3%(+13.9)#570 |
| 5. | 49060 | 16.0% | 3.4%(+12.5)#5 | 4.3%(+11.7)#717 |
| 6. | 49805 | 15.9% | 3.4%(+12.5)#6 | 4.3%(+11.6)#730 |
| 7. | 48213 | 15.5% | 3.4%(+12.1)#7 | 4.3%(+11.2)#758 |
| 8. | 49616 | 14.6% | 3.4%(+11.2)#8 | 4.3%(+10.4)#857 |
| 9. | 49248 | 14.1% | 3.4%(+10.7)#9 | 4.3%(+9.89)#937 |
| 10. | 48190 | 14.0% | 3.4%(+10.6)#10 | 4.3%(+9.73)#961 |
| 11. | 49451 | 12.3% | 3.4%(+8.88)#11 | 4.3%(+8.03)#1,232 |
| 12. | 48220 | 11.7% | 3.4%(+8.30)#12 | 4.3%(+7.45)#1,352 |
| 13. | 49272 | 11.5% | 3.4%(+8.06)#13 | 4.3%(+7.21)#1,405 |
| 14. | 49406 | 11.3% | 3.4%(+7.93)#14 | 4.3%(+7.08)#1,432 |
| 15. | 49679 | 11.0% | 3.4%(+7.58)#15 | 4.3%(+6.73)#1,535 |
| 16. | 48023 | 11.0% | 3.4%(+7.58)#16 | 4.3%(+6.73)#1,537 |
| 17. | 49625 | 11.0% | 3.4%(+7.57)#17 | 4.3%(+6.72)#1,539 |
| 18. | 49670 | 11.0% | 3.4%(+7.57)#18 | 4.3%(+6.72)#1,540 |
| 19. | 49253 | 10.9% | 3.4%(+7.45)#19 | 4.3%(+6.60)#1,576 |
| 20. | 48476 | 10.8% | 3.4%(+7.37)#20 | 4.3%(+6.52)#1,602 |
| 21. | 48210 | 10.5% | 3.4%(+7.07)#21 | 4.3%(+6.22)#1,684 |
| 22. | 49831 | 10.3% | 3.4%(+6.89)#22 | 4.3%(+6.04)#1,742 |
| 23. | 49724 | 10.0% | 3.4%(+6.64)#23 | 4.3%(+5.79)#1,811 |
| 24. | 49643 | 10.0% | 3.4%(+6.58)#24 | 4.3%(+5.73)#1,849 |
| 25. | 48202 | 9.9% | 3.4%(+6.49)#25 | 4.3%(+5.64)#1,879 |
| 26. | 48340 | 9.9% | 3.4%(+6.47)#26 | 4.3%(+5.62)#1,881 |
| 27. | 48215 | 9.8% | 3.4%(+6.42)#27 | 4.3%(+5.57)#1,900 |
| 28. | 49901 | 9.6% | 3.4%(+6.19)#28 | 4.3%(+5.34)#1,995 |
| 29. | 49728 | 9.5% | 3.4%(+6.12)#29 | 4.3%(+5.27)#2,013 |
| 30. | 49303 | 9.5% | 3.4%(+6.06)#30 | 4.3%(+5.21)#2,039 |
| 31. | 48891 | 9.3% | 3.4%(+5.87)#31 | 4.3%(+5.02)#2,126 |
| 32. | 48209 | 9.2% | 3.4%(+5.79)#32 | 4.3%(+4.94)#2,173 |
| 33. | 49858 | 9.1% | 3.4%(+5.73)#33 | 4.3%(+4.88)#2,193 |
| 34. | 48825 | 9.1% | 3.4%(+5.69)#34 | 4.3%(+4.84)#2,210 |
| 35. | 49274 | 9.0% | 3.4%(+5.61)#35 | 4.3%(+4.76)#2,254 |
| 36. | 49051 | 9.0% | 3.4%(+5.57)#36 | 4.3%(+4.72)#2,269 |
| 37. | 49507 | 9.0% | 3.4%(+5.57)#37 | 4.3%(+4.72)#2,275 |
| 38. | 49958 | 8.9% | 3.4%(+5.53)#38 | 4.3%(+4.68)#2,290 |
| 39. | 49934 | 8.8% | 3.4%(+5.42)#39 | 4.3%(+4.57)#2,342 |
| 40. | 49664 | 8.8% | 3.4%(+5.41)#40 | 4.3%(+4.56)#2,348 |
| 41. | 48137 | 8.7% | 3.4%(+5.32)#41 | 4.3%(+4.47)#2,407 |
| 42. | 48851 | 8.7% | 3.4%(+5.31)#42 | 4.3%(+4.46)#2,409 |
| 43. | 49061 | 8.5% | 3.4%(+5.11)#43 | 4.3%(+4.26)#2,517 |
| 44. | 48212 | 8.5% | 3.4%(+5.11)#44 | 4.3%(+4.26)#2,523 |
| 45. | 48225 | 8.4% | 3.4%(+5.03)#45 | 4.3%(+4.18)#2,578 |
| 46. | 48069 | 8.4% | 3.4%(+4.97)#46 | 4.3%(+4.12)#2,614 |
| 47. | 48214 | 8.4% | 3.4%(+4.96)#47 | 4.3%(+4.11)#2,620 |
| 48. | 48628 | 8.4% | 3.4%(+4.95)#48 | 4.3%(+4.10)#2,626 |
| 49. | 48201 | 8.4% | 3.4%(+4.95)#49 | 4.3%(+4.10)#2,627 |
| 50. | 48208 | 8.3% | 3.4%(+4.93)#50 | 4.3%(+4.08)#2,650 |
| 51. | 49117 | 8.3% | 3.4%(+4.87)#51 | 4.3%(+4.02)#2,672 |
| 52. | 48502 | 8.2% | 3.4%(+4.82)#52 | 4.3%(+3.97)#2,703 |
| 53. | 48503 | 8.2% | 3.4%(+4.81)#53 | 4.3%(+3.96)#2,712 |
| 54. | 48206 | 8.1% | 3.4%(+4.74)#54 | 4.3%(+3.89)#2,755 |
| 55. | 49621 | 8.1% | 3.4%(+4.66)#55 | 4.3%(+3.81)#2,803 |
| 56. | 49503 | 8.1% | 3.4%(+4.65)#56 | 4.3%(+3.80)#2,807 |
| 57. | 49229 | 8.0% | 3.4%(+4.63)#57 | 4.3%(+3.78)#2,822 |
| 58. | 48205 | 8.0% | 3.4%(+4.61)#58 | 4.3%(+3.76)#2,837 |
| 59. | 49094 | 8.0% | 3.4%(+4.59)#59 | 4.3%(+3.74)#2,856 |
| 60. | 49106 | 8.0% | 3.4%(+4.58)#60 | 4.3%(+3.73)#2,863 |
| 61. | 48224 | 8.0% | 3.4%(+4.57)#61 | 4.3%(+3.72)#2,866 |
| 62. | 48815 | 7.9% | 3.4%(+4.53)#62 | 4.3%(+3.68)#2,897 |
| 63. | 48015 | 7.8% | 3.4%(+4.42)#63 | 4.3%(+3.57)#2,970 |
| 64. | 48064 | 7.8% | 3.4%(+4.38)#64 | 4.3%(+3.53)#3,001 |
| 65. | 48933 | 7.8% | 3.4%(+4.35)#65 | 4.3%(+3.50)#3,016 |
| 66. | 49276 | 7.7% | 3.4%(+4.29)#66 | 4.3%(+3.44)#3,064 |
| 67. | 48357 | 7.7% | 3.4%(+4.29)#67 | 4.3%(+3.44)#3,081 |
| 68. | 49659 | 7.7% | 3.4%(+4.26)#68 | 4.3%(+3.41)#3,098 |
| 69. | 49007 | 7.6% | 3.4%(+4.24)#69 | 4.3%(+3.39)#3,115 |
| 70. | 49782 | 7.6% | 3.4%(+4.24)#70 | 4.3%(+3.39)#3,116 |
| 71. | 48216 | 7.6% | 3.4%(+4.21)#71 | 4.3%(+3.36)#3,138 |
| 72. | 49408 | 7.5% | 3.4%(+4.14)#72 | 4.3%(+3.29)#3,179 |
| 73. | 49636 | 7.4% | 3.4%(+3.95)#73 | 4.3%(+3.10)#3,323 |
| 74. | 49450 | 7.3% | 3.4%(+3.94)#74 | 4.3%(+3.09)#3,337 |
| 75. | 49680 | 7.3% | 3.4%(+3.93)#75 | 4.3%(+3.08)#3,350 |
| 76. | 48229 | 7.3% | 3.4%(+3.93)#76 | 4.3%(+3.08)#3,352 |
| 77. | 49344 | 7.3% | 3.4%(+3.87)#77 | 4.3%(+3.02)#3,406 |
| 78. | 49922 | 7.2% | 3.4%(+3.83)#78 | 4.3%(+2.98)#3,447 |
| 79. | 48529 | 7.2% | 3.4%(+3.76)#79 | 4.3%(+2.91)#3,491 |
| 80. | 48030 | 7.1% | 3.4%(+3.74)#80 | 4.3%(+2.89)#3,527 |
| 81. | 48227 | 7.1% | 3.4%(+3.72)#81 | 4.3%(+2.87)#3,539 |
| 82. | 49927 | 7.0% | 3.4%(+3.62)#82 | 4.3%(+2.77)#3,646 |
| 83. | 48066 | 7.0% | 3.4%(+3.60)#83 | 4.3%(+2.75)#3,665 |
| 84. | 48203 | 7.0% | 3.4%(+3.59)#84 | 4.3%(+2.74)#3,672 |
| 85. | 48469 | 7.0% | 3.4%(+3.58)#85 | 4.3%(+2.73)#3,675 |
| 86. | 48462 | 7.0% | 3.4%(+3.58)#86 | 4.3%(+2.73)#3,679 |
| 87. | 49796 | 6.9% | 3.4%(+3.47)#87 | 4.3%(+2.62)#3,786 |
| 88. | 48070 | 6.8% | 3.4%(+3.45)#88 | 4.3%(+2.60)#3,821 |
| 89. | 48638 | 6.8% | 3.4%(+3.43)#89 | 4.3%(+2.58)#3,844 |
| 90. | 48450 | 6.7% | 3.4%(+3.34)#90 | 4.3%(+2.49)#3,940 |
| 91. | 48849 | 6.7% | 3.4%(+3.33)#91 | 4.3%(+2.48)#3,953 |
| 92. | 49283 | 6.7% | 3.4%(+3.31)#92 | 4.3%(+2.46)#3,969 |
| 93. | 48801 | 6.7% | 3.4%(+3.29)#93 | 4.3%(+2.44)#3,987 |
| 94. | 48074 | 6.6% | 3.4%(+3.23)#94 | 4.3%(+2.38)#4,084 |
| 95. | 48157 | 6.6% | 3.4%(+3.16)#95 | 4.3%(+2.31)#4,166 |
| 96. | 49128 | 6.5% | 3.4%(+3.10)#96 | 4.3%(+2.25)#4,219 |
| 97. | 49006 | 6.5% | 3.4%(+3.08)#97 | 4.3%(+2.23)#4,253 |
| 98. | 48067 | 6.5% | 3.4%(+3.07)#98 | 4.3%(+2.22)#4,266 |
| 99. | 48207 | 6.4% | 3.4%(+3.00)#99 | 4.3%(+2.15)#4,341 |
| 100. | 48073 | 6.4% | 3.4%(+2.95)#100 | 4.3%(+2.10)#4,401 |
Common Questions
What are the Top 10 Zip Codes with the Highest Percentage of Population with a Degree in Visual and Performing Arts in Michigan?
Top 10 Zip Codes with the Highest Percentage of Population with a Degree in Visual and Performing Arts in Michigan are:
What zip code has the Highest Percentage of Population with a Degree in Visual and Performing Arts in Michigan?
48807 has the Highest Percentage of Population with a Degree in Visual and Performing Arts in Michigan with 42.3%.
What is the Percentage of Population with a Degree in Visual and Performing Arts in the State of Michigan?
Percentage of Population with a Degree in Visual and Performing Arts in Michigan is 3.4%.
What is the Percentage of Population with a Degree in Visual and Performing Arts in the United States?
Percentage of Population with a Degree in Visual and Performing Arts in the United States is 4.3%.