Zip Codes with the Highest Percentage of Population with a Degree in Visual and Performing Arts in East Lansing, MI
RELATED REPORTS & OPTIONS
Visual and Performing Arts
East Lansing
Compare Zip Codes
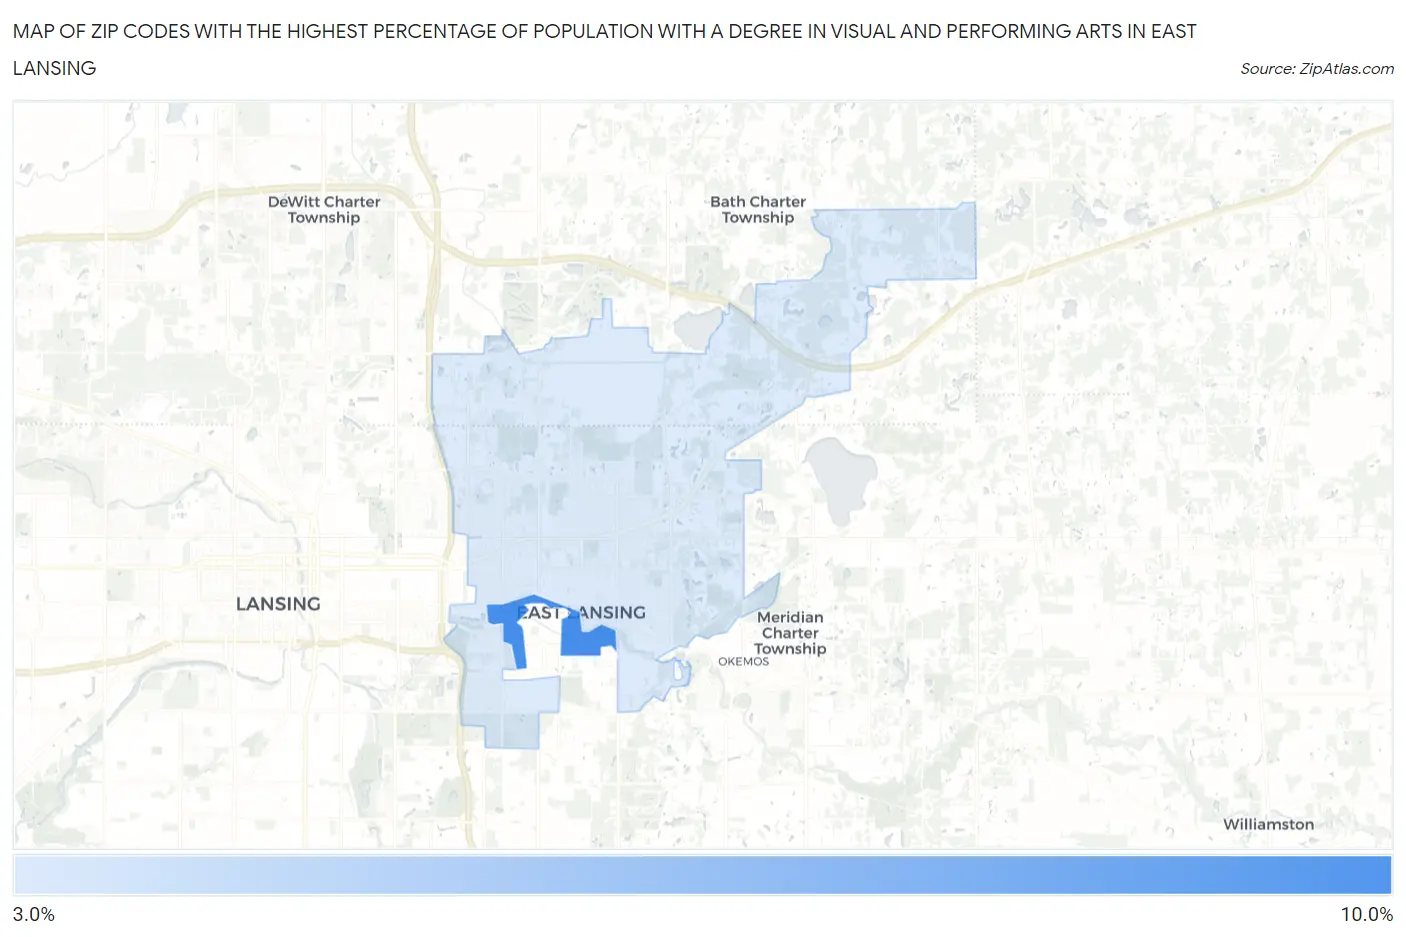
Map of Zip Codes with the Highest Percentage of Population with a Degree in Visual and Performing Arts in East Lansing
3.5%
9.1%
Zip Codes with the Highest Percentage of Population with a Degree in Visual and Performing Arts in East Lansing, MI
| Zip Code | % Graduates | vs State | vs National | |
| 1. | 48825 | 9.1% | 3.4%(+5.69)#34 | 4.3%(+4.84)#2,210 |
| 2. | 48823 | 3.5% | 3.4%(+0.120)#299 | 4.3%(-0.730)#10,808 |
1
Common Questions
What are the Top Zip Codes with the Highest Percentage of Population with a Degree in Visual and Performing Arts in East Lansing, MI?
Top Zip Codes with the Highest Percentage of Population with a Degree in Visual and Performing Arts in East Lansing, MI are:
What zip code has the Highest Percentage of Population with a Degree in Visual and Performing Arts in East Lansing, MI?
48825 has the Highest Percentage of Population with a Degree in Visual and Performing Arts in East Lansing, MI with 9.1%.
What is the Percentage of Population with a Degree in Visual and Performing Arts in East Lansing, MI?
Percentage of Population with a Degree in Visual and Performing Arts in East Lansing is 3.7%.
What is the Percentage of Population with a Degree in Visual and Performing Arts in Michigan?
Percentage of Population with a Degree in Visual and Performing Arts in Michigan is 3.4%.
What is the Percentage of Population with a Degree in Visual and Performing Arts in the United States?
Percentage of Population with a Degree in Visual and Performing Arts in the United States is 4.3%.