Zip Codes with the Highest Percentage of Population with a Degree in Visual and Performing Arts in Westland, MI
RELATED REPORTS & OPTIONS
Visual and Performing Arts
Westland
Compare Zip Codes
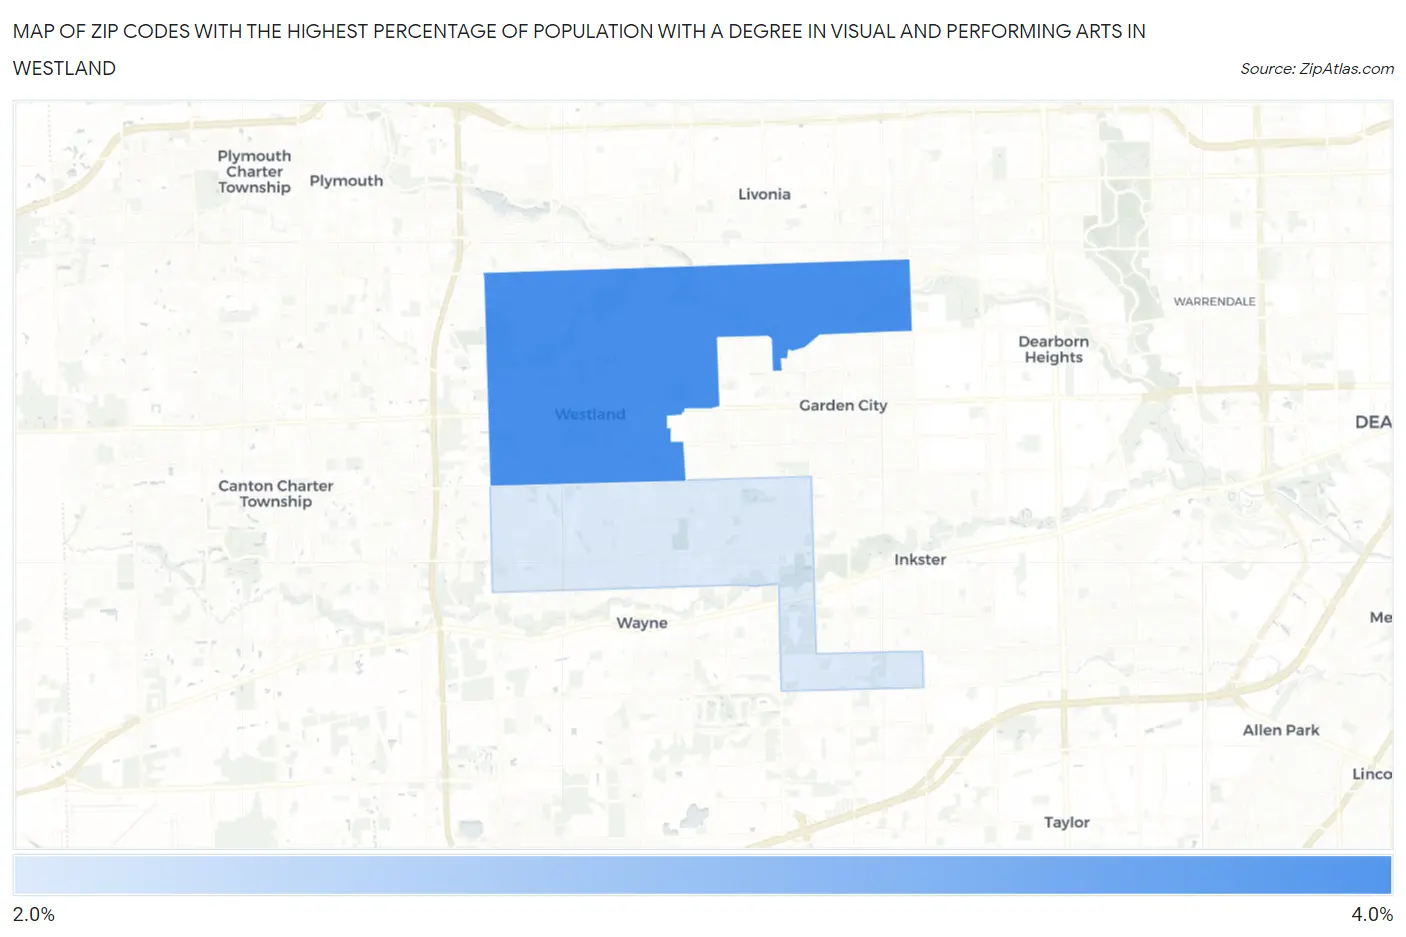
Map of Zip Codes with the Highest Percentage of Population with a Degree in Visual and Performing Arts in Westland
2.6%
3.8%
Zip Codes with the Highest Percentage of Population with a Degree in Visual and Performing Arts in Westland, MI
| Zip Code | % Graduates | vs State | vs National | |
| 1. | 48185 | 3.8% | 3.4%(+0.396)#265 | 4.3%(-0.454)#9,860 |
| 2. | 48186 | 2.6% | 3.4%(-0.823)#432 | 4.3%(-1.67)#14,330 |
1
Common Questions
What are the Top Zip Codes with the Highest Percentage of Population with a Degree in Visual and Performing Arts in Westland, MI?
Top Zip Codes with the Highest Percentage of Population with a Degree in Visual and Performing Arts in Westland, MI are:
What zip code has the Highest Percentage of Population with a Degree in Visual and Performing Arts in Westland, MI?
48185 has the Highest Percentage of Population with a Degree in Visual and Performing Arts in Westland, MI with 3.8%.
What is the Percentage of Population with a Degree in Visual and Performing Arts in Westland, MI?
Percentage of Population with a Degree in Visual and Performing Arts in Westland is 3.4%.
What is the Percentage of Population with a Degree in Visual and Performing Arts in Michigan?
Percentage of Population with a Degree in Visual and Performing Arts in Michigan is 3.4%.
What is the Percentage of Population with a Degree in Visual and Performing Arts in the United States?
Percentage of Population with a Degree in Visual and Performing Arts in the United States is 4.3%.