Zip Codes with the Highest Percentage of Population with a Degree in Visual and Performing Arts in Southfield, MI
RELATED REPORTS & OPTIONS
Visual and Performing Arts
Southfield
Compare Zip Codes
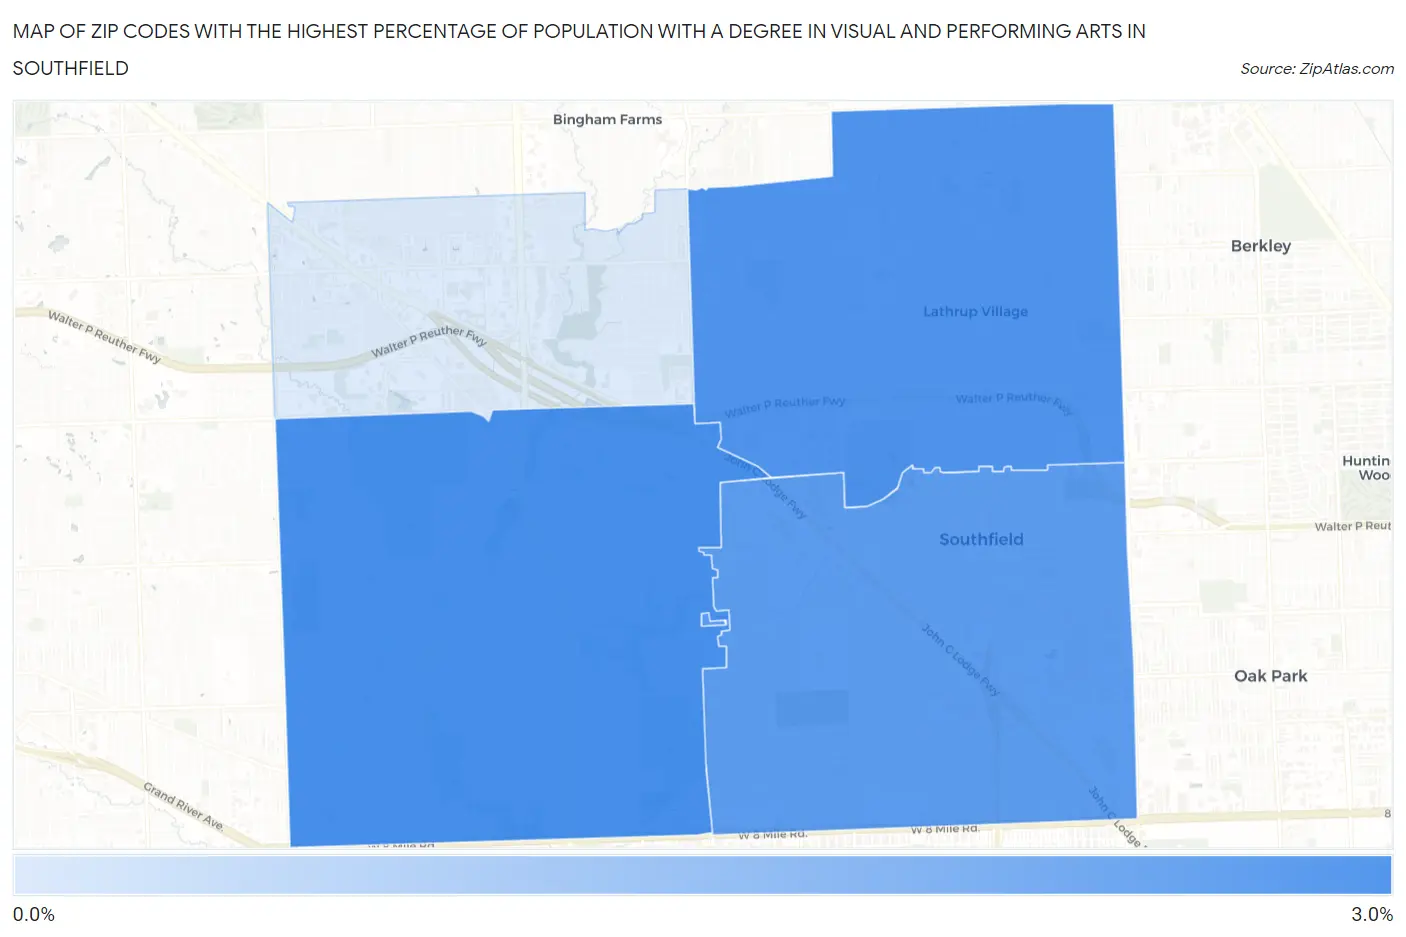
Map of Zip Codes with the Highest Percentage of Population with a Degree in Visual and Performing Arts in Southfield
0.65%
2.8%
Zip Codes with the Highest Percentage of Population with a Degree in Visual and Performing Arts in Southfield, MI
| Zip Code | % Graduates | vs State | vs National | |
| 1. | 48033 | 2.8% | 3.4%(-0.575)#395 | 4.3%(-1.43)#13,384 |
| 2. | 48076 | 2.7% | 3.4%(-0.661)#411 | 4.3%(-1.51)#13,730 |
| 3. | 48075 | 2.6% | 3.4%(-0.840)#434 | 4.3%(-1.69)#14,404 |
| 4. | 48034 | 0.65% | 3.4%(-2.75)#739 | 4.3%(-3.60)#20,460 |
1
Common Questions
What are the Top 3 Zip Codes with the Highest Percentage of Population with a Degree in Visual and Performing Arts in Southfield, MI?
Top 3 Zip Codes with the Highest Percentage of Population with a Degree in Visual and Performing Arts in Southfield, MI are:
What zip code has the Highest Percentage of Population with a Degree in Visual and Performing Arts in Southfield, MI?
48033 has the Highest Percentage of Population with a Degree in Visual and Performing Arts in Southfield, MI with 2.8%.
What is the Percentage of Population with a Degree in Visual and Performing Arts in Southfield, MI?
Percentage of Population with a Degree in Visual and Performing Arts in Southfield is 2.3%.
What is the Percentage of Population with a Degree in Visual and Performing Arts in Michigan?
Percentage of Population with a Degree in Visual and Performing Arts in Michigan is 3.4%.
What is the Percentage of Population with a Degree in Visual and Performing Arts in the United States?
Percentage of Population with a Degree in Visual and Performing Arts in the United States is 4.3%.