Zip Codes with the Highest Percentage of Population with a Degree in Visual and Performing Arts in Livonia, MI
RELATED REPORTS & OPTIONS
Visual and Performing Arts
Livonia
Compare Zip Codes
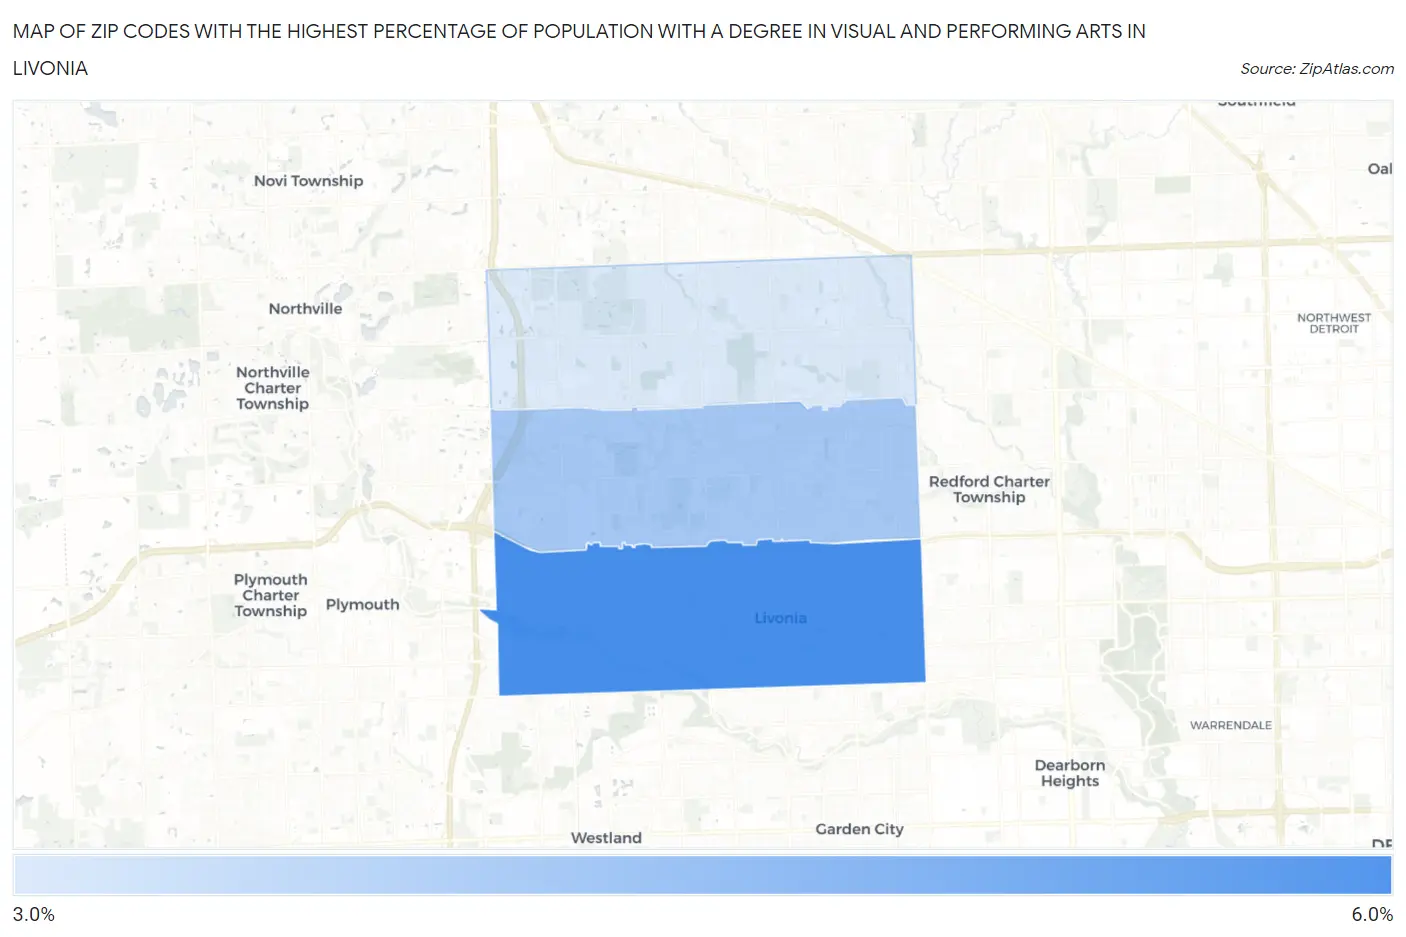
Map of Zip Codes with the Highest Percentage of Population with a Degree in Visual and Performing Arts in Livonia
3.4%
5.0%
Zip Codes with the Highest Percentage of Population with a Degree in Visual and Performing Arts in Livonia, MI
| Zip Code | % Graduates | vs State | vs National | |
| 1. | 48150 | 5.0% | 3.4%(+1.63)#164 | 4.3%(+0.783)#6,547 |
| 2. | 48154 | 4.0% | 3.4%(+0.623)#241 | 4.3%(-0.227)#9,179 |
| 3. | 48152 | 3.4% | 3.4%(+0.038)#311 | 4.3%(-0.812)#11,115 |
1
Common Questions
What are the Top Zip Codes with the Highest Percentage of Population with a Degree in Visual and Performing Arts in Livonia, MI?
Top Zip Codes with the Highest Percentage of Population with a Degree in Visual and Performing Arts in Livonia, MI are:
What zip code has the Highest Percentage of Population with a Degree in Visual and Performing Arts in Livonia, MI?
48150 has the Highest Percentage of Population with a Degree in Visual and Performing Arts in Livonia, MI with 5.0%.
What is the Percentage of Population with a Degree in Visual and Performing Arts in Livonia, MI?
Percentage of Population with a Degree in Visual and Performing Arts in Livonia is 4.1%.
What is the Percentage of Population with a Degree in Visual and Performing Arts in Michigan?
Percentage of Population with a Degree in Visual and Performing Arts in Michigan is 3.4%.
What is the Percentage of Population with a Degree in Visual and Performing Arts in the United States?
Percentage of Population with a Degree in Visual and Performing Arts in the United States is 4.3%.