Zip Codes with the Highest Percentage of Population with a Degree in Visual and Performing Arts in Waterford, MI
RELATED REPORTS & OPTIONS
Visual and Performing Arts
Waterford
Compare Zip Codes
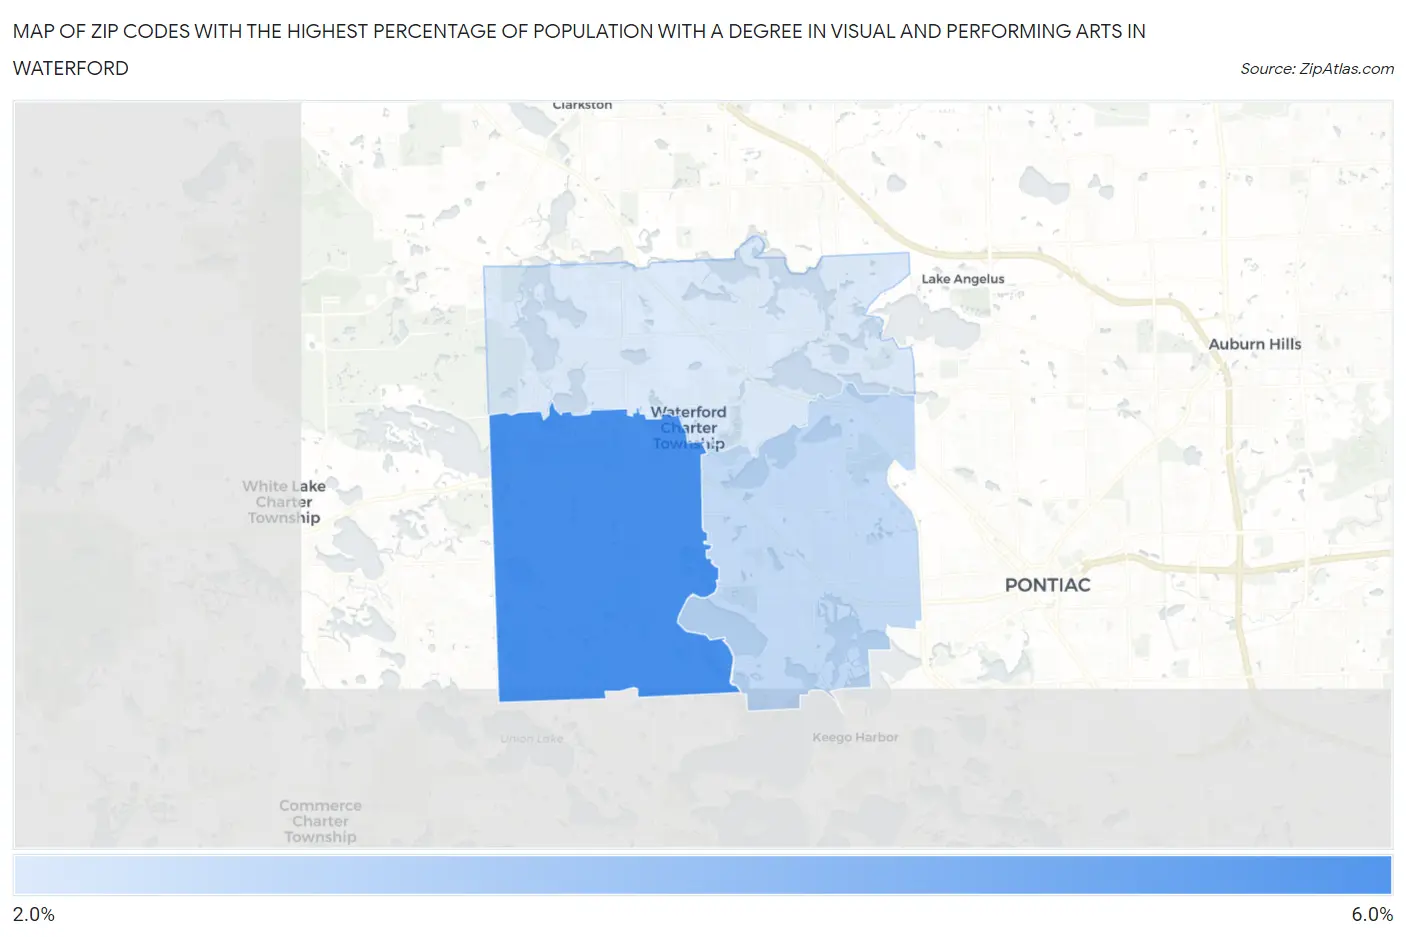
Map of Zip Codes with the Highest Percentage of Population with a Degree in Visual and Performing Arts in Waterford
2.1%
5.6%
Zip Codes with the Highest Percentage of Population with a Degree in Visual and Performing Arts in Waterford, MI
| Zip Code | % Graduates | vs State | vs National | |
| 1. | 48327 | 5.6% | 3.4%(+2.16)#126 | 4.3%(+1.31)#5,557 |
| 2. | 48328 | 2.7% | 3.4%(-0.697)#416 | 4.3%(-1.55)#13,878 |
| 3. | 48329 | 2.1% | 3.4%(-1.28)#522 | 4.3%(-2.13)#15,993 |
1
Common Questions
What are the Top Zip Codes with the Highest Percentage of Population with a Degree in Visual and Performing Arts in Waterford, MI?
Top Zip Codes with the Highest Percentage of Population with a Degree in Visual and Performing Arts in Waterford, MI are:
What zip code has the Highest Percentage of Population with a Degree in Visual and Performing Arts in Waterford, MI?
48327 has the Highest Percentage of Population with a Degree in Visual and Performing Arts in Waterford, MI with 5.6%.
What is the Percentage of Population with a Degree in Visual and Performing Arts in Michigan?
Percentage of Population with a Degree in Visual and Performing Arts in Michigan is 3.4%.
What is the Percentage of Population with a Degree in Visual and Performing Arts in the United States?
Percentage of Population with a Degree in Visual and Performing Arts in the United States is 4.3%.