Zip Codes with the Highest Percentage of Population with a Degree in Visual and Performing Arts in Burton, MI
RELATED REPORTS & OPTIONS
Visual and Performing Arts
Burton
Compare Zip Codes
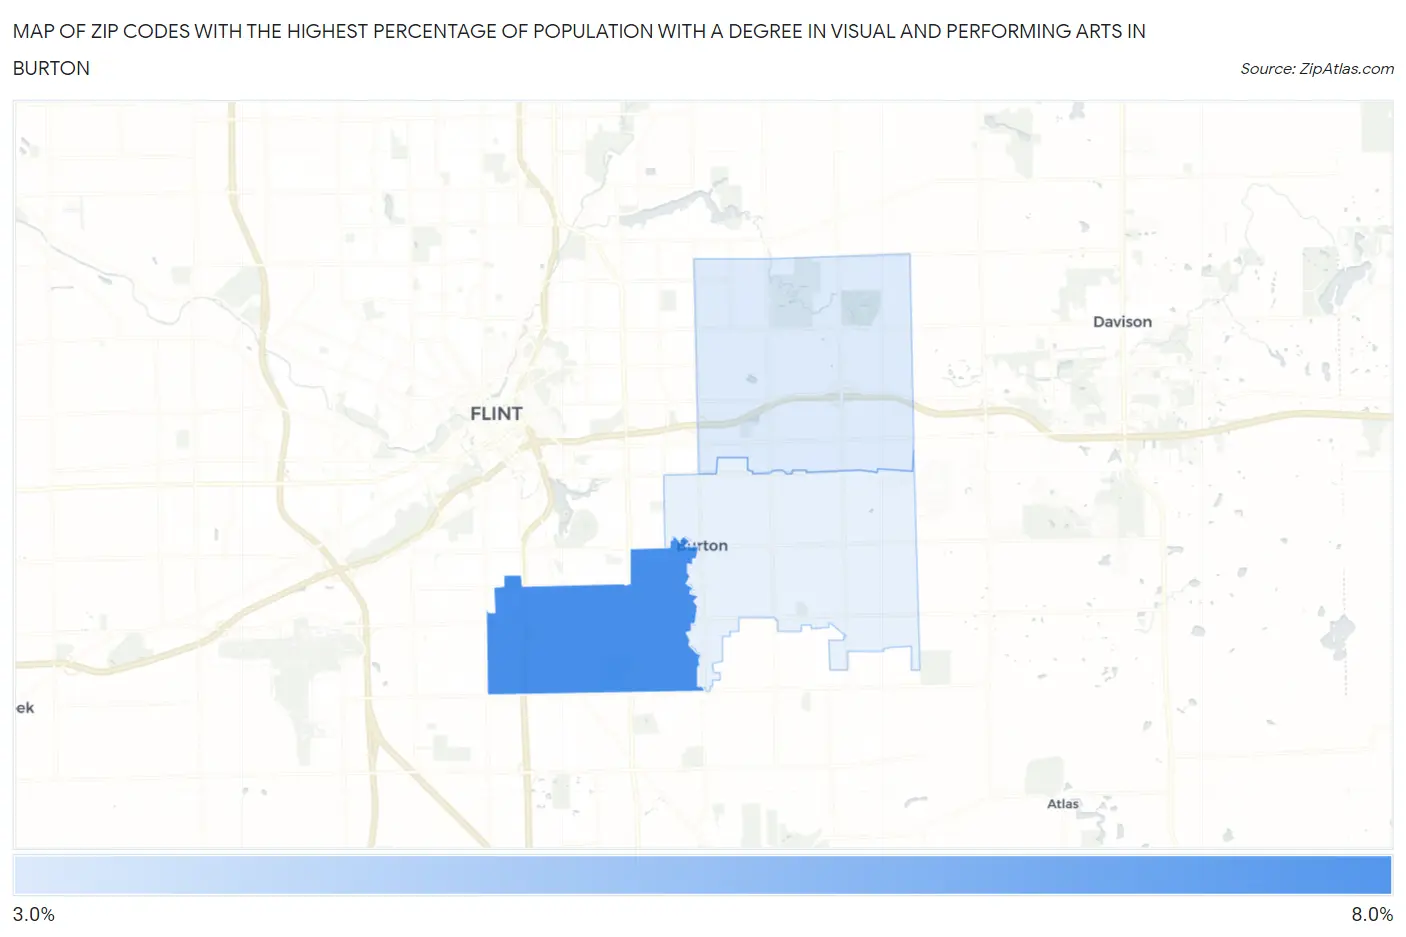
Map of Zip Codes with the Highest Percentage of Population with a Degree in Visual and Performing Arts in Burton
3.9%
7.2%
Zip Codes with the Highest Percentage of Population with a Degree in Visual and Performing Arts in Burton, MI
| Zip Code | % Graduates | vs State | vs National | |
| 1. | 48529 | 7.2% | 3.4%(+3.76)#79 | 4.3%(+2.91)#3,491 |
| 2. | 48509 | 3.9% | 3.4%(+0.482)#254 | 4.3%(-0.368)#9,620 |
1
Common Questions
What are the Top Zip Codes with the Highest Percentage of Population with a Degree in Visual and Performing Arts in Burton, MI?
Top Zip Codes with the Highest Percentage of Population with a Degree in Visual and Performing Arts in Burton, MI are:
What zip code has the Highest Percentage of Population with a Degree in Visual and Performing Arts in Burton, MI?
48529 has the Highest Percentage of Population with a Degree in Visual and Performing Arts in Burton, MI with 7.2%.
What is the Percentage of Population with a Degree in Visual and Performing Arts in Burton, MI?
Percentage of Population with a Degree in Visual and Performing Arts in Burton is 2.9%.
What is the Percentage of Population with a Degree in Visual and Performing Arts in Michigan?
Percentage of Population with a Degree in Visual and Performing Arts in Michigan is 3.4%.
What is the Percentage of Population with a Degree in Visual and Performing Arts in the United States?
Percentage of Population with a Degree in Visual and Performing Arts in the United States is 4.3%.