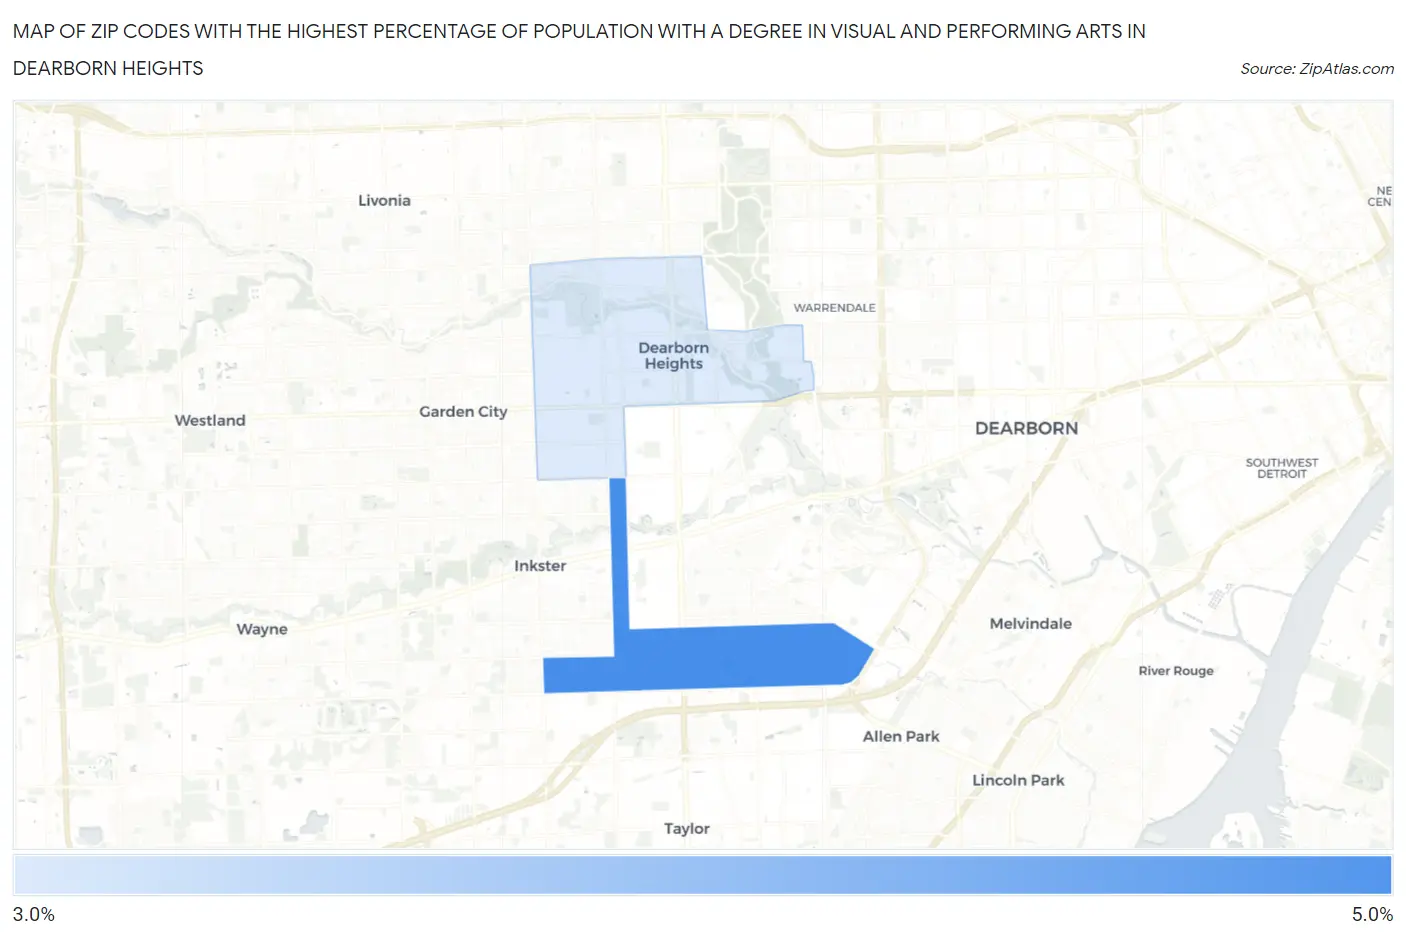
Zip Codes with the Highest Percentage of Population with a Degree in Visual and Performing Arts in Dearborn Heights, MI
RELATED REPORTS & OPTIONS
Visual and Performing Arts
Dearborn Heights
Compare Zip Codes
Map of Zip Codes with the Highest Percentage of Population with a Degree in Visual and Performing Arts in Dearborn Heights
3.8%
4.1%
Zip Codes with the Highest Percentage of Population with a Degree in Visual and Performing Arts in Dearborn Heights, MI
| Zip Code | % Graduates | vs State | vs National | |
| 1. | 48125 | 4.1% | 3.4%(+0.747)#230 | 4.3%(-0.103)#8,769 |
| 2. | 48127 | 3.8% | 3.4%(+0.440)#261 | 4.3%(-0.410)#9,763 |
1
Common Questions
What are the Top Zip Codes with the Highest Percentage of Population with a Degree in Visual and Performing Arts in Dearborn Heights, MI?
Top Zip Codes with the Highest Percentage of Population with a Degree in Visual and Performing Arts in Dearborn Heights, MI are:
What zip code has the Highest Percentage of Population with a Degree in Visual and Performing Arts in Dearborn Heights, MI?
48125 has the Highest Percentage of Population with a Degree in Visual and Performing Arts in Dearborn Heights, MI with 4.1%.
What is the Percentage of Population with a Degree in Visual and Performing Arts in Dearborn Heights, MI?
Percentage of Population with a Degree in Visual and Performing Arts in Dearborn Heights is 3.9%.
What is the Percentage of Population with a Degree in Visual and Performing Arts in Michigan?
Percentage of Population with a Degree in Visual and Performing Arts in Michigan is 3.4%.
What is the Percentage of Population with a Degree in Visual and Performing Arts in the United States?
Percentage of Population with a Degree in Visual and Performing Arts in the United States is 4.3%.