Zip Codes with the Highest Percentage of Population with a Degree in Visual and Performing Arts in Howell, MI
RELATED REPORTS & OPTIONS
Visual and Performing Arts
Howell
Compare Zip Codes
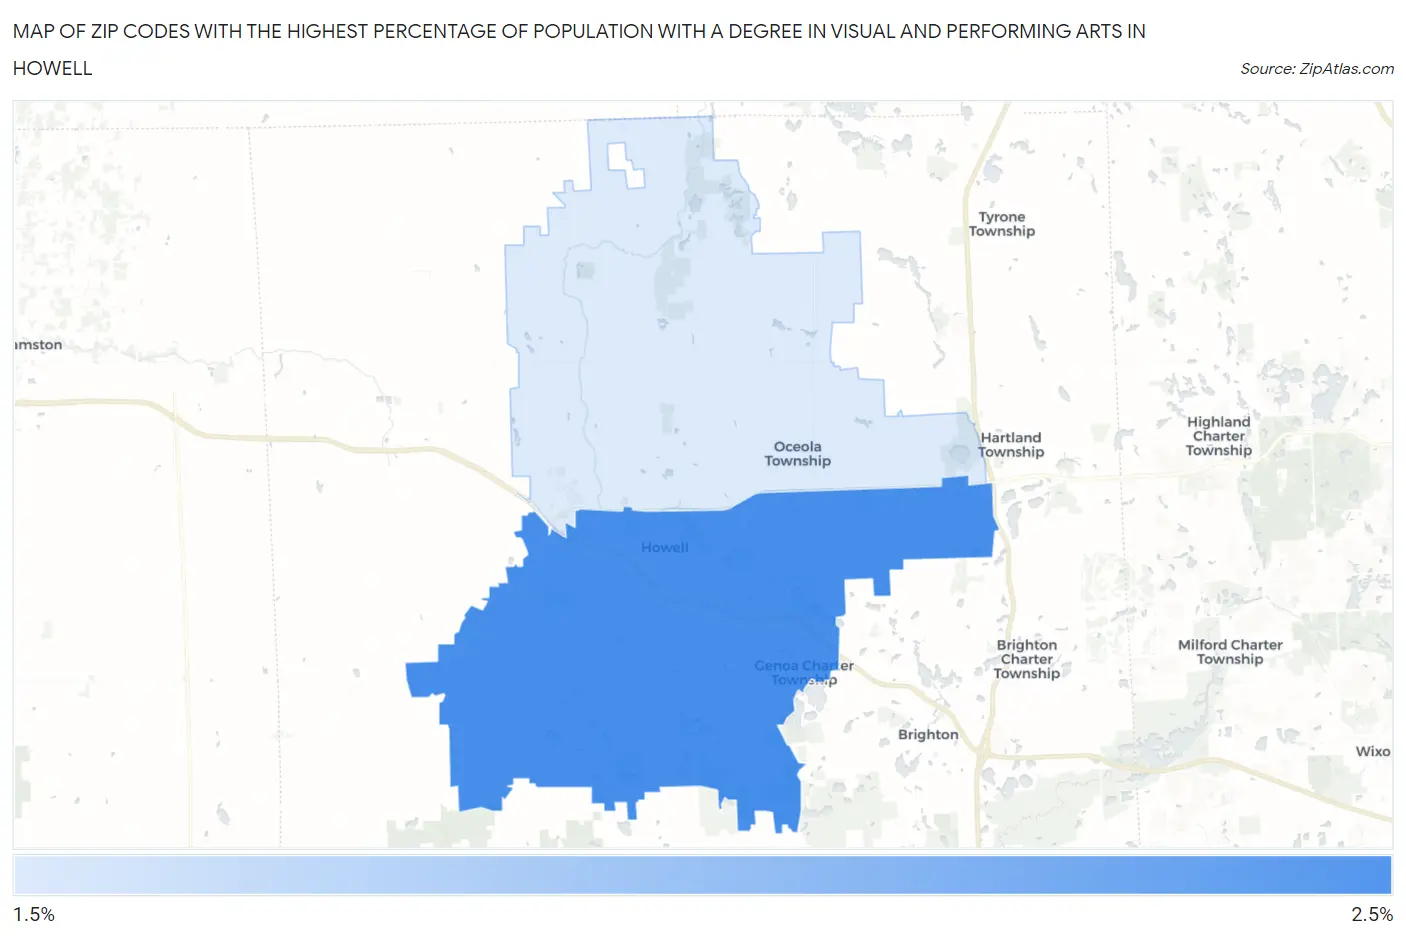
Map of Zip Codes with the Highest Percentage of Population with a Degree in Visual and Performing Arts in Howell
2.4%
2.4%
Zip Codes with the Highest Percentage of Population with a Degree in Visual and Performing Arts in Howell, MI
| Zip Code | % Graduates | vs State | vs National | |
| 1. | 48843 | 2.4% | 3.4%(-1.03)#474 | 4.3%(-1.88)#15,098 |
| 2. | 48855 | 2.4% | 3.4%(-1.05)#479 | 4.3%(-1.90)#15,164 |
1
Common Questions
What are the Top Zip Codes with the Highest Percentage of Population with a Degree in Visual and Performing Arts in Howell, MI?
Top Zip Codes with the Highest Percentage of Population with a Degree in Visual and Performing Arts in Howell, MI are:
What zip code has the Highest Percentage of Population with a Degree in Visual and Performing Arts in Howell, MI?
48843 has the Highest Percentage of Population with a Degree in Visual and Performing Arts in Howell, MI with 2.4%.
What is the Percentage of Population with a Degree in Visual and Performing Arts in Howell, MI?
Percentage of Population with a Degree in Visual and Performing Arts in Howell is 3.4%.
What is the Percentage of Population with a Degree in Visual and Performing Arts in Michigan?
Percentage of Population with a Degree in Visual and Performing Arts in Michigan is 3.4%.
What is the Percentage of Population with a Degree in Visual and Performing Arts in the United States?
Percentage of Population with a Degree in Visual and Performing Arts in the United States is 4.3%.