Zip Codes with the Highest Percentage of Population with a Degree in Visual and Performing Arts in Macomb, MI
RELATED REPORTS & OPTIONS
Visual and Performing Arts
Macomb
Compare Zip Codes
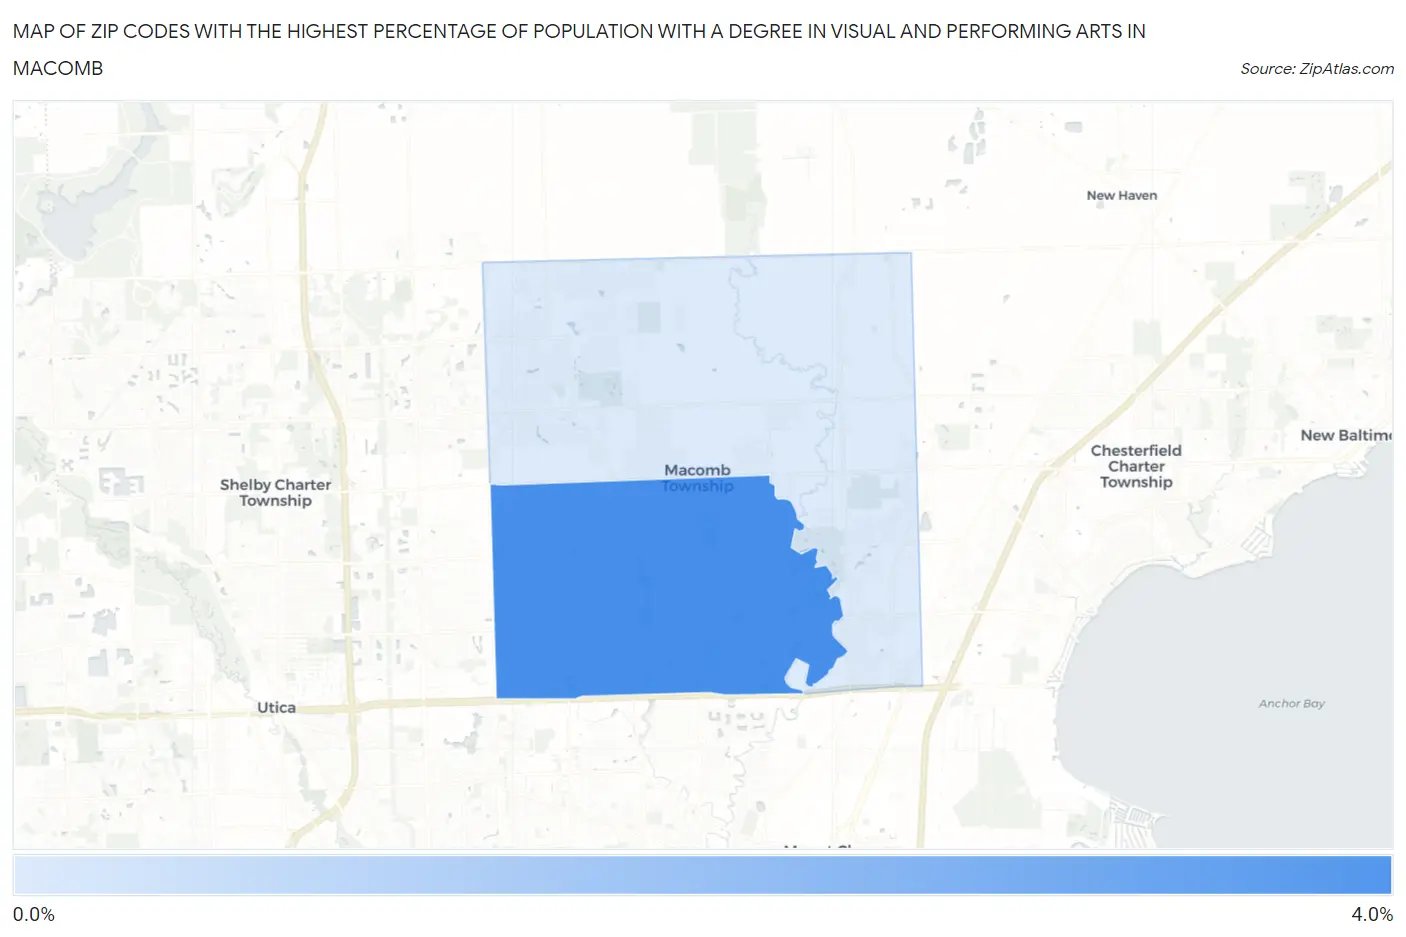
Map of Zip Codes with the Highest Percentage of Population with a Degree in Visual and Performing Arts in Macomb
0.88%
3.8%
Zip Codes with the Highest Percentage of Population with a Degree in Visual and Performing Arts in Macomb, MI
| Zip Code | % Graduates | vs State | vs National | |
| 1. | 48044 | 3.8% | 3.4%(+0.417)#263 | 4.3%(-0.433)#9,809 |
| 2. | 48042 | 0.88% | 3.4%(-2.52)#714 | 4.3%(-3.37)#19,975 |
1
Common Questions
What are the Top Zip Codes with the Highest Percentage of Population with a Degree in Visual and Performing Arts in Macomb, MI?
Top Zip Codes with the Highest Percentage of Population with a Degree in Visual and Performing Arts in Macomb, MI are:
What zip code has the Highest Percentage of Population with a Degree in Visual and Performing Arts in Macomb, MI?
48044 has the Highest Percentage of Population with a Degree in Visual and Performing Arts in Macomb, MI with 3.8%.
What is the Percentage of Population with a Degree in Visual and Performing Arts in Michigan?
Percentage of Population with a Degree in Visual and Performing Arts in Michigan is 3.4%.
What is the Percentage of Population with a Degree in Visual and Performing Arts in the United States?
Percentage of Population with a Degree in Visual and Performing Arts in the United States is 4.3%.