Zip Codes with the Highest Percentage of Population with a Degree in Visual and Performing Arts in Utica, MI
RELATED REPORTS & OPTIONS
Visual and Performing Arts
Utica
Compare Zip Codes
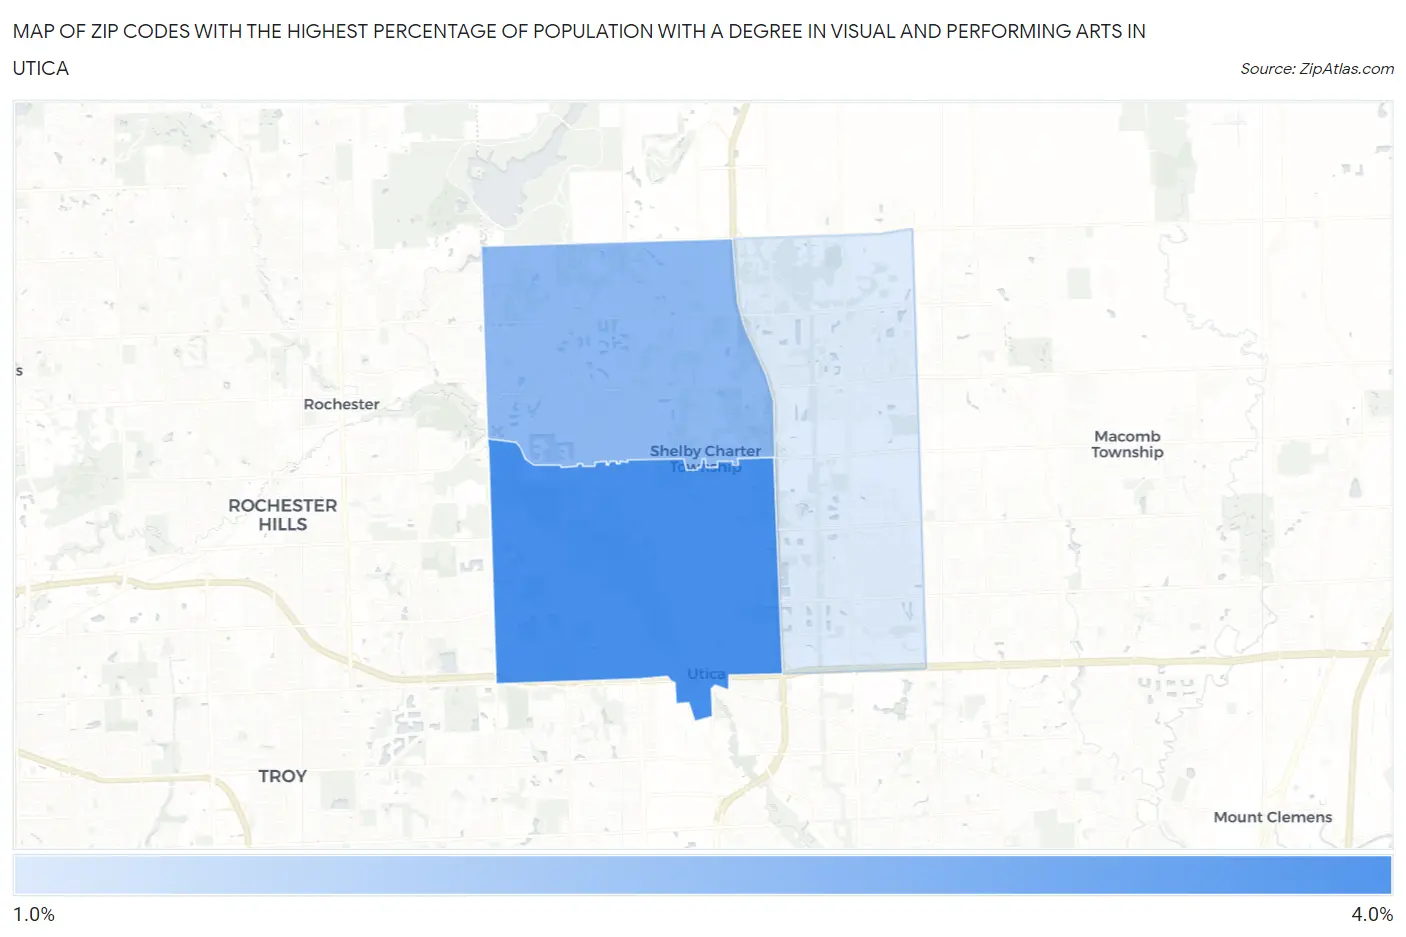
Map of Zip Codes with the Highest Percentage of Population with a Degree in Visual and Performing Arts in Utica
1.3%
3.1%
Zip Codes with the Highest Percentage of Population with a Degree in Visual and Performing Arts in Utica, MI
| Zip Code | % Graduates | vs State | vs National | |
| 1. | 48317 | 3.1% | 3.4%(-0.256)#352 | 4.3%(-1.11)#12,178 |
| 2. | 48316 | 2.3% | 3.4%(-1.09)#494 | 4.3%(-1.94)#15,325 |
| 3. | 48315 | 1.3% | 3.4%(-2.08)#657 | 4.3%(-2.93)#18,680 |
1
Common Questions
What are the Top Zip Codes with the Highest Percentage of Population with a Degree in Visual and Performing Arts in Utica, MI?
Top Zip Codes with the Highest Percentage of Population with a Degree in Visual and Performing Arts in Utica, MI are:
What zip code has the Highest Percentage of Population with a Degree in Visual and Performing Arts in Utica, MI?
48317 has the Highest Percentage of Population with a Degree in Visual and Performing Arts in Utica, MI with 3.1%.
What is the Percentage of Population with a Degree in Visual and Performing Arts in Utica, MI?
Percentage of Population with a Degree in Visual and Performing Arts in Utica is 5.5%.
What is the Percentage of Population with a Degree in Visual and Performing Arts in Michigan?
Percentage of Population with a Degree in Visual and Performing Arts in Michigan is 3.4%.
What is the Percentage of Population with a Degree in Visual and Performing Arts in the United States?
Percentage of Population with a Degree in Visual and Performing Arts in the United States is 4.3%.