Zip Codes with the Highest Percentage of Families with Income Above $100,000 in Bay City, MI
RELATED REPORTS & OPTIONS
Family Income | $100k+
Bay City
Compare Zip Codes
Map of Zip Codes with the Highest Percentage of Families with Income Above $100,000 in Bay City
27.4%
32.4%
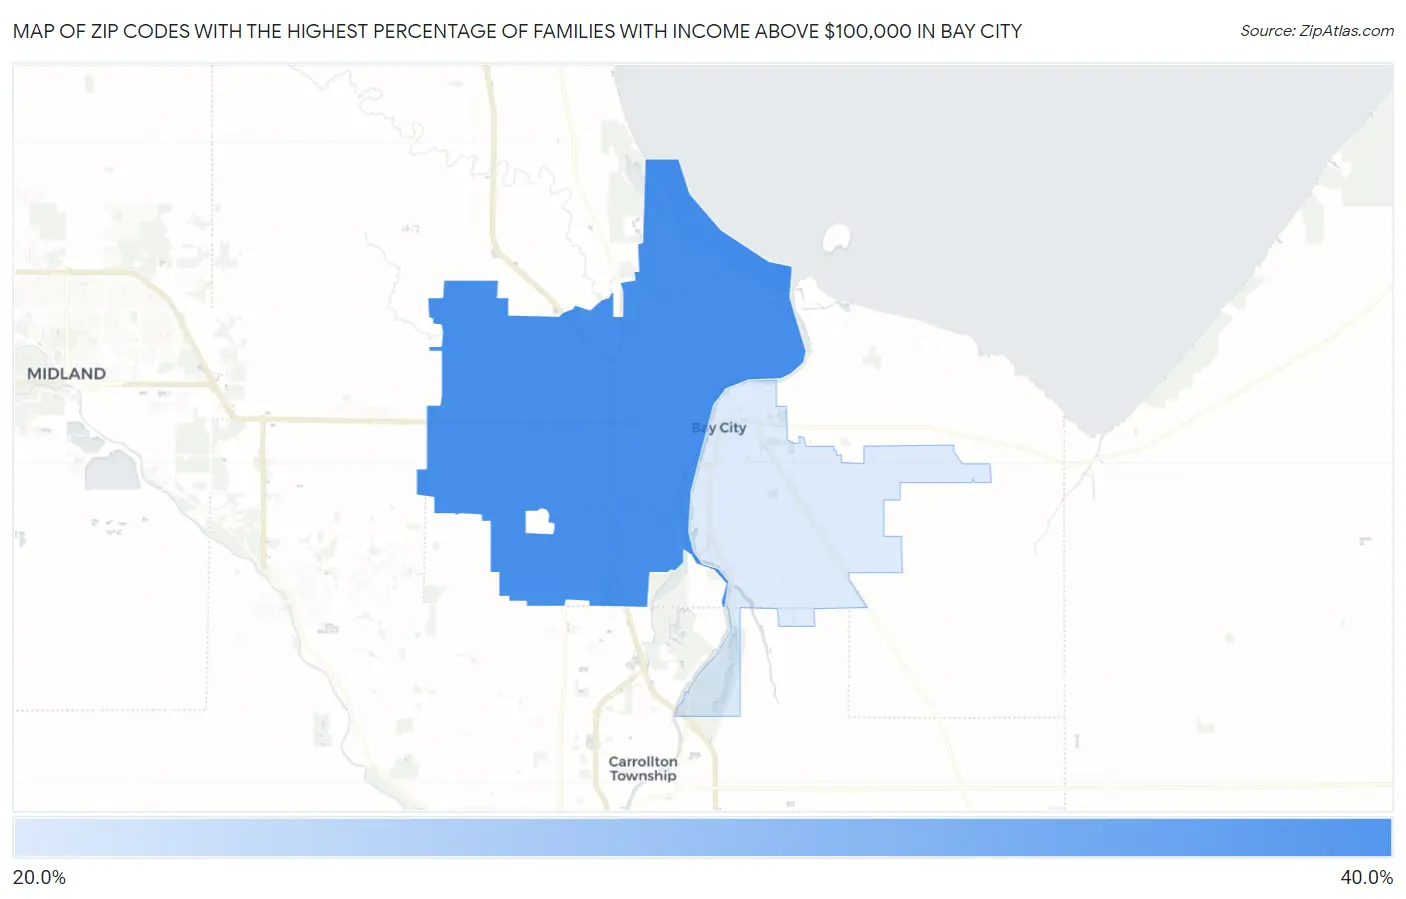
Zip Codes with the Highest Percentage of Families with Income Above $100,000 in Bay City, MI
| Zip Code | Families with Income > $100k | vs State | vs National | |
| 1. | 48706 | 32.4% | 42.6%(-10.2)#551 | 46.1%(-13.7)#19,728 |
| 2. | 48708 | 27.4% | 42.6%(-15.2)#692 | 46.1%(-18.7)#23,162 |
1
Common Questions
What are the Top Zip Codes with the Highest Percentage of Families with Income Above $100,000 in Bay City, MI?
Top Zip Codes with the Highest Percentage of Families with Income Above $100,000 in Bay City, MI are:
What zip code has the Highest Percentage of Families with Income Above $100,000 in Bay City, MI?
48706 has the Highest Percentage of Families with Income Above $100,000 in Bay City, MI with 32.4%.
What is the Percentage of Families with Income Above $100,000 in Bay City, MI?
Percentage of Families with Income Above $100,000 in Bay City is 21.9%.
What is the Percentage of Families with Income Above $100,000 in Michigan?
Percentage of Families with Income Above $100,000 in Michigan is 42.6%.
What is the Percentage of Families with Income Above $100,000 in the United States?
Percentage of Families with Income Above $100,000 in the United States is 46.1%.