Zip Codes with the Highest Percentage of Population Employed in Life, Physical & Social Science in Battle Creek, MI
RELATED REPORTS & OPTIONS
Life, Physical & Social Science
Battle Creek
Compare Zip Codes
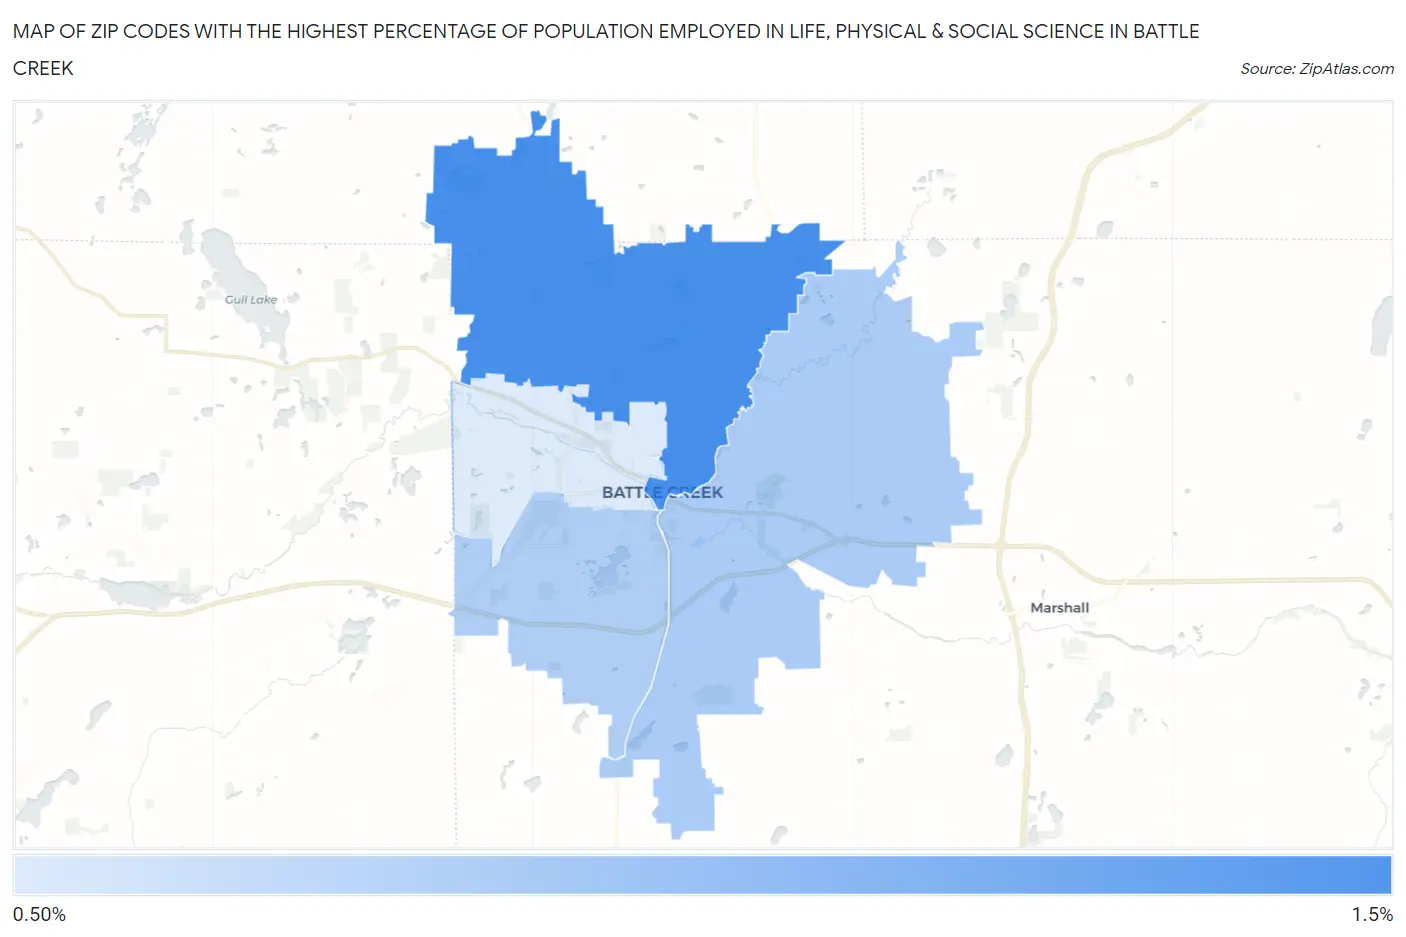
Map of Zip Codes with the Highest Percentage of Population Employed in Life, Physical & Social Science in Battle Creek
0.64%
1.1%
Zip Codes with the Highest Percentage of Population Employed in Life, Physical & Social Science in Battle Creek, MI
| Zip Code | % Employed | vs State | vs National | |
| 1. | 49017 | 1.1% | 0.88%(+0.193)#210 | 1.1%(-0.014)#8,414 |
| 2. | 49014 | 0.79% | 0.88%(-0.096)#313 | 1.1%(-0.303)#11,116 |
| 3. | 49015 | 0.78% | 0.88%(-0.105)#316 | 1.1%(-0.312)#11,193 |
| 4. | 49037 | 0.64% | 0.88%(-0.240)#372 | 1.1%(-0.447)#12,721 |
1
Common Questions
What are the Top 3 Zip Codes with the Highest Percentage of Population Employed in Life, Physical & Social Science in Battle Creek, MI?
Top 3 Zip Codes with the Highest Percentage of Population Employed in Life, Physical & Social Science in Battle Creek, MI are:
What zip code has the Highest Percentage of Population Employed in Life, Physical & Social Science in Battle Creek, MI?
49017 has the Highest Percentage of Population Employed in Life, Physical & Social Science in Battle Creek, MI with 1.1%.
What is the Percentage of Population Employed in Life, Physical & Social Science in Battle Creek, MI?
Percentage of Population Employed in Life, Physical & Social Science in Battle Creek is 0.61%.
What is the Percentage of Population Employed in Life, Physical & Social Science in Michigan?
Percentage of Population Employed in Life, Physical & Social Science in Michigan is 0.88%.
What is the Percentage of Population Employed in Life, Physical & Social Science in the United States?
Percentage of Population Employed in Life, Physical & Social Science in the United States is 1.1%.