Zip Codes with the Highest Percentage of Population Employed in Life, Physical & Social Science in Northville, MI
RELATED REPORTS & OPTIONS
Life, Physical & Social Science
Northville
Compare Zip Codes
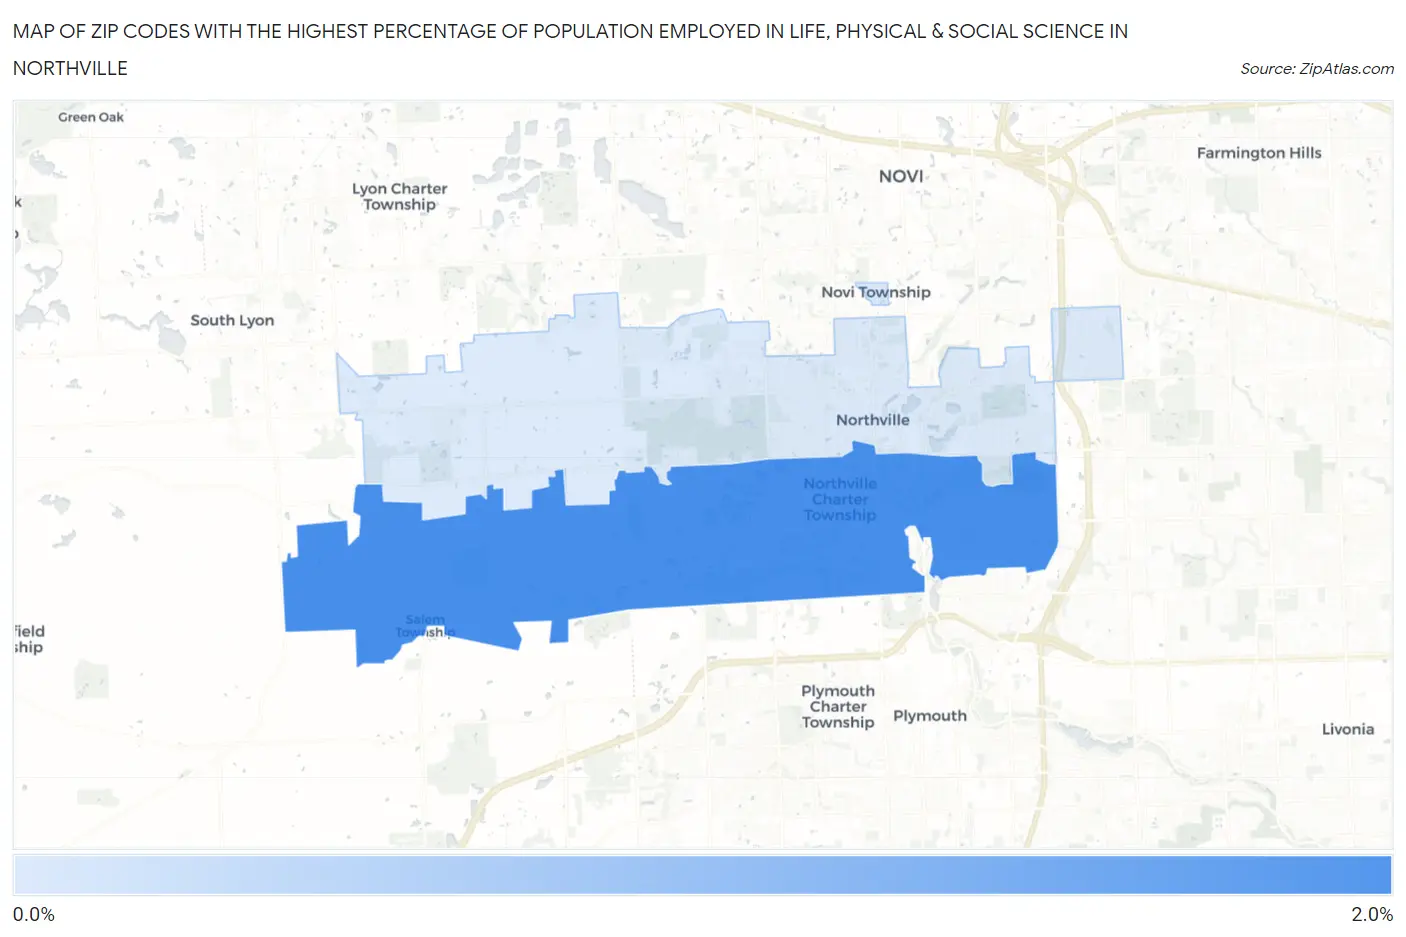
Map of Zip Codes with the Highest Percentage of Population Employed in Life, Physical & Social Science in Northville
0.67%
1.5%
Zip Codes with the Highest Percentage of Population Employed in Life, Physical & Social Science in Northville, MI
| Zip Code | % Employed | vs State | vs National | |
| 1. | 48168 | 1.5% | 0.88%(+0.646)#117 | 1.1%(+0.439)#5,497 |
| 2. | 48167 | 0.67% | 0.88%(-0.211)#362 | 1.1%(-0.418)#12,373 |
1
Common Questions
What are the Top Zip Codes with the Highest Percentage of Population Employed in Life, Physical & Social Science in Northville, MI?
Top Zip Codes with the Highest Percentage of Population Employed in Life, Physical & Social Science in Northville, MI are:
What zip code has the Highest Percentage of Population Employed in Life, Physical & Social Science in Northville, MI?
48168 has the Highest Percentage of Population Employed in Life, Physical & Social Science in Northville, MI with 1.5%.
What is the Percentage of Population Employed in Life, Physical & Social Science in Northville, MI?
Percentage of Population Employed in Life, Physical & Social Science in Northville is 0.52%.
What is the Percentage of Population Employed in Life, Physical & Social Science in Michigan?
Percentage of Population Employed in Life, Physical & Social Science in Michigan is 0.88%.
What is the Percentage of Population Employed in Life, Physical & Social Science in the United States?
Percentage of Population Employed in Life, Physical & Social Science in the United States is 1.1%.