Edgemont Park, MI Map & Demographics
Edgemont Park Map
Edgemont Park Overview
$29,977
PER CAPITA INCOME
$78,125
AVG FAMILY INCOME
$61,042
AVG HOUSEHOLD INCOME
43.6%
WAGE / INCOME GAP [ % ]
56.4¢/ $1
WAGE / INCOME GAP [ $ ]
0.40
INEQUALITY / GINI INDEX
2,444
TOTAL POPULATION
1,175
MALE POPULATION
1,269
FEMALE POPULATION
92.59
MALES / 100 FEMALES
108.00
FEMALES / 100 MALES
38.7
MEDIAN AGE
3.5
AVG FAMILY SIZE
2.2
AVG HOUSEHOLD SIZE
1,368
LABOR FORCE [ PEOPLE ]
66.6%
PERCENT IN LABOR FORCE
6.9%
UNEMPLOYMENT RATE
Income in Edgemont Park
Income Overview in Edgemont Park
Per Capita Income in Edgemont Park is $29,977, while median incomes of families and households are $78,125 and $61,042 respectively.
| Characteristic | Number | Measure |
| Per Capita Income | 2,444 | $29,977 |
| Median Family Income | 529 | $78,125 |
| Mean Family Income | 529 | $92,161 |
| Median Household Income | 1,082 | $61,042 |
| Mean Household Income | 1,082 | $65,529 |
| Income Deficit | 529 | $0 |
| Wage / Income Gap (%) | 2,444 | 43.62% |
| Wage / Income Gap ($) | 2,444 | 56.38¢ per $1 |
| Gini / Inequality Index | 2,444 | 0.40 |
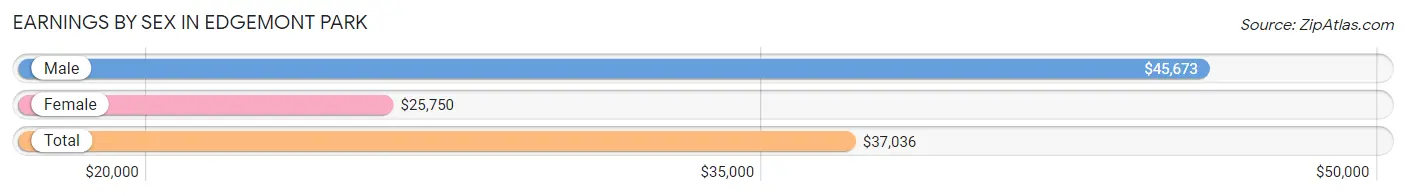
Earnings by Sex in Edgemont Park
Average Earnings in Edgemont Park are $37,036, $45,673 for men and $25,750 for women, a difference of 43.6%.
| Sex | Number | Average Earnings |
| Male | 591 (41.2%) | $45,673 |
| Female | 844 (58.8%) | $25,750 |
| Total | 1,435 (100.0%) | $37,036 |
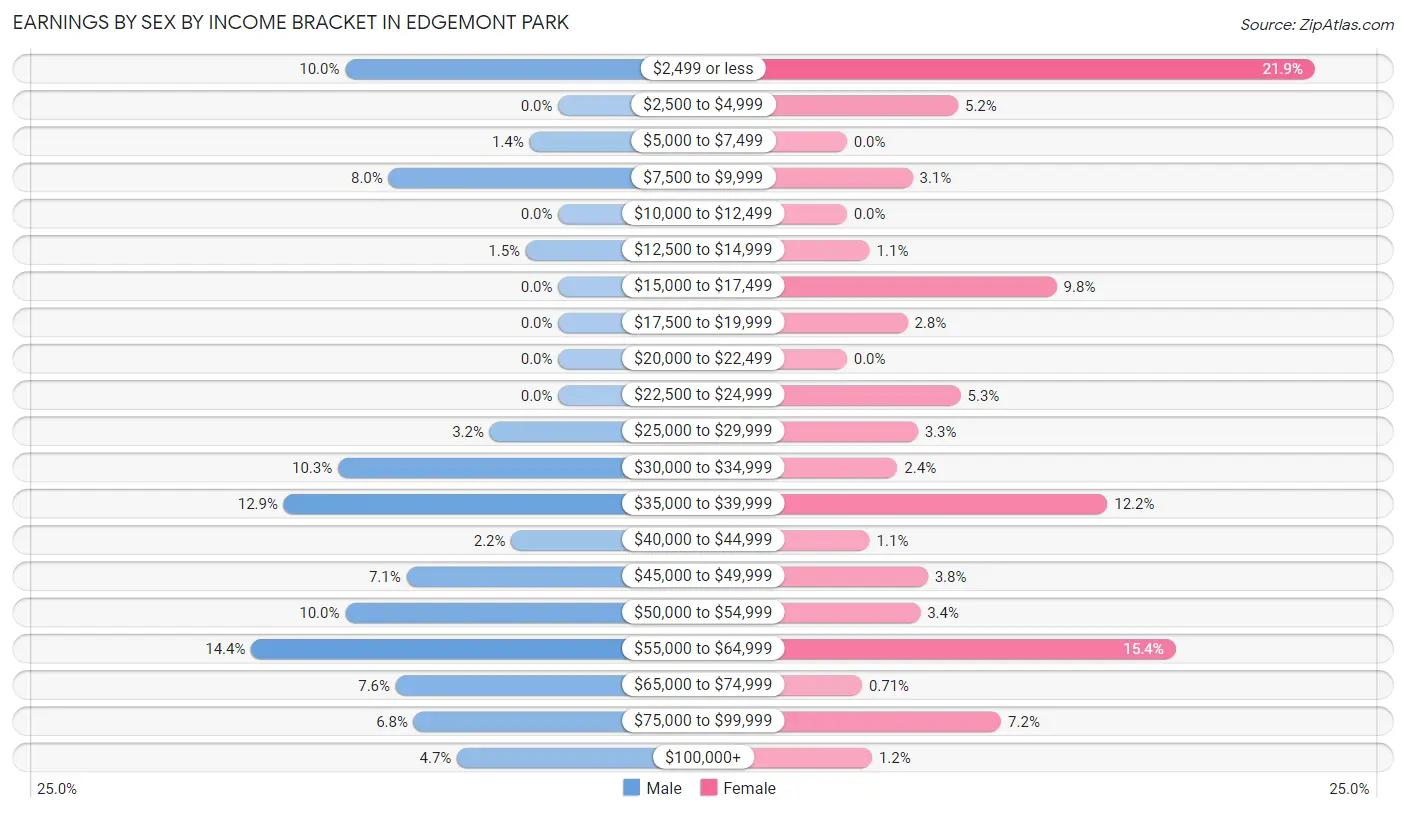
Earnings by Sex by Income Bracket in Edgemont Park
The most common earnings brackets in Edgemont Park are $55,000 to $64,999 for men (85 | 14.4%) and $2,499 or less for women (185 | 21.9%).
| Income | Male | Female |
| $2,499 or less | 59 (10.0%) | 185 (21.9%) |
| $2,500 to $4,999 | 0 (0.0%) | 44 (5.2%) |
| $5,000 to $7,499 | 8 (1.3%) | 0 (0.0%) |
| $7,500 to $9,999 | 47 (8.0%) | 26 (3.1%) |
| $10,000 to $12,499 | 0 (0.0%) | 0 (0.0%) |
| $12,500 to $14,999 | 9 (1.5%) | 9 (1.1%) |
| $15,000 to $17,499 | 0 (0.0%) | 83 (9.8%) |
| $17,500 to $19,999 | 0 (0.0%) | 24 (2.8%) |
| $20,000 to $22,499 | 0 (0.0%) | 0 (0.0%) |
| $22,500 to $24,999 | 0 (0.0%) | 45 (5.3%) |
| $25,000 to $29,999 | 19 (3.2%) | 28 (3.3%) |
| $30,000 to $34,999 | 61 (10.3%) | 20 (2.4%) |
| $35,000 to $39,999 | 76 (12.9%) | 103 (12.2%) |
| $40,000 to $44,999 | 13 (2.2%) | 9 (1.1%) |
| $45,000 to $49,999 | 42 (7.1%) | 32 (3.8%) |
| $50,000 to $54,999 | 59 (10.0%) | 29 (3.4%) |
| $55,000 to $64,999 | 85 (14.4%) | 130 (15.4%) |
| $65,000 to $74,999 | 45 (7.6%) | 6 (0.7%) |
| $75,000 to $99,999 | 40 (6.8%) | 61 (7.2%) |
| $100,000+ | 28 (4.7%) | 10 (1.2%) |
| Total | 591 (100.0%) | 844 (100.0%) |
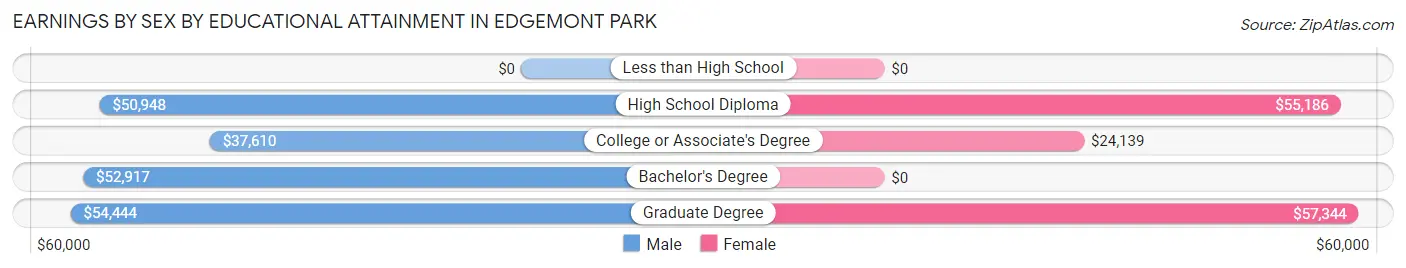
Earnings by Sex by Educational Attainment in Edgemont Park
Average earnings in Edgemont Park are $48,276 for men and $38,750 for women, a difference of 19.7%. Men with an educational attainment of graduate degree enjoy the highest average annual earnings of $54,444, while those with college or associate's degree education earn the least with $37,610. Women with an educational attainment of graduate degree earn the most with the average annual earnings of $57,344, while those with college or associate's degree education have the smallest earnings of $24,139.
| Educational Attainment | Male Income | Female Income |
| Less than High School | - | - |
| High School Diploma | $50,948 | $55,186 |
| College or Associate's Degree | $37,610 | $24,139 |
| Bachelor's Degree | $52,917 | $0 |
| Graduate Degree | $54,444 | $57,344 |
| Total | $48,276 | $38,750 |
Family Income in Edgemont Park
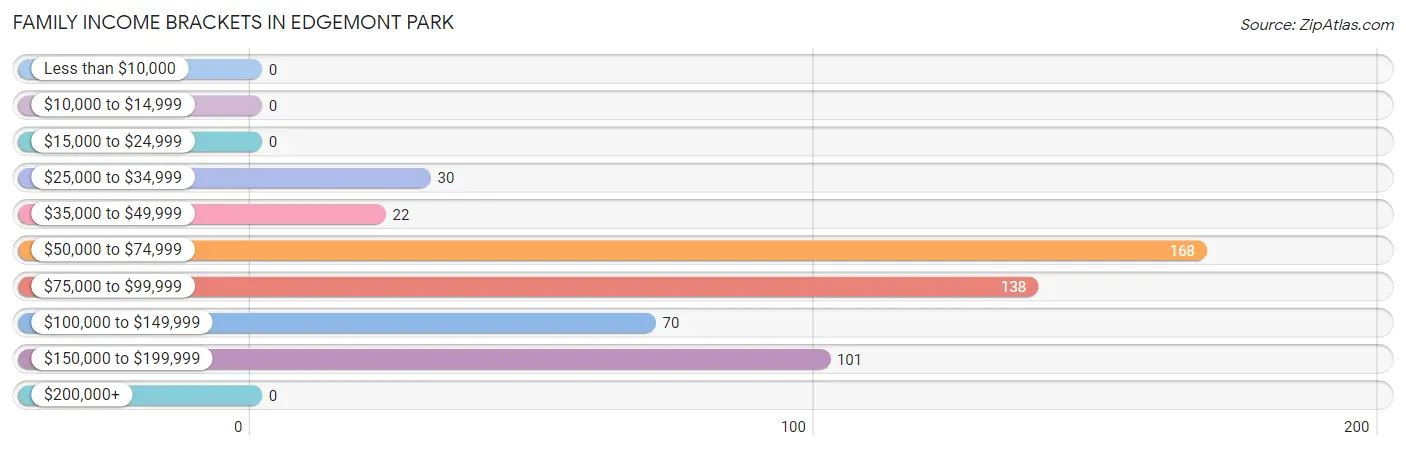
Family Income Brackets in Edgemont Park
According to the Edgemont Park family income data, there are 168 families falling into the $50,000 to $74,999 income range, which is the most common income bracket and makes up 31.8% of all families.
| Income Bracket | # Families | % Families |
| Less than $10,000 | 0 | 0.0% |
| $10,000 to $14,999 | 0 | 0.0% |
| $15,000 to $24,999 | 0 | 0.0% |
| $25,000 to $34,999 | 30 | 5.7% |
| $35,000 to $49,999 | 22 | 4.2% |
| $50,000 to $74,999 | 168 | 31.8% |
| $75,000 to $99,999 | 138 | 26.1% |
| $100,000 to $149,999 | 70 | 13.2% |
| $150,000 to $199,999 | 101 | 19.1% |
| $200,000+ | 0 | 0.0% |
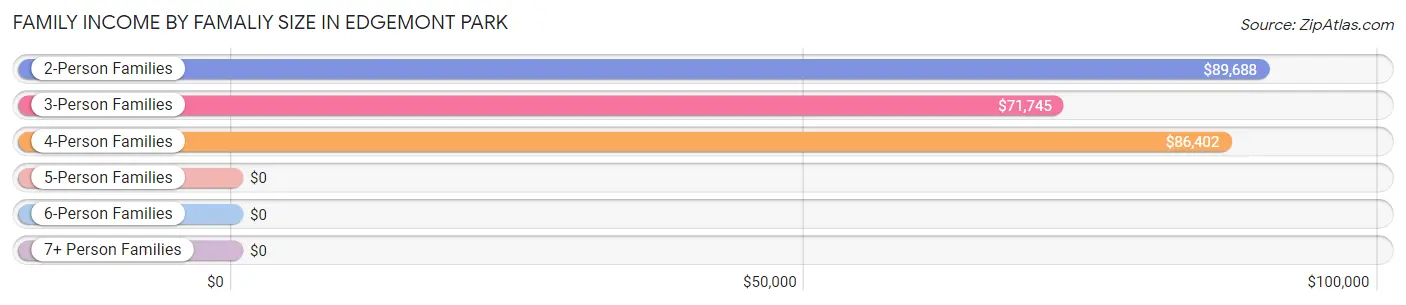
Family Income by Famaliy Size in Edgemont Park
2-person families (202 | 38.2%) account for the highest median family income in Edgemont Park with $89,688 per family, while 2-person families (202 | 38.2%) have the highest median income of $44,844 per family member.
| Income Bracket | # Families | Median Income |
| 2-Person Families | 202 (38.2%) | $89,688 |
| 3-Person Families | 195 (36.9%) | $71,745 |
| 4-Person Families | 92 (17.4%) | $86,402 |
| 5-Person Families | 7 (1.3%) | $0 |
| 6-Person Families | 33 (6.2%) | $0 |
| 7+ Person Families | 0 (0.0%) | $0 |
| Total | 529 (100.0%) | $78,125 |
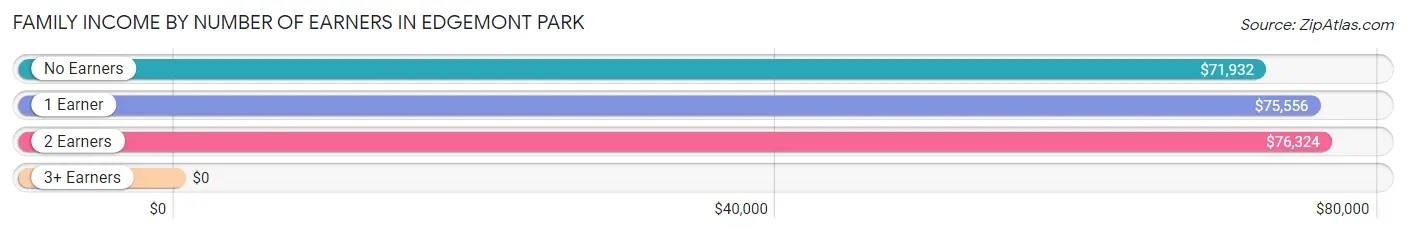
Family Income by Number of Earners in Edgemont Park
| Number of Earners | # Families | Median Income |
| No Earners | 71 (13.4%) | $71,932 |
| 1 Earner | 116 (21.9%) | $75,556 |
| 2 Earners | 274 (51.8%) | $76,324 |
| 3+ Earners | 68 (12.9%) | $0 |
| Total | 529 (100.0%) | $78,125 |
Household Income in Edgemont Park
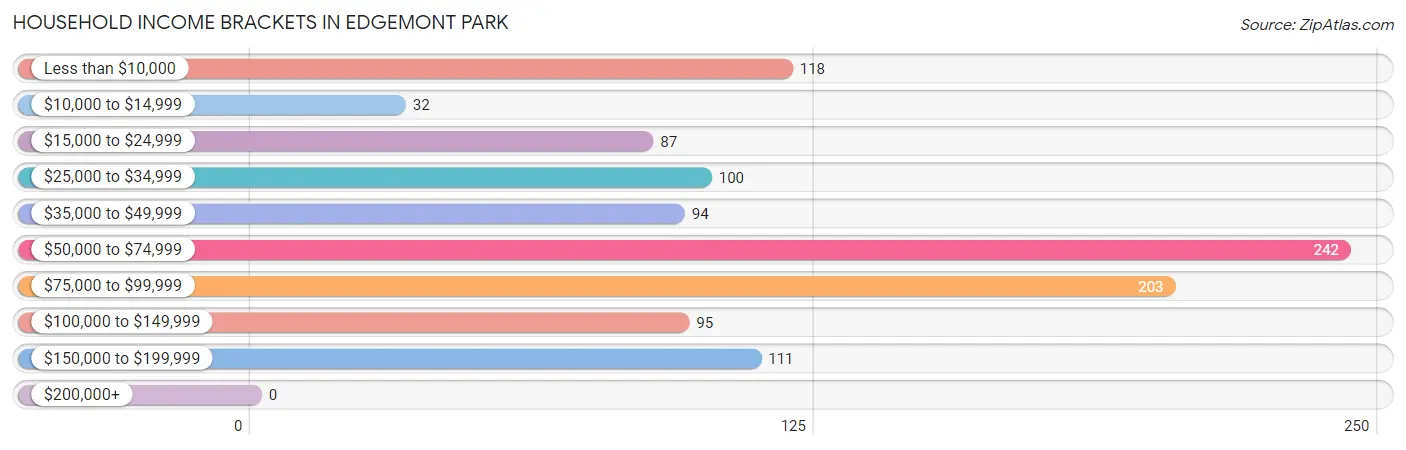
Household Income Brackets in Edgemont Park
With 242 households falling in the category, the $50,000 to $74,999 income range is the most frequent in Edgemont Park, accounting for 22.4% of all households.
| Income Bracket | # Households | % Households |
| Less than $10,000 | 118 | 10.9% |
| $10,000 to $14,999 | 32 | 3.0% |
| $15,000 to $24,999 | 87 | 8.0% |
| $25,000 to $34,999 | 100 | 9.2% |
| $35,000 to $49,999 | 94 | 8.7% |
| $50,000 to $74,999 | 242 | 22.4% |
| $75,000 to $99,999 | 203 | 18.8% |
| $100,000 to $149,999 | 95 | 8.8% |
| $150,000 to $199,999 | 111 | 10.3% |
| $200,000+ | 0 | 0.0% |
Household Income by Householder Age in Edgemont Park
The median household income in Edgemont Park is $61,042, with the highest median household income of $70,996 found in the 65+ years age bracket for the primary householder. A total of 271 households (25.1%) fall into this category.
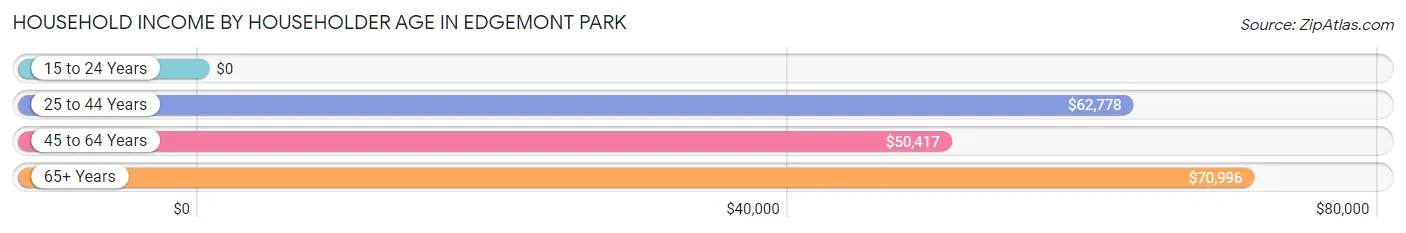
| Income Bracket | # Households | Median Income |
| 15 to 24 Years | 0 (0.0%) | $0 |
| 25 to 44 Years | 350 (32.4%) | $62,778 |
| 45 to 64 Years | 461 (42.6%) | $50,417 |
| 65+ Years | 271 (25.1%) | $70,996 |
| Total | 1,082 (100.0%) | $61,042 |
Poverty in Edgemont Park
Income Below Poverty by Sex and Age in Edgemont Park
With 12.9% poverty level for males and 3.2% for females among the residents of Edgemont Park, 45 to 54 year old males and 55 to 64 year old females are the most vulnerable to poverty, with 69 males (53.9%) and 40 females (16.7%) in their respective age groups living below the poverty level.
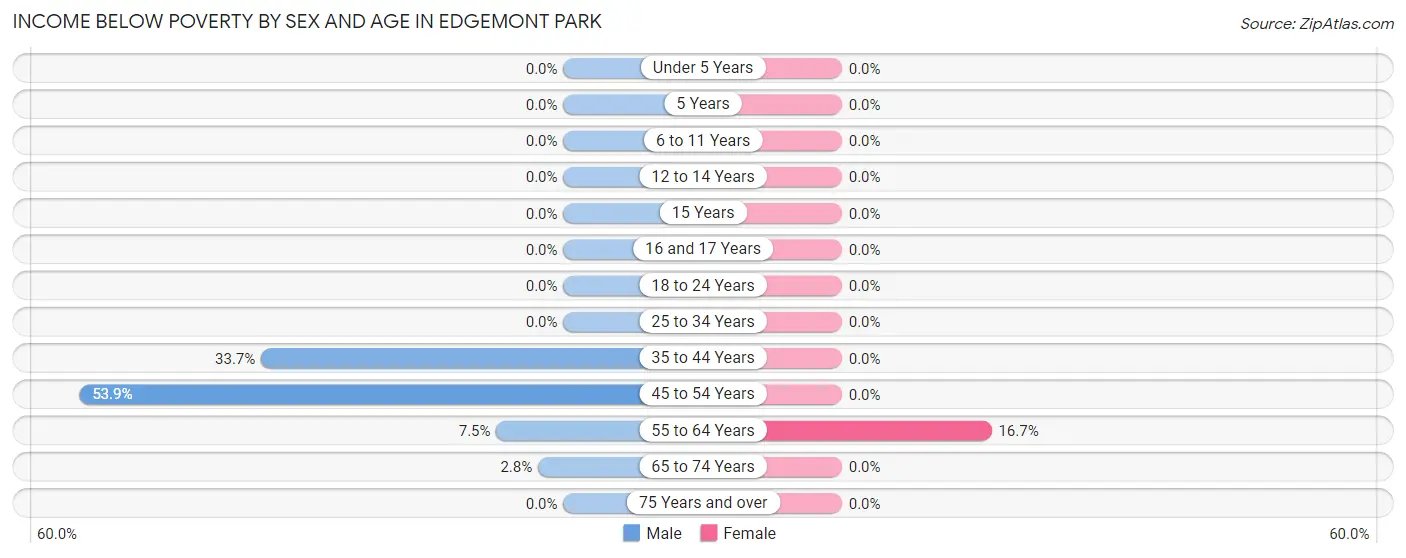
| Age Bracket | Male | Female |
| Under 5 Years | 0 (0.0%) | 0 (0.0%) |
| 5 Years | 0 (0.0%) | 0 (0.0%) |
| 6 to 11 Years | 0 (0.0%) | 0 (0.0%) |
| 12 to 14 Years | 0 (0.0%) | 0 (0.0%) |
| 15 Years | 0 (0.0%) | 0 (0.0%) |
| 16 and 17 Years | 0 (0.0%) | 0 (0.0%) |
| 18 to 24 Years | 0 (0.0%) | 0 (0.0%) |
| 25 to 34 Years | 0 (0.0%) | 0 (0.0%) |
| 35 to 44 Years | 68 (33.7%) | 0 (0.0%) |
| 45 to 54 Years | 69 (53.9%) | 0 (0.0%) |
| 55 to 64 Years | 10 (7.5%) | 40 (16.7%) |
| 65 to 74 Years | 4 (2.8%) | 0 (0.0%) |
| 75 Years and over | 0 (0.0%) | 0 (0.0%) |
| Total | 151 (12.9%) | 40 (3.2%) |
Income Above Poverty by Sex and Age in Edgemont Park
According to the poverty statistics in Edgemont Park, males aged under 5 years and females aged under 5 years are the age groups that are most secure financially, with 100.0% of males and 100.0% of females in these age groups living above the poverty line.
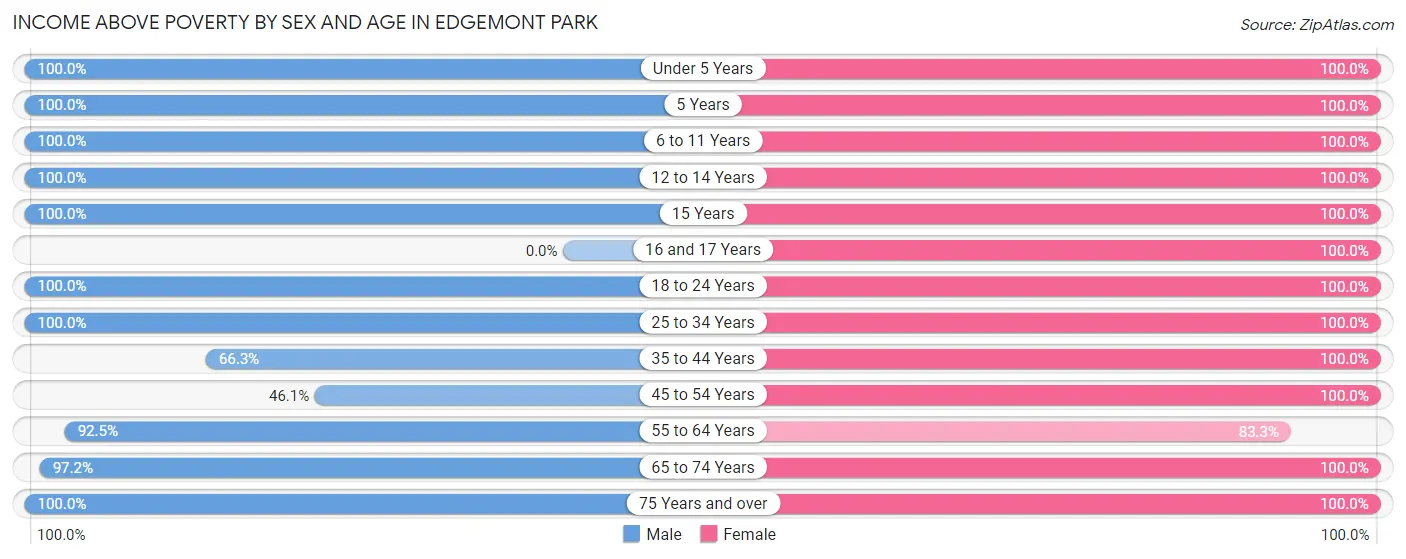
| Age Bracket | Male | Female |
| Under 5 Years | 89 (100.0%) | 40 (100.0%) |
| 5 Years | 8 (100.0%) | 12 (100.0%) |
| 6 to 11 Years | 84 (100.0%) | 30 (100.0%) |
| 12 to 14 Years | 56 (100.0%) | 20 (100.0%) |
| 15 Years | 21 (100.0%) | 16 (100.0%) |
| 16 and 17 Years | 0 (0.0%) | 24 (100.0%) |
| 18 to 24 Years | 123 (100.0%) | 234 (100.0%) |
| 25 to 34 Years | 149 (100.0%) | 116 (100.0%) |
| 35 to 44 Years | 134 (66.3%) | 197 (100.0%) |
| 45 to 54 Years | 59 (46.1%) | 124 (100.0%) |
| 55 to 64 Years | 124 (92.5%) | 200 (83.3%) |
| 65 to 74 Years | 138 (97.2%) | 126 (100.0%) |
| 75 Years and over | 32 (100.0%) | 75 (100.0%) |
| Total | 1,017 (87.1%) | 1,214 (96.8%) |
Income Below Poverty Among Married-Couple Families in Edgemont Park
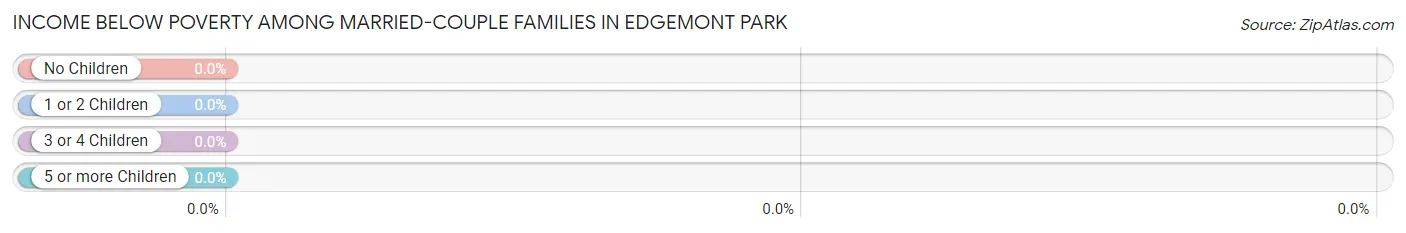
| Children | Above Poverty | Below Poverty |
| No Children | 233 (100.0%) | 0 (0.0%) |
| 1 or 2 Children | 122 (100.0%) | 0 (0.0%) |
| 3 or 4 Children | 33 (100.0%) | 0 (0.0%) |
| 5 or more Children | 0 (0.0%) | 0 (0.0%) |
| Total | 388 (100.0%) | 0 (0.0%) |
Income Below Poverty Among Single-Parent Households in Edgemont Park
| Children | Single Father | Single Mother |
| No Children | 0 (0.0%) | 0 (0.0%) |
| 1 or 2 Children | 0 (0.0%) | 0 (0.0%) |
| 3 or 4 Children | 0 (0.0%) | 0 (0.0%) |
| 5 or more Children | 0 (0.0%) | 0 (0.0%) |
| Total | 0 (0.0%) | 0 (0.0%) |
Income Below Poverty Among Married-Couple vs Single-Parent Households in Edgemont Park
| Children | Married-Couple Families | Single-Parent Households |
| No Children | 0 (0.0%) | 0 (0.0%) |
| 1 or 2 Children | 0 (0.0%) | 0 (0.0%) |
| 3 or 4 Children | 0 (0.0%) | 0 (0.0%) |
| 5 or more Children | 0 (0.0%) | 0 (0.0%) |
| Total | 0 (0.0%) | 0 (0.0%) |
Race in Edgemont Park
The most populous races in Edgemont Park are White / Caucasian (1,553 | 63.5%), Black / African American (621 | 25.4%), and Two or more Races (216 | 8.8%).
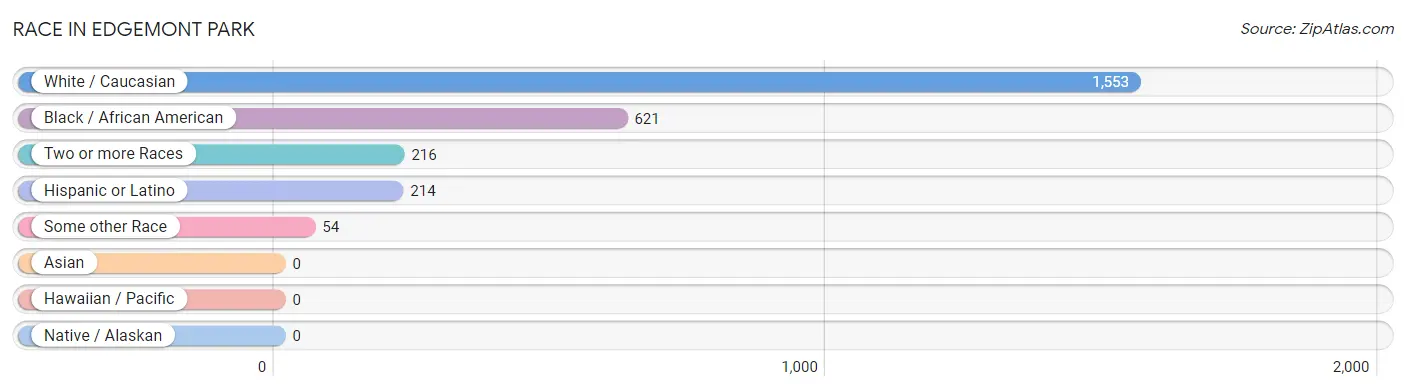
| Race | # Population | % Population |
| Asian | 0 | 0.0% |
| Black / African American | 621 | 25.4% |
| Hawaiian / Pacific | 0 | 0.0% |
| Hispanic or Latino | 214 | 8.8% |
| Native / Alaskan | 0 | 0.0% |
| White / Caucasian | 1,553 | 63.5% |
| Two or more Races | 216 | 8.8% |
| Some other Race | 54 | 2.2% |
| Total | 2,444 | 100.0% |
Ancestry in Edgemont Park
The most populous ancestries reported in Edgemont Park are German (366 | 15.0%), English (324 | 13.3%), Irish (232 | 9.5%), Polish (225 | 9.2%), and Mexican (212 | 8.7%), together accounting for 55.6% of all Edgemont Park residents.
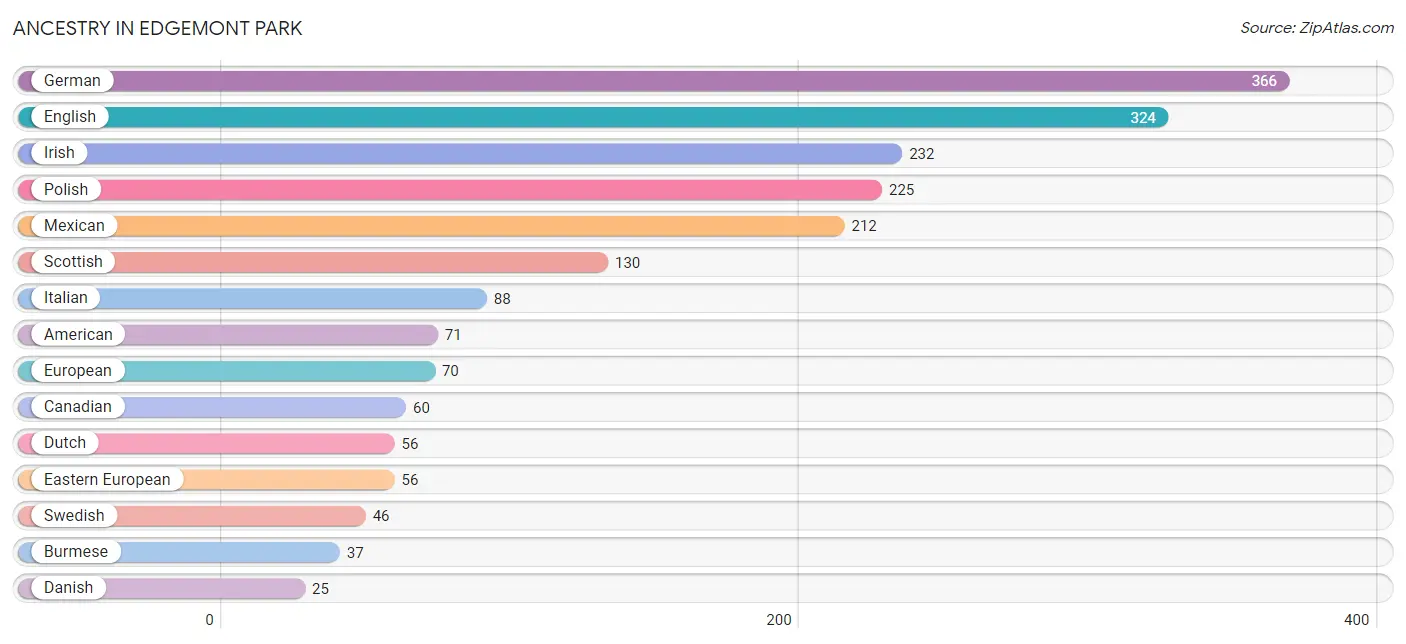
| Ancestry | # Population | % Population |
| African | 15 | 0.6% |
| American | 71 | 2.9% |
| Belgian | 10 | 0.4% |
| British | 15 | 0.6% |
| British West Indian | 14 | 0.6% |
| Burmese | 37 | 1.5% |
| Canadian | 60 | 2.5% |
| Central American | 2 | 0.1% |
| Cherokee | 6 | 0.3% |
| Czechoslovakian | 8 | 0.3% |
| Danish | 25 | 1.0% |
| Dutch | 56 | 2.3% |
| Eastern European | 56 | 2.3% |
| English | 324 | 13.3% |
| European | 70 | 2.9% |
| French | 25 | 1.0% |
| French American Indian | 9 | 0.4% |
| French Canadian | 9 | 0.4% |
| German | 366 | 15.0% |
| Honduran | 2 | 0.1% |
| Hungarian | 18 | 0.7% |
| Irish | 232 | 9.5% |
| Italian | 88 | 3.6% |
| Latvian | 10 | 0.4% |
| Mexican | 212 | 8.7% |
| Polish | 225 | 9.2% |
| Russian | 9 | 0.4% |
| Scandinavian | 13 | 0.5% |
| Scotch-Irish | 15 | 0.6% |
| Scottish | 130 | 5.3% |
| Subsaharan African | 15 | 0.6% |
| Swedish | 46 | 1.9% |
| Swiss | 10 | 0.4% |
| Welsh | 6 | 0.3% | View All 34 Rows |
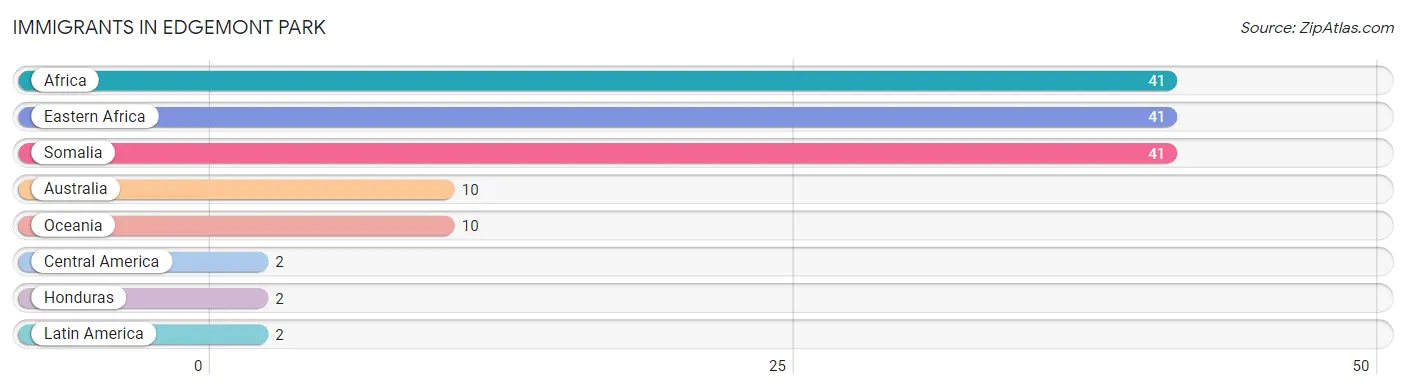
Immigrants in Edgemont Park
The most numerous immigrant groups reported in Edgemont Park came from Africa (41 | 1.7%), Eastern Africa (41 | 1.7%), Somalia (41 | 1.7%), Australia (10 | 0.4%), and Oceania (10 | 0.4%), together accounting for 5.9% of all Edgemont Park residents.
| Immigration Origin | # Population | % Population |
| Africa | 41 | 1.7% |
| Australia | 10 | 0.4% |
| Central America | 2 | 0.1% |
| Eastern Africa | 41 | 1.7% |
| Honduras | 2 | 0.1% |
| Latin America | 2 | 0.1% |
| Oceania | 10 | 0.4% |
| Somalia | 41 | 1.7% | View All 8 Rows |
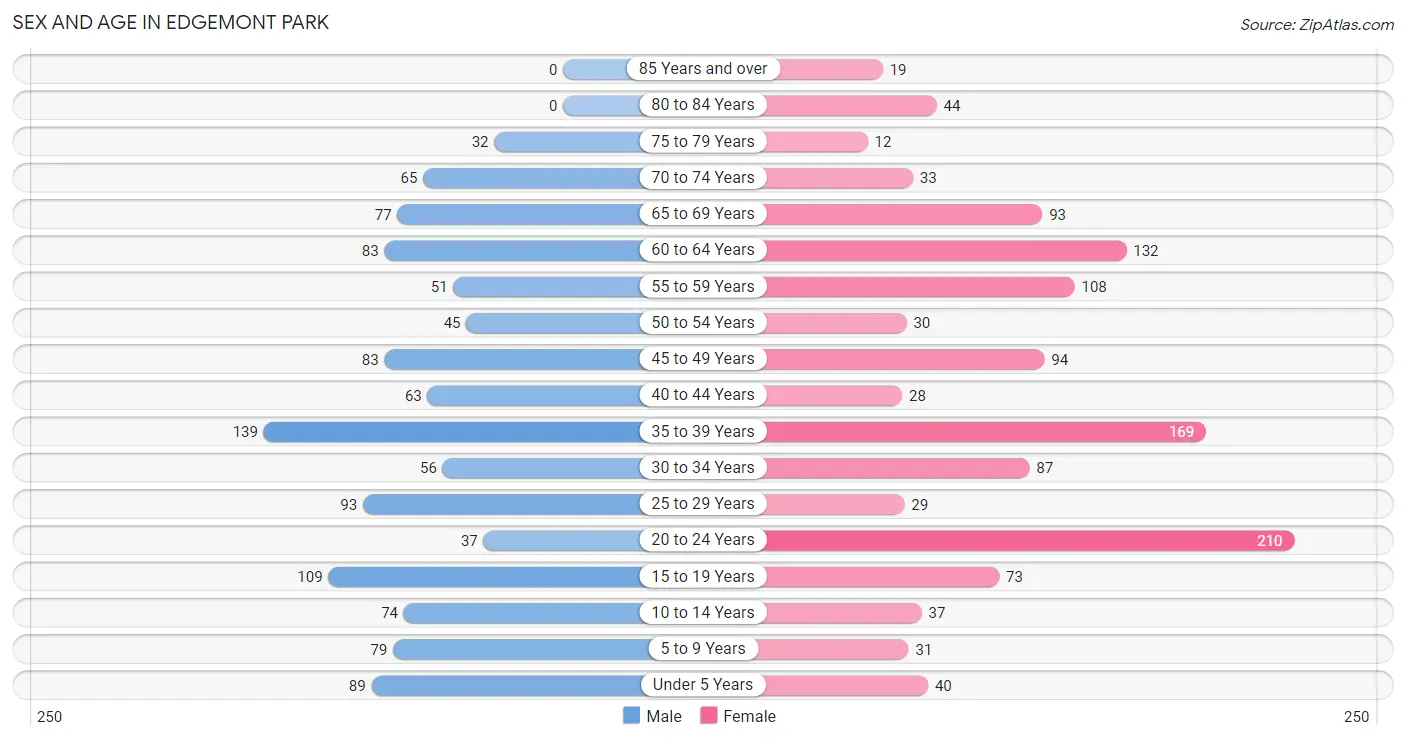
Sex and Age in Edgemont Park
Sex and Age in Edgemont Park
The most populous age groups in Edgemont Park are 35 to 39 Years (139 | 11.8%) for men and 20 to 24 Years (210 | 16.6%) for women.
| Age Bracket | Male | Female |
| Under 5 Years | 89 (7.6%) | 40 (3.2%) |
| 5 to 9 Years | 79 (6.7%) | 31 (2.4%) |
| 10 to 14 Years | 74 (6.3%) | 37 (2.9%) |
| 15 to 19 Years | 109 (9.3%) | 73 (5.8%) |
| 20 to 24 Years | 37 (3.2%) | 210 (16.6%) |
| 25 to 29 Years | 93 (7.9%) | 29 (2.3%) |
| 30 to 34 Years | 56 (4.8%) | 87 (6.9%) |
| 35 to 39 Years | 139 (11.8%) | 169 (13.3%) |
| 40 to 44 Years | 63 (5.4%) | 28 (2.2%) |
| 45 to 49 Years | 83 (7.1%) | 94 (7.4%) |
| 50 to 54 Years | 45 (3.8%) | 30 (2.4%) |
| 55 to 59 Years | 51 (4.3%) | 108 (8.5%) |
| 60 to 64 Years | 83 (7.1%) | 132 (10.4%) |
| 65 to 69 Years | 77 (6.6%) | 93 (7.3%) |
| 70 to 74 Years | 65 (5.5%) | 33 (2.6%) |
| 75 to 79 Years | 32 (2.7%) | 12 (0.9%) |
| 80 to 84 Years | 0 (0.0%) | 44 (3.5%) |
| 85 Years and over | 0 (0.0%) | 19 (1.5%) |
| Total | 1,175 (100.0%) | 1,269 (100.0%) |
Families and Households in Edgemont Park
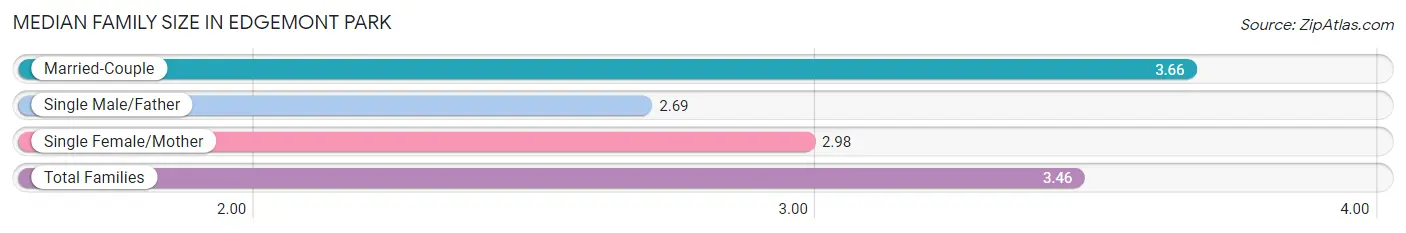
Median Family Size in Edgemont Park
The median family size in Edgemont Park is 3.46 persons per family, with married-couple families (388 | 73.4%) accounting for the largest median family size of 3.66 persons per family. On the other hand, single male/father families (32 | 6.0%) represent the smallest median family size with 2.69 persons per family.
| Family Type | # Families | Family Size |
| Married-Couple | 388 (73.4%) | 3.66 |
| Single Male/Father | 32 (6.0%) | 2.69 |
| Single Female/Mother | 109 (20.6%) | 2.98 |
| Total Families | 529 (100.0%) | 3.46 |
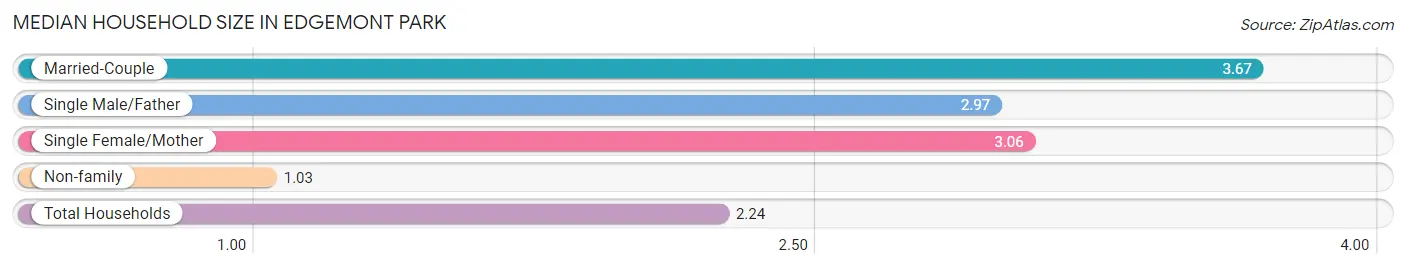
Median Household Size in Edgemont Park
The median household size in Edgemont Park is 2.24 persons per household, with married-couple households (388 | 35.9%) accounting for the largest median household size of 3.67 persons per household. non-family households (553 | 51.1%) represent the smallest median household size with 1.03 persons per household.
| Household Type | # Households | Household Size |
| Married-Couple | 388 (35.9%) | 3.67 |
| Single Male/Father | 32 (3.0%) | 2.97 |
| Single Female/Mother | 109 (10.1%) | 3.06 |
| Non-family | 553 (51.1%) | 1.03 |
| Total Households | 1,082 (100.0%) | 2.24 |
Household Size by Marriage Status in Edgemont Park
Out of a total of 1,082 households in Edgemont Park, 529 (48.9%) are family households, while 553 (51.1%) are nonfamily households. The most numerous type of family households are 3-person households, comprising 201, and the most common type of nonfamily households are 1-person households, comprising 537.
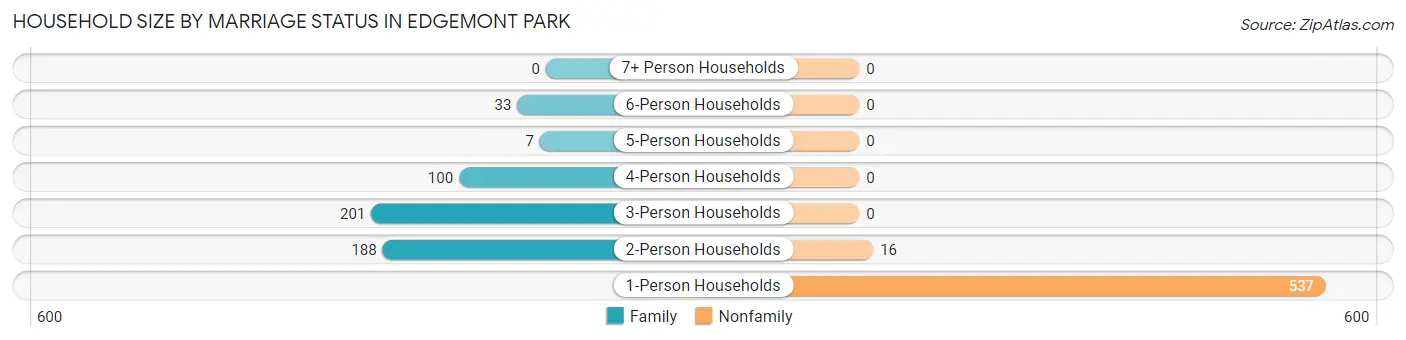
| Household Size | Family Households | Nonfamily Households |
| 1-Person Households | - | 537 (49.6%) |
| 2-Person Households | 188 (17.4%) | 16 (1.5%) |
| 3-Person Households | 201 (18.6%) | 0 (0.0%) |
| 4-Person Households | 100 (9.2%) | 0 (0.0%) |
| 5-Person Households | 7 (0.6%) | 0 (0.0%) |
| 6-Person Households | 33 (3.0%) | 0 (0.0%) |
| 7+ Person Households | 0 (0.0%) | 0 (0.0%) |
| Total | 529 (48.9%) | 553 (51.1%) |
Female Fertility in Edgemont Park
Fertility by Age in Edgemont Park
Average fertility rate in Edgemont Park is 88.0 births per 1,000 women. Women in the age bracket of 20 to 34 years have the highest fertility rate with 160.0 births per 1,000 women. Women in the age bracket of 20 to 34 years acount for 85.3% of all women with births.
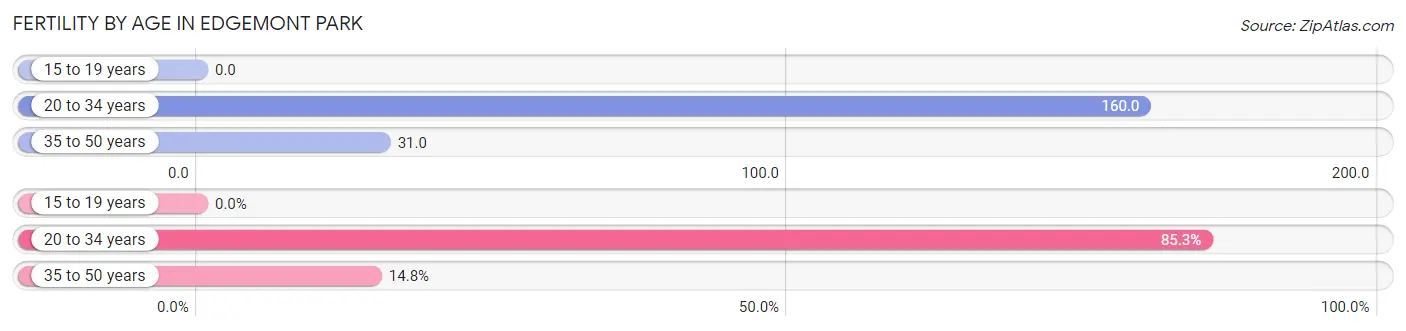
| Age Bracket | Women with Births | Births / 1,000 Women |
| 15 to 19 years | 0 (0.0%) | 0.0 |
| 20 to 34 years | 52 (85.3%) | 160.0 |
| 35 to 50 years | 9 (14.7%) | 31.0 |
| Total | 61 (100.0%) | 88.0 |
Fertility by Age by Marriage Status in Edgemont Park
86.9% of women with births (61) in Edgemont Park are married. The highest percentage of unmarried women with births falls into 20 to 34 years age bracket with 15.4% of them unmarried at the time of birth, while the lowest percentage of unmarried women with births belong to 35 to 50 years age bracket with 0.0% of them unmarried.
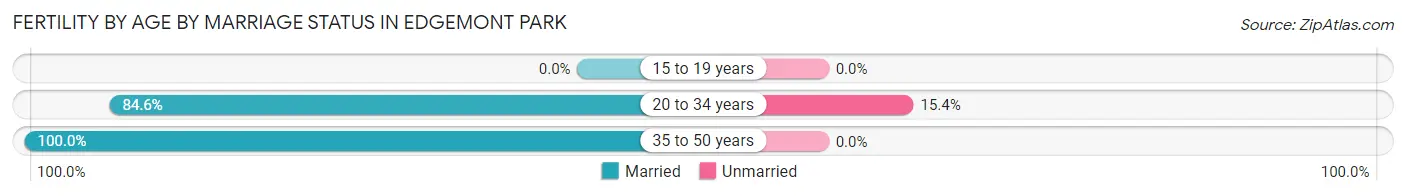
| Age Bracket | Married | Unmarried |
| 15 to 19 years | 0 (0.0%) | 0 (0.0%) |
| 20 to 34 years | 44 (84.6%) | 8 (15.4%) |
| 35 to 50 years | 9 (100.0%) | 0 (0.0%) |
| Total | 53 (86.9%) | 8 (13.1%) |
Fertility by Education in Edgemont Park
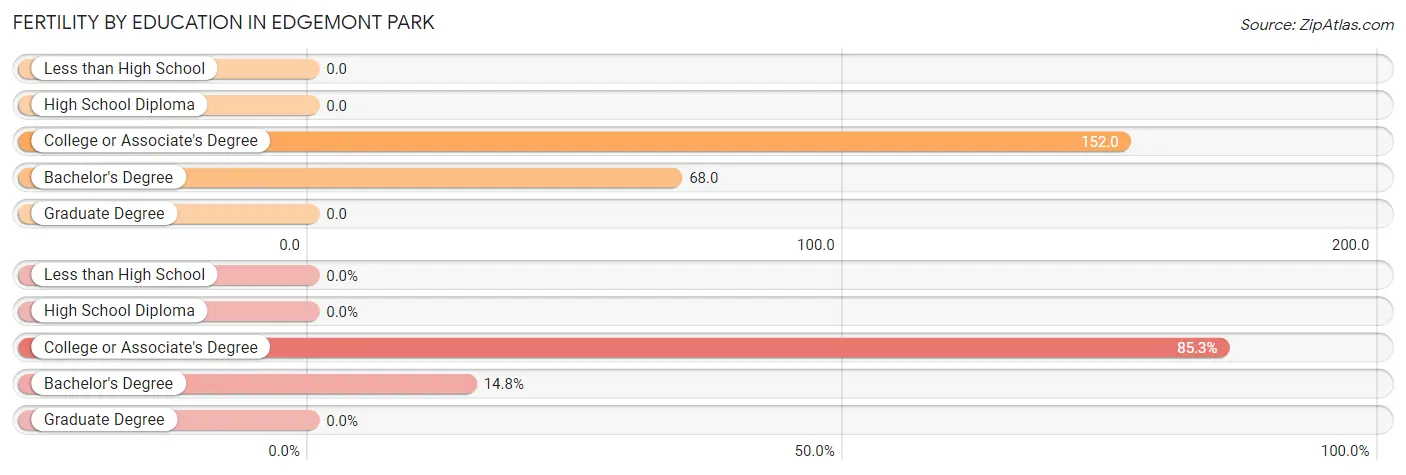
| Educational Attainment | Women with Births | Births / 1,000 Women |
| Less than High School | 0 (0.0%) | 0.0 |
| High School Diploma | 0 (0.0%) | 0.0 |
| College or Associate's Degree | 52 (85.3%) | 152.0 |
| Bachelor's Degree | 9 (14.7%) | 68.0 |
| Graduate Degree | 0 (0.0%) | 0.0 |
| Total | 61 (100.0%) | 88.0 |
Fertility by Education by Marriage Status in Edgemont Park
13.1% of women with births in Edgemont Park are unmarried. Women with the educational attainment of bachelor's degree are most likely to be married with 100.0% of them married at childbirth, while women with the educational attainment of college or associate's degree are least likely to be married with 15.4% of them unmarried at childbirth.
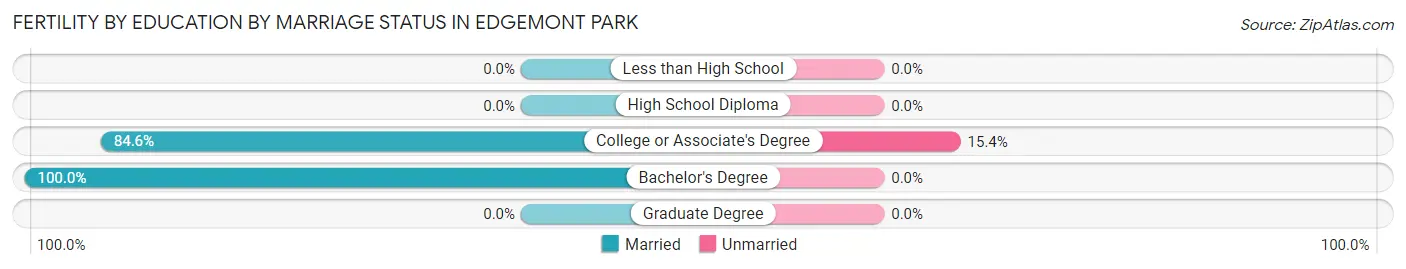
| Educational Attainment | Married | Unmarried |
| Less than High School | 0 (0.0%) | 0 (0.0%) |
| High School Diploma | 0 (0.0%) | 0 (0.0%) |
| College or Associate's Degree | 44 (84.6%) | 8 (15.4%) |
| Bachelor's Degree | 9 (100.0%) | 0 (0.0%) |
| Graduate Degree | 0 (0.0%) | 0 (0.0%) |
| Total | 53 (86.9%) | 8 (13.1%) |
Employment Characteristics in Edgemont Park
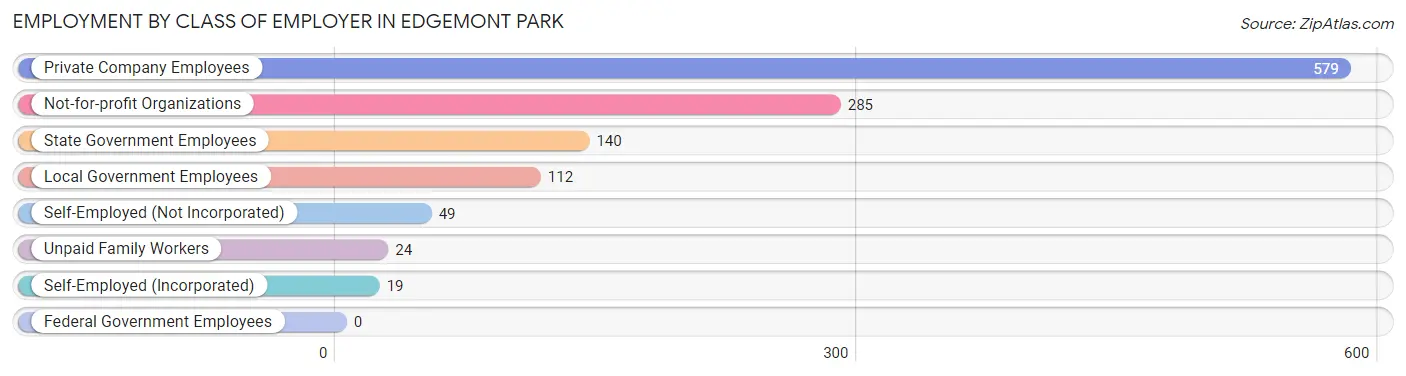
Employment by Class of Employer in Edgemont Park
Among the 1,208 employed individuals in Edgemont Park, private company employees (579 | 47.9%), not-for-profit organizations (285 | 23.6%), and state government employees (140 | 11.6%) make up the most common classes of employment.
| Employer Class | # Employees | % Employees |
| Private Company Employees | 579 | 47.9% |
| Self-Employed (Incorporated) | 19 | 1.6% |
| Self-Employed (Not Incorporated) | 49 | 4.1% |
| Not-for-profit Organizations | 285 | 23.6% |
| Local Government Employees | 112 | 9.3% |
| State Government Employees | 140 | 11.6% |
| Federal Government Employees | 0 | 0.0% |
| Unpaid Family Workers | 24 | 2.0% |
| Total | 1,208 | 100.0% |
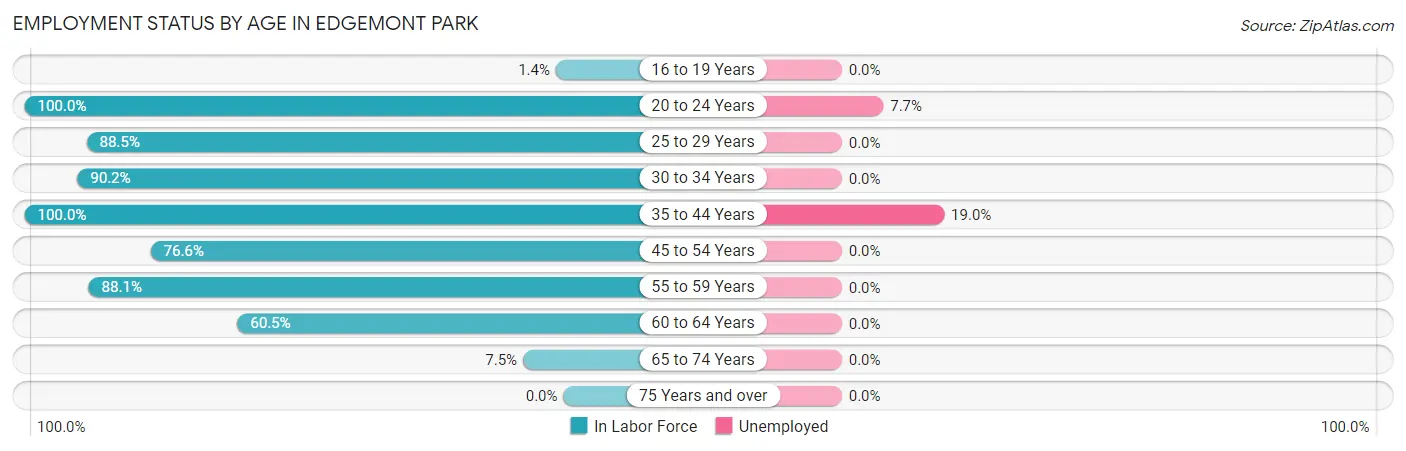
Employment Status by Age in Edgemont Park
According to the labor force statistics for Edgemont Park, out of the total population over 16 years of age (2,054), 66.6% or 1,368 individuals are in the labor force, with 6.9% or 94 of them unemployed. The age group with the highest labor force participation rate is 20 to 24 years, with 100.0% or 247 individuals in the labor force. Within the labor force, the 35 to 44 years age range has the highest percentage of unemployed individuals, with 19.0% or 76 of them being unemployed.
| Age Bracket | In Labor Force | Unemployed |
| 16 to 19 Years | 2 (1.4%) | 0 (0.0%) |
| 20 to 24 Years | 247 (100.0%) | 19 (7.7%) |
| 25 to 29 Years | 108 (88.5%) | 0 (0.0%) |
| 30 to 34 Years | 129 (90.2%) | 0 (0.0%) |
| 35 to 44 Years | 399 (100.0%) | 76 (19.0%) |
| 45 to 54 Years | 193 (76.6%) | 0 (0.0%) |
| 55 to 59 Years | 140 (88.1%) | 0 (0.0%) |
| 60 to 64 Years | 130 (60.5%) | 0 (0.0%) |
| 65 to 74 Years | 20 (7.5%) | 0 (0.0%) |
| 75 Years and over | 0 (0.0%) | 0 (0.0%) |
| Total | 1,368 (66.6%) | 94 (6.9%) |
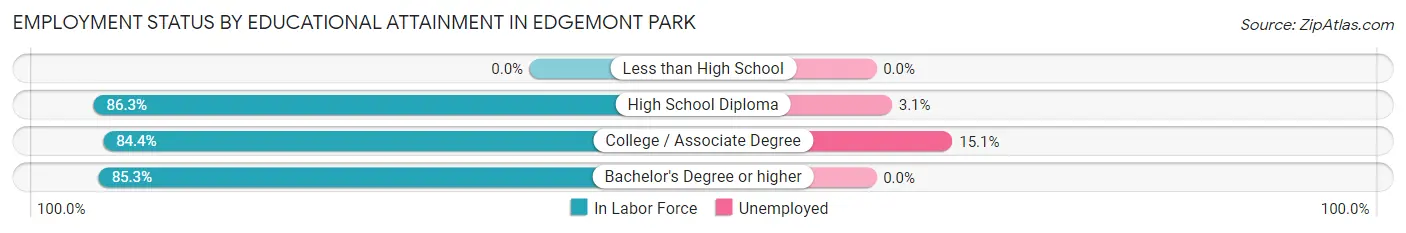
Employment Status by Educational Attainment in Edgemont Park
According to labor force statistics for Edgemont Park, 85.2% of individuals (1,099) out of the total population between 25 and 64 years of age (1,290) are in the labor force, with 6.9% or 76 of them being unemployed. The group with the highest labor force participation rate are those with the educational attainment of high school diploma, with 86.3% or 295 individuals in the labor force. Within the labor force, individuals with college / associate degree education have the highest percentage of unemployment, with 15.1% or 67 of them being unemployed.
| Educational Attainment | In Labor Force | Unemployed |
| Less than High School | 0 (0.0%) | 0 (0.0%) |
| High School Diploma | 295 (86.3%) | 11 (3.1%) |
| College / Associate Degree | 443 (84.4%) | 79 (15.1%) |
| Bachelor's Degree or higher | 361 (85.3%) | 0 (0.0%) |
| Total | 1,099 (85.2%) | 89 (6.9%) |
Employment Occupations by Sex in Edgemont Park
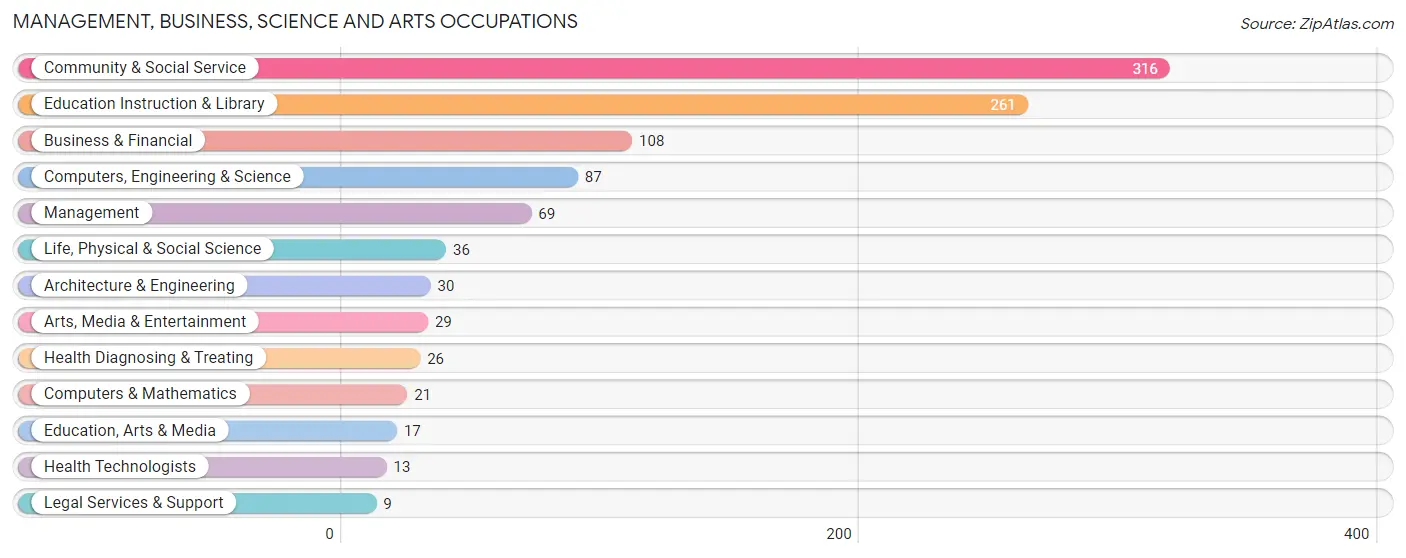
Management, Business, Science and Arts Occupations
The most common Management, Business, Science and Arts occupations in Edgemont Park are Community & Social Service (316 | 24.8%), Education Instruction & Library (261 | 20.5%), Business & Financial (108 | 8.5%), Computers, Engineering & Science (87 | 6.8%), and Management (69 | 5.4%).
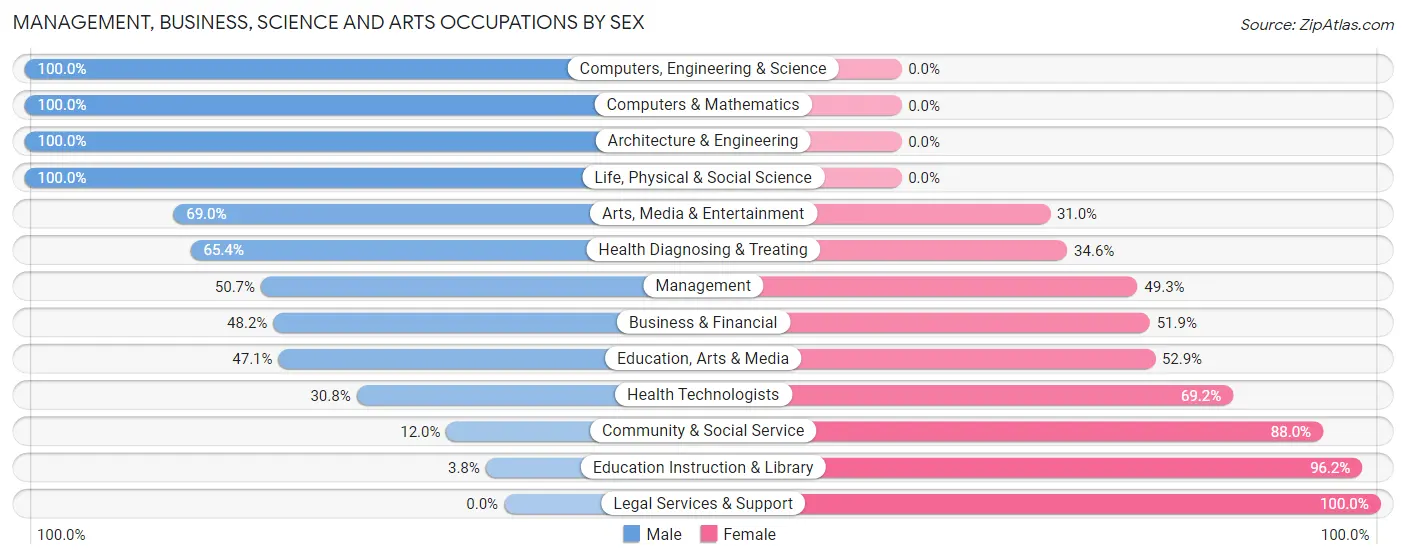
Management, Business, Science and Arts Occupations by Sex
Within the Management, Business, Science and Arts occupations in Edgemont Park, the most male-oriented occupations are Computers, Engineering & Science (100.0%), Computers & Mathematics (100.0%), and Architecture & Engineering (100.0%), while the most female-oriented occupations are Legal Services & Support (100.0%), Education Instruction & Library (96.2%), and Community & Social Service (88.0%).
| Occupation | Male | Female |
| Management | 35 (50.7%) | 34 (49.3%) |
| Business & Financial | 52 (48.1%) | 56 (51.8%) |
| Computers, Engineering & Science | 87 (100.0%) | 0 (0.0%) |
| Computers & Mathematics | 21 (100.0%) | 0 (0.0%) |
| Architecture & Engineering | 30 (100.0%) | 0 (0.0%) |
| Life, Physical & Social Science | 36 (100.0%) | 0 (0.0%) |
| Community & Social Service | 38 (12.0%) | 278 (88.0%) |
| Education, Arts & Media | 8 (47.1%) | 9 (52.9%) |
| Legal Services & Support | 0 (0.0%) | 9 (100.0%) |
| Education Instruction & Library | 10 (3.8%) | 251 (96.2%) |
| Arts, Media & Entertainment | 20 (69.0%) | 9 (31.0%) |
| Health Diagnosing & Treating | 17 (65.4%) | 9 (34.6%) |
| Health Technologists | 4 (30.8%) | 9 (69.2%) |
| Total (Category) | 229 (37.8%) | 377 (62.2%) |
| Total (Overall) | 496 (39.0%) | 777 (61.0%) |
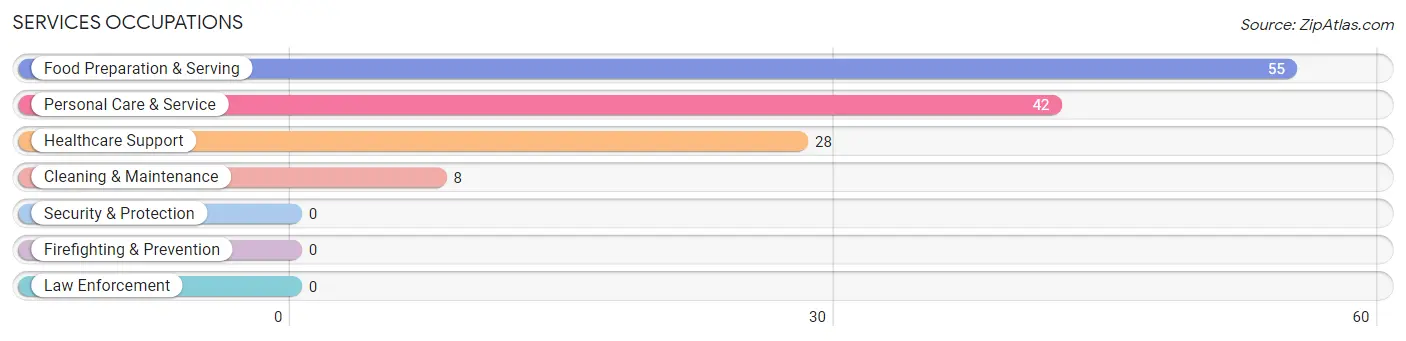
Services Occupations
The most common Services occupations in Edgemont Park are Food Preparation & Serving (55 | 4.3%), Personal Care & Service (42 | 3.3%), Healthcare Support (28 | 2.2%), and Cleaning & Maintenance (8 | 0.6%).
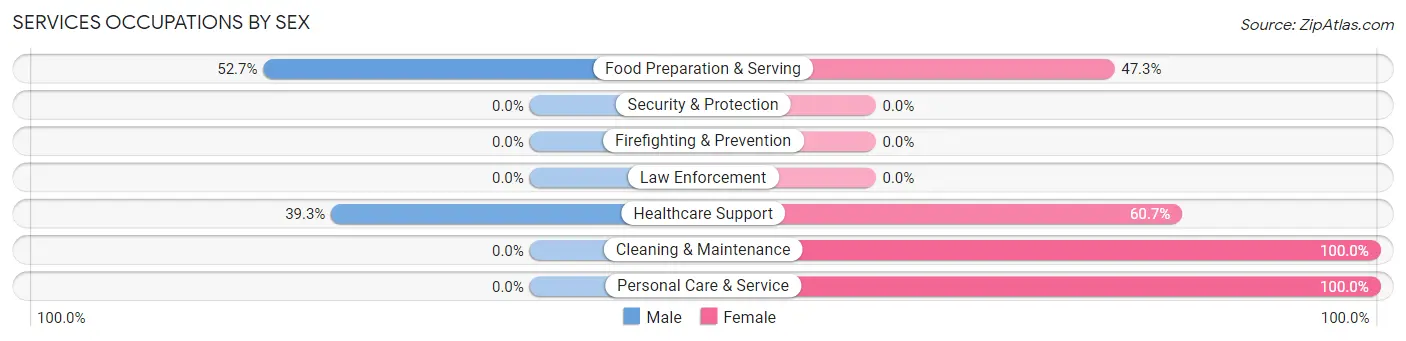
Services Occupations by Sex
Within the Services occupations in Edgemont Park, the most male-oriented occupations are Food Preparation & Serving (52.7%), and Healthcare Support (39.3%), while the most female-oriented occupations are Cleaning & Maintenance (100.0%), Personal Care & Service (100.0%), and Healthcare Support (60.7%).
| Occupation | Male | Female |
| Healthcare Support | 11 (39.3%) | 17 (60.7%) |
| Security & Protection | 0 (0.0%) | 0 (0.0%) |
| Firefighting & Prevention | 0 (0.0%) | 0 (0.0%) |
| Law Enforcement | 0 (0.0%) | 0 (0.0%) |
| Food Preparation & Serving | 29 (52.7%) | 26 (47.3%) |
| Cleaning & Maintenance | 0 (0.0%) | 8 (100.0%) |
| Personal Care & Service | 0 (0.0%) | 42 (100.0%) |
| Total (Category) | 40 (30.1%) | 93 (69.9%) |
| Total (Overall) | 496 (39.0%) | 777 (61.0%) |
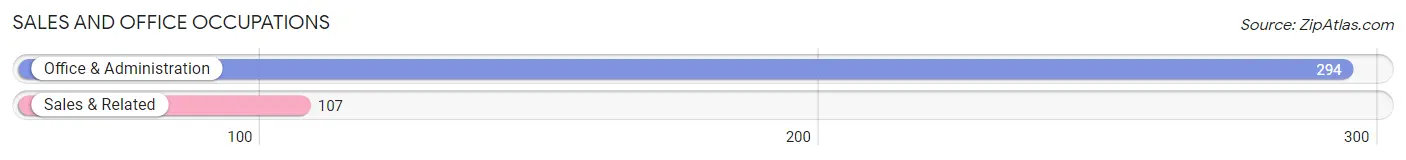
Sales and Office Occupations
The most common Sales and Office occupations in Edgemont Park are Office & Administration (294 | 23.1%), and Sales & Related (107 | 8.4%).
Sales and Office Occupations by Sex
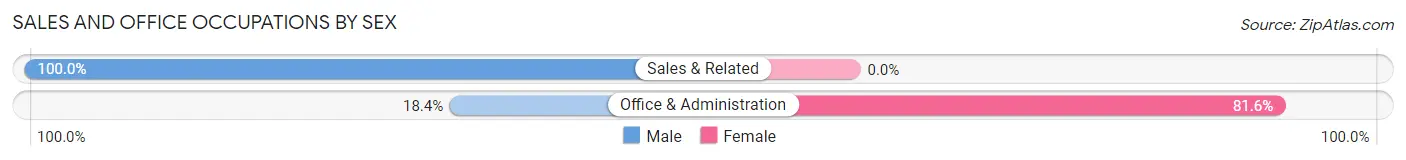
| Occupation | Male | Female |
| Sales & Related | 107 (100.0%) | 0 (0.0%) |
| Office & Administration | 54 (18.4%) | 240 (81.6%) |
| Total (Category) | 161 (40.2%) | 240 (59.9%) |
| Total (Overall) | 496 (39.0%) | 777 (61.0%) |
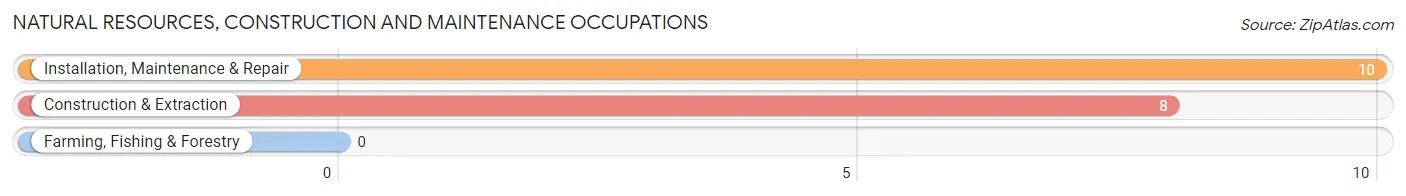
Natural Resources, Construction and Maintenance Occupations
The most common Natural Resources, Construction and Maintenance occupations in Edgemont Park are Installation, Maintenance & Repair (10 | 0.8%), and Construction & Extraction (8 | 0.6%).
Natural Resources, Construction and Maintenance Occupations by Sex
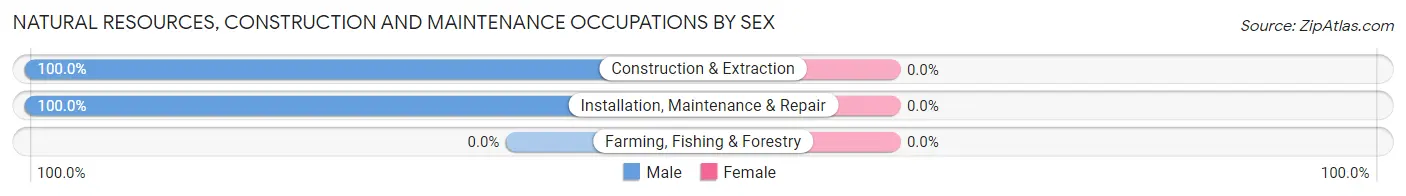
| Occupation | Male | Female |
| Farming, Fishing & Forestry | 0 (0.0%) | 0 (0.0%) |
| Construction & Extraction | 8 (100.0%) | 0 (0.0%) |
| Installation, Maintenance & Repair | 10 (100.0%) | 0 (0.0%) |
| Total (Category) | 18 (100.0%) | 0 (0.0%) |
| Total (Overall) | 496 (39.0%) | 777 (61.0%) |
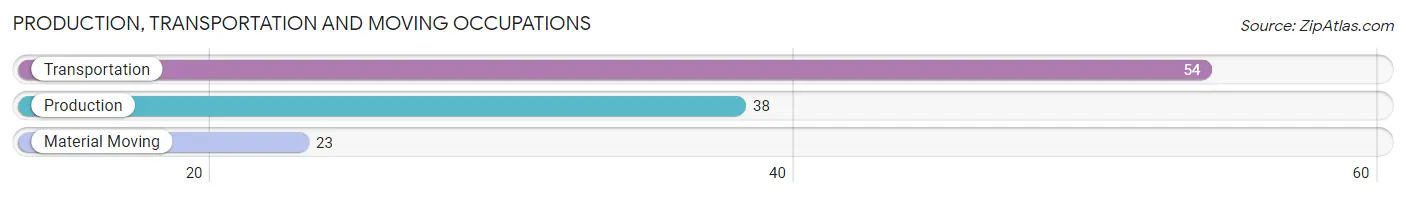
Production, Transportation and Moving Occupations
The most common Production, Transportation and Moving occupations in Edgemont Park are Transportation (54 | 4.2%), Production (38 | 3.0%), and Material Moving (23 | 1.8%).
Production, Transportation and Moving Occupations by Sex
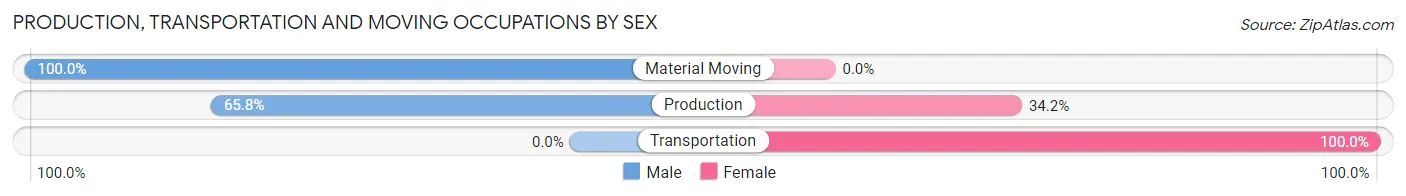
| Occupation | Male | Female |
| Production | 25 (65.8%) | 13 (34.2%) |
| Transportation | 0 (0.0%) | 54 (100.0%) |
| Material Moving | 23 (100.0%) | 0 (0.0%) |
| Total (Category) | 48 (41.7%) | 67 (58.3%) |
| Total (Overall) | 496 (39.0%) | 777 (61.0%) |
Employment Industries by Sex in Edgemont Park
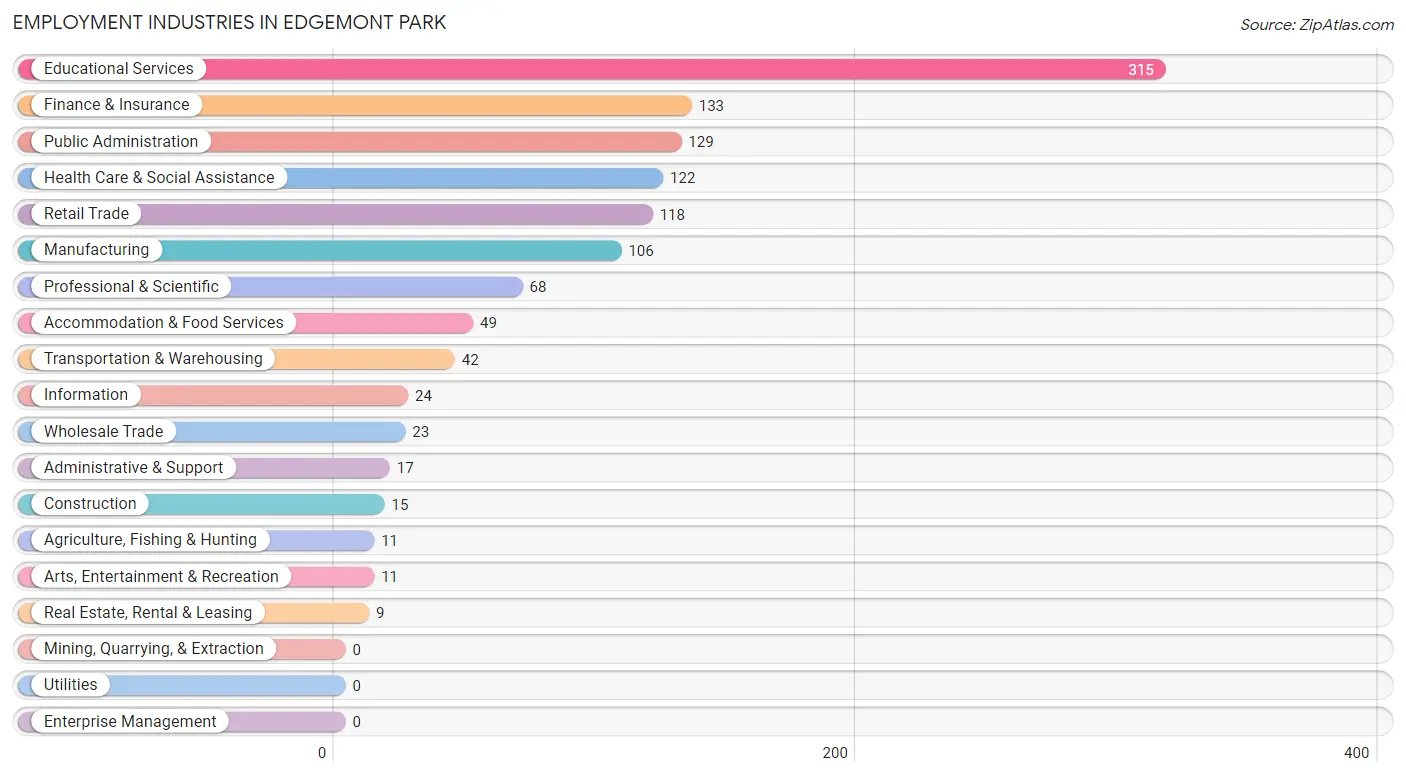
Employment Industries in Edgemont Park
The major employment industries in Edgemont Park include Educational Services (315 | 24.7%), Finance & Insurance (133 | 10.4%), Public Administration (129 | 10.1%), Health Care & Social Assistance (122 | 9.6%), and Retail Trade (118 | 9.3%).
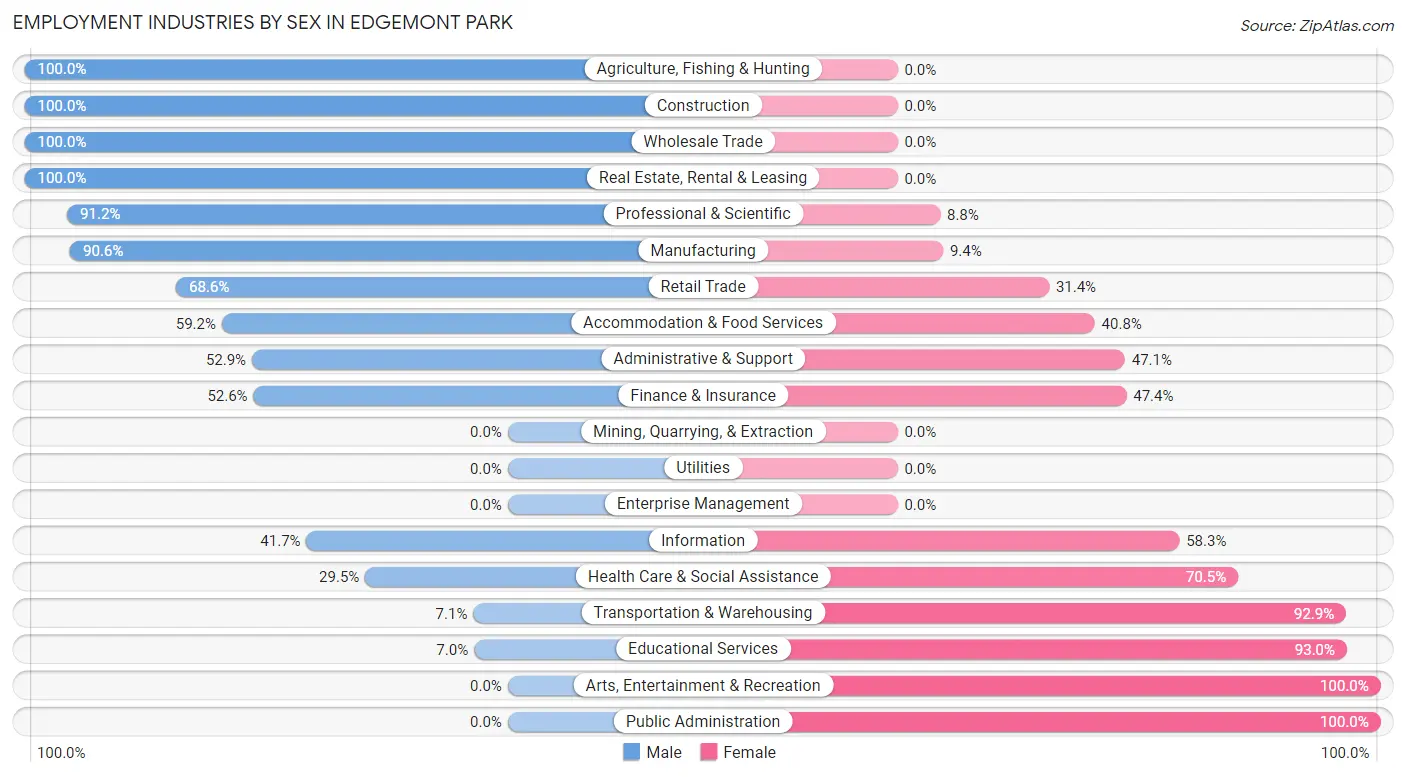
Employment Industries by Sex in Edgemont Park
The Edgemont Park industries that see more men than women are Agriculture, Fishing & Hunting (100.0%), Construction (100.0%), and Wholesale Trade (100.0%), whereas the industries that tend to have a higher number of women are Arts, Entertainment & Recreation (100.0%), Public Administration (100.0%), and Educational Services (93.0%).
| Industry | Male | Female |
| Agriculture, Fishing & Hunting | 11 (100.0%) | 0 (0.0%) |
| Mining, Quarrying, & Extraction | 0 (0.0%) | 0 (0.0%) |
| Construction | 15 (100.0%) | 0 (0.0%) |
| Manufacturing | 96 (90.6%) | 10 (9.4%) |
| Wholesale Trade | 23 (100.0%) | 0 (0.0%) |
| Retail Trade | 81 (68.6%) | 37 (31.4%) |
| Transportation & Warehousing | 3 (7.1%) | 39 (92.9%) |
| Utilities | 0 (0.0%) | 0 (0.0%) |
| Information | 10 (41.7%) | 14 (58.3%) |
| Finance & Insurance | 70 (52.6%) | 63 (47.4%) |
| Real Estate, Rental & Leasing | 9 (100.0%) | 0 (0.0%) |
| Professional & Scientific | 62 (91.2%) | 6 (8.8%) |
| Enterprise Management | 0 (0.0%) | 0 (0.0%) |
| Administrative & Support | 9 (52.9%) | 8 (47.1%) |
| Educational Services | 22 (7.0%) | 293 (93.0%) |
| Health Care & Social Assistance | 36 (29.5%) | 86 (70.5%) |
| Arts, Entertainment & Recreation | 0 (0.0%) | 11 (100.0%) |
| Accommodation & Food Services | 29 (59.2%) | 20 (40.8%) |
| Public Administration | 0 (0.0%) | 129 (100.0%) |
| Total | 496 (39.0%) | 777 (61.0%) |
Education in Edgemont Park
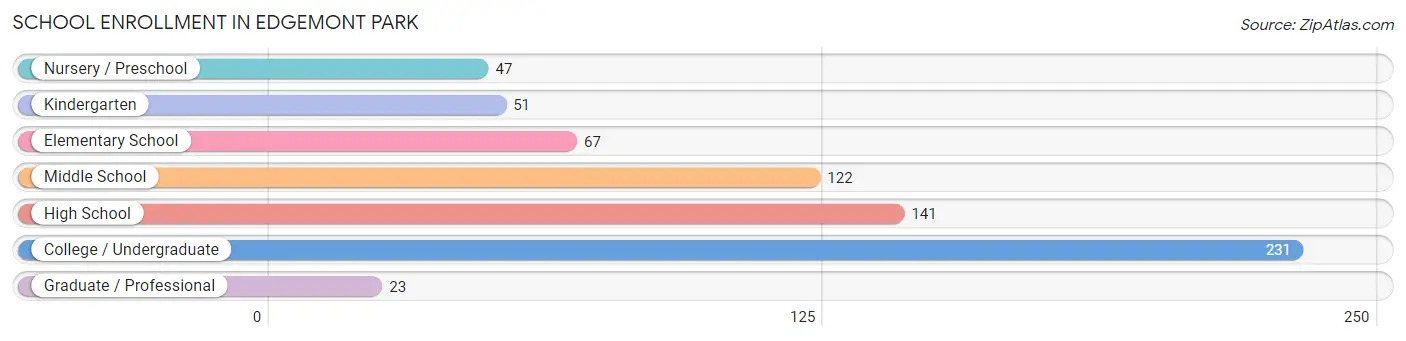
School Enrollment in Edgemont Park
The most common levels of schooling among the 682 students in Edgemont Park are college / undergraduate (231 | 33.9%), high school (141 | 20.7%), and middle school (122 | 17.9%).
| School Level | # Students | % Students |
| Nursery / Preschool | 47 | 6.9% |
| Kindergarten | 51 | 7.5% |
| Elementary School | 67 | 9.8% |
| Middle School | 122 | 17.9% |
| High School | 141 | 20.7% |
| College / Undergraduate | 231 | 33.9% |
| Graduate / Professional | 23 | 3.4% |
| Total | 682 | 100.0% |
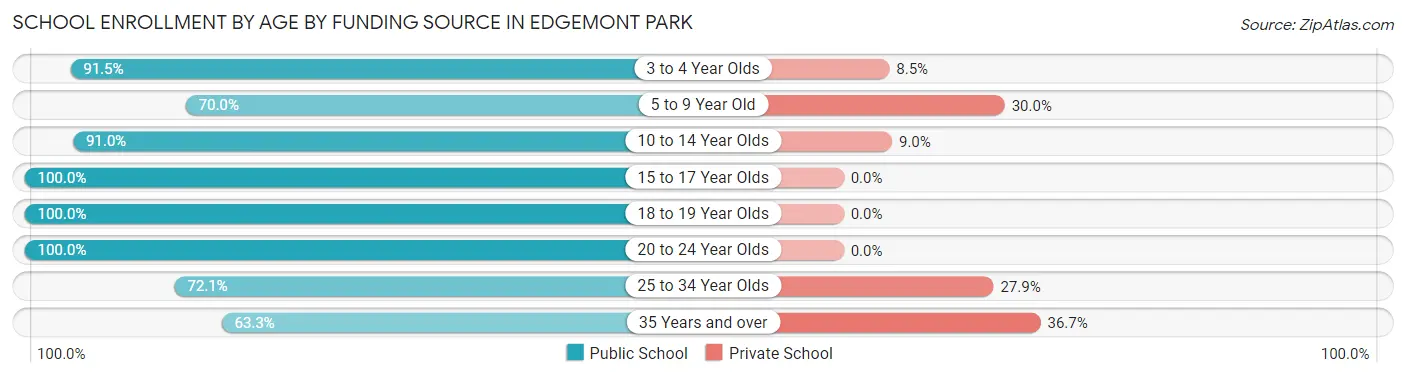
School Enrollment by Age by Funding Source in Edgemont Park
Out of a total of 682 students who are enrolled in schools in Edgemont Park, 70 (10.3%) attend a private institution, while the remaining 612 (89.7%) are enrolled in public schools. The age group of 35 years and over has the highest likelihood of being enrolled in private schools, with 11 (36.7% in the age bracket) enrolled. Conversely, the age group of 15 to 17 year olds has the lowest likelihood of being enrolled in a private school, with 72 (100.0% in the age bracket) attending a public institution.
| Age Bracket | Public School | Private School |
| 3 to 4 Year Olds | 43 (91.5%) | 4 (8.5%) |
| 5 to 9 Year Old | 77 (70.0%) | 33 (30.0%) |
| 10 to 14 Year Olds | 101 (91.0%) | 10 (9.0%) |
| 15 to 17 Year Olds | 72 (100.0%) | 0 (0.0%) |
| 18 to 19 Year Olds | 110 (100.0%) | 0 (0.0%) |
| 20 to 24 Year Olds | 159 (100.0%) | 0 (0.0%) |
| 25 to 34 Year Olds | 31 (72.1%) | 12 (27.9%) |
| 35 Years and over | 19 (63.3%) | 11 (36.7%) |
| Total | 612 (89.7%) | 70 (10.3%) |
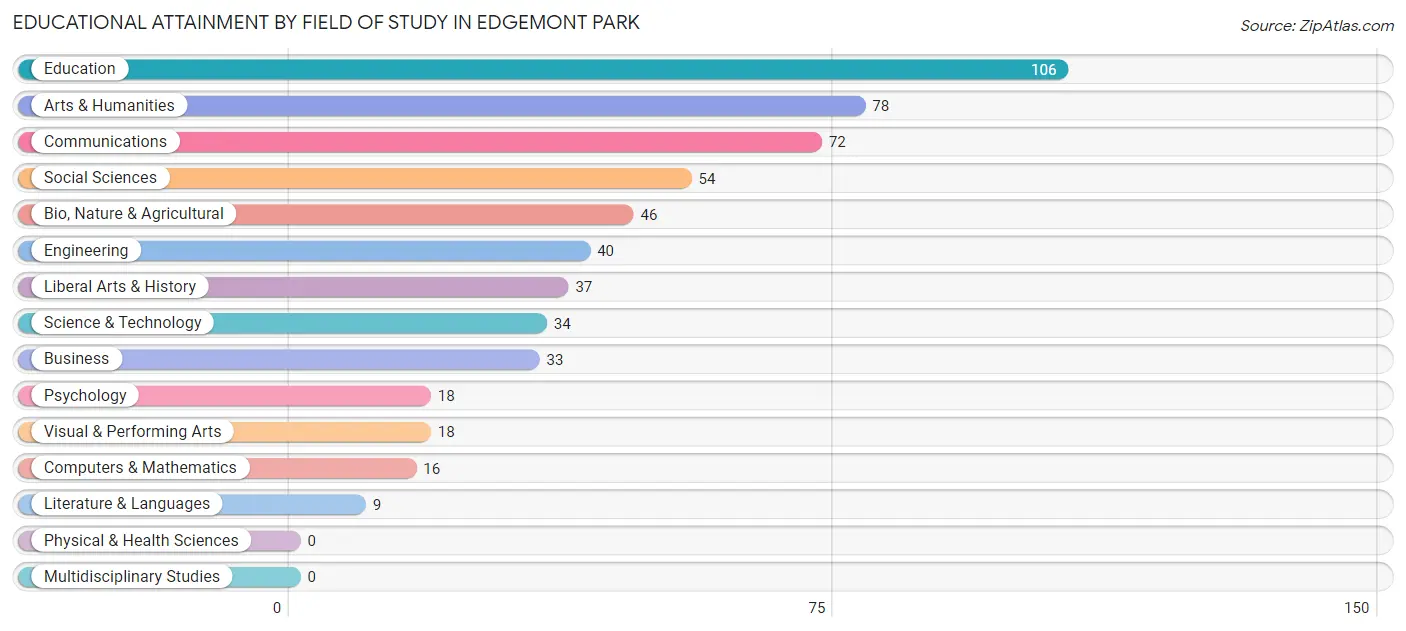
Educational Attainment by Field of Study in Edgemont Park
Education (106 | 18.9%), arts & humanities (78 | 13.9%), communications (72 | 12.8%), social sciences (54 | 9.6%), and bio, nature & agricultural (46 | 8.2%) are the most common fields of study among 561 individuals in Edgemont Park who have obtained a bachelor's degree or higher.
| Field of Study | # Graduates | % Graduates |
| Computers & Mathematics | 16 | 2.9% |
| Bio, Nature & Agricultural | 46 | 8.2% |
| Physical & Health Sciences | 0 | 0.0% |
| Psychology | 18 | 3.2% |
| Social Sciences | 54 | 9.6% |
| Engineering | 40 | 7.1% |
| Multidisciplinary Studies | 0 | 0.0% |
| Science & Technology | 34 | 6.1% |
| Business | 33 | 5.9% |
| Education | 106 | 18.9% |
| Literature & Languages | 9 | 1.6% |
| Liberal Arts & History | 37 | 6.6% |
| Visual & Performing Arts | 18 | 3.2% |
| Communications | 72 | 12.8% |
| Arts & Humanities | 78 | 13.9% |
| Total | 561 | 100.0% |
Transportation & Commute in Edgemont Park
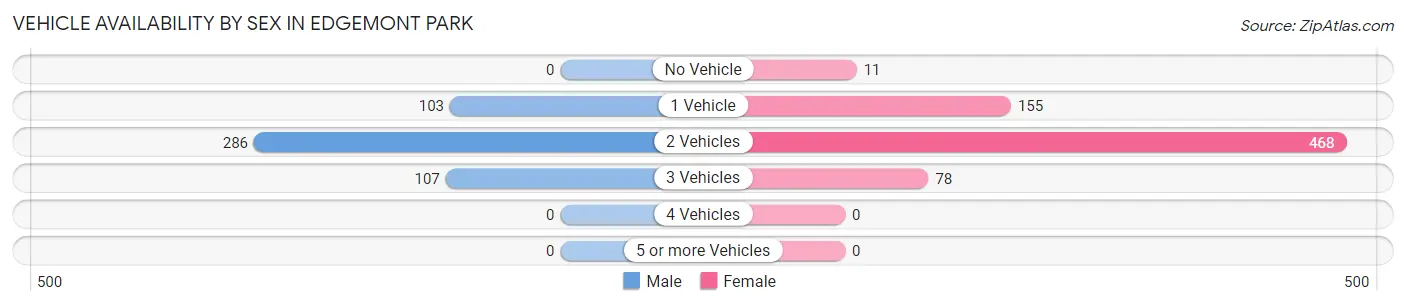
Vehicle Availability by Sex in Edgemont Park
The most prevalent vehicle ownership categories in Edgemont Park are males with 2 vehicles (286, accounting for 57.7%) and females with 2 vehicles (468, making up 40.2%).
| Vehicles Available | Male | Female |
| No Vehicle | 0 (0.0%) | 11 (1.5%) |
| 1 Vehicle | 103 (20.8%) | 155 (21.8%) |
| 2 Vehicles | 286 (57.7%) | 468 (65.7%) |
| 3 Vehicles | 107 (21.6%) | 78 (11.0%) |
| 4 Vehicles | 0 (0.0%) | 0 (0.0%) |
| 5 or more Vehicles | 0 (0.0%) | 0 (0.0%) |
| Total | 496 (100.0%) | 712 (100.0%) |
Commute Time in Edgemont Park
The most frequently occuring commute durations in Edgemont Park are 15 to 19 minutes (229 commuters, 27.2%), 10 to 14 minutes (227 commuters, 26.9%), and 20 to 24 minutes (124 commuters, 14.7%).
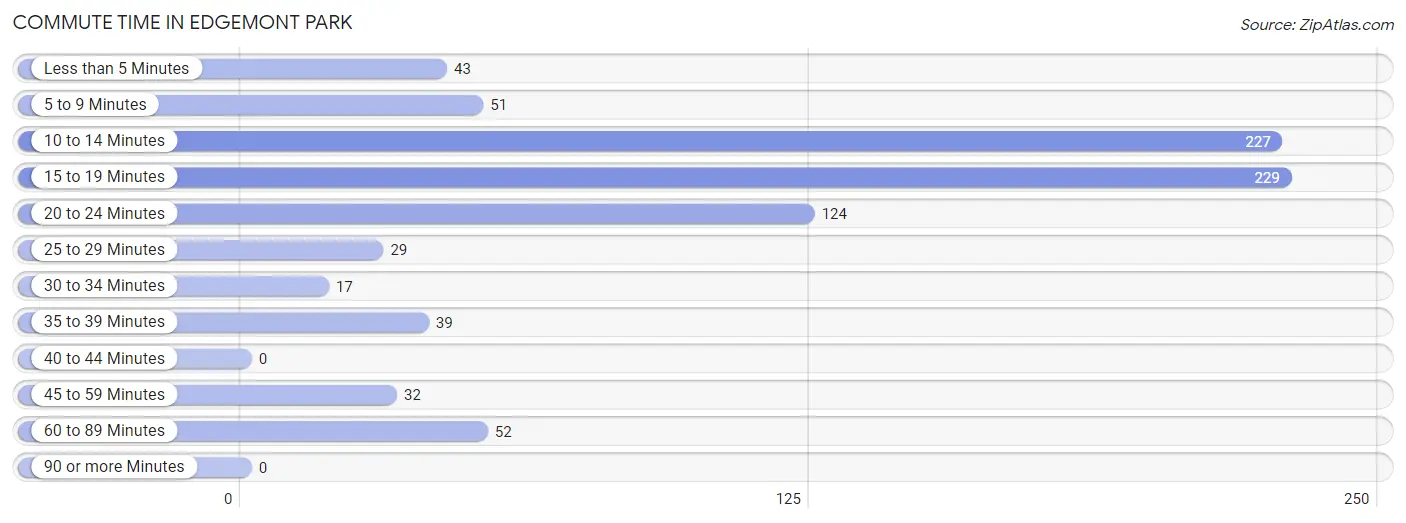
| Commute Time | # Commuters | % Commuters |
| Less than 5 Minutes | 43 | 5.1% |
| 5 to 9 Minutes | 51 | 6.0% |
| 10 to 14 Minutes | 227 | 26.9% |
| 15 to 19 Minutes | 229 | 27.2% |
| 20 to 24 Minutes | 124 | 14.7% |
| 25 to 29 Minutes | 29 | 3.4% |
| 30 to 34 Minutes | 17 | 2.0% |
| 35 to 39 Minutes | 39 | 4.6% |
| 40 to 44 Minutes | 0 | 0.0% |
| 45 to 59 Minutes | 32 | 3.8% |
| 60 to 89 Minutes | 52 | 6.2% |
| 90 or more Minutes | 0 | 0.0% |
Commute Time by Sex in Edgemont Park
The most common commute times in Edgemont Park are 15 to 19 minutes (107 commuters, 28.1%) for males and 10 to 14 minutes (179 commuters, 38.7%) for females.
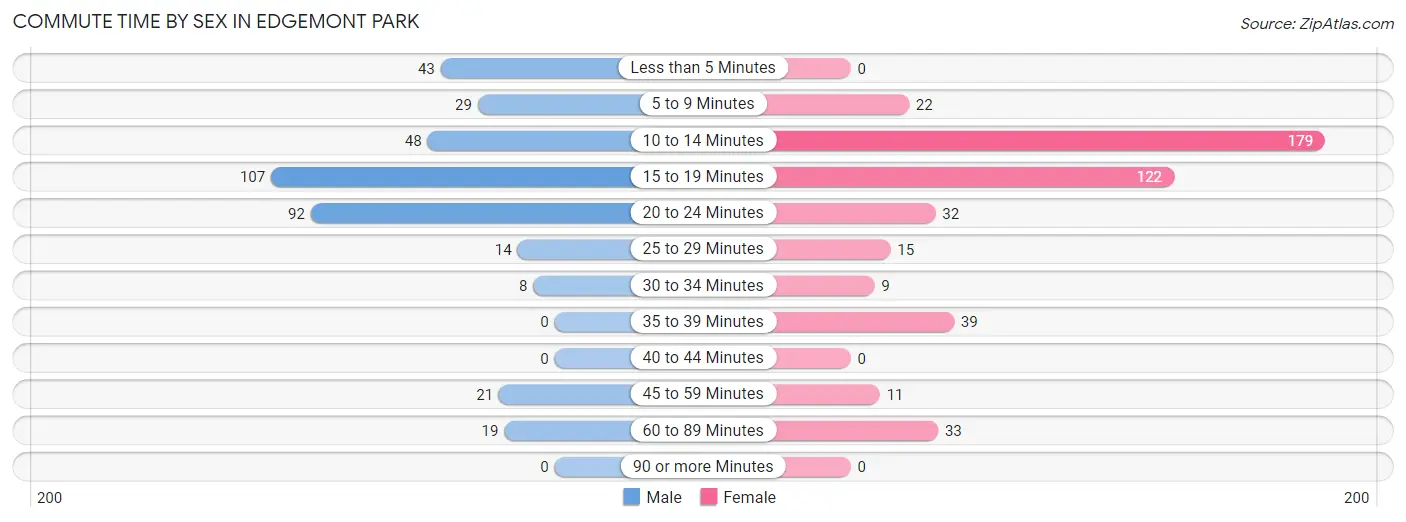
| Commute Time | Male | Female |
| Less than 5 Minutes | 43 (11.3%) | 0 (0.0%) |
| 5 to 9 Minutes | 29 (7.6%) | 22 (4.8%) |
| 10 to 14 Minutes | 48 (12.6%) | 179 (38.7%) |
| 15 to 19 Minutes | 107 (28.1%) | 122 (26.4%) |
| 20 to 24 Minutes | 92 (24.1%) | 32 (6.9%) |
| 25 to 29 Minutes | 14 (3.7%) | 15 (3.3%) |
| 30 to 34 Minutes | 8 (2.1%) | 9 (1.9%) |
| 35 to 39 Minutes | 0 (0.0%) | 39 (8.4%) |
| 40 to 44 Minutes | 0 (0.0%) | 0 (0.0%) |
| 45 to 59 Minutes | 21 (5.5%) | 11 (2.4%) |
| 60 to 89 Minutes | 19 (5.0%) | 33 (7.1%) |
| 90 or more Minutes | 0 (0.0%) | 0 (0.0%) |
Time of Departure to Work by Sex in Edgemont Park
The most frequent times of departure to work in Edgemont Park are 7:30 AM to 7:59 AM (102, 26.8%) for males and 7:30 AM to 7:59 AM (117, 25.3%) for females.
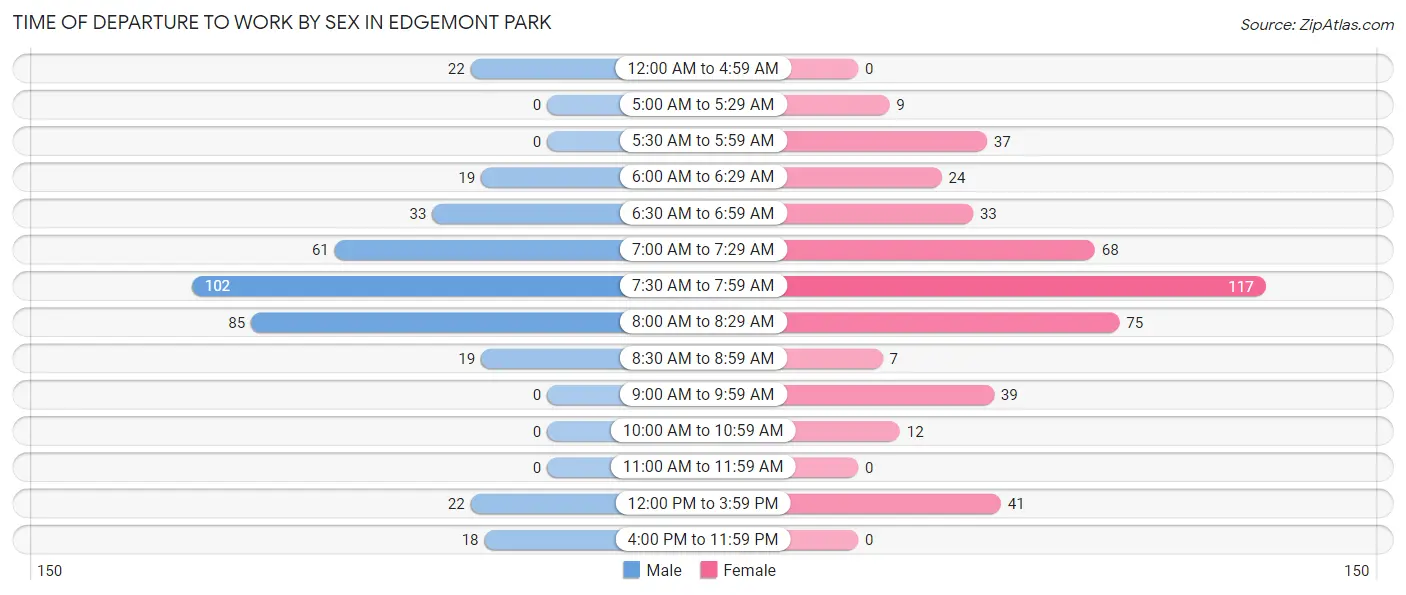
| Time of Departure | Male | Female |
| 12:00 AM to 4:59 AM | 22 (5.8%) | 0 (0.0%) |
| 5:00 AM to 5:29 AM | 0 (0.0%) | 9 (1.9%) |
| 5:30 AM to 5:59 AM | 0 (0.0%) | 37 (8.0%) |
| 6:00 AM to 6:29 AM | 19 (5.0%) | 24 (5.2%) |
| 6:30 AM to 6:59 AM | 33 (8.7%) | 33 (7.1%) |
| 7:00 AM to 7:29 AM | 61 (16.0%) | 68 (14.7%) |
| 7:30 AM to 7:59 AM | 102 (26.8%) | 117 (25.3%) |
| 8:00 AM to 8:29 AM | 85 (22.3%) | 75 (16.2%) |
| 8:30 AM to 8:59 AM | 19 (5.0%) | 7 (1.5%) |
| 9:00 AM to 9:59 AM | 0 (0.0%) | 39 (8.4%) |
| 10:00 AM to 10:59 AM | 0 (0.0%) | 12 (2.6%) |
| 11:00 AM to 11:59 AM | 0 (0.0%) | 0 (0.0%) |
| 12:00 PM to 3:59 PM | 22 (5.8%) | 41 (8.9%) |
| 4:00 PM to 11:59 PM | 18 (4.7%) | 0 (0.0%) |
| Total | 381 (100.0%) | 462 (100.0%) |
Housing Occupancy in Edgemont Park
Occupancy by Ownership in Edgemont Park
Of the total 1,082 dwellings in Edgemont Park, owner-occupied units account for 750 (69.3%), while renter-occupied units make up 332 (30.7%).
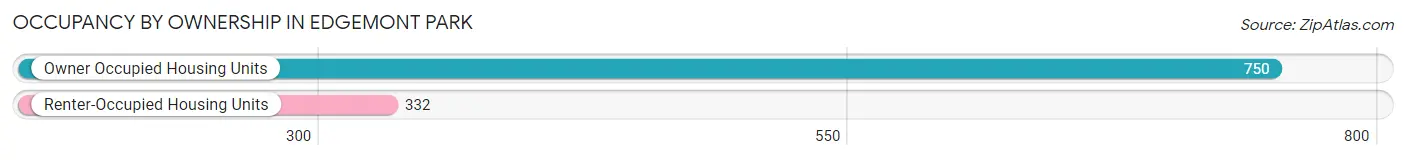
| Occupancy | # Housing Units | % Housing Units |
| Owner Occupied Housing Units | 750 | 69.3% |
| Renter-Occupied Housing Units | 332 | 30.7% |
| Total Occupied Housing Units | 1,082 | 100.0% |
Occupancy by Household Size in Edgemont Park
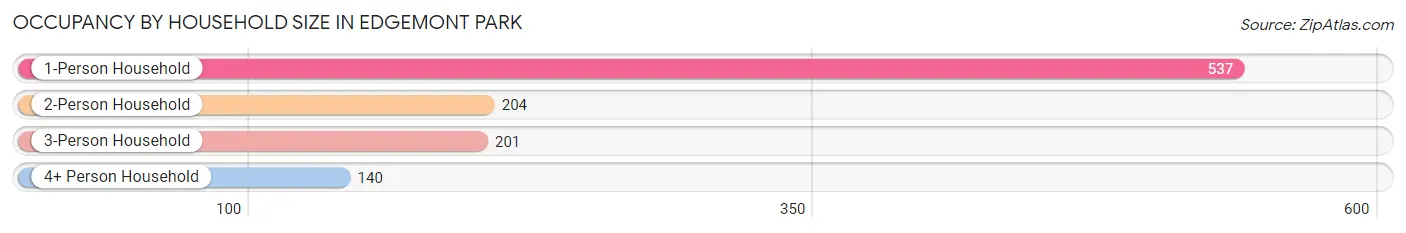
| Household Size | # Housing Units | % Housing Units |
| 1-Person Household | 537 | 49.6% |
| 2-Person Household | 204 | 18.9% |
| 3-Person Household | 201 | 18.6% |
| 4+ Person Household | 140 | 12.9% |
| Total Housing Units | 1,082 | 100.0% |
Occupancy by Ownership by Household Size in Edgemont Park
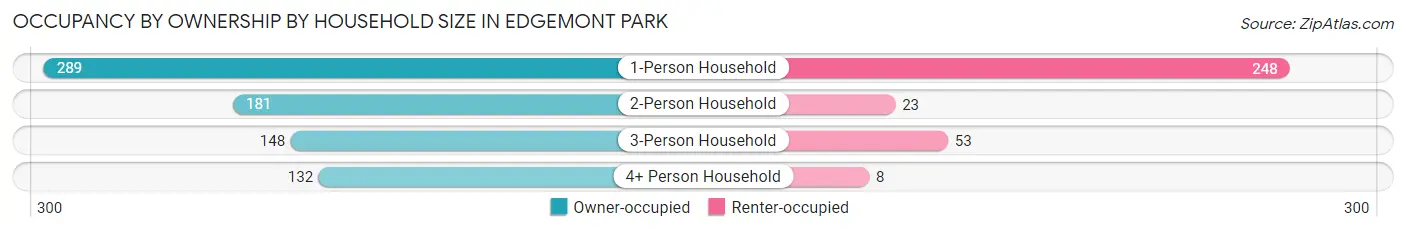
| Household Size | Owner-occupied | Renter-occupied |
| 1-Person Household | 289 (53.8%) | 248 (46.2%) |
| 2-Person Household | 181 (88.7%) | 23 (11.3%) |
| 3-Person Household | 148 (73.6%) | 53 (26.4%) |
| 4+ Person Household | 132 (94.3%) | 8 (5.7%) |
| Total Housing Units | 750 (69.3%) | 332 (30.7%) |
Occupancy by Educational Attainment in Edgemont Park
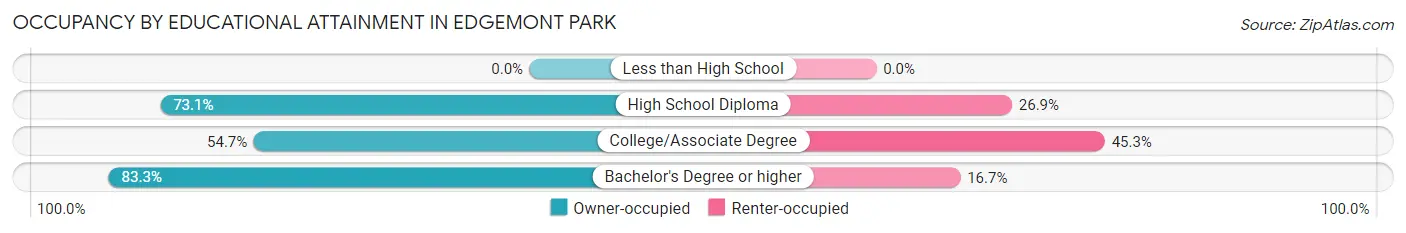
| Household Size | Owner-occupied | Renter-occupied |
| Less than High School | 0 (0.0%) | 0 (0.0%) |
| High School Diploma | 212 (73.1%) | 78 (26.9%) |
| College/Associate Degree | 233 (54.7%) | 193 (45.3%) |
| Bachelor's Degree or higher | 305 (83.3%) | 61 (16.7%) |
Occupancy by Age of Householder in Edgemont Park
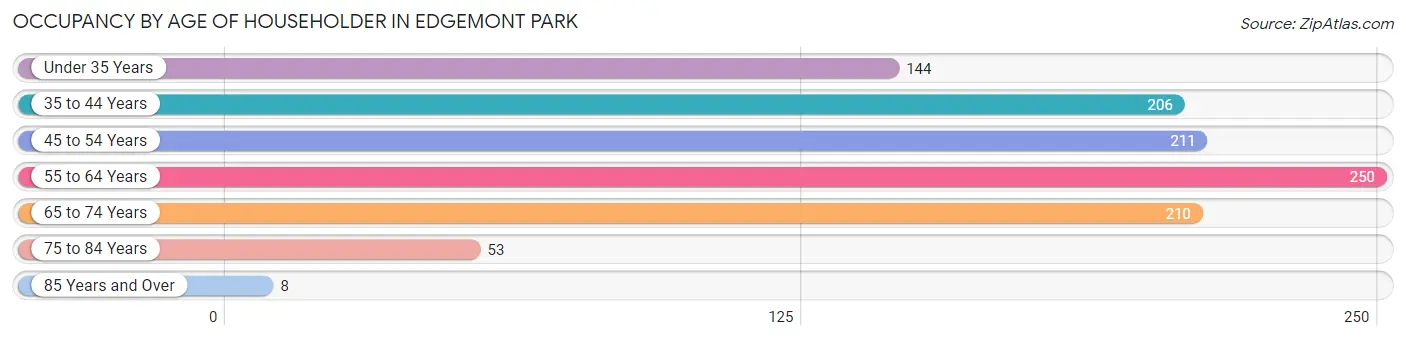
| Age Bracket | # Households | % Households |
| Under 35 Years | 144 | 13.3% |
| 35 to 44 Years | 206 | 19.0% |
| 45 to 54 Years | 211 | 19.5% |
| 55 to 64 Years | 250 | 23.1% |
| 65 to 74 Years | 210 | 19.4% |
| 75 to 84 Years | 53 | 4.9% |
| 85 Years and Over | 8 | 0.7% |
| Total | 1,082 | 100.0% |
Housing Finances in Edgemont Park
Median Income by Occupancy in Edgemont Park
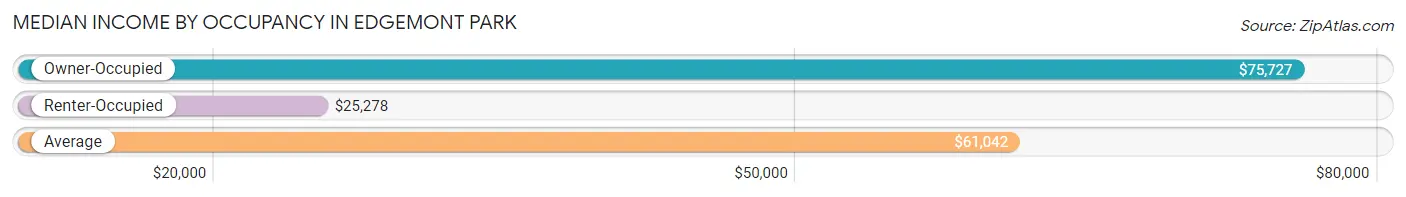
| Occupancy Type | # Households | Median Income |
| Owner-Occupied | 750 (69.3%) | $75,727 |
| Renter-Occupied | 332 (30.7%) | $25,278 |
| Average | 1,082 (100.0%) | $61,042 |
Occupancy by Householder Income Bracket in Edgemont Park
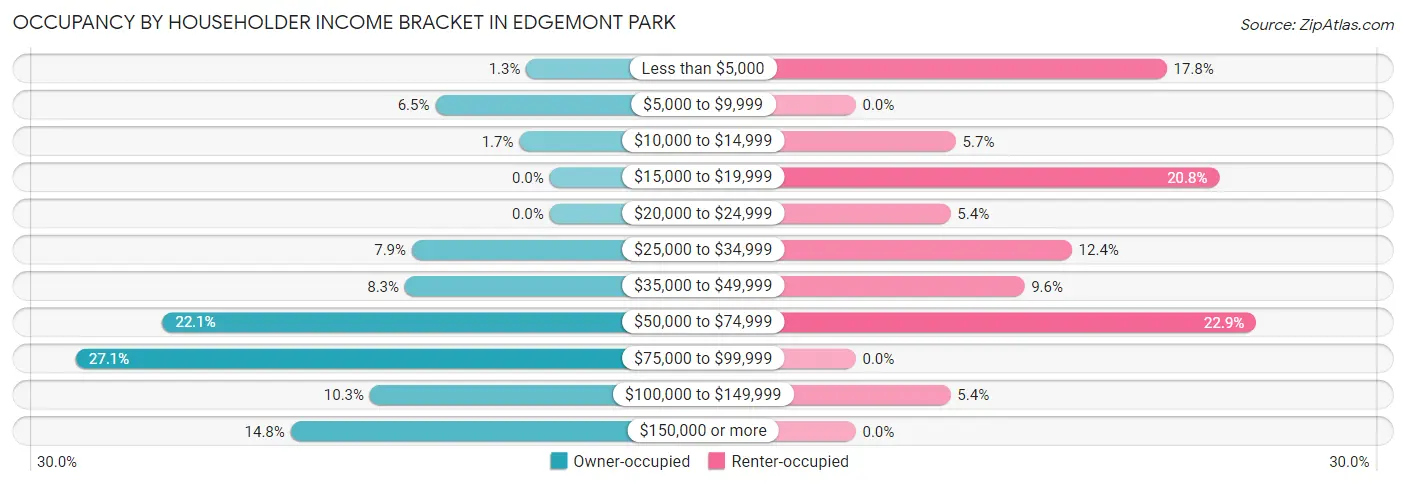
| Income Bracket | Owner-occupied | Renter-occupied |
| Less than $5,000 | 10 (1.3%) | 59 (17.8%) |
| $5,000 to $9,999 | 49 (6.5%) | 0 (0.0%) |
| $10,000 to $14,999 | 13 (1.7%) | 19 (5.7%) |
| $15,000 to $19,999 | 0 (0.0%) | 69 (20.8%) |
| $20,000 to $24,999 | 0 (0.0%) | 18 (5.4%) |
| $25,000 to $34,999 | 59 (7.9%) | 41 (12.3%) |
| $35,000 to $49,999 | 62 (8.3%) | 32 (9.6%) |
| $50,000 to $74,999 | 166 (22.1%) | 76 (22.9%) |
| $75,000 to $99,999 | 203 (27.1%) | 0 (0.0%) |
| $100,000 to $149,999 | 77 (10.3%) | 18 (5.4%) |
| $150,000 or more | 111 (14.8%) | 0 (0.0%) |
| Total | 750 (100.0%) | 332 (100.0%) |
Monthly Housing Cost Tiers in Edgemont Park
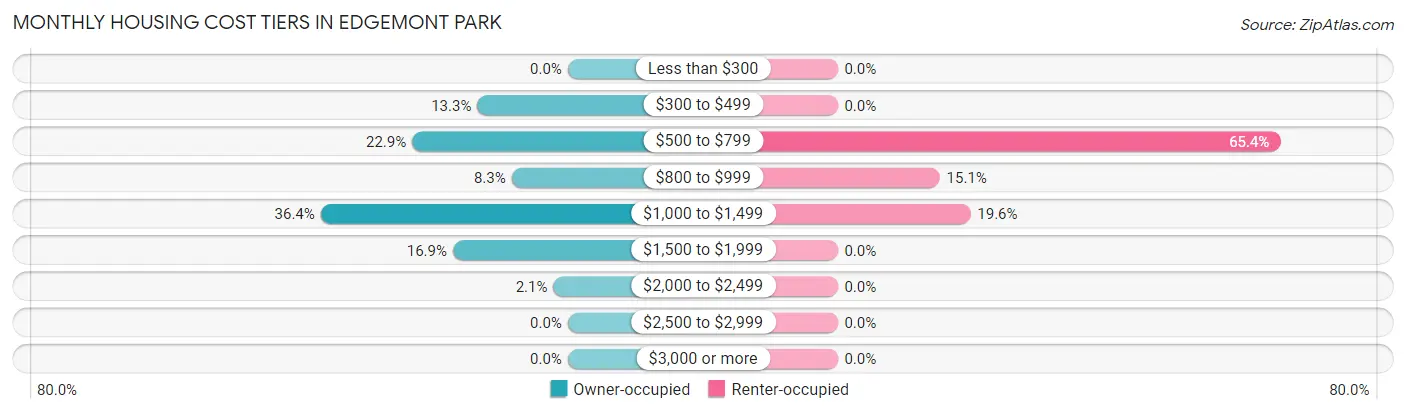
| Monthly Cost | Owner-occupied | Renter-occupied |
| Less than $300 | 0 (0.0%) | 0 (0.0%) |
| $300 to $499 | 100 (13.3%) | 0 (0.0%) |
| $500 to $799 | 172 (22.9%) | 217 (65.4%) |
| $800 to $999 | 62 (8.3%) | 50 (15.1%) |
| $1,000 to $1,499 | 273 (36.4%) | 65 (19.6%) |
| $1,500 to $1,999 | 127 (16.9%) | 0 (0.0%) |
| $2,000 to $2,499 | 16 (2.1%) | 0 (0.0%) |
| $2,500 to $2,999 | 0 (0.0%) | 0 (0.0%) |
| $3,000 or more | 0 (0.0%) | 0 (0.0%) |
| Total | 750 (100.0%) | 332 (100.0%) |
Physical Housing Characteristics in Edgemont Park
Housing Structures in Edgemont Park
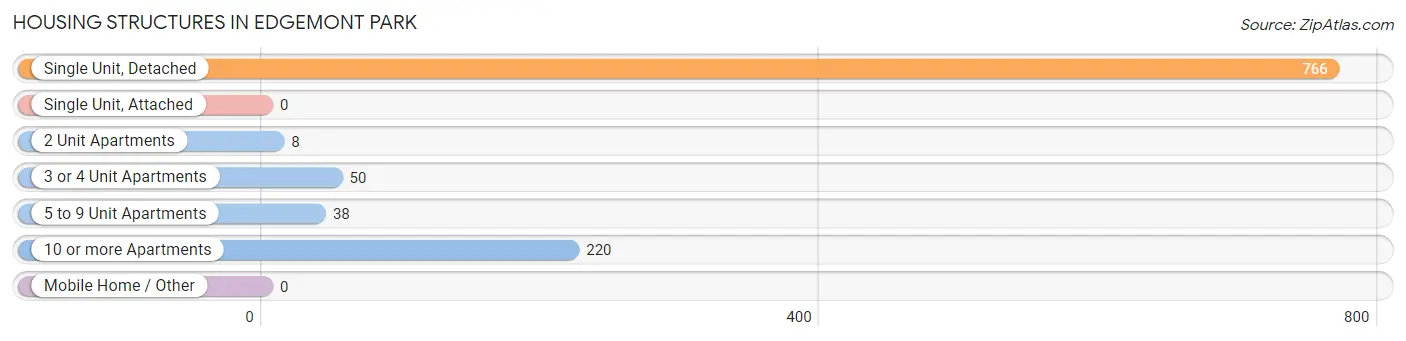
| Structure Type | # Housing Units | % Housing Units |
| Single Unit, Detached | 766 | 70.8% |
| Single Unit, Attached | 0 | 0.0% |
| 2 Unit Apartments | 8 | 0.7% |
| 3 or 4 Unit Apartments | 50 | 4.6% |
| 5 to 9 Unit Apartments | 38 | 3.5% |
| 10 or more Apartments | 220 | 20.3% |
| Mobile Home / Other | 0 | 0.0% |
| Total | 1,082 | 100.0% |
Housing Structures by Occupancy in Edgemont Park
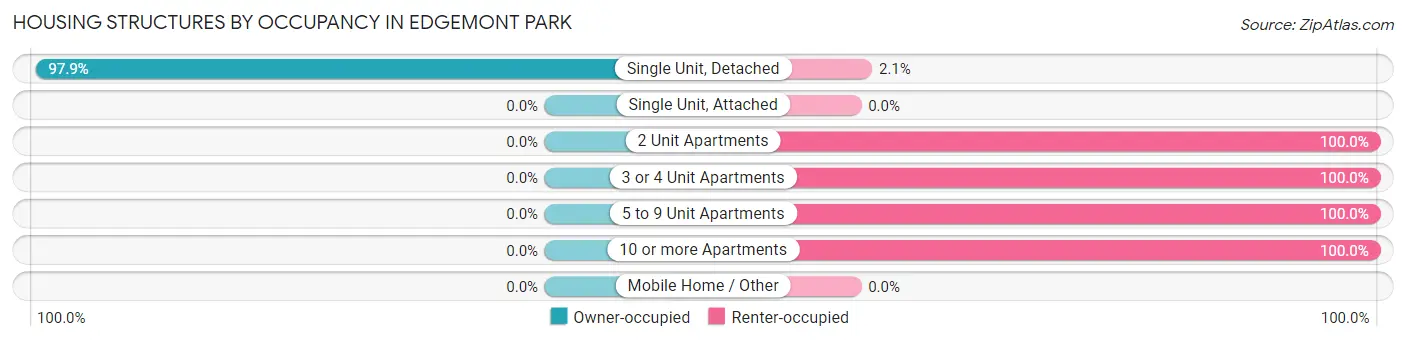
| Structure Type | Owner-occupied | Renter-occupied |
| Single Unit, Detached | 750 (97.9%) | 16 (2.1%) |
| Single Unit, Attached | 0 (0.0%) | 0 (0.0%) |
| 2 Unit Apartments | 0 (0.0%) | 8 (100.0%) |
| 3 or 4 Unit Apartments | 0 (0.0%) | 50 (100.0%) |
| 5 to 9 Unit Apartments | 0 (0.0%) | 38 (100.0%) |
| 10 or more Apartments | 0 (0.0%) | 220 (100.0%) |
| Mobile Home / Other | 0 (0.0%) | 0 (0.0%) |
| Total | 750 (69.3%) | 332 (30.7%) |
Housing Structures by Number of Rooms in Edgemont Park
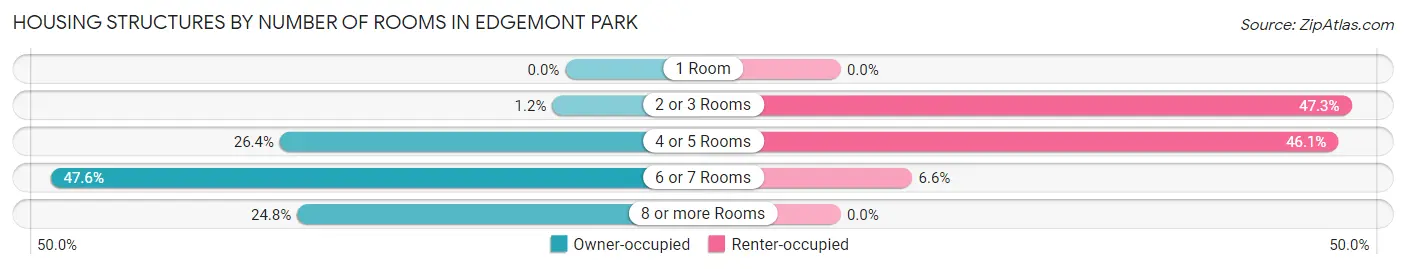
| Number of Rooms | Owner-occupied | Renter-occupied |
| 1 Room | 0 (0.0%) | 0 (0.0%) |
| 2 or 3 Rooms | 9 (1.2%) | 157 (47.3%) |
| 4 or 5 Rooms | 198 (26.4%) | 153 (46.1%) |
| 6 or 7 Rooms | 357 (47.6%) | 22 (6.6%) |
| 8 or more Rooms | 186 (24.8%) | 0 (0.0%) |
| Total | 750 (100.0%) | 332 (100.0%) |
Housing Structure by Heating Type in Edgemont Park
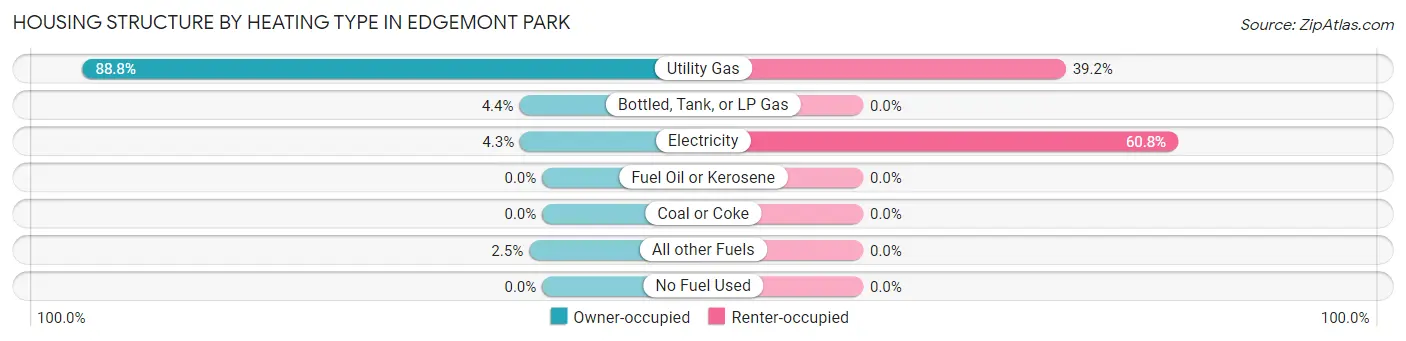
| Heating Type | Owner-occupied | Renter-occupied |
| Utility Gas | 666 (88.8%) | 130 (39.2%) |
| Bottled, Tank, or LP Gas | 33 (4.4%) | 0 (0.0%) |
| Electricity | 32 (4.3%) | 202 (60.8%) |
| Fuel Oil or Kerosene | 0 (0.0%) | 0 (0.0%) |
| Coal or Coke | 0 (0.0%) | 0 (0.0%) |
| All other Fuels | 19 (2.5%) | 0 (0.0%) |
| No Fuel Used | 0 (0.0%) | 0 (0.0%) |
| Total | 750 (100.0%) | 332 (100.0%) |
Household Vehicle Usage in Edgemont Park
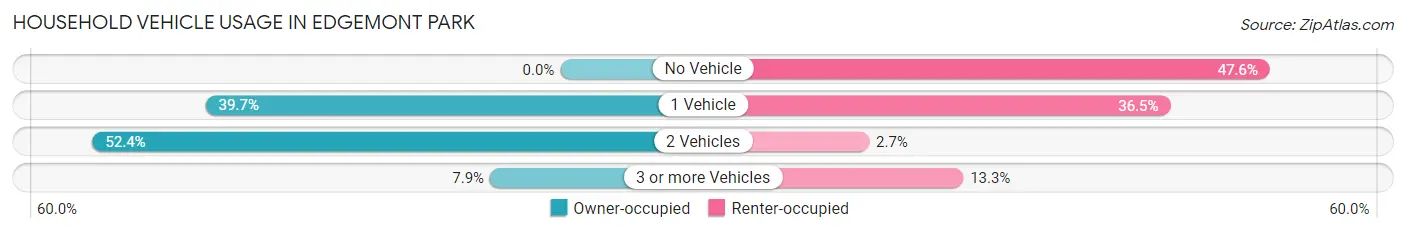
| Vehicles per Household | Owner-occupied | Renter-occupied |
| No Vehicle | 0 (0.0%) | 158 (47.6%) |
| 1 Vehicle | 298 (39.7%) | 121 (36.4%) |
| 2 Vehicles | 393 (52.4%) | 9 (2.7%) |
| 3 or more Vehicles | 59 (7.9%) | 44 (13.3%) |
| Total | 750 (100.0%) | 332 (100.0%) |
Real Estate & Mortgages in Edgemont Park
Real Estate and Mortgage Overview in Edgemont Park
| Characteristic | Without Mortgage | With Mortgage |
| Housing Units | 278 | 472 |
| Median Property Value | $139,000 | $163,500 |
| Median Household Income | $48,750 | $98 |
| Monthly Housing Costs | $542 | $0 |
| Real Estate Taxes | $3,157 | $0 |
Property Value by Mortgage Status in Edgemont Park
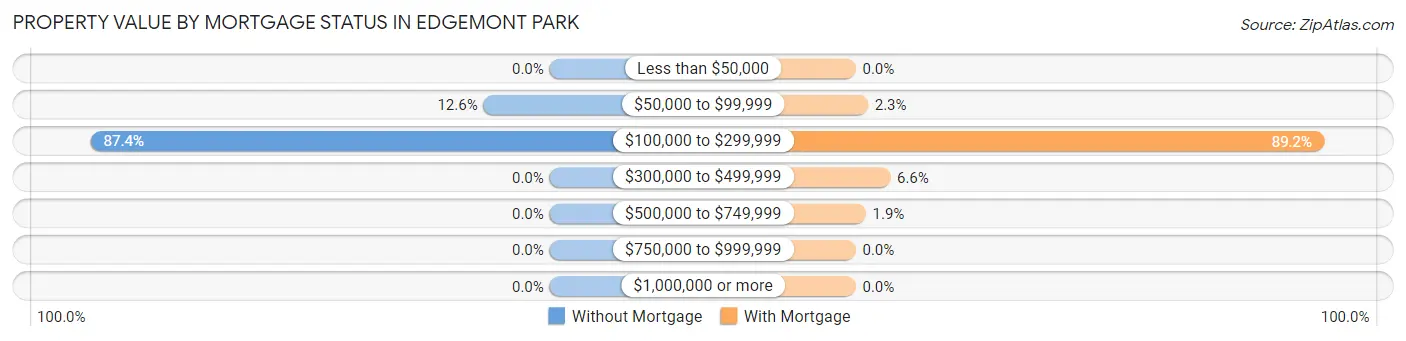
| Property Value | Without Mortgage | With Mortgage |
| Less than $50,000 | 0 (0.0%) | 0 (0.0%) |
| $50,000 to $99,999 | 35 (12.6%) | 11 (2.3%) |
| $100,000 to $299,999 | 243 (87.4%) | 421 (89.2%) |
| $300,000 to $499,999 | 0 (0.0%) | 31 (6.6%) |
| $500,000 to $749,999 | 0 (0.0%) | 9 (1.9%) |
| $750,000 to $999,999 | 0 (0.0%) | 0 (0.0%) |
| $1,000,000 or more | 0 (0.0%) | 0 (0.0%) |
| Total | 278 (100.0%) | 472 (100.0%) |
Household Income by Mortgage Status in Edgemont Park
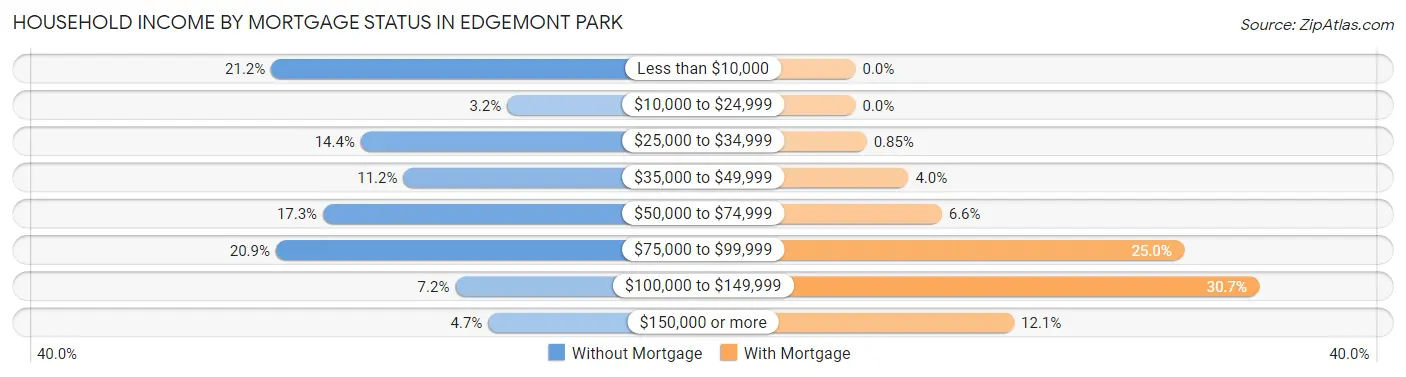
| Household Income | Without Mortgage | With Mortgage |
| Less than $10,000 | 59 (21.2%) | 0 (0.0%) |
| $10,000 to $24,999 | 9 (3.2%) | 0 (0.0%) |
| $25,000 to $34,999 | 40 (14.4%) | 4 (0.9%) |
| $35,000 to $49,999 | 31 (11.2%) | 19 (4.0%) |
| $50,000 to $74,999 | 48 (17.3%) | 31 (6.6%) |
| $75,000 to $99,999 | 58 (20.9%) | 118 (25.0%) |
| $100,000 to $149,999 | 20 (7.2%) | 145 (30.7%) |
| $150,000 or more | 13 (4.7%) | 57 (12.1%) |
| Total | 278 (100.0%) | 472 (100.0%) |
Property Value to Household Income Ratio in Edgemont Park
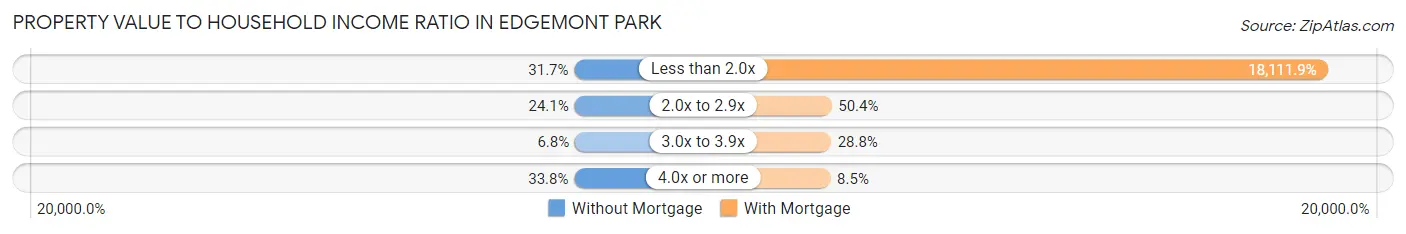
| Value-to-Income Ratio | Without Mortgage | With Mortgage |
| Less than 2.0x | 88 (31.7%) | 85,488 (18,111.9%) |
| 2.0x to 2.9x | 67 (24.1%) | 238 (50.4%) |
| 3.0x to 3.9x | 19 (6.8%) | 136 (28.8%) |
| 4.0x or more | 94 (33.8%) | 40 (8.5%) |
| Total | 278 (100.0%) | 472 (100.0%) |
Real Estate Taxes by Mortgage Status in Edgemont Park
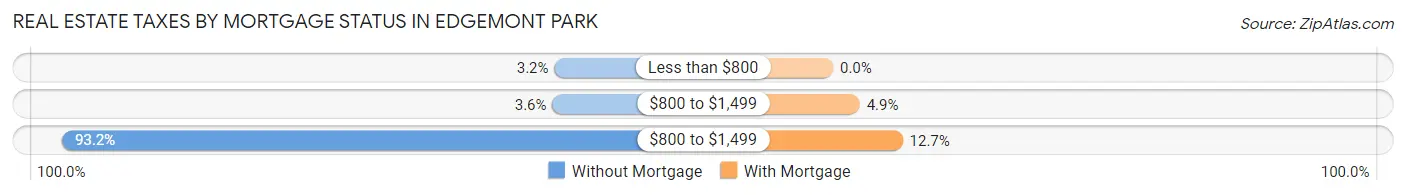
| Property Taxes | Without Mortgage | With Mortgage |
| Less than $800 | 9 (3.2%) | 0 (0.0%) |
| $800 to $1,499 | 10 (3.6%) | 23 (4.9%) |
| $800 to $1,499 | 259 (93.2%) | 60 (12.7%) |
| Total | 278 (100.0%) | 472 (100.0%) |
Health & Disability in Edgemont Park
Health Insurance Coverage by Age in Edgemont Park
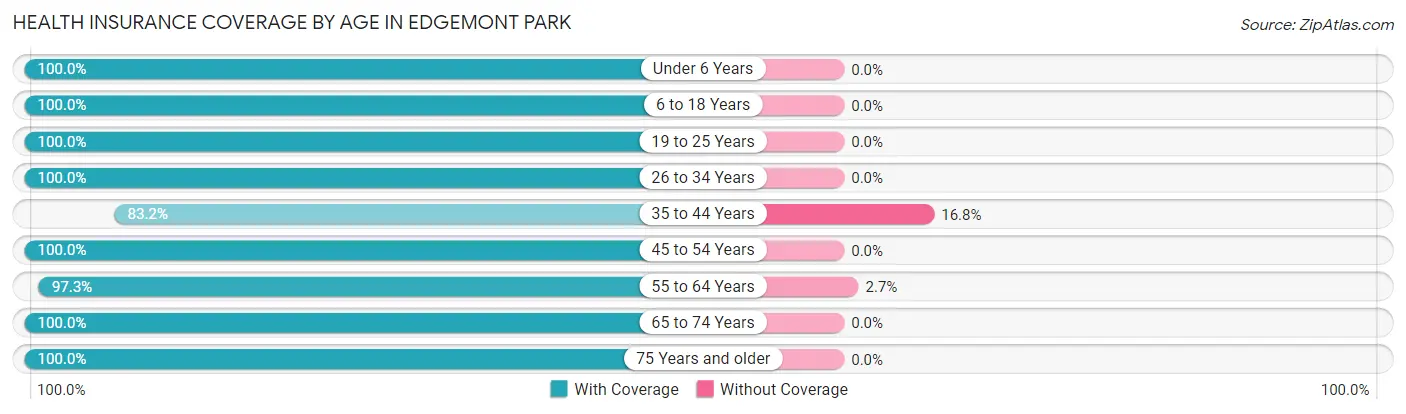
| Age Bracket | With Coverage | Without Coverage |
| Under 6 Years | 149 (100.0%) | 0 (0.0%) |
| 6 to 18 Years | 348 (100.0%) | 0 (0.0%) |
| 19 to 25 Years | 263 (100.0%) | 0 (0.0%) |
| 26 to 34 Years | 262 (100.0%) | 0 (0.0%) |
| 35 to 44 Years | 332 (83.2%) | 67 (16.8%) |
| 45 to 54 Years | 252 (100.0%) | 0 (0.0%) |
| 55 to 64 Years | 364 (97.3%) | 10 (2.7%) |
| 65 to 74 Years | 268 (100.0%) | 0 (0.0%) |
| 75 Years and older | 107 (100.0%) | 0 (0.0%) |
| Total | 2,345 (96.8%) | 77 (3.2%) |
Health Insurance Coverage by Citizenship Status in Edgemont Park
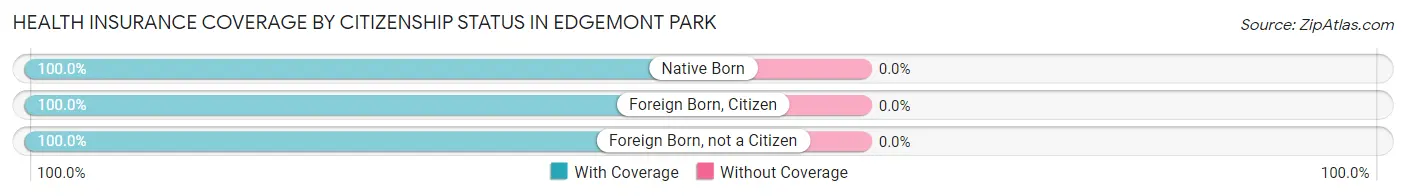
| Citizenship Status | With Coverage | Without Coverage |
| Native Born | 149 (100.0%) | 0 (0.0%) |
| Foreign Born, Citizen | 348 (100.0%) | 0 (0.0%) |
| Foreign Born, not a Citizen | 263 (100.0%) | 0 (0.0%) |
Health Insurance Coverage by Household Income in Edgemont Park
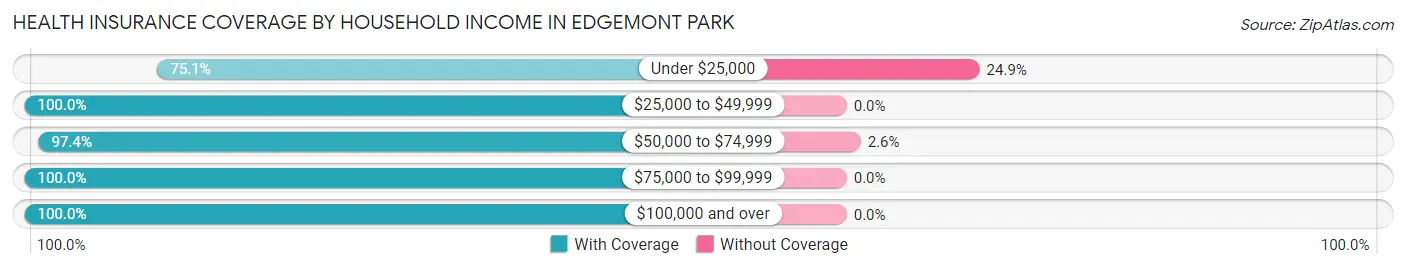
| Household Income | With Coverage | Without Coverage |
| Under $25,000 | 178 (75.1%) | 59 (24.9%) |
| $25,000 to $49,999 | 272 (100.0%) | 0 (0.0%) |
| $50,000 to $74,999 | 668 (97.4%) | 18 (2.6%) |
| $75,000 to $99,999 | 659 (100.0%) | 0 (0.0%) |
| $100,000 and over | 568 (100.0%) | 0 (0.0%) |
Public vs Private Health Insurance Coverage by Age in Edgemont Park
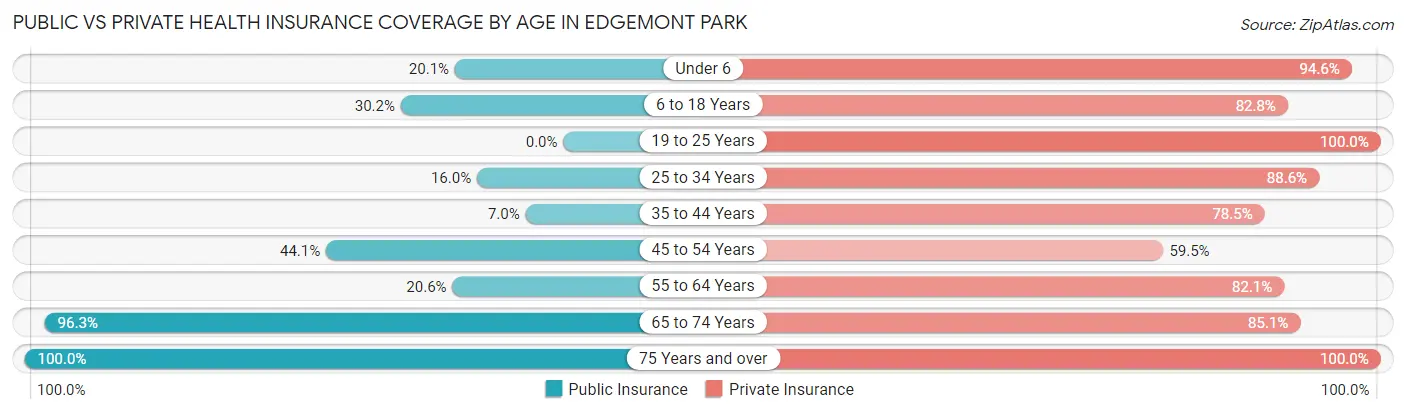
| Age Bracket | Public Insurance | Private Insurance |
| Under 6 | 30 (20.1%) | 141 (94.6%) |
| 6 to 18 Years | 105 (30.2%) | 288 (82.8%) |
| 19 to 25 Years | 0 (0.0%) | 263 (100.0%) |
| 25 to 34 Years | 42 (16.0%) | 232 (88.5%) |
| 35 to 44 Years | 28 (7.0%) | 313 (78.4%) |
| 45 to 54 Years | 111 (44.1%) | 150 (59.5%) |
| 55 to 64 Years | 77 (20.6%) | 307 (82.1%) |
| 65 to 74 Years | 258 (96.3%) | 228 (85.1%) |
| 75 Years and over | 107 (100.0%) | 107 (100.0%) |
| Total | 758 (31.3%) | 2,029 (83.8%) |
Disability Status by Sex by Age in Edgemont Park
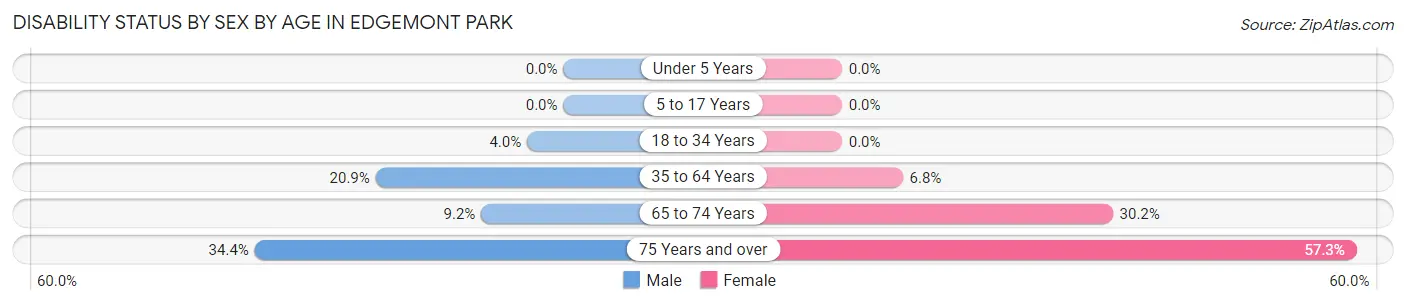
| Age Bracket | Male | Female |
| Under 5 Years | 0 (0.0%) | 0 (0.0%) |
| 5 to 17 Years | 0 (0.0%) | 0 (0.0%) |
| 18 to 34 Years | 11 (4.0%) | 0 (0.0%) |
| 35 to 64 Years | 97 (20.9%) | 38 (6.8%) |
| 65 to 74 Years | 13 (9.1%) | 38 (30.2%) |
| 75 Years and over | 11 (34.4%) | 43 (57.3%) |
Disability Class by Sex by Age in Edgemont Park
Disability Class: Hearing Difficulty
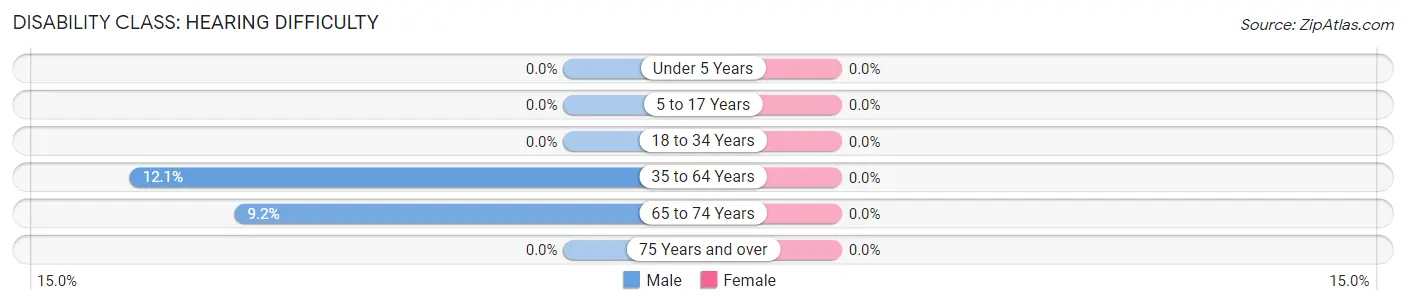
| Age Bracket | Male | Female |
| Under 5 Years | 0 (0.0%) | 0 (0.0%) |
| 5 to 17 Years | 0 (0.0%) | 0 (0.0%) |
| 18 to 34 Years | 0 (0.0%) | 0 (0.0%) |
| 35 to 64 Years | 56 (12.1%) | 0 (0.0%) |
| 65 to 74 Years | 13 (9.1%) | 0 (0.0%) |
| 75 Years and over | 0 (0.0%) | 0 (0.0%) |
Disability Class: Vision Difficulty
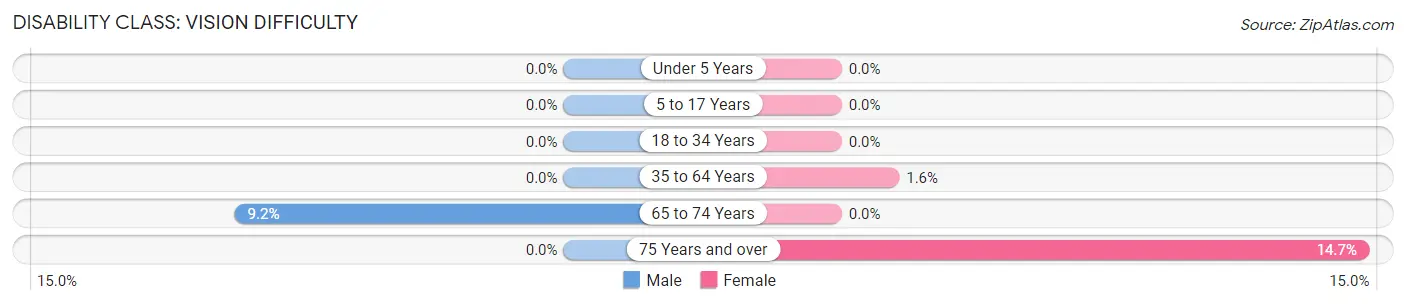
| Age Bracket | Male | Female |
| Under 5 Years | 0 (0.0%) | 0 (0.0%) |
| 5 to 17 Years | 0 (0.0%) | 0 (0.0%) |
| 18 to 34 Years | 0 (0.0%) | 0 (0.0%) |
| 35 to 64 Years | 0 (0.0%) | 9 (1.6%) |
| 65 to 74 Years | 13 (9.1%) | 0 (0.0%) |
| 75 Years and over | 0 (0.0%) | 11 (14.7%) |
Disability Class: Cognitive Difficulty
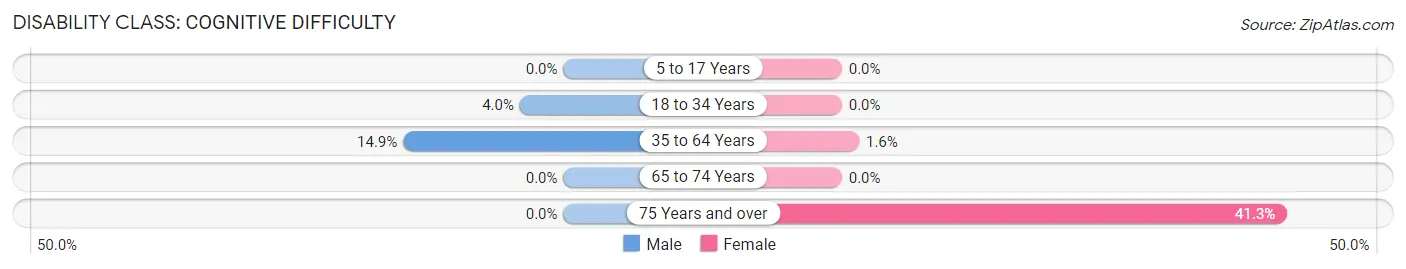
| Age Bracket | Male | Female |
| 5 to 17 Years | 0 (0.0%) | 0 (0.0%) |
| 18 to 34 Years | 11 (4.0%) | 0 (0.0%) |
| 35 to 64 Years | 69 (14.9%) | 9 (1.6%) |
| 65 to 74 Years | 0 (0.0%) | 0 (0.0%) |
| 75 Years and over | 0 (0.0%) | 31 (41.3%) |
Disability Class: Ambulatory Difficulty
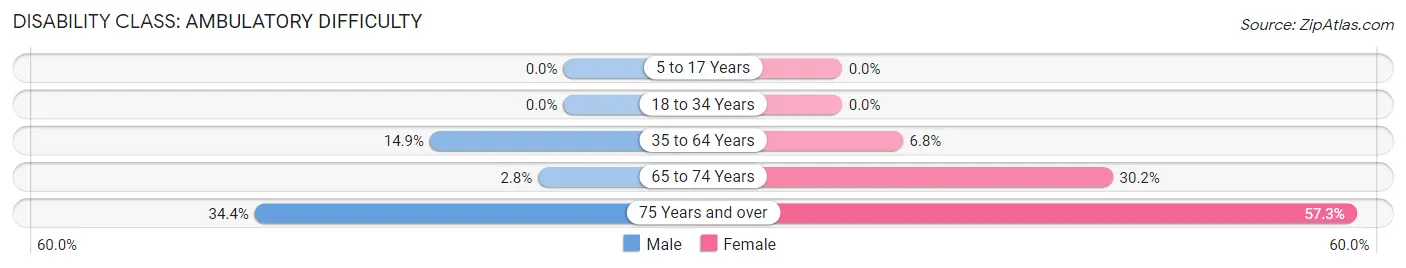
| Age Bracket | Male | Female |
| 5 to 17 Years | 0 (0.0%) | 0 (0.0%) |
| 18 to 34 Years | 0 (0.0%) | 0 (0.0%) |
| 35 to 64 Years | 69 (14.9%) | 38 (6.8%) |
| 65 to 74 Years | 4 (2.8%) | 38 (30.2%) |
| 75 Years and over | 11 (34.4%) | 43 (57.3%) |
Disability Class: Self-Care Difficulty
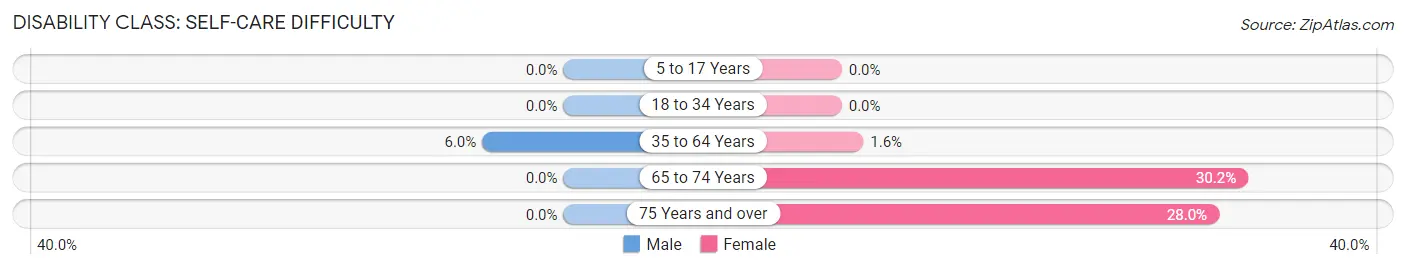
| Age Bracket | Male | Female |
| 5 to 17 Years | 0 (0.0%) | 0 (0.0%) |
| 18 to 34 Years | 0 (0.0%) | 0 (0.0%) |
| 35 to 64 Years | 28 (6.0%) | 9 (1.6%) |
| 65 to 74 Years | 0 (0.0%) | 38 (30.2%) |
| 75 Years and over | 0 (0.0%) | 21 (28.0%) |
Technology Access in Edgemont Park
Computing Device Access in Edgemont Park
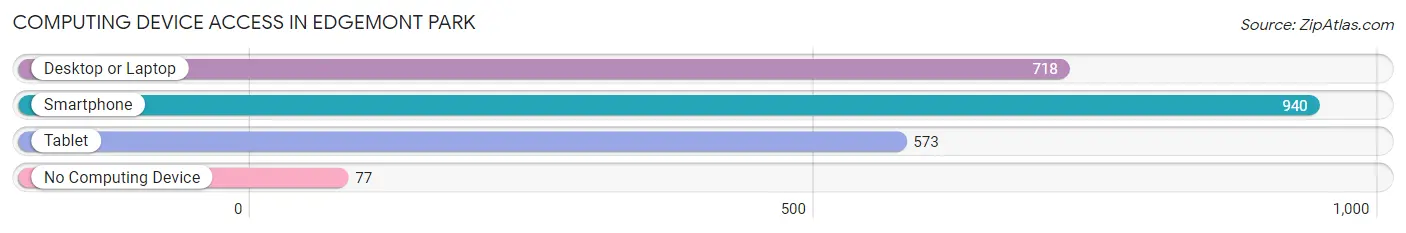
| Device Type | # Households | % Households |
| Desktop or Laptop | 718 | 66.4% |
| Smartphone | 940 | 86.9% |
| Tablet | 573 | 53.0% |
| No Computing Device | 77 | 7.1% |
| Total | 1,082 | 100.0% |
Internet Access in Edgemont Park
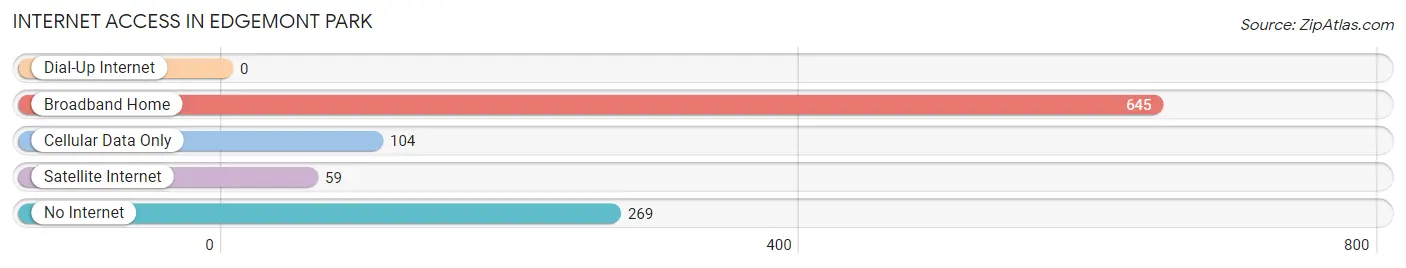
| Internet Type | # Households | % Households |
| Dial-Up Internet | 0 | 0.0% |
| Broadband Home | 645 | 59.6% |
| Cellular Data Only | 104 | 9.6% |
| Satellite Internet | 59 | 5.4% |
| No Internet | 269 | 24.9% |
| Total | 1,082 | 100.0% |
Edgemont Park Summary
Edgemont Park is a small, unincorporated community located in the Upper Peninsula of Michigan. It is situated in the western part of the state, near the border with Wisconsin. The community is located in the township of Edgemont Park, which is part of the larger Marquette County. The population of Edgemont Park was estimated to be around 200 people in 2020.
Geography
Edgemont Park is located in the western part of the Upper Peninsula of Michigan, near the border with Wisconsin. The community is situated in the township of Edgemont Park, which is part of the larger Marquette County. The terrain of the area is mostly flat, with some rolling hills. The area is heavily forested, with a mix of deciduous and coniferous trees. The climate of the area is generally cold and snowy in the winter, and warm and humid in the summer.
Economy
The economy of Edgemont Park is largely based on tourism and outdoor recreation. The area is home to several popular outdoor attractions, including the Edgemont Park Ski Area, which offers skiing and snowboarding in the winter months. The area is also home to several lakes and rivers, which offer fishing, boating, and other recreational activities. In addition, the area is home to several small businesses, including restaurants, shops, and lodging.
Demographics
The population of Edgemont Park was estimated to be around 200 people in 2020. The racial makeup of the community is predominantly white, with a small percentage of African Americans, Native Americans, and other races. The median household income in the area is around $50,000, and the median home value is around $150,000. The majority of the population is employed in the tourism and outdoor recreation industries.
History
Edgemont Park was first settled in the late 1800s by a group of Finnish immigrants. The area was originally known as “Finn Town”, and the settlers built a small community around the area. The area was later renamed Edgemont Park, and the community grew steadily over the years. In the early 1900s, the area became a popular tourist destination, and the ski area was established in the 1930s. The area has remained a popular tourist destination ever since, and the community continues to thrive today.
Common Questions
What is Per Capita Income in Edgemont Park?
Per Capita income in Edgemont Park is $29,977.
What is the Median Family Income in Edgemont Park?
Median Family Income in Edgemont Park is $78,125.
What is the Median Household income in Edgemont Park?
Median Household Income in Edgemont Park is $61,042.
What is Income or Wage Gap in Edgemont Park?
Income or Wage Gap in Edgemont Park is 43.6%.
Women in Edgemont Park earn 56.4 cents for every dollar earned by a man.
What is Inequality or Gini Index in Edgemont Park?
Inequality or Gini Index in Edgemont Park is 0.40.
What is the Total Population of Edgemont Park?
Total Population of Edgemont Park is 2,444.
What is the Total Male Population of Edgemont Park?
Total Male Population of Edgemont Park is 1,175.
What is the Total Female Population of Edgemont Park?
Total Female Population of Edgemont Park is 1,269.
What is the Ratio of Males per 100 Females in Edgemont Park?
There are 92.59 Males per 100 Females in Edgemont Park.
What is the Ratio of Females per 100 Males in Edgemont Park?
There are 108.00 Females per 100 Males in Edgemont Park.
What is the Median Population Age in Edgemont Park?
Median Population Age in Edgemont Park is 38.7 Years.
What is the Average Family Size in Edgemont Park
Average Family Size in Edgemont Park is 3.5 People.
What is the Average Household Size in Edgemont Park
Average Household Size in Edgemont Park is 2.2 People.
How Large is the Labor Force in Edgemont Park?
There are 1,368 People in the Labor Forcein in Edgemont Park.
What is the Percentage of People in the Labor Force in Edgemont Park?
66.6% of People are in the Labor Force in Edgemont Park.
What is the Unemployment Rate in Edgemont Park?
Unemployment Rate in Edgemont Park is 6.9%.