Zip Codes with the Highest Percentage of Population Employed in Life, Physical & Social Science in Michigan
RELATED REPORTS & OPTIONS
Life, Physical & Social Science
Michigan
Compare Zip Codes
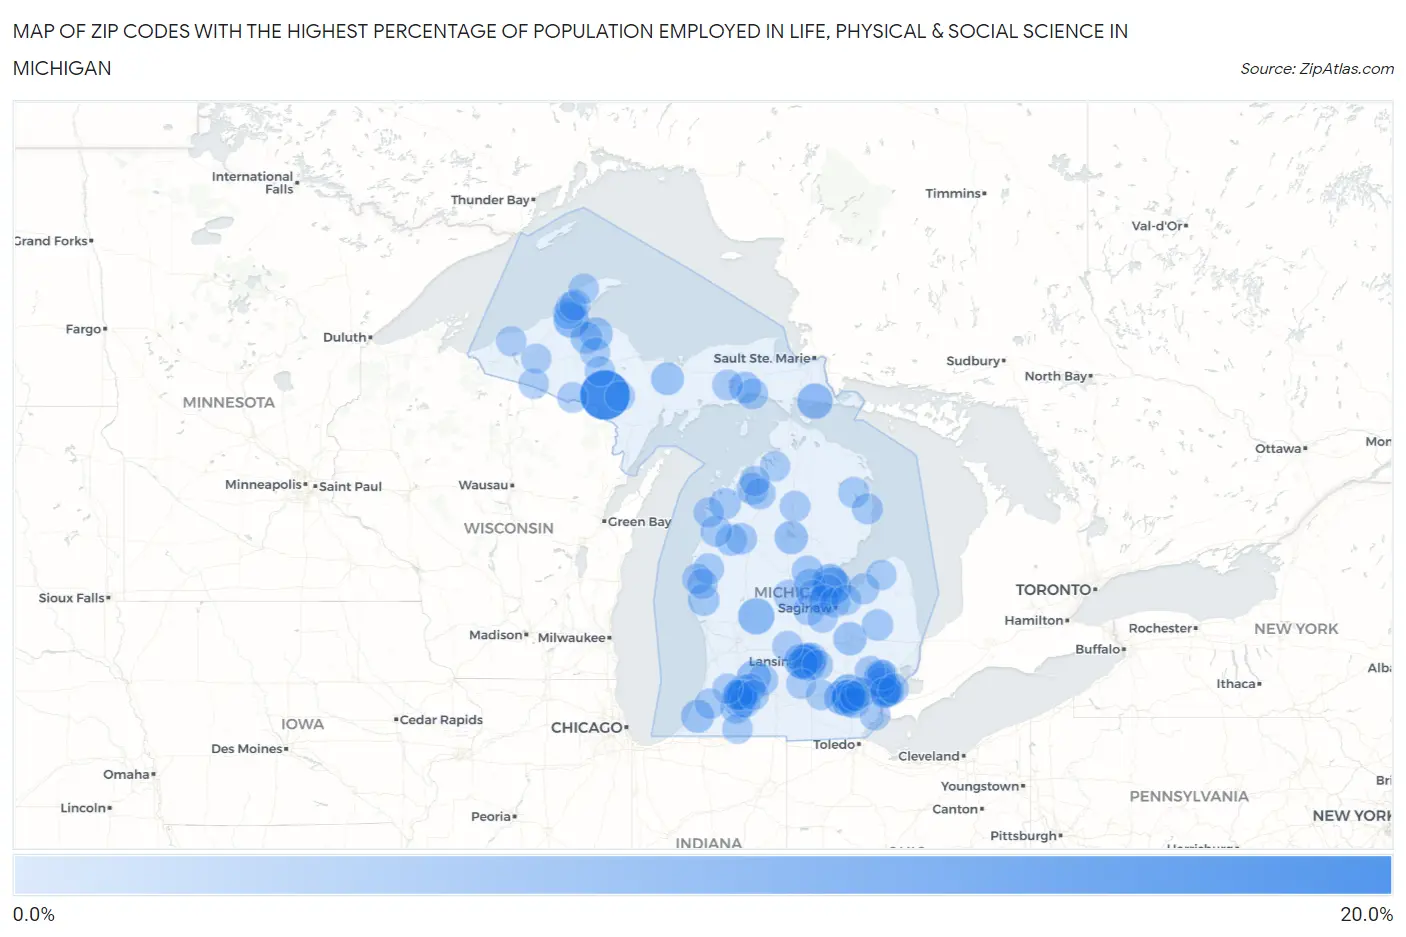
Map of Zip Codes with the Highest Percentage of Population Employed in Life, Physical & Social Science in Michigan
0.0%
20.0%
Zip Codes with the Highest Percentage of Population Employed in Life, Physical & Social Science in Michigan
| Zip Code | % Employed | vs State | vs National | |
| 1. | 49881 | 16.1% | 0.88%(+15.2)#1 | 1.1%(+15.0)#95 |
| 2. | 48631 | 6.8% | 0.88%(+5.93)#2 | 1.1%(+5.72)#427 |
| 3. | 48105 | 6.2% | 0.88%(+5.31)#3 | 1.1%(+5.10)#518 |
| 4. | 49347 | 6.0% | 0.88%(+5.13)#4 | 1.1%(+4.92)#548 |
| 5. | 49719 | 5.5% | 0.88%(+4.59)#5 | 1.1%(+4.38)#632 |
| 6. | 49916 | 5.4% | 0.88%(+4.54)#6 | 1.1%(+4.33)#649 |
| 7. | 48634 | 4.9% | 0.88%(+3.99)#7 | 1.1%(+3.78)#804 |
| 8. | 48103 | 4.6% | 0.88%(+3.71)#8 | 1.1%(+3.51)#887 |
| 9. | 48933 | 4.5% | 0.88%(+3.66)#9 | 1.1%(+3.45)#913 |
| 10. | 49046 | 4.4% | 0.88%(+3.53)#10 | 1.1%(+3.32)#958 |
| 11. | 48864 | 4.4% | 0.88%(+3.52)#11 | 1.1%(+3.31)#964 |
| 12. | 48208 | 4.4% | 0.88%(+3.51)#12 | 1.1%(+3.30)#968 |
| 13. | 48104 | 4.3% | 0.88%(+3.39)#13 | 1.1%(+3.18)#1,017 |
| 14. | 48109 | 4.0% | 0.88%(+3.16)#14 | 1.1%(+2.96)#1,124 |
| 15. | 48629 | 4.0% | 0.88%(+3.09)#15 | 1.1%(+2.89)#1,164 |
| 16. | 48108 | 3.9% | 0.88%(+3.06)#16 | 1.1%(+2.85)#1,189 |
| 17. | 48502 | 3.8% | 0.88%(+2.91)#17 | 1.1%(+2.71)#1,265 |
| 18. | 48825 | 3.7% | 0.88%(+2.82)#18 | 1.1%(+2.61)#1,317 |
| 19. | 49126 | 3.7% | 0.88%(+2.81)#19 | 1.1%(+2.61)#1,318 |
| 20. | 48070 | 3.7% | 0.88%(+2.77)#20 | 1.1%(+2.56)#1,342 |
| 21. | 49962 | 3.6% | 0.88%(+2.69)#21 | 1.1%(+2.48)#1,382 |
| 22. | 49816 | 3.5% | 0.88%(+2.65)#22 | 1.1%(+2.45)#1,399 |
| 23. | 48840 | 3.0% | 0.88%(+2.09)#23 | 1.1%(+1.88)#1,909 |
| 24. | 49629 | 2.9% | 0.88%(+2.05)#24 | 1.1%(+1.84)#1,957 |
| 25. | 49946 | 2.9% | 0.88%(+2.02)#25 | 1.1%(+1.82)#1,984 |
| 26. | 49087 | 2.9% | 0.88%(+1.97)#26 | 1.1%(+1.77)#2,043 |
| 27. | 48202 | 2.8% | 0.88%(+1.90)#27 | 1.1%(+1.69)#2,137 |
| 28. | 49024 | 2.8% | 0.88%(+1.89)#28 | 1.1%(+1.68)#2,147 |
| 29. | 48657 | 2.8% | 0.88%(+1.89)#29 | 1.1%(+1.68)#2,152 |
| 30. | 48611 | 2.8% | 0.88%(+1.88)#30 | 1.1%(+1.68)#2,154 |
| 31. | 49827 | 2.7% | 0.88%(+1.85)#31 | 1.1%(+1.64)#2,201 |
| 32. | 48823 | 2.7% | 0.88%(+1.84)#32 | 1.1%(+1.63)#2,221 |
| 33. | 49452 | 2.7% | 0.88%(+1.82)#33 | 1.1%(+1.61)#2,243 |
| 34. | 48612 | 2.6% | 0.88%(+1.74)#34 | 1.1%(+1.53)#2,363 |
| 35. | 49638 | 2.6% | 0.88%(+1.73)#35 | 1.1%(+1.53)#2,367 |
| 36. | 49650 | 2.6% | 0.88%(+1.69)#36 | 1.1%(+1.48)#2,441 |
| 37. | 49008 | 2.6% | 0.88%(+1.69)#37 | 1.1%(+1.48)#2,442 |
| 38. | 49618 | 2.6% | 0.88%(+1.67)#38 | 1.1%(+1.46)#2,471 |
| 39. | 49931 | 2.6% | 0.88%(+1.67)#39 | 1.1%(+1.46)#2,477 |
| 40. | 49963 | 2.5% | 0.88%(+1.64)#40 | 1.1%(+1.43)#2,534 |
| 41. | 48461 | 2.5% | 0.88%(+1.62)#41 | 1.1%(+1.42)#2,556 |
| 42. | 49006 | 2.5% | 0.88%(+1.62)#42 | 1.1%(+1.41)#2,577 |
| 43. | 49645 | 2.5% | 0.88%(+1.60)#43 | 1.1%(+1.39)#2,604 |
| 44. | 48197 | 2.4% | 0.88%(+1.55)#44 | 1.1%(+1.34)#2,704 |
| 45. | 49050 | 2.4% | 0.88%(+1.53)#45 | 1.1%(+1.32)#2,727 |
| 46. | 49676 | 2.4% | 0.88%(+1.47)#46 | 1.1%(+1.26)#2,832 |
| 47. | 48910 | 2.3% | 0.88%(+1.45)#47 | 1.1%(+1.24)#2,868 |
| 48. | 49930 | 2.3% | 0.88%(+1.44)#48 | 1.1%(+1.23)#2,887 |
| 49. | 49762 | 2.3% | 0.88%(+1.41)#49 | 1.1%(+1.21)#2,965 |
| 50. | 48767 | 2.3% | 0.88%(+1.39)#50 | 1.1%(+1.18)#3,015 |
| 51. | 49747 | 2.2% | 0.88%(+1.34)#51 | 1.1%(+1.14)#3,114 |
| 52. | 49004 | 2.2% | 0.88%(+1.33)#52 | 1.1%(+1.13)#3,137 |
| 53. | 48740 | 2.2% | 0.88%(+1.29)#53 | 1.1%(+1.09)#3,230 |
| 54. | 48201 | 2.2% | 0.88%(+1.29)#54 | 1.1%(+1.08)#3,244 |
| 55. | 49405 | 2.1% | 0.88%(+1.26)#55 | 1.1%(+1.06)#3,306 |
| 56. | 48895 | 2.1% | 0.88%(+1.22)#56 | 1.1%(+1.01)#3,416 |
| 57. | 49738 | 2.1% | 0.88%(+1.20)#57 | 1.1%(+0.995)#3,456 |
| 58. | 48179 | 2.1% | 0.88%(+1.17)#58 | 1.1%(+0.964)#3,530 |
| 59. | 48662 | 2.0% | 0.88%(+1.16)#59 | 1.1%(+0.956)#3,550 |
| 60. | 49449 | 2.0% | 0.88%(+1.15)#60 | 1.1%(+0.948)#3,570 |
| 61. | 48859 | 2.0% | 0.88%(+1.15)#61 | 1.1%(+0.944)#3,587 |
| 62. | 49836 | 2.0% | 0.88%(+1.12)#62 | 1.1%(+0.914)#3,674 |
| 63. | 49420 | 2.0% | 0.88%(+1.08)#63 | 1.1%(+0.873)#3,791 |
| 64. | 48640 | 2.0% | 0.88%(+1.07)#64 | 1.1%(+0.864)#3,810 |
| 65. | 48207 | 1.9% | 0.88%(+1.07)#65 | 1.1%(+0.858)#3,828 |
| 66. | 48084 | 1.9% | 0.88%(+1.06)#66 | 1.1%(+0.855)#3,842 |
| 67. | 49927 | 1.9% | 0.88%(+1.05)#67 | 1.1%(+0.845)#3,873 |
| 68. | 49083 | 1.9% | 0.88%(+1.02)#68 | 1.1%(+0.810)#3,974 |
| 69. | 48220 | 1.9% | 0.88%(+1.02)#69 | 1.1%(+0.809)#3,976 |
| 70. | 49635 | 1.9% | 0.88%(+1.01)#70 | 1.1%(+0.806)#3,987 |
| 71. | 48894 | 1.9% | 0.88%(+1.00)#71 | 1.1%(+0.794)#4,025 |
| 72. | 49057 | 1.9% | 0.88%(+0.992)#72 | 1.1%(+0.785)#4,053 |
| 73. | 48623 | 1.9% | 0.88%(+0.969)#73 | 1.1%(+0.762)#4,128 |
| 74. | 49805 | 1.8% | 0.88%(+0.951)#74 | 1.1%(+0.744)#4,197 |
| 75. | 49042 | 1.8% | 0.88%(+0.950)#75 | 1.1%(+0.744)#4,199 |
| 76. | 48320 | 1.8% | 0.88%(+0.937)#76 | 1.1%(+0.730)#4,256 |
| 77. | 49007 | 1.8% | 0.88%(+0.926)#77 | 1.1%(+0.719)#4,291 |
| 78. | 49002 | 1.8% | 0.88%(+0.911)#78 | 1.1%(+0.704)#4,343 |
| 79. | 48655 | 1.8% | 0.88%(+0.902)#79 | 1.1%(+0.695)#4,373 |
| 80. | 49009 | 1.8% | 0.88%(+0.899)#80 | 1.1%(+0.692)#4,387 |
| 81. | 48731 | 1.8% | 0.88%(+0.891)#81 | 1.1%(+0.684)#4,422 |
| 82. | 49969 | 1.8% | 0.88%(+0.888)#82 | 1.1%(+0.681)#4,435 |
| 83. | 48604 | 1.8% | 0.88%(+0.886)#83 | 1.1%(+0.679)#4,442 |
| 84. | 49712 | 1.8% | 0.88%(+0.880)#84 | 1.1%(+0.673)#4,459 |
| 85. | 49053 | 1.8% | 0.88%(+0.879)#85 | 1.1%(+0.673)#4,461 |
| 86. | 48083 | 1.7% | 0.88%(+0.865)#86 | 1.1%(+0.658)#4,514 |
| 87. | 49648 | 1.7% | 0.88%(+0.862)#87 | 1.1%(+0.655)#4,525 |
| 88. | 48187 | 1.7% | 0.88%(+0.840)#88 | 1.1%(+0.634)#4,615 |
| 89. | 49831 | 1.7% | 0.88%(+0.833)#89 | 1.1%(+0.626)#4,649 |
| 90. | 49912 | 1.7% | 0.88%(+0.817)#90 | 1.1%(+0.610)#4,722 |
| 91. | 48747 | 1.7% | 0.88%(+0.813)#91 | 1.1%(+0.606)#4,741 |
| 92. | 49861 | 1.7% | 0.88%(+0.811)#92 | 1.1%(+0.604)#4,752 |
| 93. | 49971 | 1.7% | 0.88%(+0.811)#93 | 1.1%(+0.604)#4,753 |
| 94. | 48216 | 1.7% | 0.88%(+0.809)#94 | 1.1%(+0.603)#4,763 |
| 95. | 49240 | 1.7% | 0.88%(+0.807)#95 | 1.1%(+0.601)#4,774 |
| 96. | 49879 | 1.7% | 0.88%(+0.805)#96 | 1.1%(+0.598)#4,782 |
| 97. | 48230 | 1.7% | 0.88%(+0.791)#97 | 1.1%(+0.584)#4,841 |
| 98. | 49055 | 1.7% | 0.88%(+0.788)#98 | 1.1%(+0.581)#4,859 |
| 99. | 48198 | 1.7% | 0.88%(+0.773)#99 | 1.1%(+0.566)#4,915 |
| 100. | 49264 | 1.7% | 0.88%(+0.770)#100 | 1.1%(+0.563)#4,927 |
Common Questions
What are the Top 10 Zip Codes with the Highest Percentage of Population Employed in Life, Physical & Social Science in Michigan?
Top 10 Zip Codes with the Highest Percentage of Population Employed in Life, Physical & Social Science in Michigan are:
What zip code has the Highest Percentage of Population Employed in Life, Physical & Social Science in Michigan?
49881 has the Highest Percentage of Population Employed in Life, Physical & Social Science in Michigan with 16.1%.
What is the Percentage of Population Employed in Life, Physical & Social Science in the State of Michigan?
Percentage of Population Employed in Life, Physical & Social Science in Michigan is 0.88%.
What is the Percentage of Population Employed in Life, Physical & Social Science in the United States?
Percentage of Population Employed in Life, Physical & Social Science in the United States is 1.1%.