Owings Mills, MD Map & Demographics
Owings Mills Map
Owings Mills Overview
$44,865
PER CAPITA INCOME
$107,462
AVG FAMILY INCOME
$92,322
AVG HOUSEHOLD INCOME
26.8%
WAGE / INCOME GAP [ % ]
73.2¢/ $1
WAGE / INCOME GAP [ $ ]
0.37
INEQUALITY / GINI INDEX
34,999
TOTAL POPULATION
15,214
MALE POPULATION
19,785
FEMALE POPULATION
76.90
MALES / 100 FEMALES
130.04
FEMALES / 100 MALES
34.4
MEDIAN AGE
3.1
AVG FAMILY SIZE
2.4
AVG HOUSEHOLD SIZE
20,871
LABOR FORCE [ PEOPLE ]
73.6%
PERCENT IN LABOR FORCE
5.7%
UNEMPLOYMENT RATE
Owings Mills Zip Codes
Owings Mills Area Codes
Income in Owings Mills
Income Overview in Owings Mills
Per Capita Income in Owings Mills is $44,865, while median incomes of families and households are $107,462 and $92,322 respectively.
| Characteristic | Number | Measure |
| Per Capita Income | 34,999 | $44,865 |
| Median Family Income | 8,182 | $107,462 |
| Mean Family Income | 8,182 | $123,798 |
| Median Household Income | 14,124 | $92,322 |
| Mean Household Income | 14,124 | $109,309 |
| Income Deficit | 8,182 | $0 |
| Wage / Income Gap (%) | 34,999 | 26.77% |
| Wage / Income Gap ($) | 34,999 | 73.23¢ per $1 |
| Gini / Inequality Index | 34,999 | 0.37 |
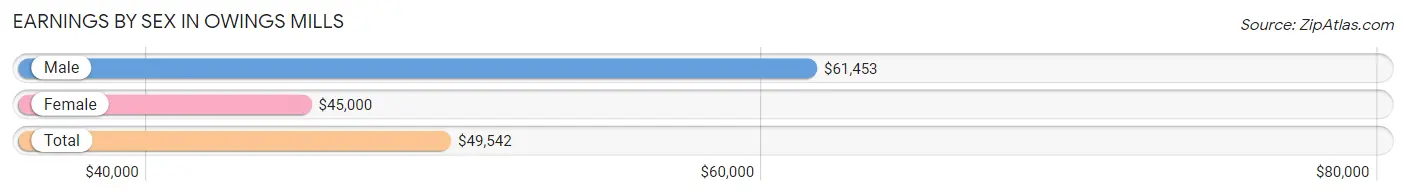
Earnings by Sex in Owings Mills
Average Earnings in Owings Mills are $49,542, $61,453 for men and $45,000 for women, a difference of 26.8%.
| Sex | Number | Average Earnings |
| Male | 9,463 (43.8%) | $61,453 |
| Female | 12,162 (56.2%) | $45,000 |
| Total | 21,625 (100.0%) | $49,542 |
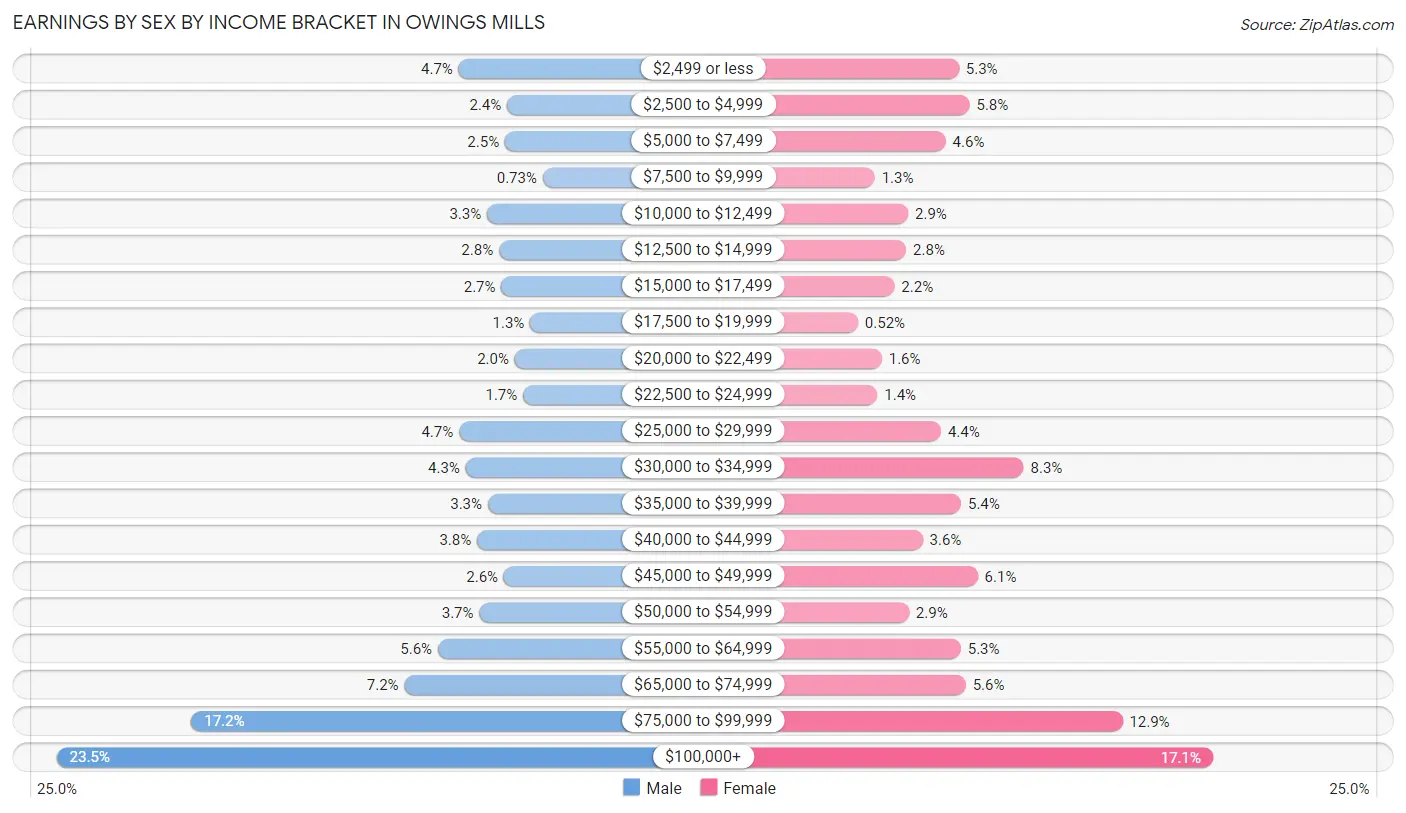
Earnings by Sex by Income Bracket in Owings Mills
The most common earnings brackets in Owings Mills are $100,000+ for men (2,224 | 23.5%) and $100,000+ for women (2,084 | 17.1%).
| Income | Male | Female |
| $2,499 or less | 442 (4.7%) | 639 (5.2%) |
| $2,500 to $4,999 | 227 (2.4%) | 699 (5.8%) |
| $5,000 to $7,499 | 237 (2.5%) | 563 (4.6%) |
| $7,500 to $9,999 | 69 (0.7%) | 159 (1.3%) |
| $10,000 to $12,499 | 316 (3.3%) | 349 (2.9%) |
| $12,500 to $14,999 | 263 (2.8%) | 338 (2.8%) |
| $15,000 to $17,499 | 253 (2.7%) | 271 (2.2%) |
| $17,500 to $19,999 | 125 (1.3%) | 63 (0.5%) |
| $20,000 to $22,499 | 193 (2.0%) | 200 (1.6%) |
| $22,500 to $24,999 | 156 (1.7%) | 174 (1.4%) |
| $25,000 to $29,999 | 440 (4.6%) | 536 (4.4%) |
| $30,000 to $34,999 | 411 (4.3%) | 1,007 (8.3%) |
| $35,000 to $39,999 | 312 (3.3%) | 651 (5.3%) |
| $40,000 to $44,999 | 361 (3.8%) | 432 (3.5%) |
| $45,000 to $49,999 | 241 (2.5%) | 745 (6.1%) |
| $50,000 to $54,999 | 350 (3.7%) | 354 (2.9%) |
| $55,000 to $64,999 | 534 (5.6%) | 650 (5.3%) |
| $65,000 to $74,999 | 682 (7.2%) | 678 (5.6%) |
| $75,000 to $99,999 | 1,627 (17.2%) | 1,570 (12.9%) |
| $100,000+ | 2,224 (23.5%) | 2,084 (17.1%) |
| Total | 9,463 (100.0%) | 12,162 (100.0%) |
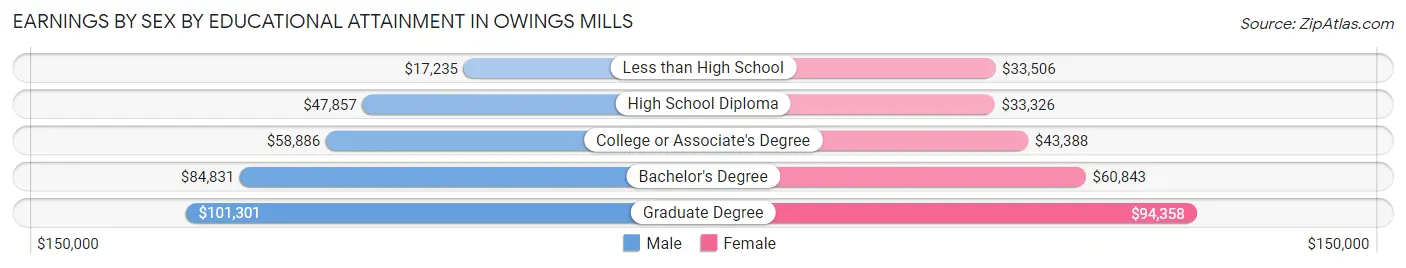
Earnings by Sex by Educational Attainment in Owings Mills
Average earnings in Owings Mills are $71,369 for men and $50,260 for women, a difference of 29.6%. Men with an educational attainment of graduate degree enjoy the highest average annual earnings of $101,301, while those with less than high school education earn the least with $17,235. Women with an educational attainment of graduate degree earn the most with the average annual earnings of $94,358, while those with high school diploma education have the smallest earnings of $33,326.
| Educational Attainment | Male Income | Female Income |
| Less than High School | $17,235 | $33,506 |
| High School Diploma | $47,857 | $33,326 |
| College or Associate's Degree | $58,886 | $43,388 |
| Bachelor's Degree | $84,831 | $60,843 |
| Graduate Degree | $101,301 | $94,358 |
| Total | $71,369 | $50,260 |
Family Income in Owings Mills
Family Income Brackets in Owings Mills
According to the Owings Mills family income data, there are 2,250 families falling into the $100,000 to $149,999 income range, which is the most common income bracket and makes up 27.5% of all families. Conversely, the less than $10,000 income bracket is the least frequent group with only 98 families (1.2%) belonging to this category.
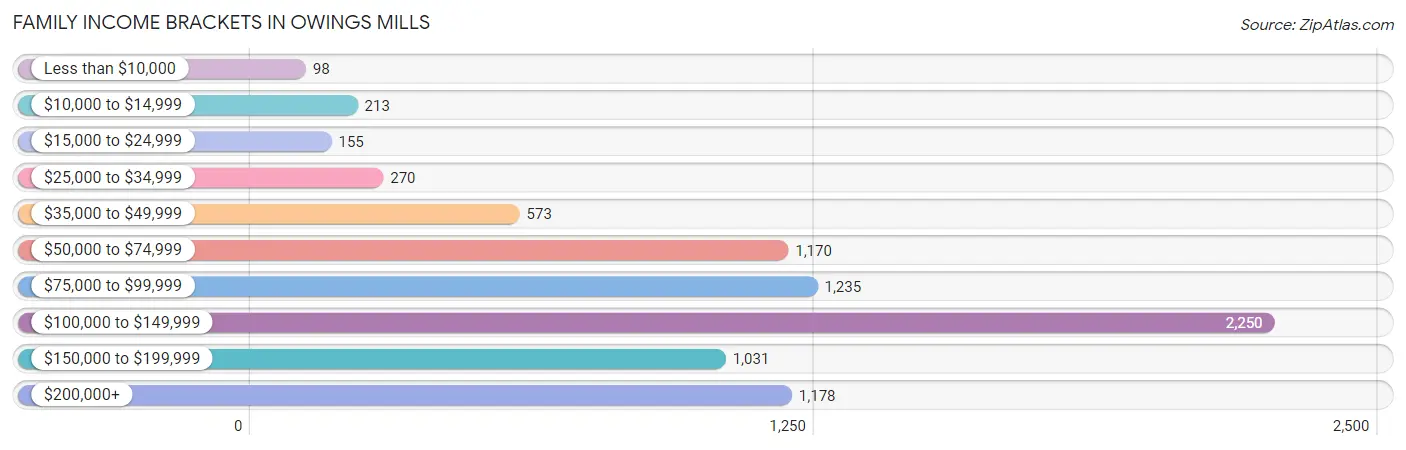
| Income Bracket | # Families | % Families |
| Less than $10,000 | 98 | 1.2% |
| $10,000 to $14,999 | 213 | 2.6% |
| $15,000 to $24,999 | 155 | 1.9% |
| $25,000 to $34,999 | 270 | 3.3% |
| $35,000 to $49,999 | 573 | 7.0% |
| $50,000 to $74,999 | 1,170 | 14.3% |
| $75,000 to $99,999 | 1,235 | 15.1% |
| $100,000 to $149,999 | 2,250 | 27.5% |
| $150,000 to $199,999 | 1,031 | 12.6% |
| $200,000+ | 1,178 | 14.4% |
Family Income by Famaliy Size in Owings Mills
7+ person families (49 | 0.6%) account for the highest median family income in Owings Mills with $188,750 per family, while 2-person families (3,620 | 44.2%) have the highest median income of $53,432 per family member.
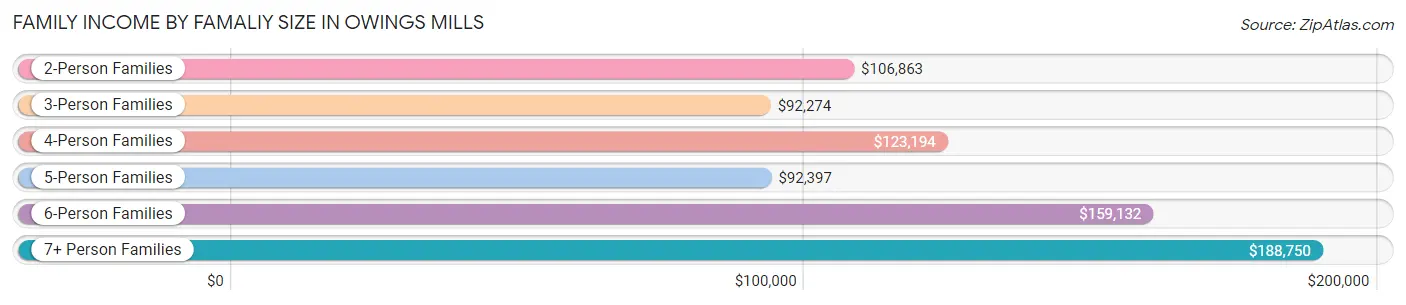
| Income Bracket | # Families | Median Income |
| 2-Person Families | 3,620 (44.2%) | $106,863 |
| 3-Person Families | 2,579 (31.5%) | $92,274 |
| 4-Person Families | 981 (12.0%) | $123,194 |
| 5-Person Families | 740 (9.0%) | $92,397 |
| 6-Person Families | 213 (2.6%) | $159,132 |
| 7+ Person Families | 49 (0.6%) | $188,750 |
| Total | 8,182 (100.0%) | $107,462 |
Family Income by Number of Earners in Owings Mills
The median family income in Owings Mills is $107,462, with families comprising 3+ earners (984) having the highest median family income of $193,056, while families with no earners (378) have the lowest median family income of $70,641, accounting for 12.0% and 4.6% of families, respectively.
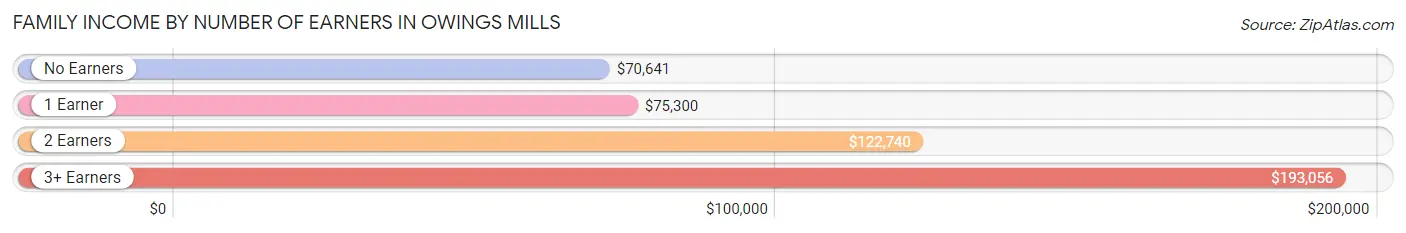
| Number of Earners | # Families | Median Income |
| No Earners | 378 (4.6%) | $70,641 |
| 1 Earner | 3,141 (38.4%) | $75,300 |
| 2 Earners | 3,679 (45.0%) | $122,740 |
| 3+ Earners | 984 (12.0%) | $193,056 |
| Total | 8,182 (100.0%) | $107,462 |
Household Income in Owings Mills
Household Income Brackets in Owings Mills
With 3,178 households falling in the category, the $100,000 to $149,999 income range is the most frequent in Owings Mills, accounting for 22.5% of all households. In contrast, only 212 households (1.5%) fall into the less than $10,000 income bracket, making it the least populous group.
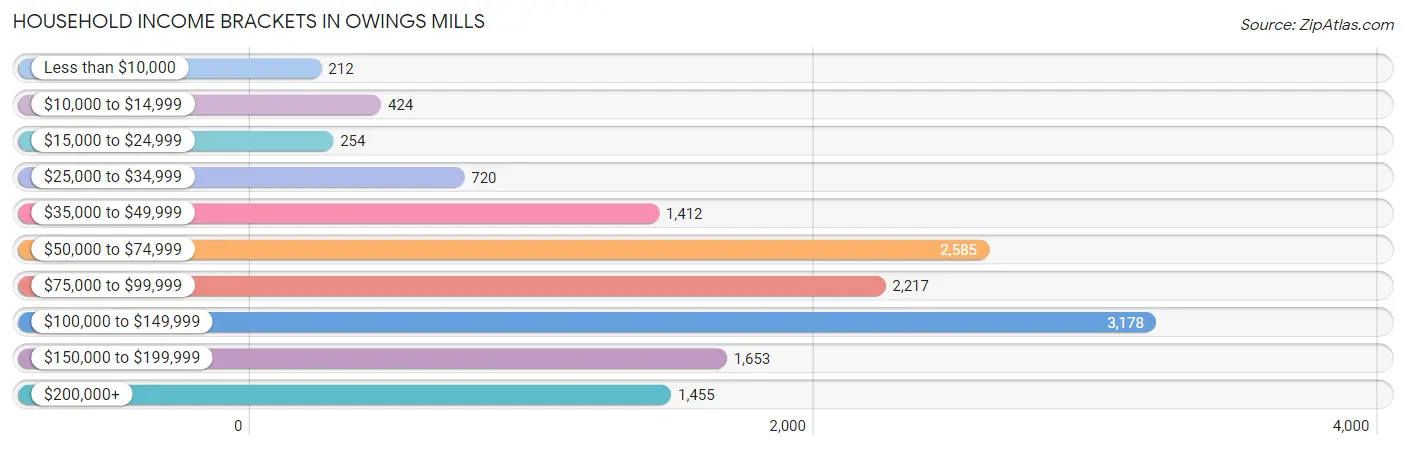
| Income Bracket | # Households | % Households |
| Less than $10,000 | 212 | 1.5% |
| $10,000 to $14,999 | 424 | 3.0% |
| $15,000 to $24,999 | 254 | 1.8% |
| $25,000 to $34,999 | 720 | 5.1% |
| $35,000 to $49,999 | 1,412 | 10.0% |
| $50,000 to $74,999 | 2,585 | 18.3% |
| $75,000 to $99,999 | 2,217 | 15.7% |
| $100,000 to $149,999 | 3,178 | 22.5% |
| $150,000 to $199,999 | 1,653 | 11.7% |
| $200,000+ | 1,455 | 10.3% |
Household Income by Householder Age in Owings Mills
The median household income in Owings Mills is $92,322, with the highest median household income of $113,801 found in the 45 to 64 years age bracket for the primary householder. A total of 5,197 households (36.8%) fall into this category. Meanwhile, the 15 to 24 years age bracket for the primary householder has the lowest median household income of $56,223, with 378 households (2.7%) in this group.
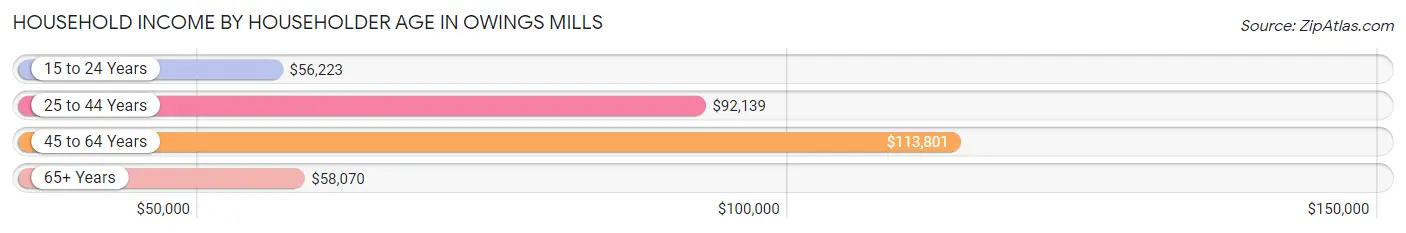
| Income Bracket | # Households | Median Income |
| 15 to 24 Years | 378 (2.7%) | $56,223 |
| 25 to 44 Years | 5,619 (39.8%) | $92,139 |
| 45 to 64 Years | 5,197 (36.8%) | $113,801 |
| 65+ Years | 2,930 (20.7%) | $58,070 |
| Total | 14,124 (100.0%) | $92,322 |
Poverty in Owings Mills
Income Below Poverty by Sex and Age in Owings Mills
With 6.0% poverty level for males and 7.0% for females among the residents of Owings Mills, 15 year old males and 5 year old females are the most vulnerable to poverty, with 43 males (24.9%) and 104 females (50.2%) in their respective age groups living below the poverty level.
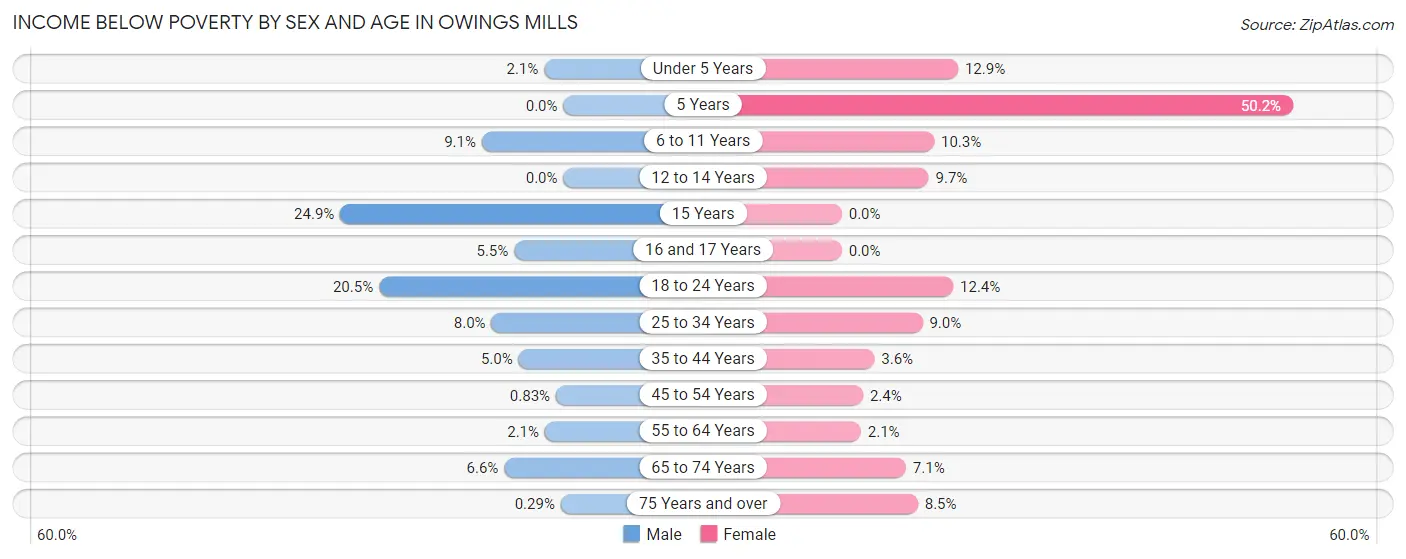
| Age Bracket | Male | Female |
| Under 5 Years | 19 (2.1%) | 124 (12.9%) |
| 5 Years | 0 (0.0%) | 104 (50.2%) |
| 6 to 11 Years | 114 (9.1%) | 104 (10.3%) |
| 12 to 14 Years | 0 (0.0%) | 65 (9.7%) |
| 15 Years | 43 (24.9%) | 0 (0.0%) |
| 16 and 17 Years | 28 (5.5%) | 0 (0.0%) |
| 18 to 24 Years | 262 (20.5%) | 140 (12.4%) |
| 25 to 34 Years | 206 (8.0%) | 369 (9.0%) |
| 35 to 44 Years | 94 (5.0%) | 82 (3.6%) |
| 45 to 54 Years | 17 (0.8%) | 60 (2.4%) |
| 55 to 64 Years | 38 (2.1%) | 52 (2.1%) |
| 65 to 74 Years | 53 (6.6%) | 137 (7.1%) |
| 75 Years and over | 1 (0.3%) | 88 (8.5%) |
| Total | 875 (6.0%) | 1,325 (7.0%) |
Income Above Poverty by Sex and Age in Owings Mills
According to the poverty statistics in Owings Mills, males aged 5 years and females aged 15 years are the age groups that are most secure financially, with 100.0% of males and 100.0% of females in these age groups living above the poverty line.
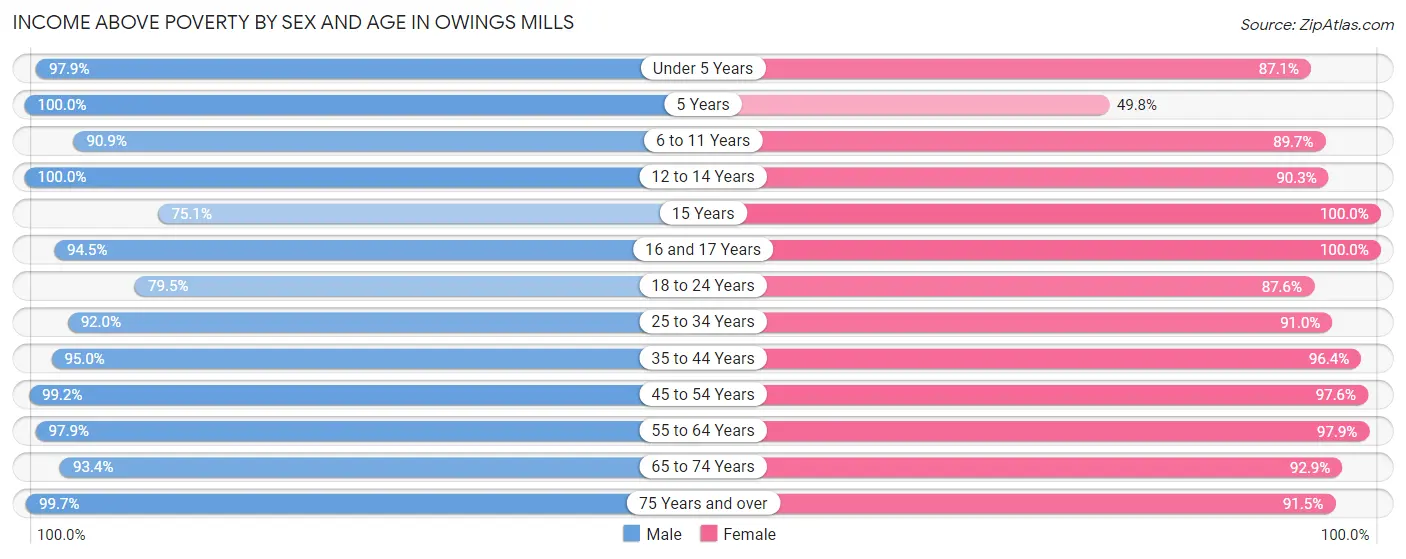
| Age Bracket | Male | Female |
| Under 5 Years | 867 (97.9%) | 834 (87.1%) |
| 5 Years | 372 (100.0%) | 103 (49.8%) |
| 6 to 11 Years | 1,142 (90.9%) | 909 (89.7%) |
| 12 to 14 Years | 510 (100.0%) | 607 (90.3%) |
| 15 Years | 130 (75.1%) | 335 (100.0%) |
| 16 and 17 Years | 483 (94.5%) | 323 (100.0%) |
| 18 to 24 Years | 1,014 (79.5%) | 989 (87.6%) |
| 25 to 34 Years | 2,367 (92.0%) | 3,738 (91.0%) |
| 35 to 44 Years | 1,791 (95.0%) | 2,180 (96.4%) |
| 45 to 54 Years | 2,032 (99.2%) | 2,480 (97.6%) |
| 55 to 64 Years | 1,808 (97.9%) | 2,397 (97.9%) |
| 65 to 74 Years | 751 (93.4%) | 1,782 (92.9%) |
| 75 Years and over | 348 (99.7%) | 952 (91.5%) |
| Total | 13,615 (94.0%) | 17,629 (93.0%) |
Income Below Poverty Among Married-Couple Families in Owings Mills
The poverty statistics for married-couple families in Owings Mills show that 1.0% or 53 of the total 5,080 families live below the poverty line. Families with no children have the highest poverty rate of 1.8%, comprising of 53 families. On the other hand, families with 1 or 2 children have the lowest poverty rate of 0.0%, which includes 0 families.
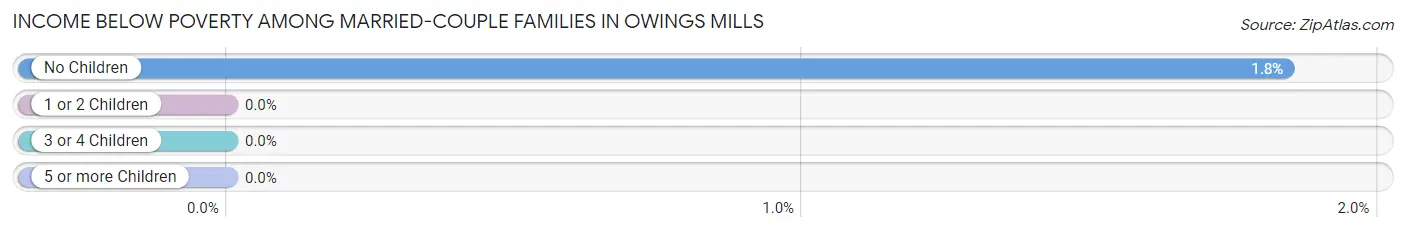
| Children | Above Poverty | Below Poverty |
| No Children | 2,823 (98.2%) | 53 (1.8%) |
| 1 or 2 Children | 1,711 (100.0%) | 0 (0.0%) |
| 3 or 4 Children | 493 (100.0%) | 0 (0.0%) |
| 5 or more Children | 0 (0.0%) | 0 (0.0%) |
| Total | 5,027 (99.0%) | 53 (1.0%) |
Income Below Poverty Among Single-Parent Households in Owings Mills
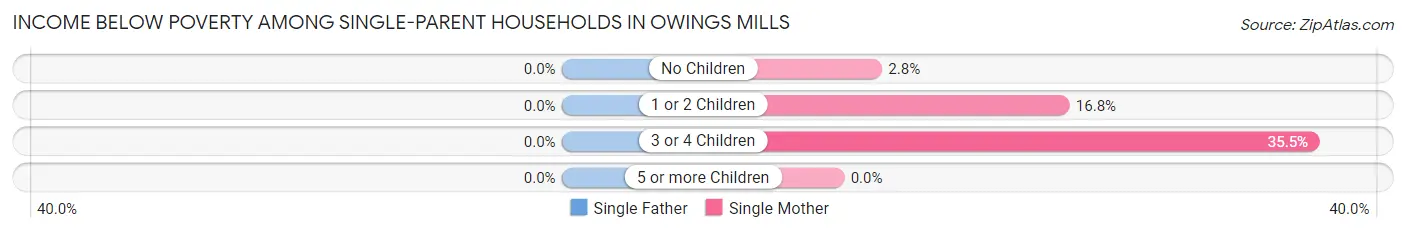
| Children | Single Father | Single Mother |
| No Children | 0 (0.0%) | 22 (2.8%) |
| 1 or 2 Children | 0 (0.0%) | 274 (16.8%) |
| 3 or 4 Children | 0 (0.0%) | 22 (35.5%) |
| 5 or more Children | 0 (0.0%) | 0 (0.0%) |
| Total | 0 (0.0%) | 318 (12.8%) |
Income Below Poverty Among Married-Couple vs Single-Parent Households in Owings Mills
The poverty data for Owings Mills shows that 53 of the married-couple family households (1.0%) and 318 of the single-parent households (10.2%) are living below the poverty level. Within the married-couple family households, those with no children have the highest poverty rate, with 53 households (1.8%) falling below the poverty line. Among the single-parent households, those with 3 or 4 children have the highest poverty rate, with 22 household (35.5%) living below poverty.
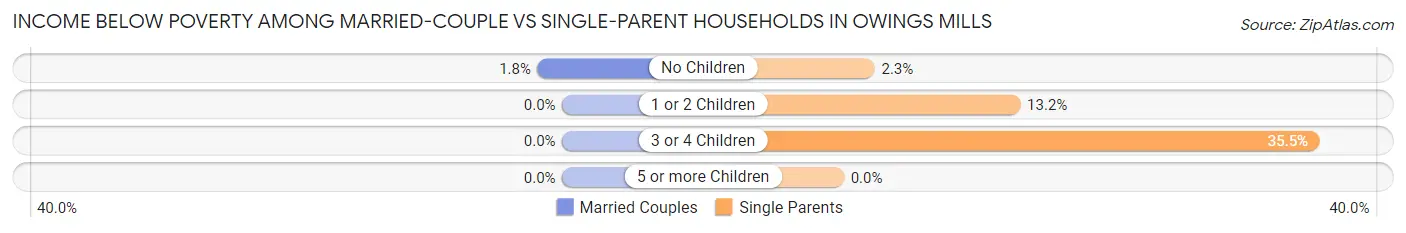
| Children | Married-Couple Families | Single-Parent Households |
| No Children | 53 (1.8%) | 22 (2.3%) |
| 1 or 2 Children | 0 (0.0%) | 274 (13.2%) |
| 3 or 4 Children | 0 (0.0%) | 22 (35.5%) |
| 5 or more Children | 0 (0.0%) | 0 (0.0%) |
| Total | 53 (1.0%) | 318 (10.2%) |
Race in Owings Mills
The most populous races in Owings Mills are Black / African American (21,588 | 61.7%), White / Caucasian (7,836 | 22.4%), and Hispanic or Latino (2,667 | 7.6%).
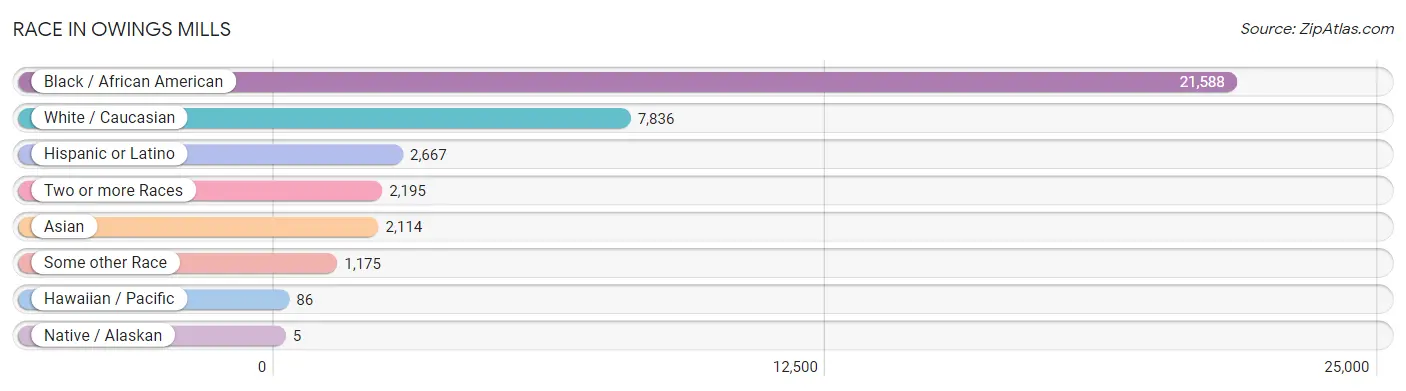
| Race | # Population | % Population |
| Asian | 2,114 | 6.0% |
| Black / African American | 21,588 | 61.7% |
| Hawaiian / Pacific | 86 | 0.3% |
| Hispanic or Latino | 2,667 | 7.6% |
| Native / Alaskan | 5 | 0.0% |
| White / Caucasian | 7,836 | 22.4% |
| Two or more Races | 2,195 | 6.3% |
| Some other Race | 1,175 | 3.4% |
| Total | 34,999 | 100.0% |
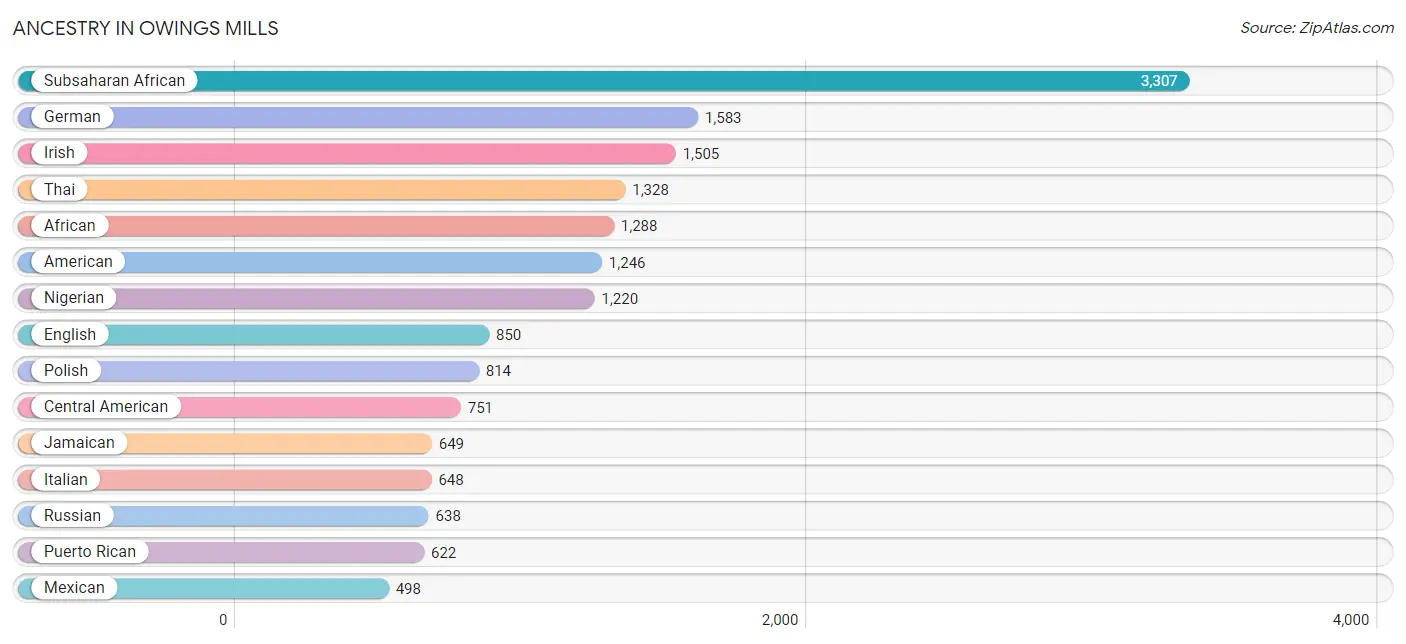
Ancestry in Owings Mills
The most populous ancestries reported in Owings Mills are Subsaharan African (3,307 | 9.5%), German (1,583 | 4.5%), Irish (1,505 | 4.3%), Thai (1,328 | 3.8%), and African (1,288 | 3.7%), together accounting for 25.7% of all Owings Mills residents.
| Ancestry | # Population | % Population |
| African | 1,288 | 3.7% |
| American | 1,246 | 3.6% |
| Apache | 3 | 0.0% |
| Arab | 332 | 0.9% |
| Armenian | 5 | 0.0% |
| Austrian | 52 | 0.2% |
| Barbadian | 25 | 0.1% |
| Bhutanese | 219 | 0.6% |
| Brazilian | 75 | 0.2% |
| British | 37 | 0.1% |
| British West Indian | 59 | 0.2% |
| Burmese | 328 | 0.9% |
| Canadian | 84 | 0.2% |
| Celtic | 30 | 0.1% |
| Central American | 751 | 2.1% |
| Central American Indian | 46 | 0.1% |
| Cherokee | 195 | 0.6% |
| Colombian | 121 | 0.4% |
| Cuban | 57 | 0.2% |
| Czech | 4 | 0.0% |
| Czechoslovakian | 7 | 0.0% |
| Danish | 33 | 0.1% |
| Dominican | 76 | 0.2% |
| Dutch | 65 | 0.2% |
| Eastern European | 76 | 0.2% |
| English | 850 | 2.4% |
| Ethiopian | 71 | 0.2% |
| European | 83 | 0.2% |
| Finnish | 23 | 0.1% |
| French | 361 | 1.0% |
| French Canadian | 19 | 0.1% |
| German | 1,583 | 4.5% |
| Ghanaian | 135 | 0.4% |
| Greek | 20 | 0.1% |
| Guatemalan | 137 | 0.4% |
| Guyanese | 43 | 0.1% |
| Haitian | 244 | 0.7% |
| Honduran | 483 | 1.4% |
| Hungarian | 76 | 0.2% |
| Icelander | 27 | 0.1% |
| Indian (Asian) | 216 | 0.6% |
| Indonesian | 16 | 0.1% |
| Iranian | 52 | 0.2% |
| Irish | 1,505 | 4.3% |
| Israeli | 26 | 0.1% |
| Italian | 648 | 1.8% |
| Jamaican | 649 | 1.8% |
| Jordanian | 33 | 0.1% |
| Kenyan | 141 | 0.4% |
| Korean | 152 | 0.4% |
| Lebanese | 27 | 0.1% |
| Liberian | 3 | 0.0% |
| Lithuanian | 116 | 0.3% |
| Lumbee | 139 | 0.4% |
| Mexican | 498 | 1.4% |
| Native Hawaiian | 86 | 0.3% |
| Navajo | 3 | 0.0% |
| Nicaraguan | 21 | 0.1% |
| Nigerian | 1,220 | 3.5% |
| Norwegian | 80 | 0.2% |
| Peruvian | 209 | 0.6% |
| Polish | 814 | 2.3% |
| Portuguese | 86 | 0.3% |
| Puerto Rican | 622 | 1.8% |
| Romanian | 1 | 0.0% |
| Russian | 638 | 1.8% |
| Salvadoran | 110 | 0.3% |
| Scandinavian | 36 | 0.1% |
| Scotch-Irish | 219 | 0.6% |
| Scottish | 103 | 0.3% |
| Sierra Leonean | 68 | 0.2% |
| South American | 330 | 0.9% |
| South American Indian | 57 | 0.2% |
| Sri Lankan | 18 | 0.1% |
| Subsaharan African | 3,307 | 9.5% |
| Swedish | 61 | 0.2% |
| Swiss | 85 | 0.2% |
| Thai | 1,328 | 3.8% |
| Trinidadian and Tobagonian | 184 | 0.5% |
| Turkish | 44 | 0.1% |
| Ukrainian | 97 | 0.3% |
| Welsh | 16 | 0.1% |
| West Indian | 144 | 0.4% | View All 83 Rows |
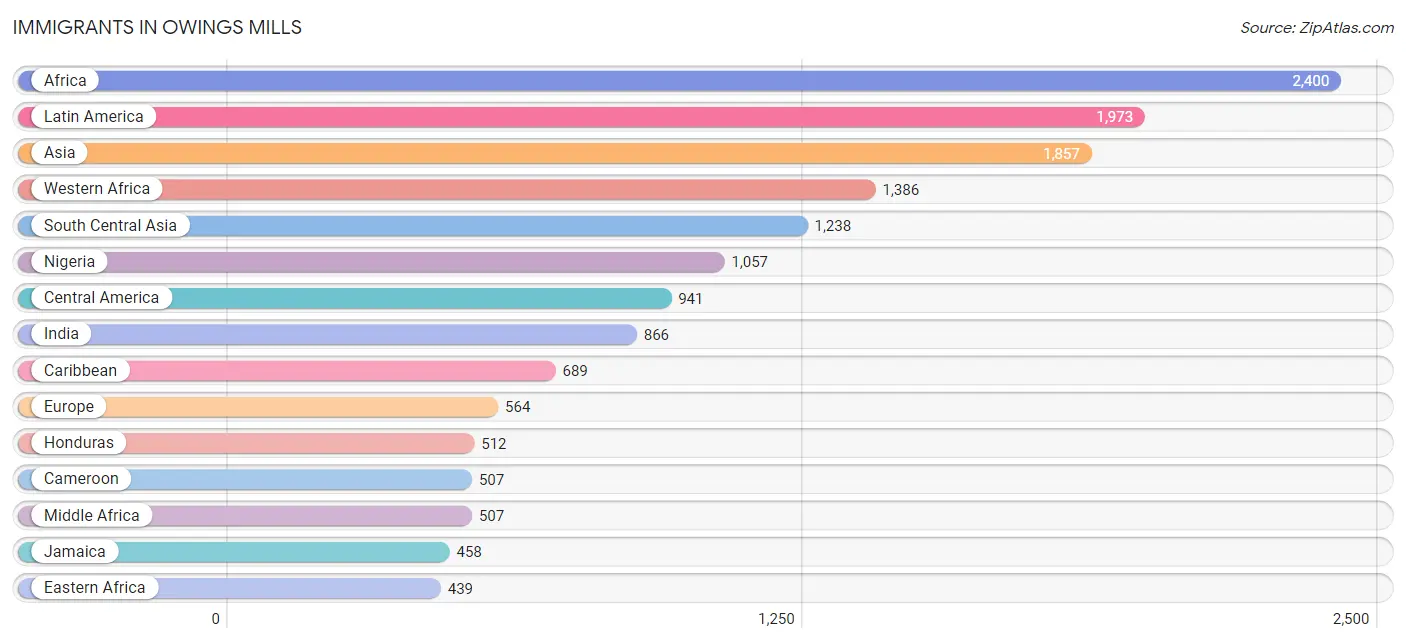
Immigrants in Owings Mills
The most numerous immigrant groups reported in Owings Mills came from Africa (2,400 | 6.9%), Latin America (1,973 | 5.6%), Asia (1,857 | 5.3%), Western Africa (1,386 | 4.0%), and South Central Asia (1,238 | 3.5%), together accounting for 25.3% of all Owings Mills residents.
| Immigration Origin | # Population | % Population |
| Africa | 2,400 | 6.9% |
| Asia | 1,857 | 5.3% |
| Barbados | 18 | 0.1% |
| Belarus | 33 | 0.1% |
| Belgium | 4 | 0.0% |
| Brazil | 31 | 0.1% |
| Cameroon | 507 | 1.5% |
| Canada | 71 | 0.2% |
| Caribbean | 689 | 2.0% |
| Central America | 941 | 2.7% |
| China | 29 | 0.1% |
| Colombia | 113 | 0.3% |
| Cuba | 22 | 0.1% |
| Dominican Republic | 49 | 0.1% |
| Eastern Africa | 439 | 1.3% |
| Eastern Asia | 311 | 0.9% |
| Eastern Europe | 429 | 1.2% |
| El Salvador | 104 | 0.3% |
| Ethiopia | 182 | 0.5% |
| Europe | 564 | 1.6% |
| Fiji | 11 | 0.0% |
| Ghana | 258 | 0.7% |
| Grenada | 26 | 0.1% |
| Guatemala | 137 | 0.4% |
| Guyana | 43 | 0.1% |
| Honduras | 512 | 1.5% |
| India | 866 | 2.5% |
| Iran | 48 | 0.1% |
| Ireland | 85 | 0.2% |
| Jamaica | 458 | 1.3% |
| Japan | 68 | 0.2% |
| Jordan | 57 | 0.2% |
| Kenya | 141 | 0.4% |
| Korea | 214 | 0.6% |
| Kuwait | 25 | 0.1% |
| Latin America | 1,973 | 5.6% |
| Liberia | 71 | 0.2% |
| Malaysia | 9 | 0.0% |
| Mexico | 188 | 0.5% |
| Middle Africa | 507 | 1.5% |
| Nepal | 324 | 0.9% |
| Nigeria | 1,057 | 3.0% |
| Northern Africa | 65 | 0.2% |
| Northern Europe | 131 | 0.4% |
| Oceania | 11 | 0.0% |
| Peru | 156 | 0.4% |
| Philippines | 160 | 0.5% |
| Poland | 22 | 0.1% |
| Russia | 253 | 0.7% |
| South Africa | 3 | 0.0% |
| South America | 343 | 1.0% |
| South Central Asia | 1,238 | 3.5% |
| South Eastern Asia | 197 | 0.6% |
| St. Vincent and the Grenadines | 59 | 0.2% |
| Thailand | 12 | 0.0% |
| Trinidad and Tobago | 57 | 0.2% |
| Turkey | 9 | 0.0% |
| Uganda | 20 | 0.1% |
| Ukraine | 87 | 0.3% |
| Western Africa | 1,386 | 4.0% |
| Western Asia | 111 | 0.3% |
| Western Europe | 4 | 0.0% |
| Zimbabwe | 96 | 0.3% | View All 63 Rows |
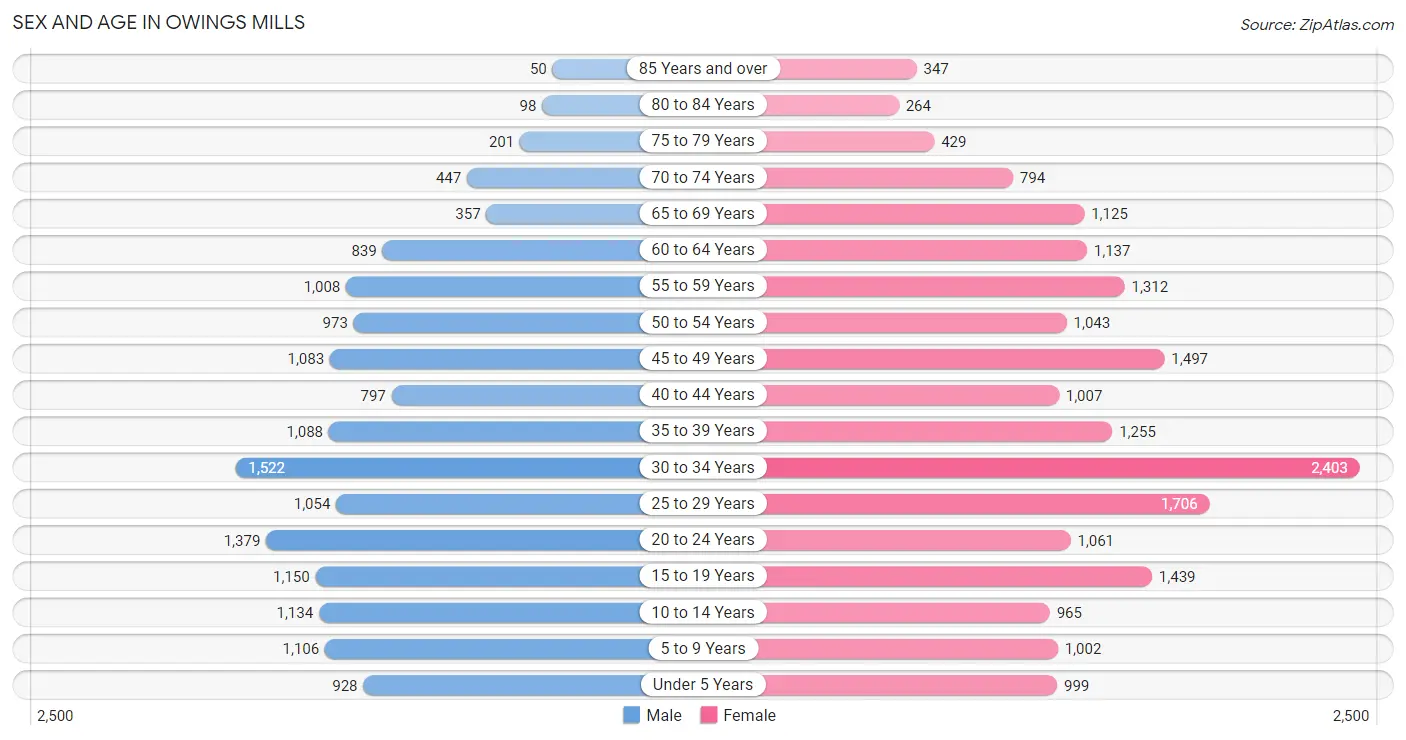
Sex and Age in Owings Mills
Sex and Age in Owings Mills
The most populous age groups in Owings Mills are 30 to 34 Years (1,522 | 10.0%) for men and 30 to 34 Years (2,403 | 12.1%) for women.
| Age Bracket | Male | Female |
| Under 5 Years | 928 (6.1%) | 999 (5.1%) |
| 5 to 9 Years | 1,106 (7.3%) | 1,002 (5.1%) |
| 10 to 14 Years | 1,134 (7.4%) | 965 (4.9%) |
| 15 to 19 Years | 1,150 (7.6%) | 1,439 (7.3%) |
| 20 to 24 Years | 1,379 (9.1%) | 1,061 (5.4%) |
| 25 to 29 Years | 1,054 (6.9%) | 1,706 (8.6%) |
| 30 to 34 Years | 1,522 (10.0%) | 2,403 (12.1%) |
| 35 to 39 Years | 1,088 (7.1%) | 1,255 (6.3%) |
| 40 to 44 Years | 797 (5.2%) | 1,007 (5.1%) |
| 45 to 49 Years | 1,083 (7.1%) | 1,497 (7.6%) |
| 50 to 54 Years | 973 (6.4%) | 1,043 (5.3%) |
| 55 to 59 Years | 1,008 (6.6%) | 1,312 (6.6%) |
| 60 to 64 Years | 839 (5.5%) | 1,137 (5.8%) |
| 65 to 69 Years | 357 (2.4%) | 1,125 (5.7%) |
| 70 to 74 Years | 447 (2.9%) | 794 (4.0%) |
| 75 to 79 Years | 201 (1.3%) | 429 (2.2%) |
| 80 to 84 Years | 98 (0.6%) | 264 (1.3%) |
| 85 Years and over | 50 (0.3%) | 347 (1.8%) |
| Total | 15,214 (100.0%) | 19,785 (100.0%) |
Families and Households in Owings Mills
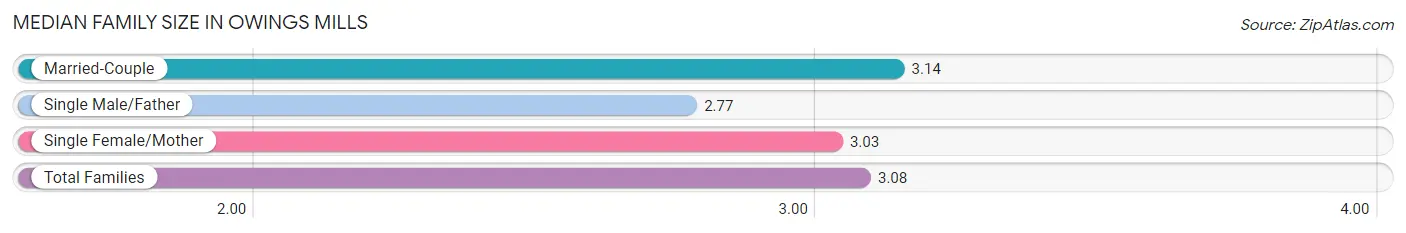
Median Family Size in Owings Mills
The median family size in Owings Mills is 3.08 persons per family, with married-couple families (5,080 | 62.1%) accounting for the largest median family size of 3.14 persons per family. On the other hand, single male/father families (625 | 7.6%) represent the smallest median family size with 2.77 persons per family.
| Family Type | # Families | Family Size |
| Married-Couple | 5,080 (62.1%) | 3.14 |
| Single Male/Father | 625 (7.6%) | 2.77 |
| Single Female/Mother | 2,477 (30.3%) | 3.03 |
| Total Families | 8,182 (100.0%) | 3.08 |
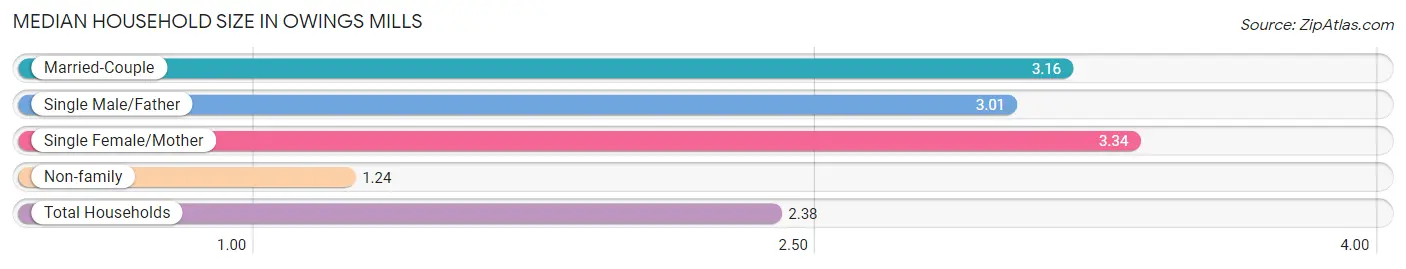
Median Household Size in Owings Mills
The median household size in Owings Mills is 2.38 persons per household, with single female/mother households (2,477 | 17.5%) accounting for the largest median household size of 3.34 persons per household. non-family households (5,942 | 42.1%) represent the smallest median household size with 1.24 persons per household.
| Household Type | # Households | Household Size |
| Married-Couple | 5,080 (36.0%) | 3.16 |
| Single Male/Father | 625 (4.4%) | 3.01 |
| Single Female/Mother | 2,477 (17.5%) | 3.34 |
| Non-family | 5,942 (42.1%) | 1.24 |
| Total Households | 14,124 (100.0%) | 2.38 |
Household Size by Marriage Status in Owings Mills
Out of a total of 14,124 households in Owings Mills, 8,182 (57.9%) are family households, while 5,942 (42.1%) are nonfamily households. The most numerous type of family households are 2-person households, comprising 3,305, and the most common type of nonfamily households are 1-person households, comprising 5,043.
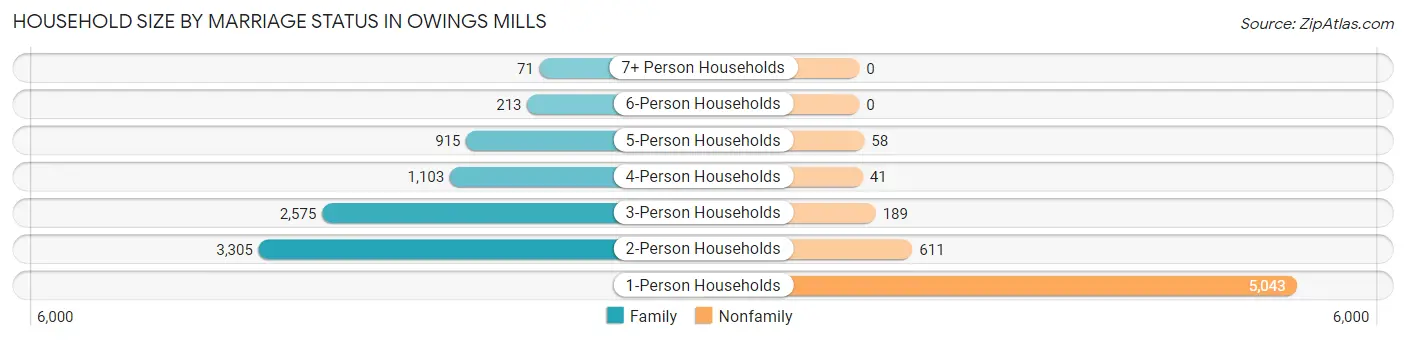
| Household Size | Family Households | Nonfamily Households |
| 1-Person Households | - | 5,043 (35.7%) |
| 2-Person Households | 3,305 (23.4%) | 611 (4.3%) |
| 3-Person Households | 2,575 (18.2%) | 189 (1.3%) |
| 4-Person Households | 1,103 (7.8%) | 41 (0.3%) |
| 5-Person Households | 915 (6.5%) | 58 (0.4%) |
| 6-Person Households | 213 (1.5%) | 0 (0.0%) |
| 7+ Person Households | 71 (0.5%) | 0 (0.0%) |
| Total | 8,182 (57.9%) | 5,942 (42.1%) |
Female Fertility in Owings Mills
Fertility by Age in Owings Mills
Average fertility rate in Owings Mills is 38.0 births per 1,000 women. Women in the age bracket of 20 to 34 years have the highest fertility rate with 67.0 births per 1,000 women. Women in the age bracket of 20 to 34 years acount for 86.7% of all women with births.
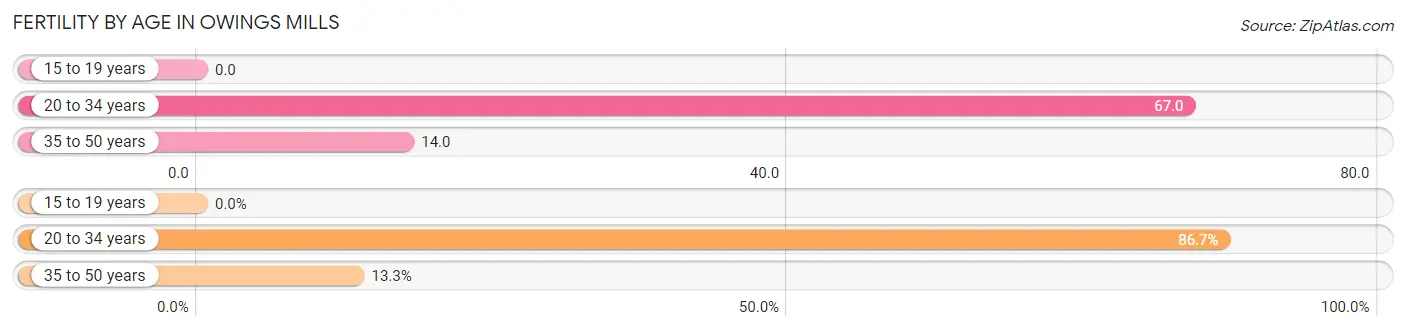
| Age Bracket | Women with Births | Births / 1,000 Women |
| 15 to 19 years | 0 (0.0%) | 0.0 |
| 20 to 34 years | 346 (86.7%) | 67.0 |
| 35 to 50 years | 53 (13.3%) | 14.0 |
| Total | 399 (100.0%) | 38.0 |
Fertility by Age by Marriage Status in Owings Mills
73.9% of women with births (399) in Owings Mills are married. The highest percentage of unmarried women with births falls into 35 to 50 years age bracket with 58.5% of them unmarried at the time of birth, while the lowest percentage of unmarried women with births belong to 20 to 34 years age bracket with 21.1% of them unmarried.
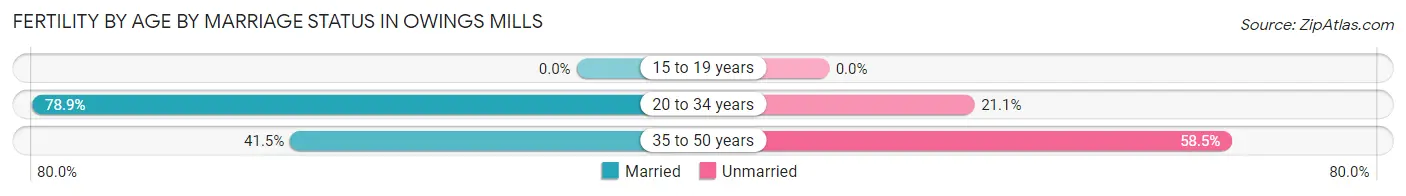
| Age Bracket | Married | Unmarried |
| 15 to 19 years | 0 (0.0%) | 0 (0.0%) |
| 20 to 34 years | 273 (78.9%) | 73 (21.1%) |
| 35 to 50 years | 22 (41.5%) | 31 (58.5%) |
| Total | 295 (73.9%) | 104 (26.1%) |
Fertility by Education in Owings Mills
Average fertility rate in Owings Mills is 38.0 births per 1,000 women. Women with the education attainment of college or associate's degree have the highest fertility rate of 55.0 births per 1,000 women, while women with the education attainment of high school diploma have the lowest fertility at 12.0 births per 1,000 women. Women with the education attainment of college or associate's degree represent 40.8% of all women with births.
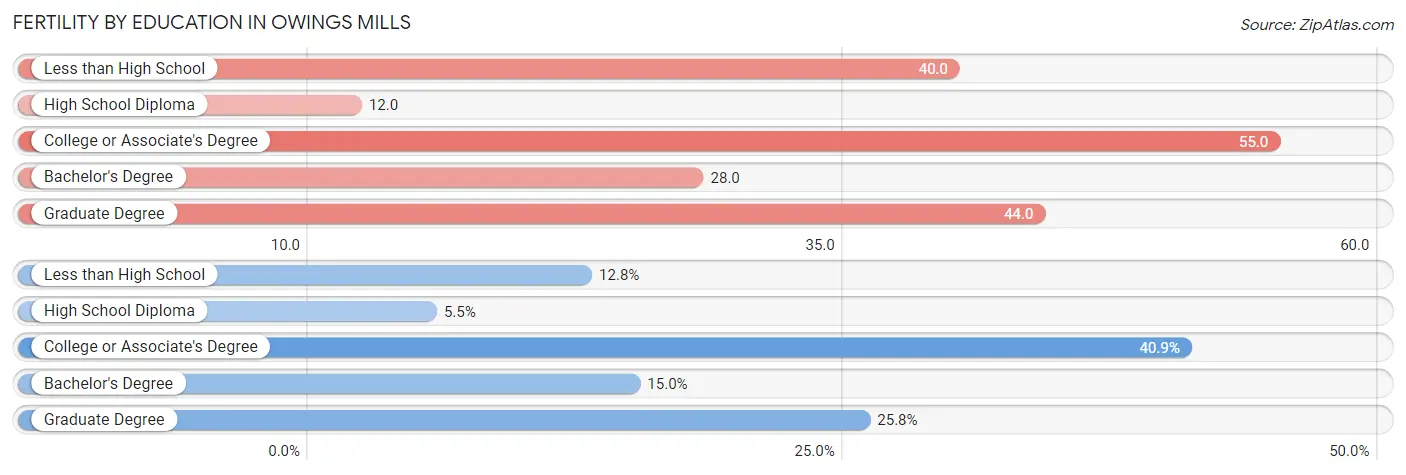
| Educational Attainment | Women with Births | Births / 1,000 Women |
| Less than High School | 51 (12.8%) | 40.0 |
| High School Diploma | 22 (5.5%) | 12.0 |
| College or Associate's Degree | 163 (40.8%) | 55.0 |
| Bachelor's Degree | 60 (15.0%) | 28.0 |
| Graduate Degree | 103 (25.8%) | 44.0 |
| Total | 399 (100.0%) | 38.0 |
Fertility by Education by Marriage Status in Owings Mills
26.1% of women with births in Owings Mills are unmarried. Women with the educational attainment of college or associate's degree are most likely to be married with 100.0% of them married at childbirth, while women with the educational attainment of less than high school are least likely to be married with 100.0% of them unmarried at childbirth.
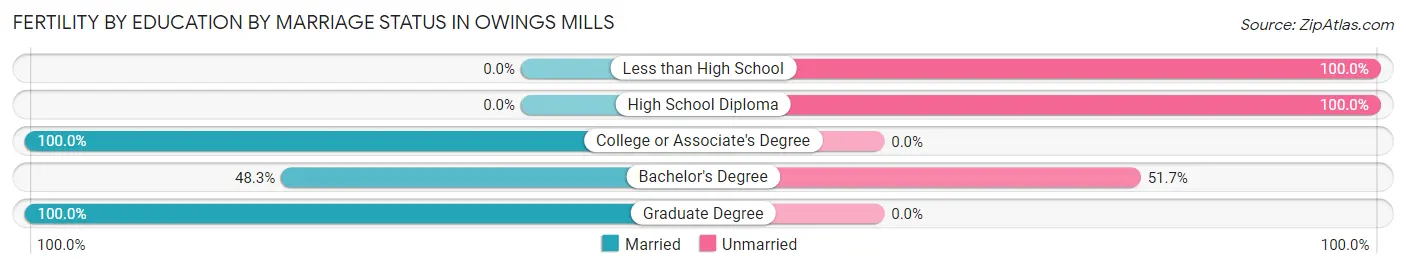
| Educational Attainment | Married | Unmarried |
| Less than High School | 0 (0.0%) | 51 (100.0%) |
| High School Diploma | 0 (0.0%) | 22 (100.0%) |
| College or Associate's Degree | 163 (100.0%) | 0 (0.0%) |
| Bachelor's Degree | 29 (48.3%) | 31 (51.7%) |
| Graduate Degree | 103 (100.0%) | 0 (0.0%) |
| Total | 295 (73.9%) | 104 (26.1%) |
Employment Characteristics in Owings Mills
Employment by Class of Employer in Owings Mills
Among the 19,367 employed individuals in Owings Mills, private company employees (12,008 | 62.0%), not-for-profit organizations (2,075 | 10.7%), and federal government employees (1,939 | 10.0%) make up the most common classes of employment.
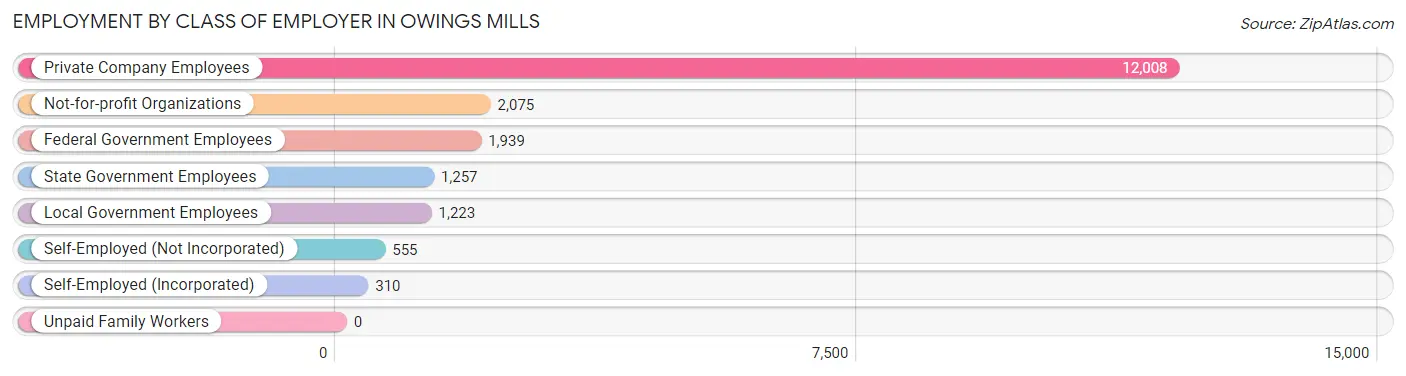
| Employer Class | # Employees | % Employees |
| Private Company Employees | 12,008 | 62.0% |
| Self-Employed (Incorporated) | 310 | 1.6% |
| Self-Employed (Not Incorporated) | 555 | 2.9% |
| Not-for-profit Organizations | 2,075 | 10.7% |
| Local Government Employees | 1,223 | 6.3% |
| State Government Employees | 1,257 | 6.5% |
| Federal Government Employees | 1,939 | 10.0% |
| Unpaid Family Workers | 0 | 0.0% |
| Total | 19,367 | 100.0% |
Employment Status by Age in Owings Mills
According to the labor force statistics for Owings Mills, out of the total population over 16 years of age (28,357), 73.6% or 20,871 individuals are in the labor force, with 5.7% or 1,190 of them unemployed. The age group with the highest labor force participation rate is 45 to 54 years, with 95.0% or 4,366 individuals in the labor force. Within the labor force, the 16 to 19 years age range has the highest percentage of unemployed individuals, with 20.0% or 185 of them being unemployed.
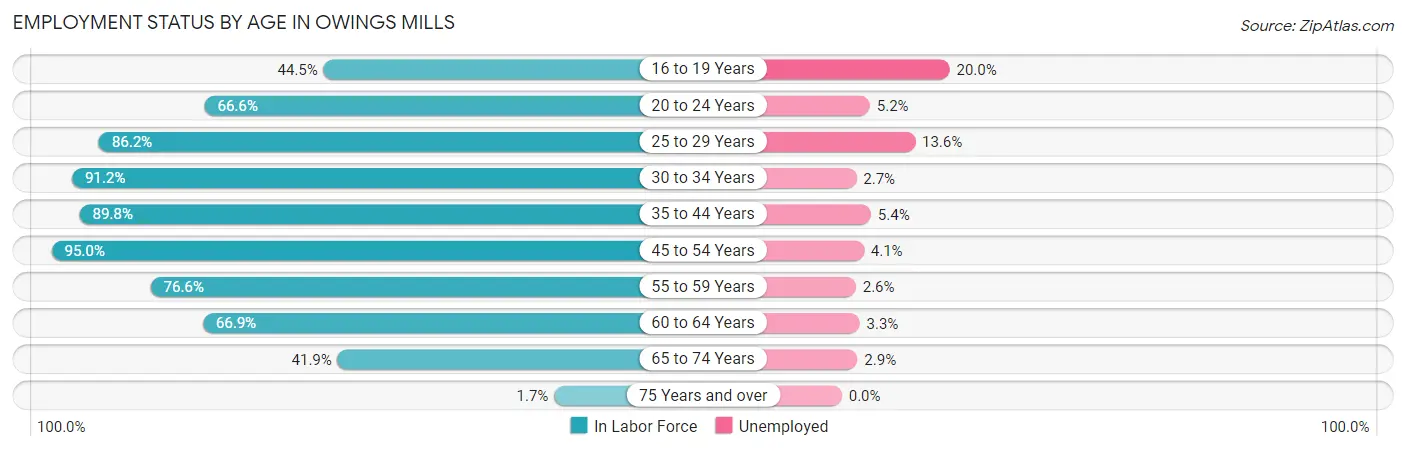
| Age Bracket | In Labor Force | Unemployed |
| 16 to 19 Years | 926 (44.5%) | 185 (20.0%) |
| 20 to 24 Years | 1,625 (66.6%) | 84 (5.2%) |
| 25 to 29 Years | 2,379 (86.2%) | 324 (13.6%) |
| 30 to 34 Years | 3,580 (91.2%) | 97 (2.7%) |
| 35 to 44 Years | 3,724 (89.8%) | 201 (5.4%) |
| 45 to 54 Years | 4,366 (95.0%) | 179 (4.1%) |
| 55 to 59 Years | 1,777 (76.6%) | 46 (2.6%) |
| 60 to 64 Years | 1,322 (66.9%) | 44 (3.3%) |
| 65 to 74 Years | 1,141 (41.9%) | 33 (2.9%) |
| 75 Years and over | 24 (1.7%) | 0 (0.0%) |
| Total | 20,871 (73.6%) | 1,190 (5.7%) |
Employment Status by Educational Attainment in Owings Mills
According to labor force statistics for Owings Mills, 86.9% of individuals (17,140) out of the total population between 25 and 64 years of age (19,724) are in the labor force, with 5.2% or 891 of them being unemployed. The group with the highest labor force participation rate are those with the educational attainment of bachelor's degree or higher, with 93.8% or 8,816 individuals in the labor force. Within the labor force, individuals with high school diploma education have the highest percentage of unemployment, with 8.9% or 250 of them being unemployed.
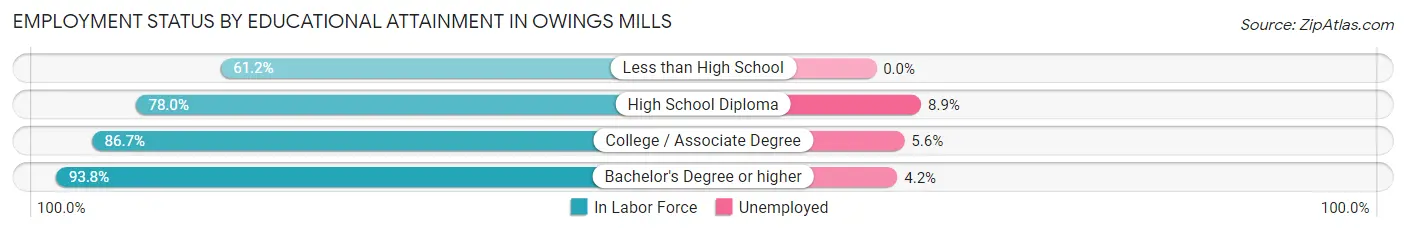
| Educational Attainment | In Labor Force | Unemployed |
| Less than High School | 739 (61.2%) | 0 (0.0%) |
| High School Diploma | 2,810 (78.0%) | 321 (8.9%) |
| College / Associate Degree | 4,782 (86.7%) | 309 (5.6%) |
| Bachelor's Degree or higher | 8,816 (93.8%) | 395 (4.2%) |
| Total | 17,140 (86.9%) | 1,026 (5.2%) |
Employment Occupations by Sex in Owings Mills
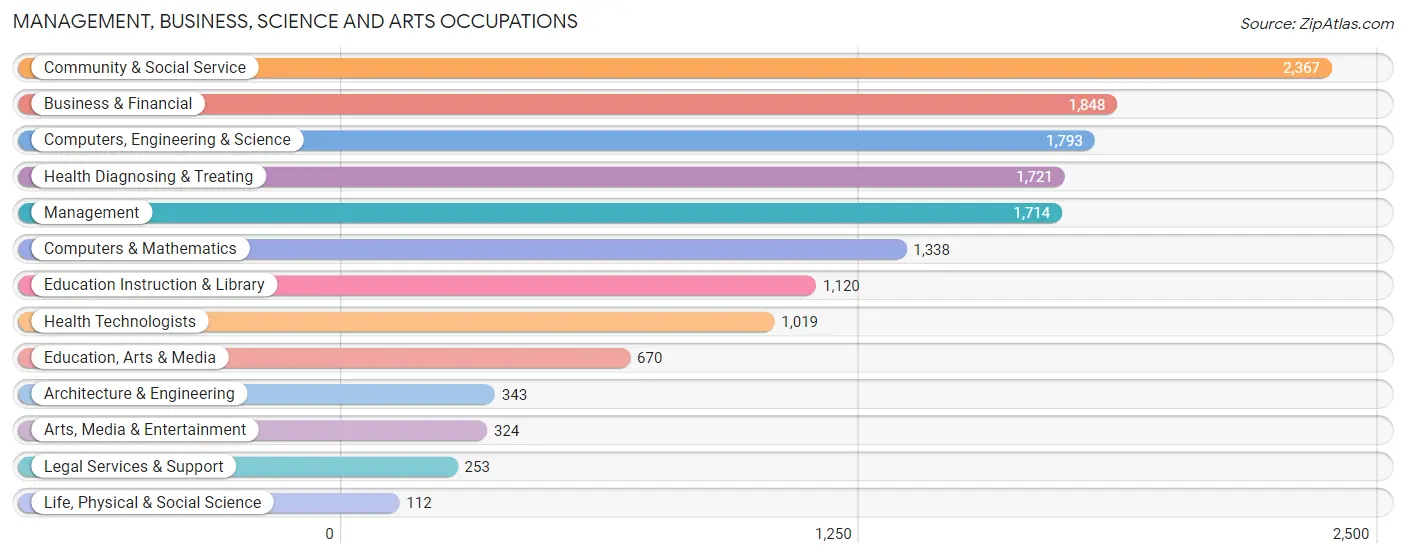
Management, Business, Science and Arts Occupations
The most common Management, Business, Science and Arts occupations in Owings Mills are Community & Social Service (2,367 | 12.0%), Business & Financial (1,848 | 9.4%), Computers, Engineering & Science (1,793 | 9.1%), Health Diagnosing & Treating (1,721 | 8.7%), and Management (1,714 | 8.7%).
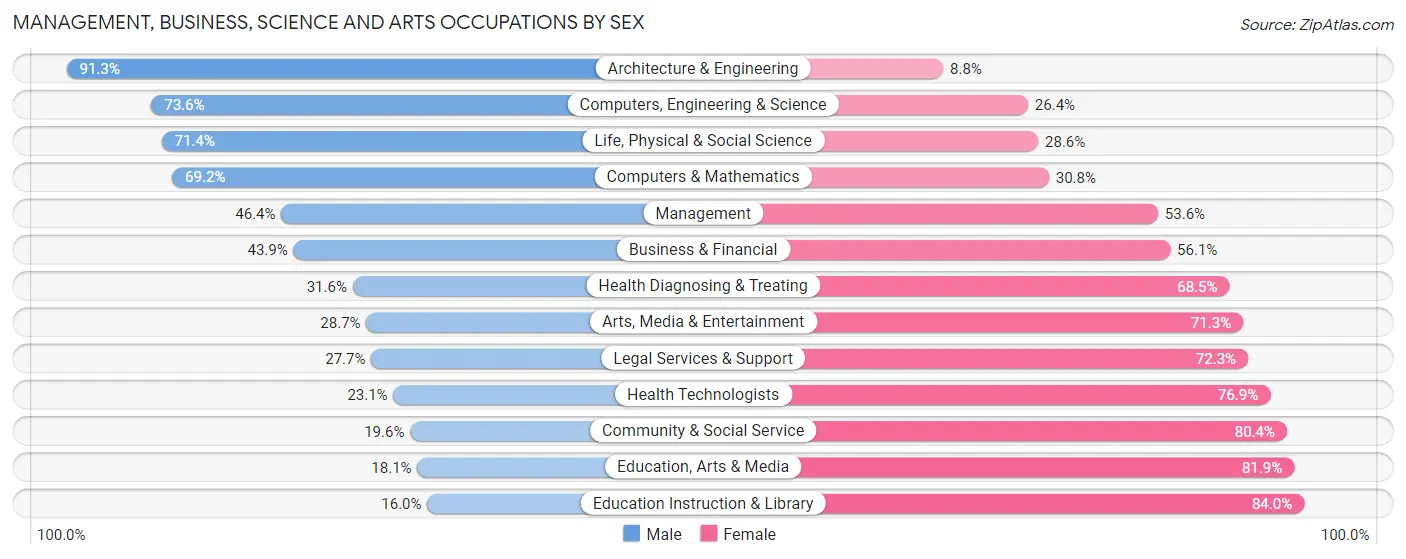
Management, Business, Science and Arts Occupations by Sex
Within the Management, Business, Science and Arts occupations in Owings Mills, the most male-oriented occupations are Architecture & Engineering (91.2%), Computers, Engineering & Science (73.6%), and Life, Physical & Social Science (71.4%), while the most female-oriented occupations are Education Instruction & Library (84.0%), Education, Arts & Media (81.9%), and Community & Social Service (80.4%).
| Occupation | Male | Female |
| Management | 796 (46.4%) | 918 (53.6%) |
| Business & Financial | 811 (43.9%) | 1,037 (56.1%) |
| Computers, Engineering & Science | 1,319 (73.6%) | 474 (26.4%) |
| Computers & Mathematics | 926 (69.2%) | 412 (30.8%) |
| Architecture & Engineering | 313 (91.2%) | 30 (8.7%) |
| Life, Physical & Social Science | 80 (71.4%) | 32 (28.6%) |
| Community & Social Service | 463 (19.6%) | 1,904 (80.4%) |
| Education, Arts & Media | 121 (18.1%) | 549 (81.9%) |
| Legal Services & Support | 70 (27.7%) | 183 (72.3%) |
| Education Instruction & Library | 179 (16.0%) | 941 (84.0%) |
| Arts, Media & Entertainment | 93 (28.7%) | 231 (71.3%) |
| Health Diagnosing & Treating | 543 (31.6%) | 1,178 (68.4%) |
| Health Technologists | 235 (23.1%) | 784 (76.9%) |
| Total (Category) | 3,932 (41.6%) | 5,511 (58.4%) |
| Total (Overall) | 8,858 (45.0%) | 10,815 (55.0%) |
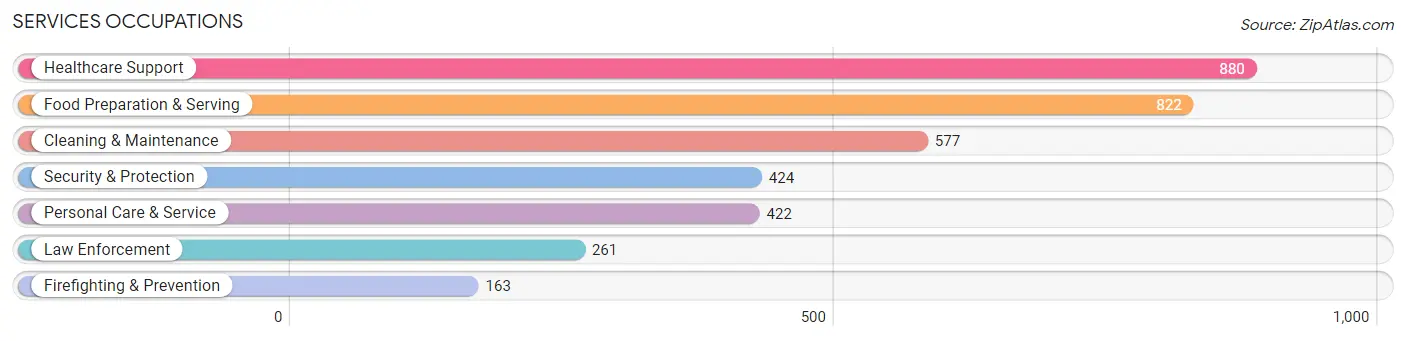
Services Occupations
The most common Services occupations in Owings Mills are Healthcare Support (880 | 4.5%), Food Preparation & Serving (822 | 4.2%), Cleaning & Maintenance (577 | 2.9%), Security & Protection (424 | 2.2%), and Personal Care & Service (422 | 2.1%).
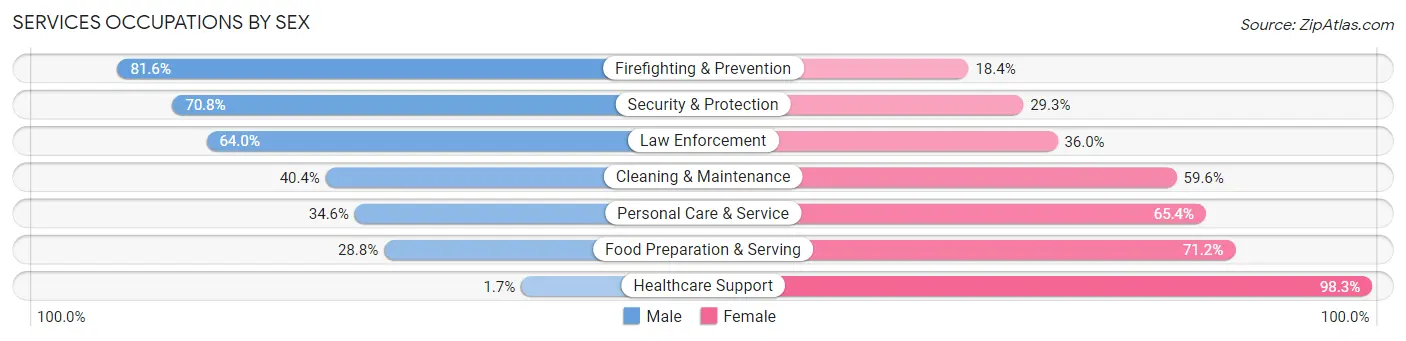
Services Occupations by Sex
Within the Services occupations in Owings Mills, the most male-oriented occupations are Firefighting & Prevention (81.6%), Security & Protection (70.8%), and Law Enforcement (64.0%), while the most female-oriented occupations are Healthcare Support (98.3%), Food Preparation & Serving (71.2%), and Personal Care & Service (65.4%).
| Occupation | Male | Female |
| Healthcare Support | 15 (1.7%) | 865 (98.3%) |
| Security & Protection | 300 (70.8%) | 124 (29.2%) |
| Firefighting & Prevention | 133 (81.6%) | 30 (18.4%) |
| Law Enforcement | 167 (64.0%) | 94 (36.0%) |
| Food Preparation & Serving | 237 (28.8%) | 585 (71.2%) |
| Cleaning & Maintenance | 233 (40.4%) | 344 (59.6%) |
| Personal Care & Service | 146 (34.6%) | 276 (65.4%) |
| Total (Category) | 931 (29.8%) | 2,194 (70.2%) |
| Total (Overall) | 8,858 (45.0%) | 10,815 (55.0%) |
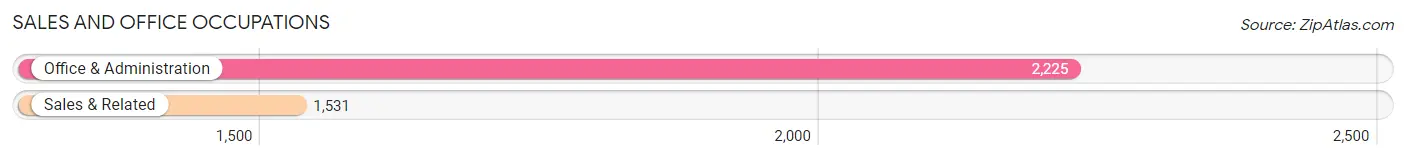
Sales and Office Occupations
The most common Sales and Office occupations in Owings Mills are Office & Administration (2,225 | 11.3%), and Sales & Related (1,531 | 7.8%).
Sales and Office Occupations by Sex
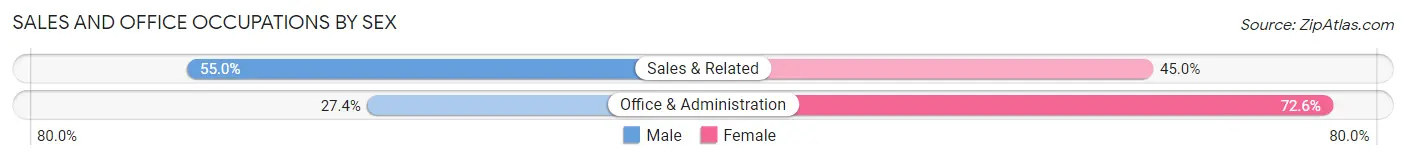
| Occupation | Male | Female |
| Sales & Related | 842 (55.0%) | 689 (45.0%) |
| Office & Administration | 609 (27.4%) | 1,616 (72.6%) |
| Total (Category) | 1,451 (38.6%) | 2,305 (61.4%) |
| Total (Overall) | 8,858 (45.0%) | 10,815 (55.0%) |
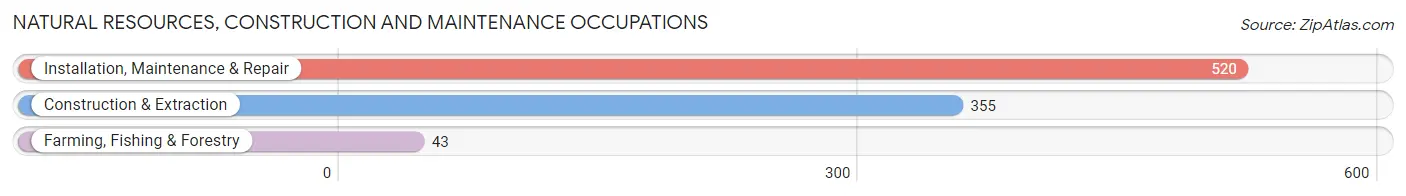
Natural Resources, Construction and Maintenance Occupations
The most common Natural Resources, Construction and Maintenance occupations in Owings Mills are Installation, Maintenance & Repair (520 | 2.6%), Construction & Extraction (355 | 1.8%), and Farming, Fishing & Forestry (43 | 0.2%).
Natural Resources, Construction and Maintenance Occupations by Sex
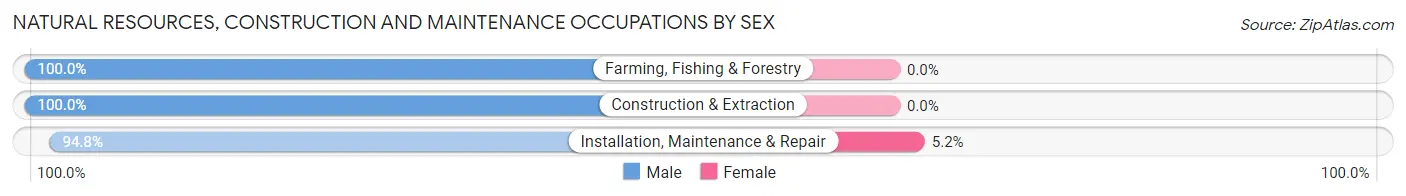
| Occupation | Male | Female |
| Farming, Fishing & Forestry | 43 (100.0%) | 0 (0.0%) |
| Construction & Extraction | 355 (100.0%) | 0 (0.0%) |
| Installation, Maintenance & Repair | 493 (94.8%) | 27 (5.2%) |
| Total (Category) | 891 (97.1%) | 27 (2.9%) |
| Total (Overall) | 8,858 (45.0%) | 10,815 (55.0%) |
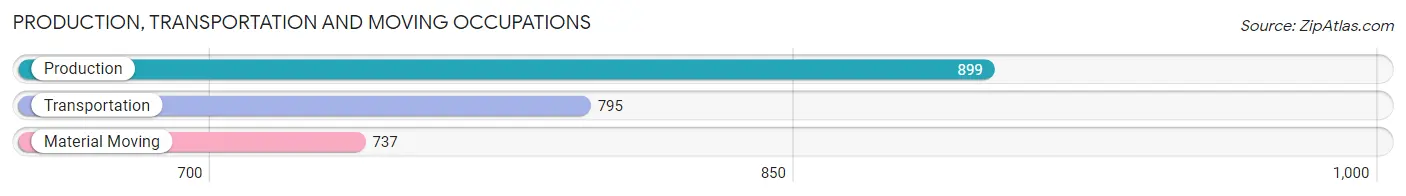
Production, Transportation and Moving Occupations
The most common Production, Transportation and Moving occupations in Owings Mills are Production (899 | 4.6%), Transportation (795 | 4.0%), and Material Moving (737 | 3.7%).
Production, Transportation and Moving Occupations by Sex
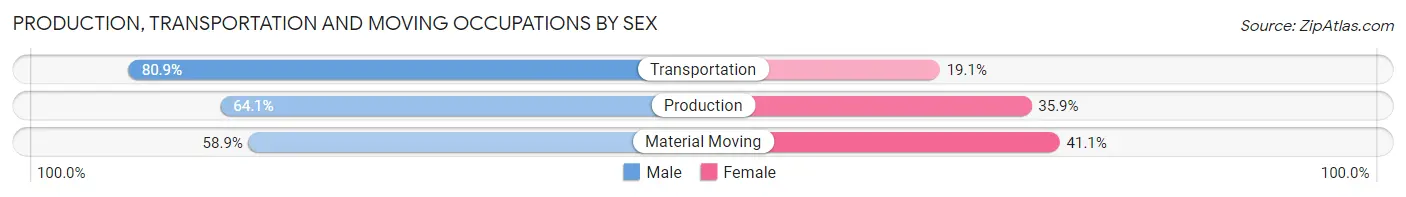
| Occupation | Male | Female |
| Production | 576 (64.1%) | 323 (35.9%) |
| Transportation | 643 (80.9%) | 152 (19.1%) |
| Material Moving | 434 (58.9%) | 303 (41.1%) |
| Total (Category) | 1,653 (68.0%) | 778 (32.0%) |
| Total (Overall) | 8,858 (45.0%) | 10,815 (55.0%) |
Employment Industries by Sex in Owings Mills
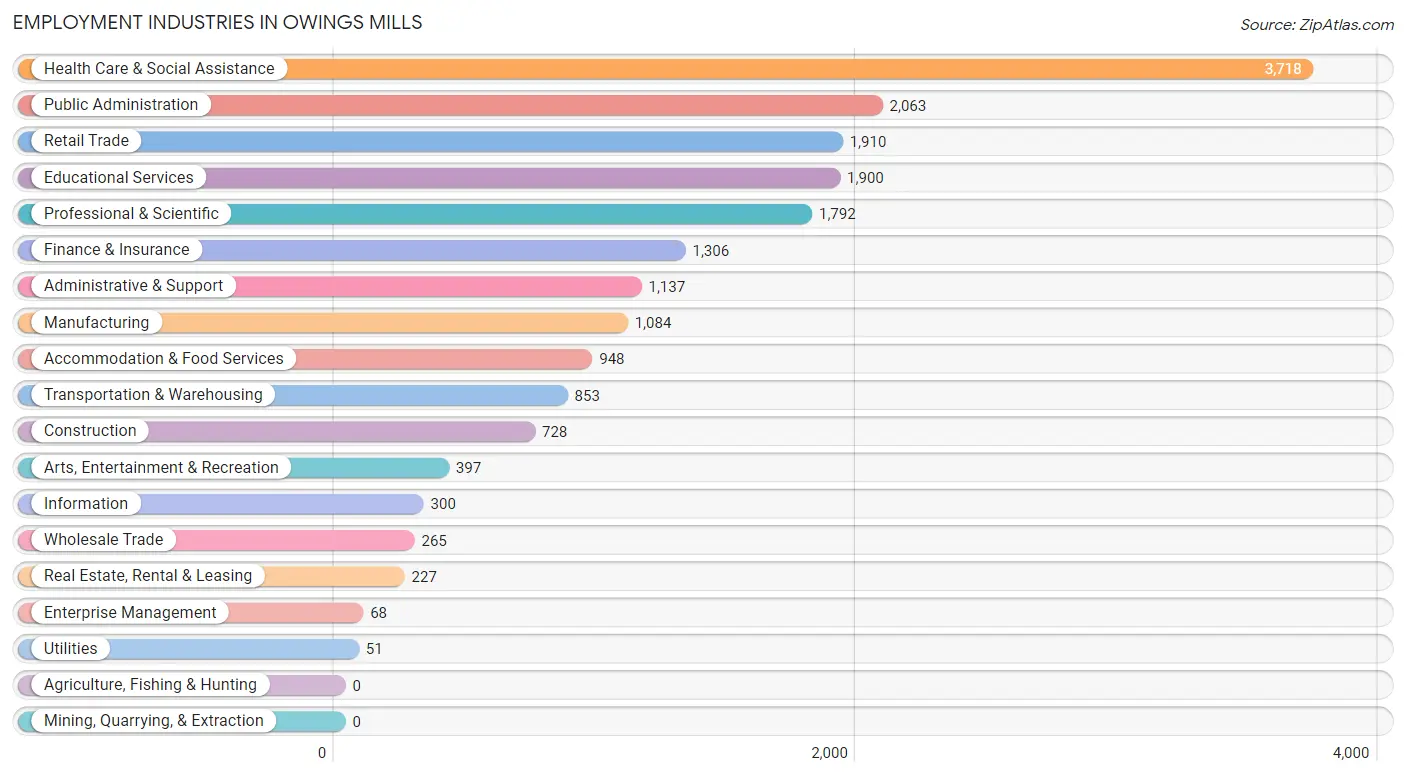
Employment Industries in Owings Mills
The major employment industries in Owings Mills include Health Care & Social Assistance (3,718 | 18.9%), Public Administration (2,063 | 10.5%), Retail Trade (1,910 | 9.7%), Educational Services (1,900 | 9.7%), and Professional & Scientific (1,792 | 9.1%).
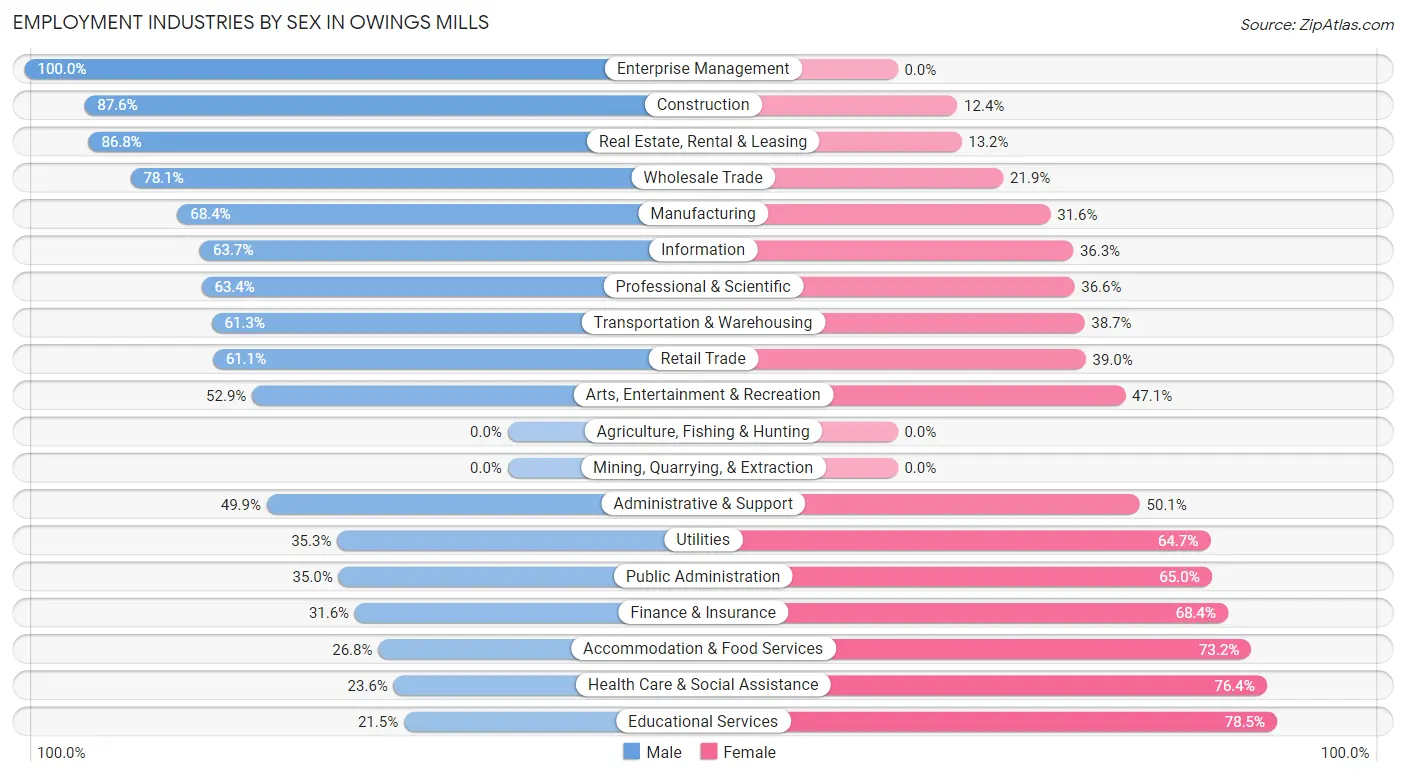
Employment Industries by Sex in Owings Mills
The Owings Mills industries that see more men than women are Enterprise Management (100.0%), Construction (87.6%), and Real Estate, Rental & Leasing (86.8%), whereas the industries that tend to have a higher number of women are Educational Services (78.5%), Health Care & Social Assistance (76.4%), and Accommodation & Food Services (73.2%).
| Industry | Male | Female |
| Agriculture, Fishing & Hunting | 0 (0.0%) | 0 (0.0%) |
| Mining, Quarrying, & Extraction | 0 (0.0%) | 0 (0.0%) |
| Construction | 638 (87.6%) | 90 (12.4%) |
| Manufacturing | 741 (68.4%) | 343 (31.6%) |
| Wholesale Trade | 207 (78.1%) | 58 (21.9%) |
| Retail Trade | 1,166 (61.1%) | 744 (39.0%) |
| Transportation & Warehousing | 523 (61.3%) | 330 (38.7%) |
| Utilities | 18 (35.3%) | 33 (64.7%) |
| Information | 191 (63.7%) | 109 (36.3%) |
| Finance & Insurance | 413 (31.6%) | 893 (68.4%) |
| Real Estate, Rental & Leasing | 197 (86.8%) | 30 (13.2%) |
| Professional & Scientific | 1,136 (63.4%) | 656 (36.6%) |
| Enterprise Management | 68 (100.0%) | 0 (0.0%) |
| Administrative & Support | 567 (49.9%) | 570 (50.1%) |
| Educational Services | 408 (21.5%) | 1,492 (78.5%) |
| Health Care & Social Assistance | 878 (23.6%) | 2,840 (76.4%) |
| Arts, Entertainment & Recreation | 210 (52.9%) | 187 (47.1%) |
| Accommodation & Food Services | 254 (26.8%) | 694 (73.2%) |
| Public Administration | 722 (35.0%) | 1,341 (65.0%) |
| Total | 8,858 (45.0%) | 10,815 (55.0%) |
Education in Owings Mills
School Enrollment in Owings Mills
The most common levels of schooling among the 9,535 students in Owings Mills are college / undergraduate (3,294 | 34.5%), middle school (1,680 | 17.6%), and high school (1,660 | 17.4%).
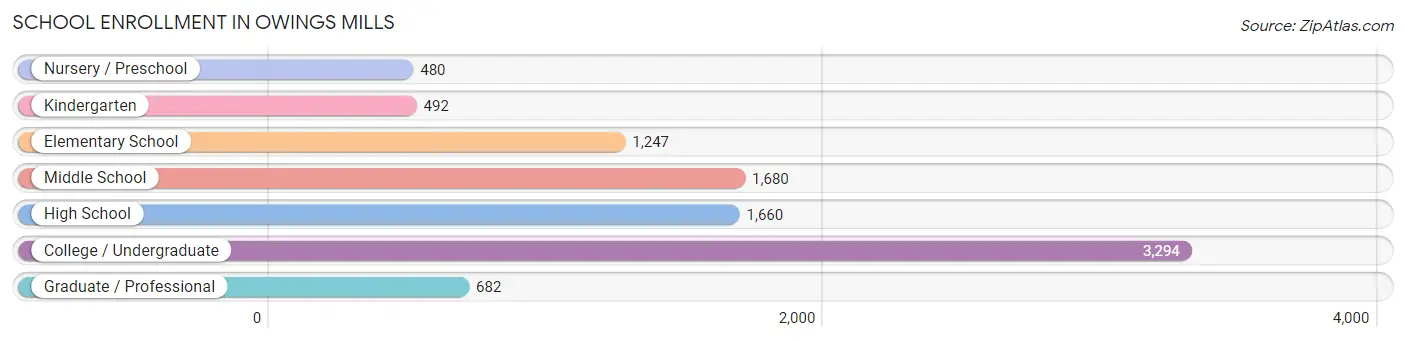
| School Level | # Students | % Students |
| Nursery / Preschool | 480 | 5.0% |
| Kindergarten | 492 | 5.2% |
| Elementary School | 1,247 | 13.1% |
| Middle School | 1,680 | 17.6% |
| High School | 1,660 | 17.4% |
| College / Undergraduate | 3,294 | 34.5% |
| Graduate / Professional | 682 | 7.1% |
| Total | 9,535 | 100.0% |
School Enrollment by Age by Funding Source in Owings Mills
Out of a total of 9,535 students who are enrolled in schools in Owings Mills, 2,260 (23.7%) attend a private institution, while the remaining 7,275 (76.3%) are enrolled in public schools. The age group of 18 to 19 year olds has the highest likelihood of being enrolled in private schools, with 530 (48.7% in the age bracket) enrolled. Conversely, the age group of 15 to 17 year olds has the lowest likelihood of being enrolled in a private school, with 1,180 (95.1% in the age bracket) attending a public institution.
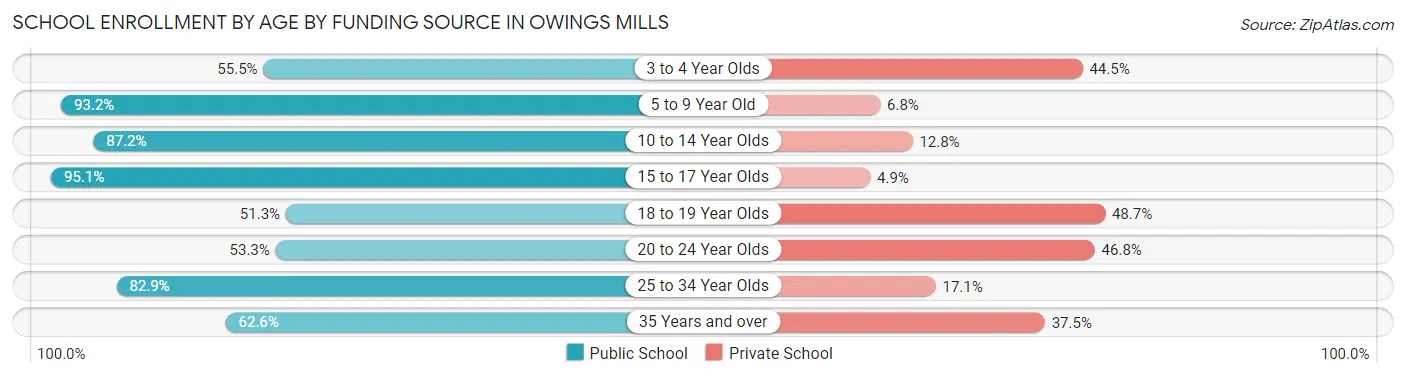
| Age Bracket | Public School | Private School |
| 3 to 4 Year Olds | 201 (55.5%) | 161 (44.5%) |
| 5 to 9 Year Old | 1,718 (93.2%) | 125 (6.8%) |
| 10 to 14 Year Olds | 1,647 (87.2%) | 242 (12.8%) |
| 15 to 17 Year Olds | 1,180 (95.1%) | 61 (4.9%) |
| 18 to 19 Year Olds | 559 (51.3%) | 530 (48.7%) |
| 20 to 24 Year Olds | 803 (53.2%) | 705 (46.8%) |
| 25 to 34 Year Olds | 678 (82.9%) | 140 (17.1%) |
| 35 Years and over | 491 (62.5%) | 294 (37.4%) |
| Total | 7,275 (76.3%) | 2,260 (23.7%) |
Educational Attainment by Field of Study in Owings Mills
Business (2,568 | 22.1%), science & technology (1,378 | 11.9%), computers & mathematics (1,235 | 10.6%), education (868 | 7.5%), and engineering (818 | 7.0%) are the most common fields of study among 11,603 individuals in Owings Mills who have obtained a bachelor's degree or higher.
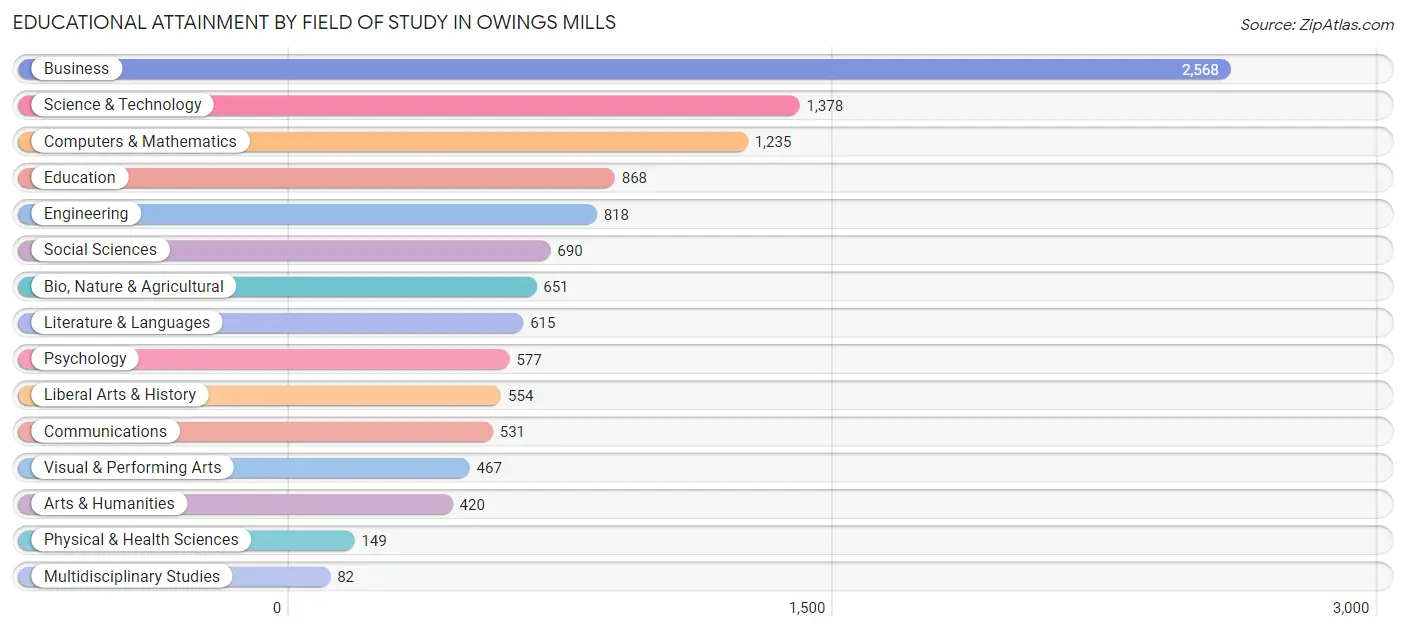
| Field of Study | # Graduates | % Graduates |
| Computers & Mathematics | 1,235 | 10.6% |
| Bio, Nature & Agricultural | 651 | 5.6% |
| Physical & Health Sciences | 149 | 1.3% |
| Psychology | 577 | 5.0% |
| Social Sciences | 690 | 5.9% |
| Engineering | 818 | 7.0% |
| Multidisciplinary Studies | 82 | 0.7% |
| Science & Technology | 1,378 | 11.9% |
| Business | 2,568 | 22.1% |
| Education | 868 | 7.5% |
| Literature & Languages | 615 | 5.3% |
| Liberal Arts & History | 554 | 4.8% |
| Visual & Performing Arts | 467 | 4.0% |
| Communications | 531 | 4.6% |
| Arts & Humanities | 420 | 3.6% |
| Total | 11,603 | 100.0% |
Transportation & Commute in Owings Mills
Vehicle Availability by Sex in Owings Mills
The most prevalent vehicle ownership categories in Owings Mills are males with 2 vehicles (3,303, accounting for 38.5%) and females with 2 vehicles (3,158, making up 32.1%).
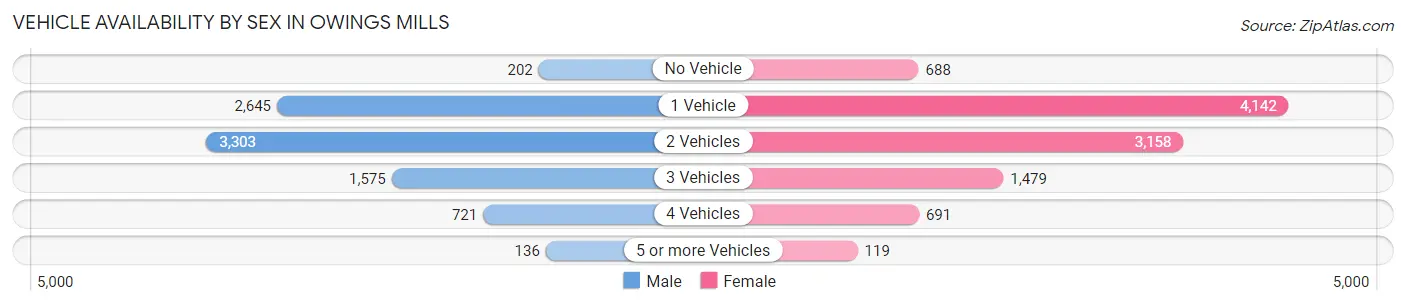
| Vehicles Available | Male | Female |
| No Vehicle | 202 (2.4%) | 688 (6.7%) |
| 1 Vehicle | 2,645 (30.8%) | 4,142 (40.3%) |
| 2 Vehicles | 3,303 (38.5%) | 3,158 (30.7%) |
| 3 Vehicles | 1,575 (18.3%) | 1,479 (14.4%) |
| 4 Vehicles | 721 (8.4%) | 691 (6.7%) |
| 5 or more Vehicles | 136 (1.6%) | 119 (1.2%) |
| Total | 8,582 (100.0%) | 10,277 (100.0%) |
Commute Time in Owings Mills
The most frequently occuring commute durations in Owings Mills are 30 to 34 minutes (2,699 commuters, 16.2%), 20 to 24 minutes (1,964 commuters, 11.8%), and 10 to 14 minutes (1,702 commuters, 10.2%).
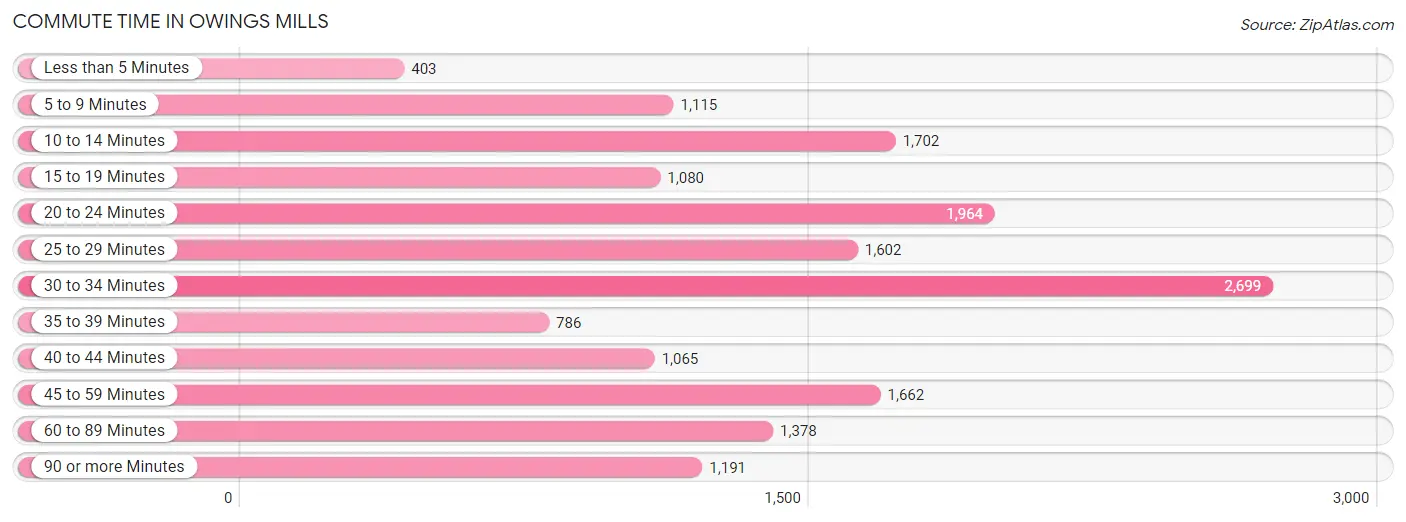
| Commute Time | # Commuters | % Commuters |
| Less than 5 Minutes | 403 | 2.4% |
| 5 to 9 Minutes | 1,115 | 6.7% |
| 10 to 14 Minutes | 1,702 | 10.2% |
| 15 to 19 Minutes | 1,080 | 6.5% |
| 20 to 24 Minutes | 1,964 | 11.8% |
| 25 to 29 Minutes | 1,602 | 9.6% |
| 30 to 34 Minutes | 2,699 | 16.2% |
| 35 to 39 Minutes | 786 | 4.7% |
| 40 to 44 Minutes | 1,065 | 6.4% |
| 45 to 59 Minutes | 1,662 | 10.0% |
| 60 to 89 Minutes | 1,378 | 8.3% |
| 90 or more Minutes | 1,191 | 7.1% |
Commute Time by Sex in Owings Mills
The most common commute times in Owings Mills are 30 to 34 minutes (1,078 commuters, 14.5%) for males and 30 to 34 minutes (1,621 commuters, 17.6%) for females.
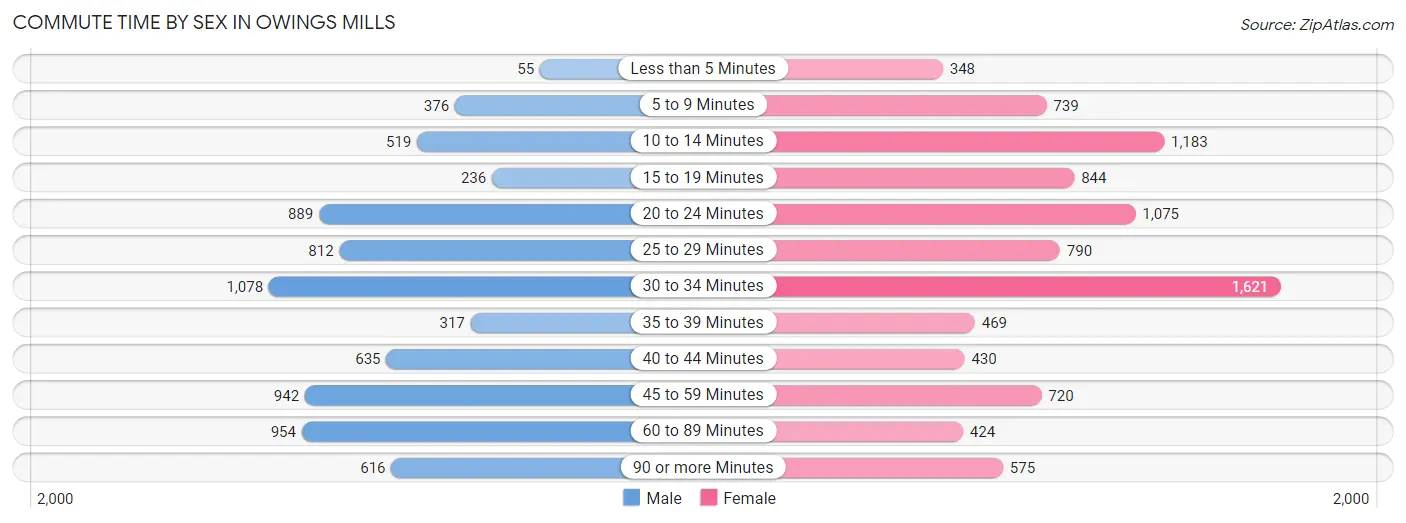
| Commute Time | Male | Female |
| Less than 5 Minutes | 55 (0.7%) | 348 (3.8%) |
| 5 to 9 Minutes | 376 (5.1%) | 739 (8.0%) |
| 10 to 14 Minutes | 519 (7.0%) | 1,183 (12.8%) |
| 15 to 19 Minutes | 236 (3.2%) | 844 (9.2%) |
| 20 to 24 Minutes | 889 (12.0%) | 1,075 (11.7%) |
| 25 to 29 Minutes | 812 (10.9%) | 790 (8.6%) |
| 30 to 34 Minutes | 1,078 (14.5%) | 1,621 (17.6%) |
| 35 to 39 Minutes | 317 (4.3%) | 469 (5.1%) |
| 40 to 44 Minutes | 635 (8.6%) | 430 (4.7%) |
| 45 to 59 Minutes | 942 (12.7%) | 720 (7.8%) |
| 60 to 89 Minutes | 954 (12.8%) | 424 (4.6%) |
| 90 or more Minutes | 616 (8.3%) | 575 (6.2%) |
Time of Departure to Work by Sex in Owings Mills
The most frequent times of departure to work in Owings Mills are 7:00 AM to 7:29 AM (852, 11.5%) for males and 8:00 AM to 8:29 AM (1,775, 19.3%) for females.
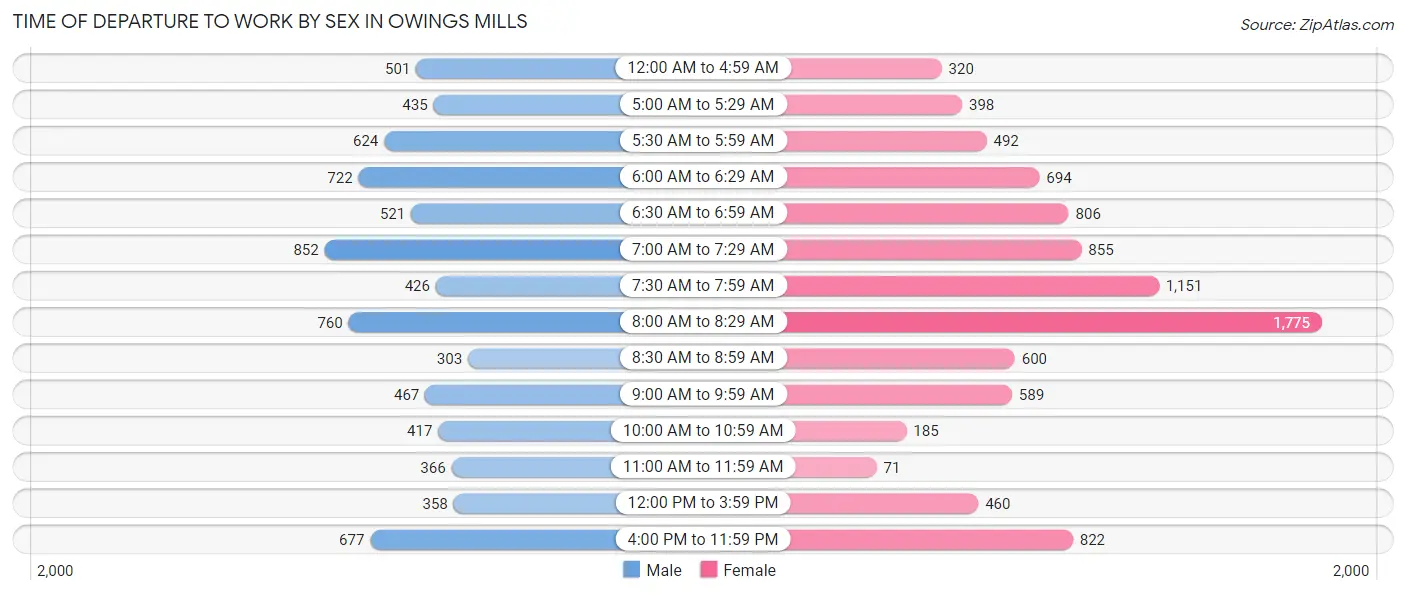
| Time of Departure | Male | Female |
| 12:00 AM to 4:59 AM | 501 (6.7%) | 320 (3.5%) |
| 5:00 AM to 5:29 AM | 435 (5.9%) | 398 (4.3%) |
| 5:30 AM to 5:59 AM | 624 (8.4%) | 492 (5.3%) |
| 6:00 AM to 6:29 AM | 722 (9.7%) | 694 (7.5%) |
| 6:30 AM to 6:59 AM | 521 (7.0%) | 806 (8.7%) |
| 7:00 AM to 7:29 AM | 852 (11.5%) | 855 (9.3%) |
| 7:30 AM to 7:59 AM | 426 (5.7%) | 1,151 (12.5%) |
| 8:00 AM to 8:29 AM | 760 (10.2%) | 1,775 (19.3%) |
| 8:30 AM to 8:59 AM | 303 (4.1%) | 600 (6.5%) |
| 9:00 AM to 9:59 AM | 467 (6.3%) | 589 (6.4%) |
| 10:00 AM to 10:59 AM | 417 (5.6%) | 185 (2.0%) |
| 11:00 AM to 11:59 AM | 366 (4.9%) | 71 (0.8%) |
| 12:00 PM to 3:59 PM | 358 (4.8%) | 460 (5.0%) |
| 4:00 PM to 11:59 PM | 677 (9.1%) | 822 (8.9%) |
| Total | 7,429 (100.0%) | 9,218 (100.0%) |
Housing Occupancy in Owings Mills
Occupancy by Ownership in Owings Mills
Of the total 14,124 dwellings in Owings Mills, owner-occupied units account for 6,742 (47.7%), while renter-occupied units make up 7,382 (52.3%).
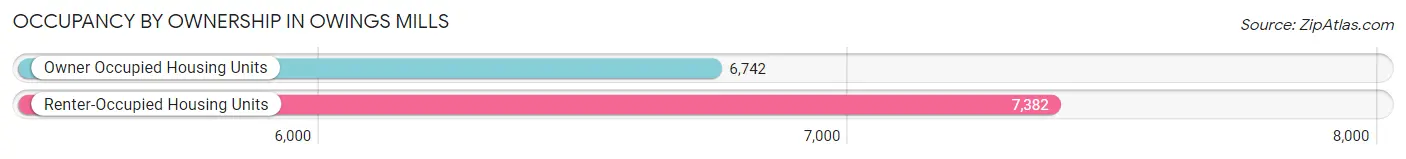
| Occupancy | # Housing Units | % Housing Units |
| Owner Occupied Housing Units | 6,742 | 47.7% |
| Renter-Occupied Housing Units | 7,382 | 52.3% |
| Total Occupied Housing Units | 14,124 | 100.0% |
Occupancy by Household Size in Owings Mills
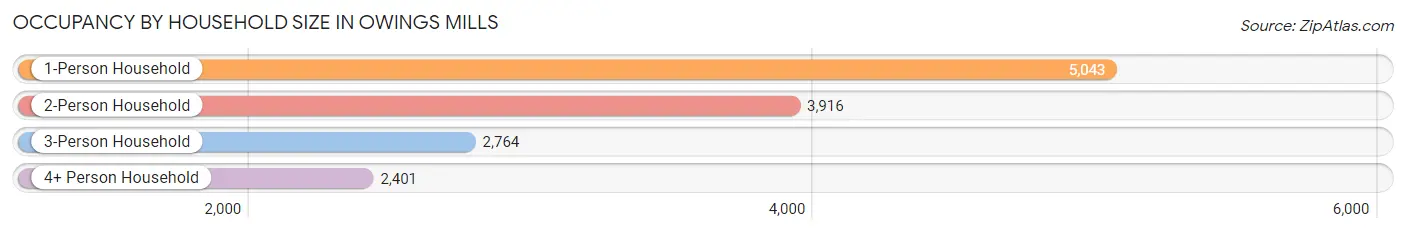
| Household Size | # Housing Units | % Housing Units |
| 1-Person Household | 5,043 | 35.7% |
| 2-Person Household | 3,916 | 27.7% |
| 3-Person Household | 2,764 | 19.6% |
| 4+ Person Household | 2,401 | 17.0% |
| Total Housing Units | 14,124 | 100.0% |
Occupancy by Ownership by Household Size in Owings Mills
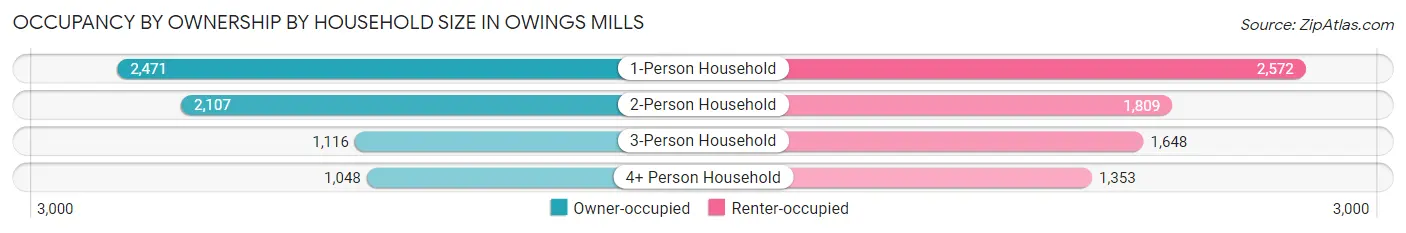
| Household Size | Owner-occupied | Renter-occupied |
| 1-Person Household | 2,471 (49.0%) | 2,572 (51.0%) |
| 2-Person Household | 2,107 (53.8%) | 1,809 (46.2%) |
| 3-Person Household | 1,116 (40.4%) | 1,648 (59.6%) |
| 4+ Person Household | 1,048 (43.6%) | 1,353 (56.4%) |
| Total Housing Units | 6,742 (47.7%) | 7,382 (52.3%) |
Occupancy by Educational Attainment in Owings Mills
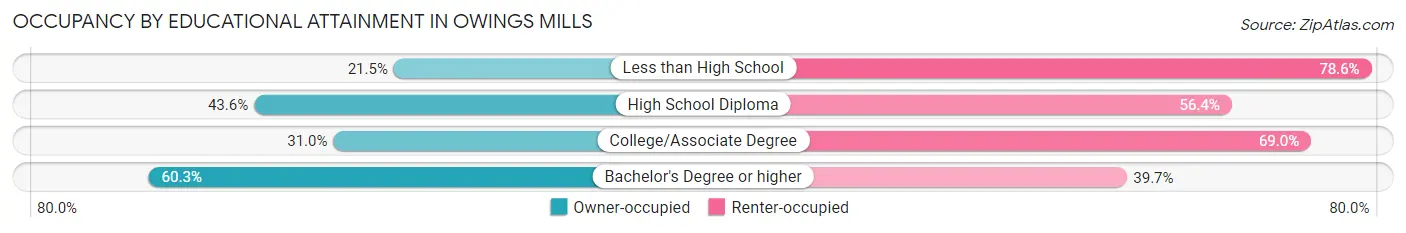
| Household Size | Owner-occupied | Renter-occupied |
| Less than High School | 124 (21.4%) | 454 (78.5%) |
| High School Diploma | 913 (43.6%) | 1,180 (56.4%) |
| College/Associate Degree | 1,276 (31.0%) | 2,835 (69.0%) |
| Bachelor's Degree or higher | 4,429 (60.3%) | 2,913 (39.7%) |
Occupancy by Age of Householder in Owings Mills
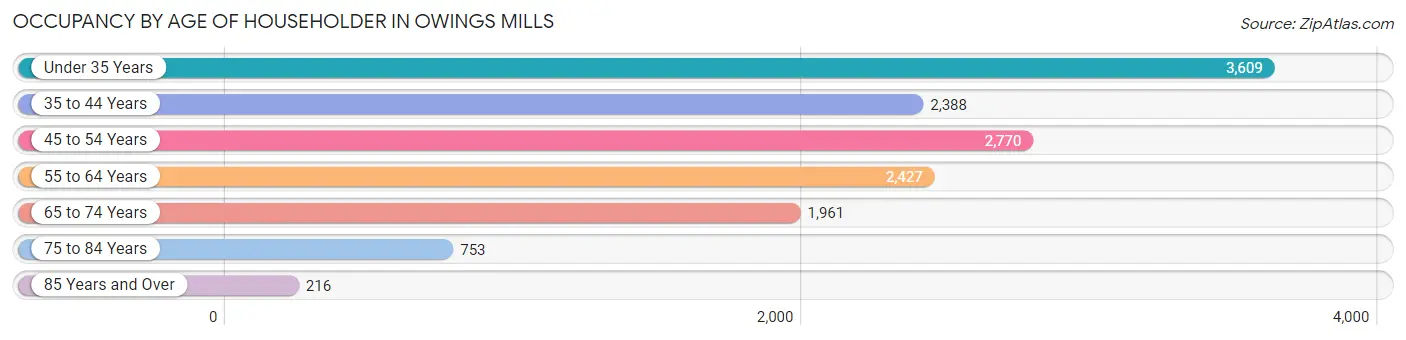
| Age Bracket | # Households | % Households |
| Under 35 Years | 3,609 | 25.6% |
| 35 to 44 Years | 2,388 | 16.9% |
| 45 to 54 Years | 2,770 | 19.6% |
| 55 to 64 Years | 2,427 | 17.2% |
| 65 to 74 Years | 1,961 | 13.9% |
| 75 to 84 Years | 753 | 5.3% |
| 85 Years and Over | 216 | 1.5% |
| Total | 14,124 | 100.0% |
Housing Finances in Owings Mills
Median Income by Occupancy in Owings Mills
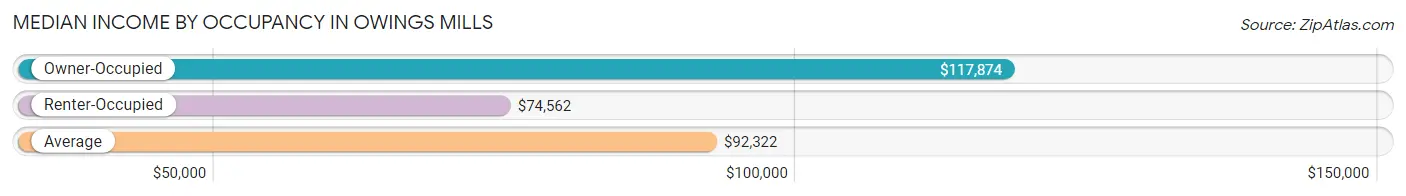
| Occupancy Type | # Households | Median Income |
| Owner-Occupied | 6,742 (47.7%) | $117,874 |
| Renter-Occupied | 7,382 (52.3%) | $74,562 |
| Average | 14,124 (100.0%) | $92,322 |
Occupancy by Householder Income Bracket in Owings Mills
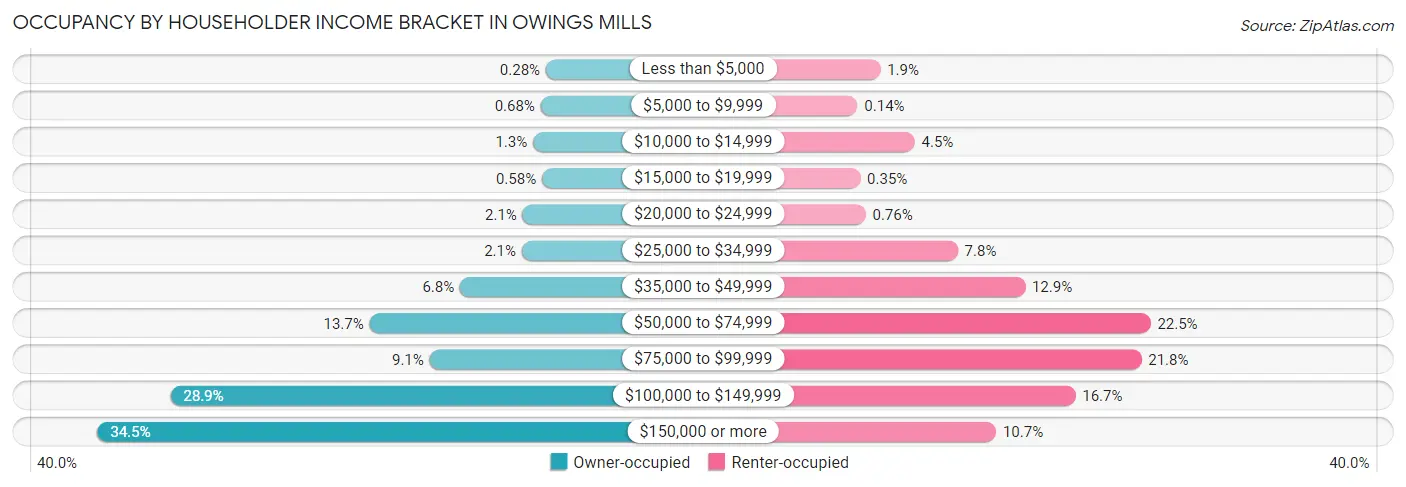
| Income Bracket | Owner-occupied | Renter-occupied |
| Less than $5,000 | 19 (0.3%) | 139 (1.9%) |
| $5,000 to $9,999 | 46 (0.7%) | 10 (0.1%) |
| $10,000 to $14,999 | 85 (1.3%) | 332 (4.5%) |
| $15,000 to $19,999 | 39 (0.6%) | 26 (0.4%) |
| $20,000 to $24,999 | 138 (2.1%) | 56 (0.8%) |
| $25,000 to $34,999 | 143 (2.1%) | 574 (7.8%) |
| $35,000 to $49,999 | 460 (6.8%) | 953 (12.9%) |
| $50,000 to $74,999 | 925 (13.7%) | 1,659 (22.5%) |
| $75,000 to $99,999 | 616 (9.1%) | 1,607 (21.8%) |
| $100,000 to $149,999 | 1,948 (28.9%) | 1,236 (16.7%) |
| $150,000 or more | 2,323 (34.5%) | 790 (10.7%) |
| Total | 6,742 (100.0%) | 7,382 (100.0%) |
Monthly Housing Cost Tiers in Owings Mills
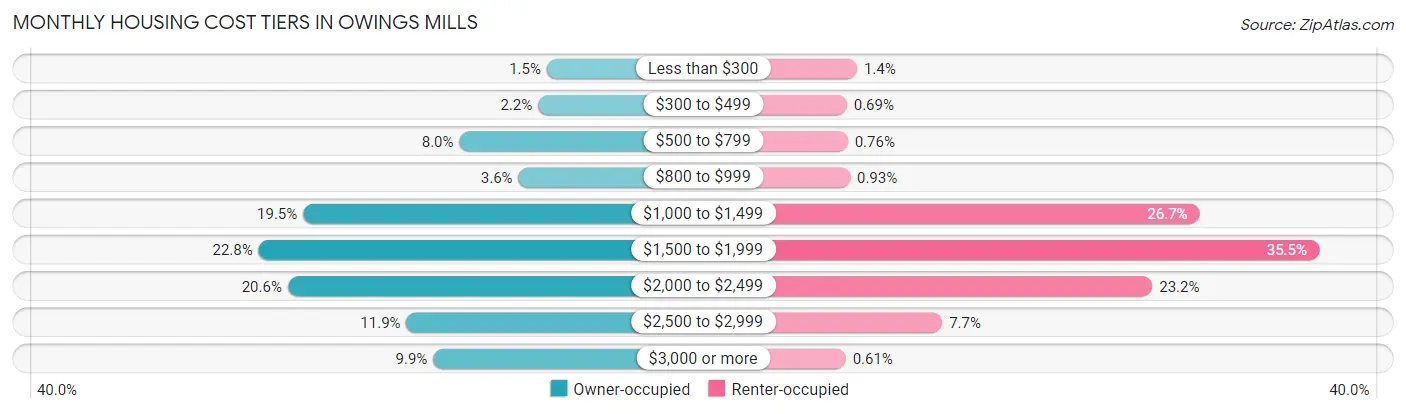
| Monthly Cost | Owner-occupied | Renter-occupied |
| Less than $300 | 104 (1.5%) | 106 (1.4%) |
| $300 to $499 | 147 (2.2%) | 51 (0.7%) |
| $500 to $799 | 538 (8.0%) | 56 (0.8%) |
| $800 to $999 | 245 (3.6%) | 69 (0.9%) |
| $1,000 to $1,499 | 1,314 (19.5%) | 1,968 (26.7%) |
| $1,500 to $1,999 | 1,535 (22.8%) | 2,617 (35.4%) |
| $2,000 to $2,499 | 1,390 (20.6%) | 1,712 (23.2%) |
| $2,500 to $2,999 | 801 (11.9%) | 570 (7.7%) |
| $3,000 or more | 668 (9.9%) | 45 (0.6%) |
| Total | 6,742 (100.0%) | 7,382 (100.0%) |
Physical Housing Characteristics in Owings Mills
Housing Structures in Owings Mills
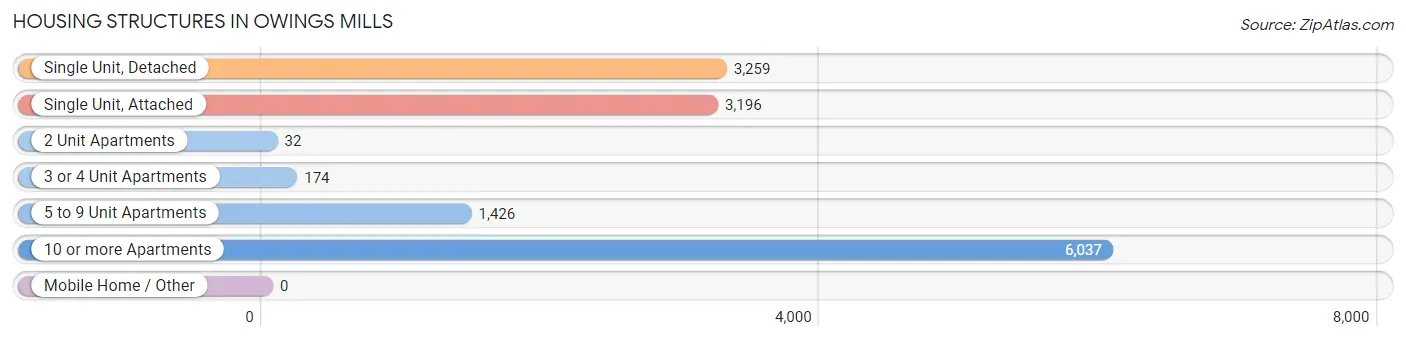
| Structure Type | # Housing Units | % Housing Units |
| Single Unit, Detached | 3,259 | 23.1% |
| Single Unit, Attached | 3,196 | 22.6% |
| 2 Unit Apartments | 32 | 0.2% |
| 3 or 4 Unit Apartments | 174 | 1.2% |
| 5 to 9 Unit Apartments | 1,426 | 10.1% |
| 10 or more Apartments | 6,037 | 42.7% |
| Mobile Home / Other | 0 | 0.0% |
| Total | 14,124 | 100.0% |
Housing Structures by Occupancy in Owings Mills
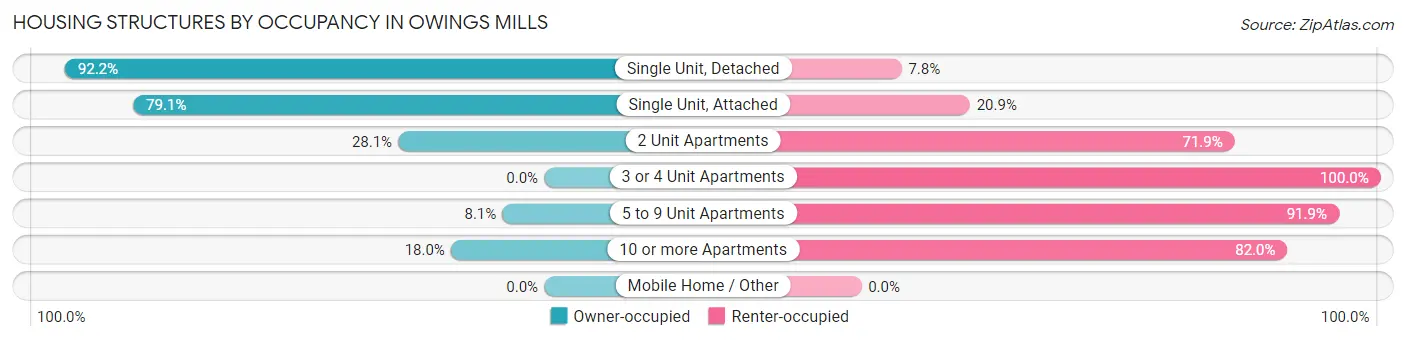
| Structure Type | Owner-occupied | Renter-occupied |
| Single Unit, Detached | 3,006 (92.2%) | 253 (7.8%) |
| Single Unit, Attached | 2,528 (79.1%) | 668 (20.9%) |
| 2 Unit Apartments | 9 (28.1%) | 23 (71.9%) |
| 3 or 4 Unit Apartments | 0 (0.0%) | 174 (100.0%) |
| 5 to 9 Unit Apartments | 115 (8.1%) | 1,311 (91.9%) |
| 10 or more Apartments | 1,084 (18.0%) | 4,953 (82.0%) |
| Mobile Home / Other | 0 (0.0%) | 0 (0.0%) |
| Total | 6,742 (47.7%) | 7,382 (52.3%) |
Housing Structures by Number of Rooms in Owings Mills
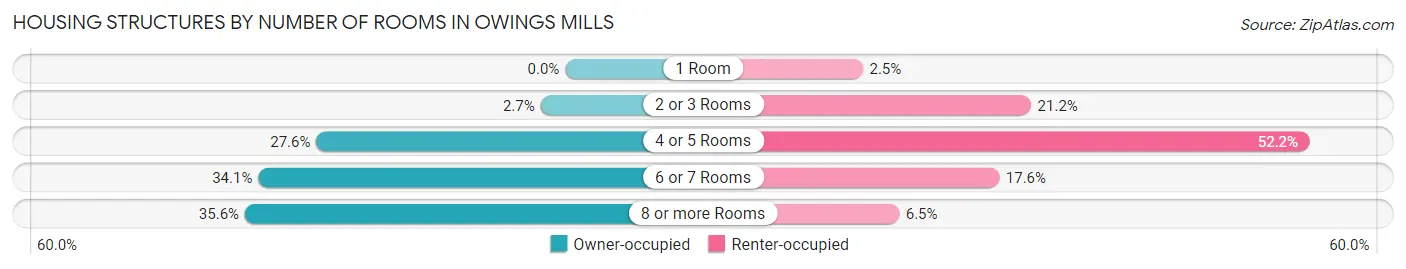
| Number of Rooms | Owner-occupied | Renter-occupied |
| 1 Room | 0 (0.0%) | 185 (2.5%) |
| 2 or 3 Rooms | 185 (2.7%) | 1,563 (21.2%) |
| 4 or 5 Rooms | 1,863 (27.6%) | 3,850 (52.1%) |
| 6 or 7 Rooms | 2,297 (34.1%) | 1,302 (17.6%) |
| 8 or more Rooms | 2,397 (35.5%) | 482 (6.5%) |
| Total | 6,742 (100.0%) | 7,382 (100.0%) |
Housing Structure by Heating Type in Owings Mills
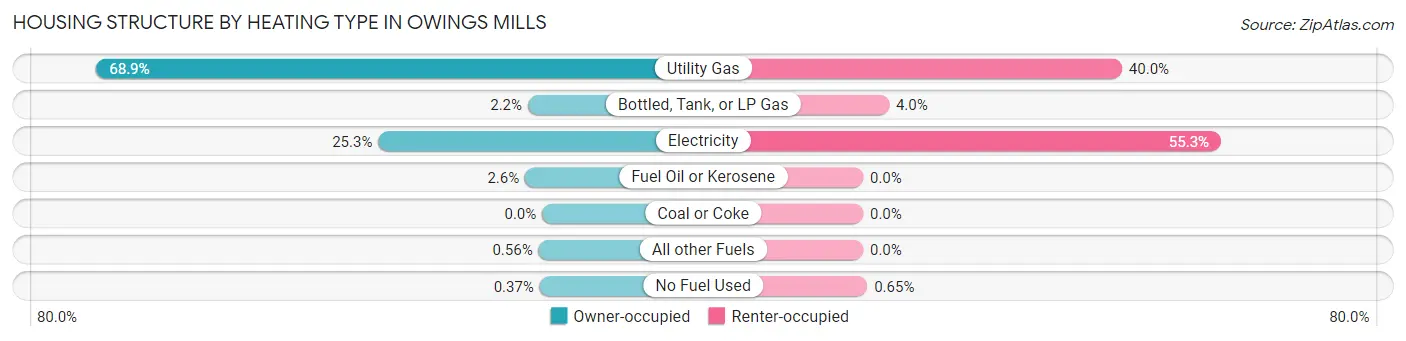
| Heating Type | Owner-occupied | Renter-occupied |
| Utility Gas | 4,645 (68.9%) | 2,954 (40.0%) |
| Bottled, Tank, or LP Gas | 148 (2.2%) | 296 (4.0%) |
| Electricity | 1,708 (25.3%) | 4,084 (55.3%) |
| Fuel Oil or Kerosene | 178 (2.6%) | 0 (0.0%) |
| Coal or Coke | 0 (0.0%) | 0 (0.0%) |
| All other Fuels | 38 (0.6%) | 0 (0.0%) |
| No Fuel Used | 25 (0.4%) | 48 (0.6%) |
| Total | 6,742 (100.0%) | 7,382 (100.0%) |
Household Vehicle Usage in Owings Mills
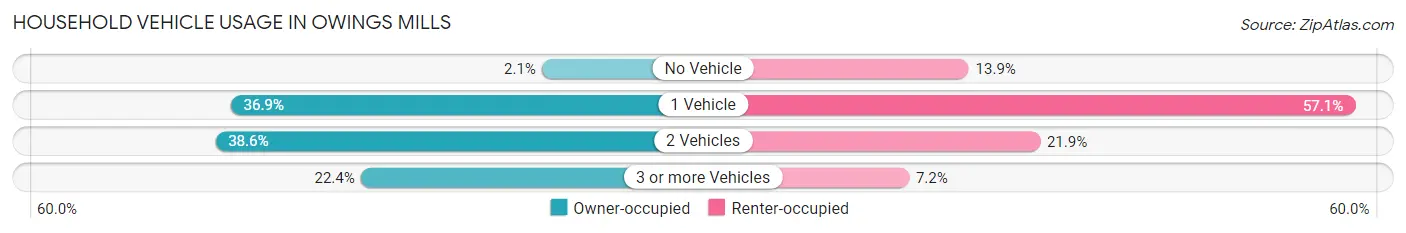
| Vehicles per Household | Owner-occupied | Renter-occupied |
| No Vehicle | 140 (2.1%) | 1,023 (13.9%) |
| 1 Vehicle | 2,489 (36.9%) | 4,217 (57.1%) |
| 2 Vehicles | 2,605 (38.6%) | 1,613 (21.8%) |
| 3 or more Vehicles | 1,508 (22.4%) | 529 (7.2%) |
| Total | 6,742 (100.0%) | 7,382 (100.0%) |
Real Estate & Mortgages in Owings Mills
Real Estate and Mortgage Overview in Owings Mills
| Characteristic | Without Mortgage | With Mortgage |
| Housing Units | 991 | 5,751 |
| Median Property Value | $345,800 | $315,800 |
| Median Household Income | $95,063 | $2,032 |
| Monthly Housing Costs | $697 | $668 |
| Real Estate Taxes | $3,749 | $194 |
Property Value by Mortgage Status in Owings Mills
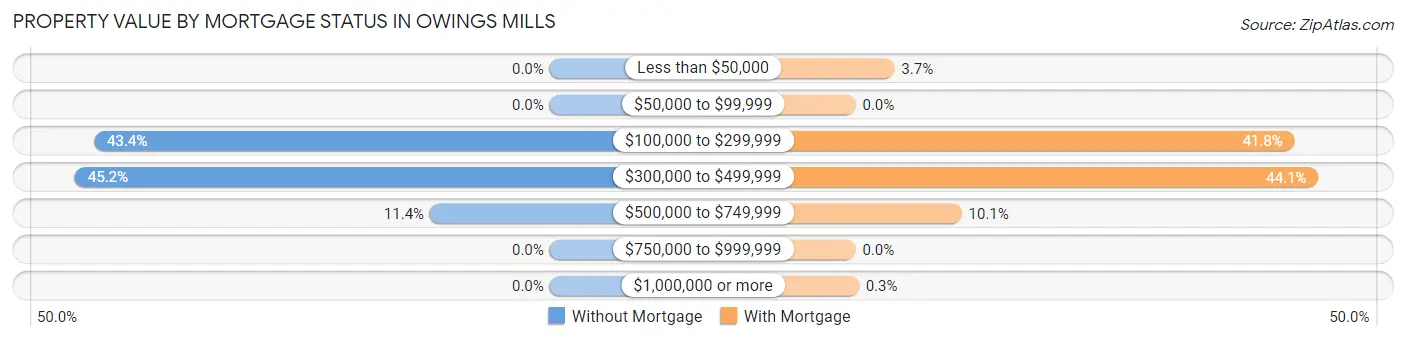
| Property Value | Without Mortgage | With Mortgage |
| Less than $50,000 | 0 (0.0%) | 213 (3.7%) |
| $50,000 to $99,999 | 0 (0.0%) | 0 (0.0%) |
| $100,000 to $299,999 | 430 (43.4%) | 2,405 (41.8%) |
| $300,000 to $499,999 | 448 (45.2%) | 2,535 (44.1%) |
| $500,000 to $749,999 | 113 (11.4%) | 581 (10.1%) |
| $750,000 to $999,999 | 0 (0.0%) | 0 (0.0%) |
| $1,000,000 or more | 0 (0.0%) | 17 (0.3%) |
| Total | 991 (100.0%) | 5,751 (100.0%) |
Household Income by Mortgage Status in Owings Mills
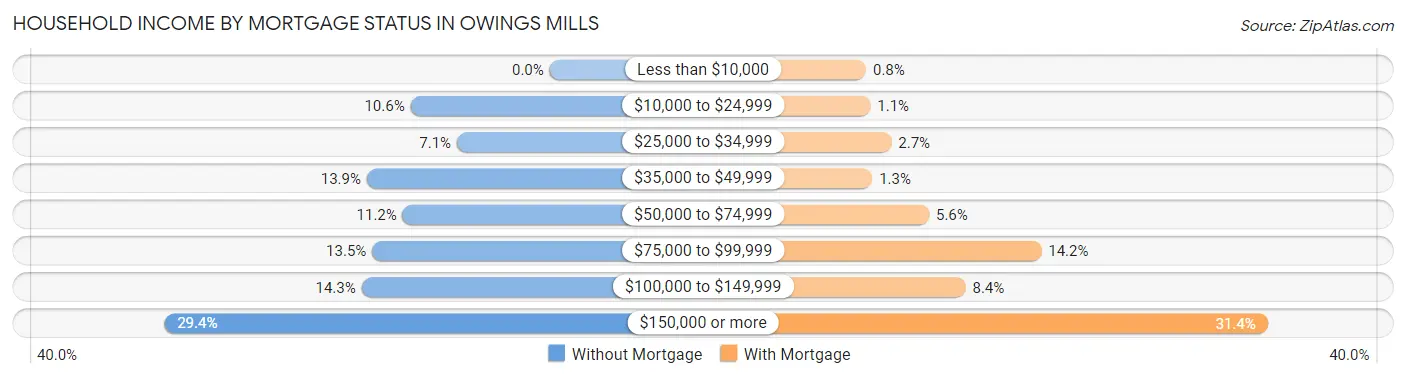
| Household Income | Without Mortgage | With Mortgage |
| Less than $10,000 | 0 (0.0%) | 46 (0.8%) |
| $10,000 to $24,999 | 105 (10.6%) | 65 (1.1%) |
| $25,000 to $34,999 | 70 (7.1%) | 157 (2.7%) |
| $35,000 to $49,999 | 138 (13.9%) | 73 (1.3%) |
| $50,000 to $74,999 | 111 (11.2%) | 322 (5.6%) |
| $75,000 to $99,999 | 134 (13.5%) | 814 (14.1%) |
| $100,000 to $149,999 | 142 (14.3%) | 482 (8.4%) |
| $150,000 or more | 291 (29.4%) | 1,806 (31.4%) |
| Total | 991 (100.0%) | 5,751 (100.0%) |
Property Value to Household Income Ratio in Owings Mills
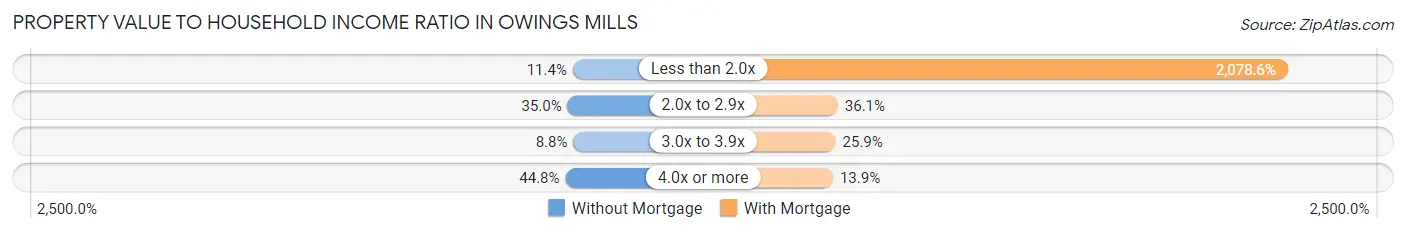
| Value-to-Income Ratio | Without Mortgage | With Mortgage |
| Less than 2.0x | 113 (11.4%) | 119,541 (2,078.6%) |
| 2.0x to 2.9x | 347 (35.0%) | 2,077 (36.1%) |
| 3.0x to 3.9x | 87 (8.8%) | 1,489 (25.9%) |
| 4.0x or more | 444 (44.8%) | 798 (13.9%) |
| Total | 991 (100.0%) | 5,751 (100.0%) |
Real Estate Taxes by Mortgage Status in Owings Mills
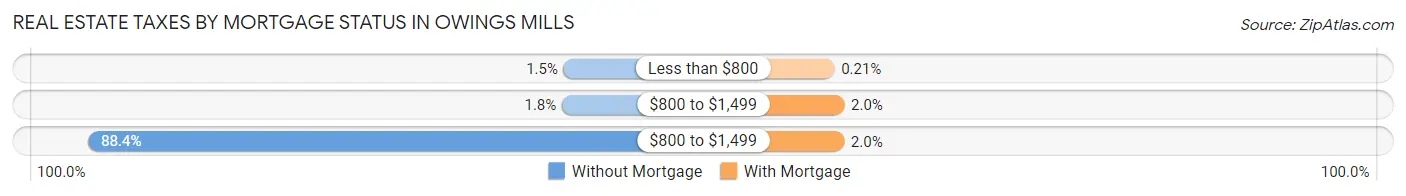
| Property Taxes | Without Mortgage | With Mortgage |
| Less than $800 | 15 (1.5%) | 12 (0.2%) |
| $800 to $1,499 | 18 (1.8%) | 116 (2.0%) |
| $800 to $1,499 | 876 (88.4%) | 114 (2.0%) |
| Total | 991 (100.0%) | 5,751 (100.0%) |
Health & Disability in Owings Mills
Health Insurance Coverage by Age in Owings Mills
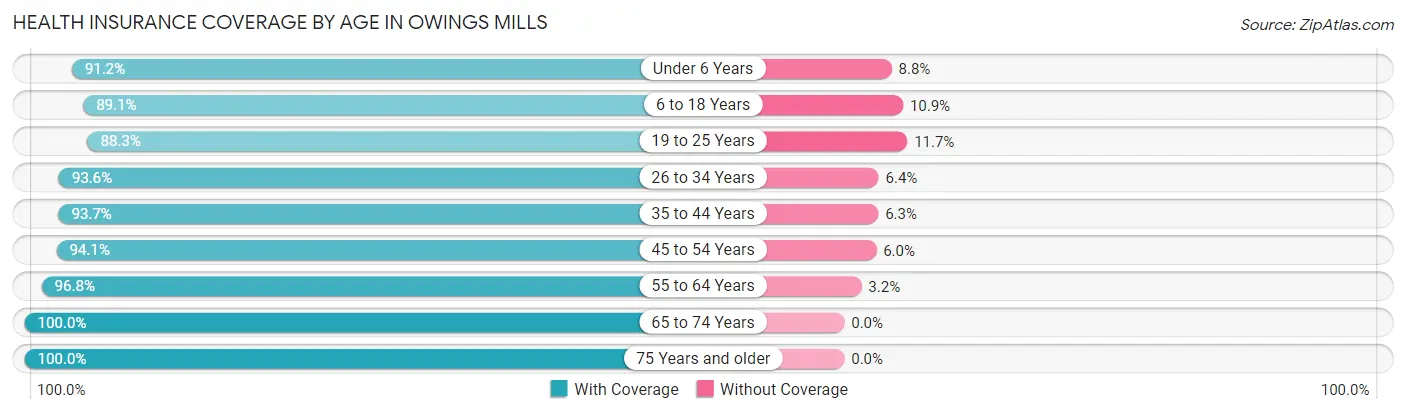
| Age Bracket | With Coverage | Without Coverage |
| Under 6 Years | 2,305 (91.2%) | 223 (8.8%) |
| 6 to 18 Years | 5,064 (89.1%) | 622 (10.9%) |
| 19 to 25 Years | 2,844 (88.3%) | 378 (11.7%) |
| 26 to 34 Years | 5,994 (93.6%) | 409 (6.4%) |
| 35 to 44 Years | 3,885 (93.7%) | 262 (6.3%) |
| 45 to 54 Years | 4,316 (94.1%) | 273 (5.9%) |
| 55 to 64 Years | 4,158 (96.8%) | 137 (3.2%) |
| 65 to 74 Years | 2,723 (100.0%) | 0 (0.0%) |
| 75 Years and older | 1,389 (100.0%) | 0 (0.0%) |
| Total | 32,678 (93.4%) | 2,304 (6.6%) |
Health Insurance Coverage by Citizenship Status in Owings Mills
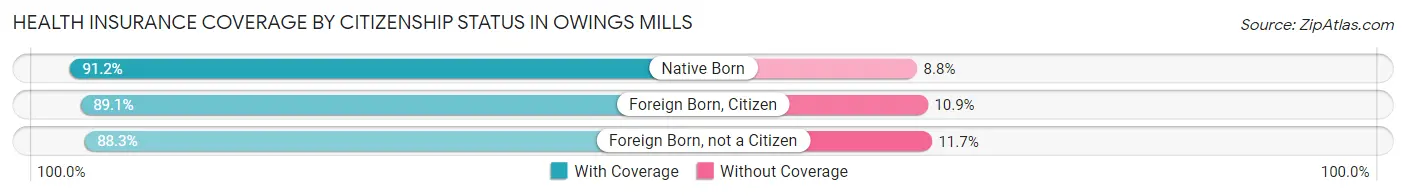
| Citizenship Status | With Coverage | Without Coverage |
| Native Born | 2,305 (91.2%) | 223 (8.8%) |
| Foreign Born, Citizen | 5,064 (89.1%) | 622 (10.9%) |
| Foreign Born, not a Citizen | 2,844 (88.3%) | 378 (11.7%) |
Health Insurance Coverage by Household Income in Owings Mills
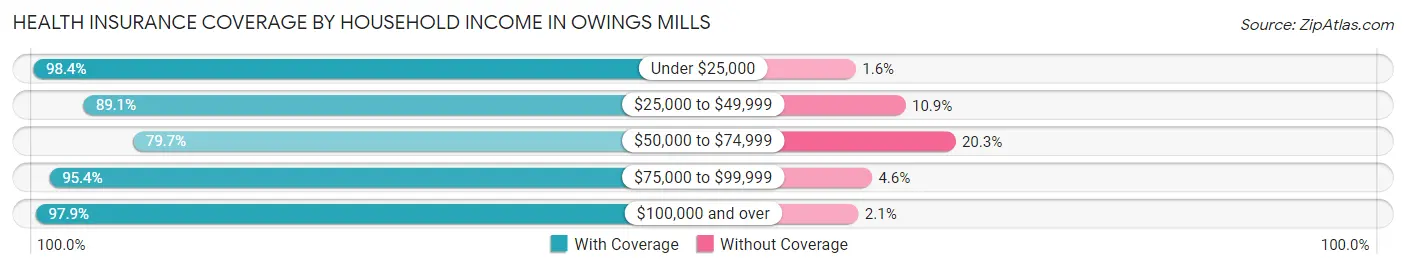
| Household Income | With Coverage | Without Coverage |
| Under $25,000 | 1,663 (98.4%) | 27 (1.6%) |
| $25,000 to $49,999 | 3,259 (89.1%) | 399 (10.9%) |
| $50,000 to $74,999 | 4,670 (79.7%) | 1,187 (20.3%) |
| $75,000 to $99,999 | 5,197 (95.4%) | 252 (4.6%) |
| $100,000 and over | 16,622 (97.9%) | 353 (2.1%) |
Public vs Private Health Insurance Coverage by Age in Owings Mills
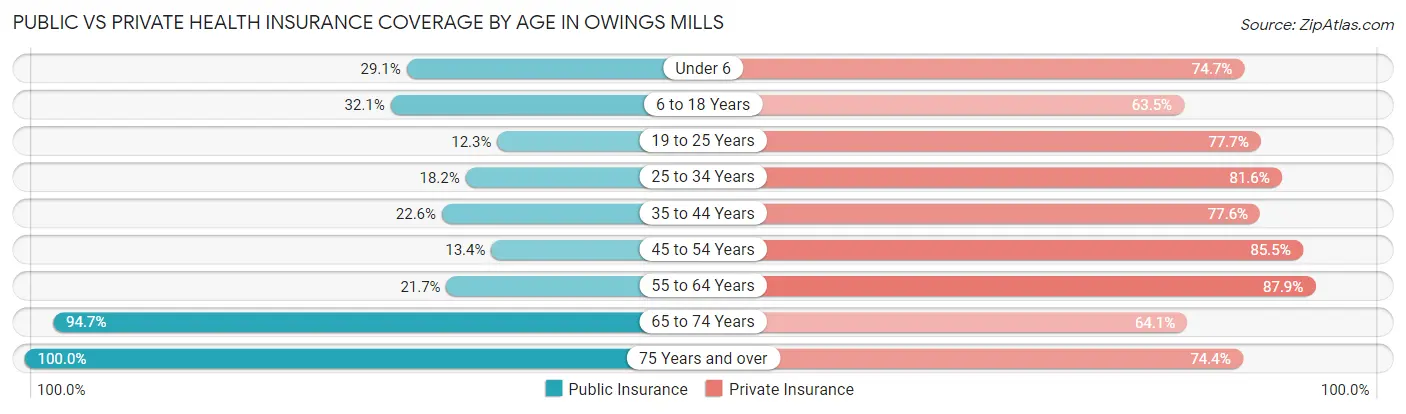
| Age Bracket | Public Insurance | Private Insurance |
| Under 6 | 736 (29.1%) | 1,888 (74.7%) |
| 6 to 18 Years | 1,823 (32.1%) | 3,610 (63.5%) |
| 19 to 25 Years | 395 (12.3%) | 2,504 (77.7%) |
| 25 to 34 Years | 1,162 (18.1%) | 5,226 (81.6%) |
| 35 to 44 Years | 935 (22.6%) | 3,218 (77.6%) |
| 45 to 54 Years | 614 (13.4%) | 3,924 (85.5%) |
| 55 to 64 Years | 932 (21.7%) | 3,773 (87.8%) |
| 65 to 74 Years | 2,579 (94.7%) | 1,745 (64.1%) |
| 75 Years and over | 1,389 (100.0%) | 1,033 (74.4%) |
| Total | 10,565 (30.2%) | 26,921 (77.0%) |
Disability Status by Sex by Age in Owings Mills
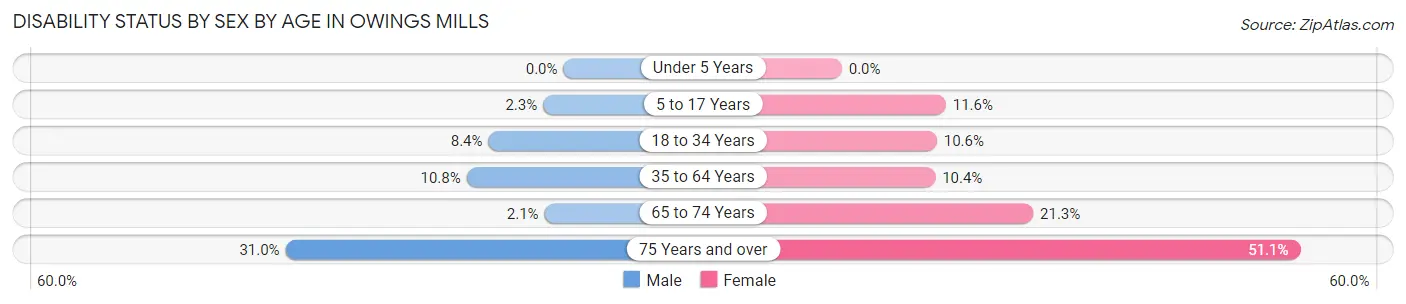
| Age Bracket | Male | Female |
| Under 5 Years | 0 (0.0%) | 0 (0.0%) |
| 5 to 17 Years | 66 (2.3%) | 305 (11.6%) |
| 18 to 34 Years | 369 (8.4%) | 628 (10.6%) |
| 35 to 64 Years | 623 (10.8%) | 754 (10.4%) |
| 65 to 74 Years | 17 (2.1%) | 409 (21.3%) |
| 75 Years and over | 108 (30.9%) | 531 (51.1%) |
Disability Class by Sex by Age in Owings Mills
Disability Class: Hearing Difficulty
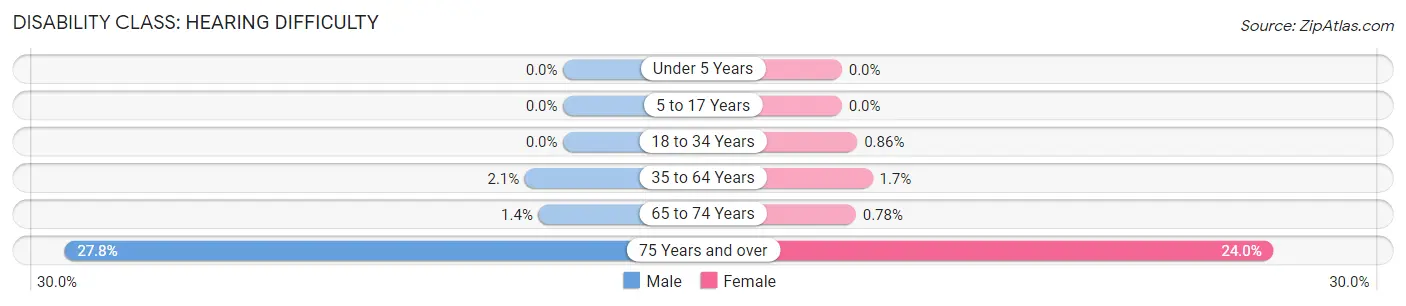
| Age Bracket | Male | Female |
| Under 5 Years | 0 (0.0%) | 0 (0.0%) |
| 5 to 17 Years | 0 (0.0%) | 0 (0.0%) |
| 18 to 34 Years | 0 (0.0%) | 51 (0.9%) |
| 35 to 64 Years | 123 (2.1%) | 124 (1.7%) |
| 65 to 74 Years | 11 (1.4%) | 15 (0.8%) |
| 75 Years and over | 97 (27.8%) | 250 (24.0%) |
Disability Class: Vision Difficulty
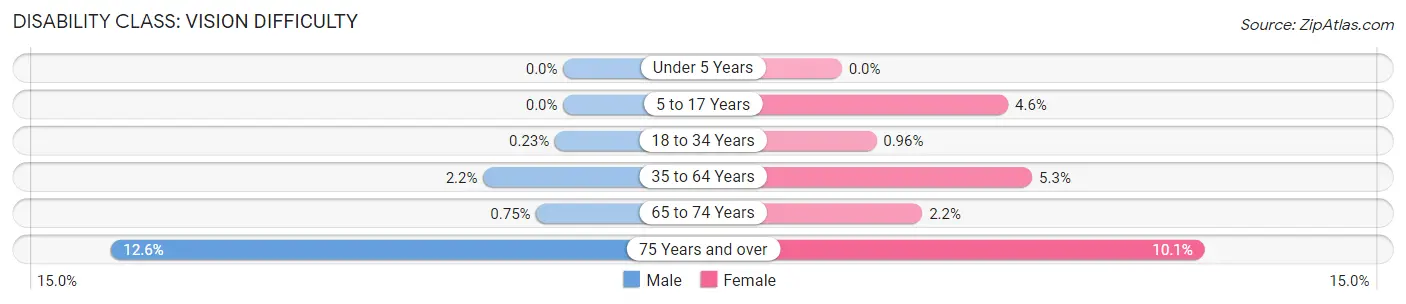
| Age Bracket | Male | Female |
| Under 5 Years | 0 (0.0%) | 0 (0.0%) |
| 5 to 17 Years | 0 (0.0%) | 122 (4.6%) |
| 18 to 34 Years | 10 (0.2%) | 57 (1.0%) |
| 35 to 64 Years | 129 (2.2%) | 384 (5.3%) |
| 65 to 74 Years | 6 (0.7%) | 43 (2.2%) |
| 75 Years and over | 44 (12.6%) | 105 (10.1%) |
Disability Class: Cognitive Difficulty
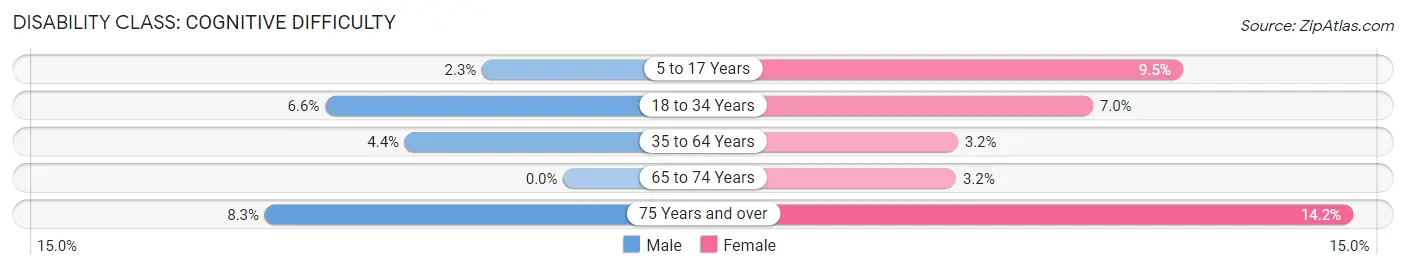
| Age Bracket | Male | Female |
| 5 to 17 Years | 66 (2.3%) | 250 (9.5%) |
| 18 to 34 Years | 293 (6.6%) | 415 (7.0%) |
| 35 to 64 Years | 255 (4.4%) | 234 (3.2%) |
| 65 to 74 Years | 0 (0.0%) | 61 (3.2%) |
| 75 Years and over | 29 (8.3%) | 148 (14.2%) |
Disability Class: Ambulatory Difficulty
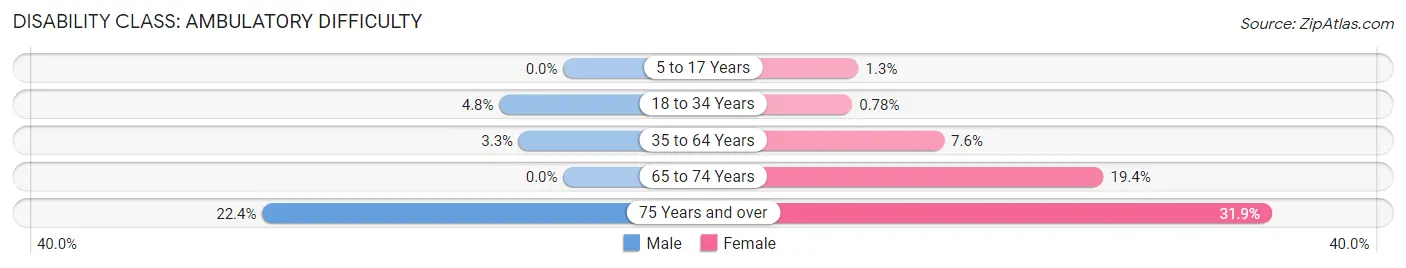
| Age Bracket | Male | Female |
| 5 to 17 Years | 0 (0.0%) | 33 (1.3%) |
| 18 to 34 Years | 210 (4.8%) | 46 (0.8%) |
| 35 to 64 Years | 191 (3.3%) | 551 (7.6%) |
| 65 to 74 Years | 0 (0.0%) | 373 (19.4%) |
| 75 Years and over | 78 (22.4%) | 332 (31.9%) |
Disability Class: Self-Care Difficulty
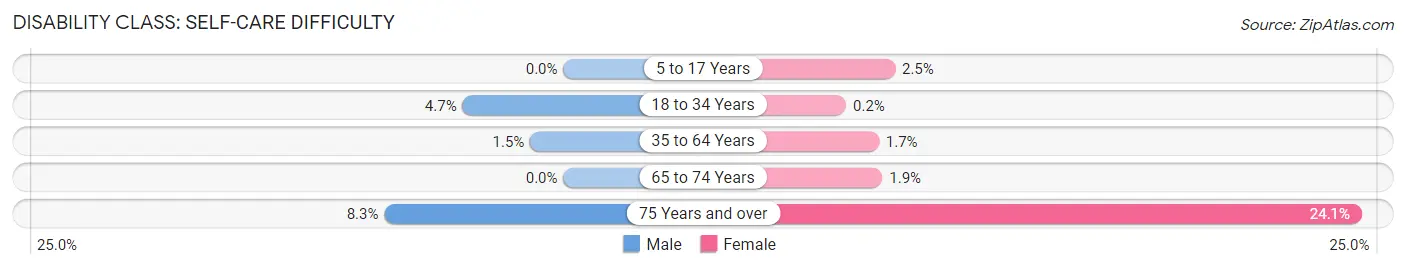
| Age Bracket | Male | Female |
| 5 to 17 Years | 0 (0.0%) | 65 (2.5%) |
| 18 to 34 Years | 207 (4.7%) | 12 (0.2%) |
| 35 to 64 Years | 89 (1.5%) | 125 (1.7%) |
| 65 to 74 Years | 0 (0.0%) | 36 (1.9%) |
| 75 Years and over | 29 (8.3%) | 251 (24.1%) |
Technology Access in Owings Mills
Computing Device Access in Owings Mills
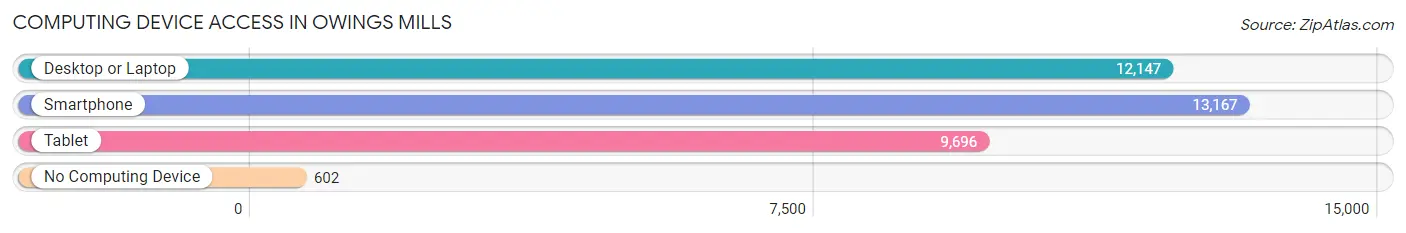
| Device Type | # Households | % Households |
| Desktop or Laptop | 12,147 | 86.0% |
| Smartphone | 13,167 | 93.2% |
| Tablet | 9,696 | 68.6% |
| No Computing Device | 602 | 4.3% |
| Total | 14,124 | 100.0% |
Internet Access in Owings Mills
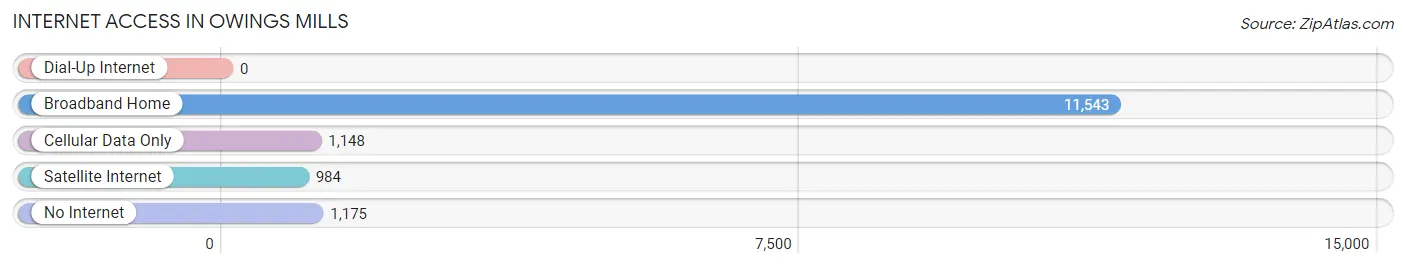
| Internet Type | # Households | % Households |
| Dial-Up Internet | 0 | 0.0% |
| Broadband Home | 11,543 | 81.7% |
| Cellular Data Only | 1,148 | 8.1% |
| Satellite Internet | 984 | 7.0% |
| No Internet | 1,175 | 8.3% |
| Total | 14,124 | 100.0% |
Owings Mills Summary
Owings Mills is a census-designated place and unincorporated community located in Baltimore County, Maryland, United States. It is located just northwest of the city of Baltimore and is part of the Baltimore metropolitan area. As of the 2010 census, the population of Owings Mills was 30,622.
History
The area now known as Owings Mills was originally inhabited by the Susquehannock Native Americans. The first European settlers arrived in the area in the late 1700s. The area was originally known as "Owings Mills Crossroads" and was named after the Owings family, who owned a large amount of land in the area. The area was primarily used for farming until the late 1800s, when the first mills were built. The first mill was built in 1812 by the Owings family and was used to grind grain. The area quickly grew in population and by the early 1900s, the area had become a bustling industrial center.
Geography
Owings Mills is located at 39°24'45"N 76°47'17"W (39.412500, -76.787917). It is situated in the Piedmont region of Maryland, just northwest of the city of Baltimore. The area is mostly flat, with some rolling hills. The area is drained by the Jones Falls and Gwynns Falls watersheds.
Economy
Owings Mills is home to a variety of businesses and industries. The area is home to several large corporate headquarters, including Under Armour, T. Rowe Price, and McCormick & Company. The area is also home to several shopping centers, including the Owings Mills Mall and the Foundry Row shopping center. The area is also home to several educational institutions, including Stevenson University and the Community College of Baltimore County.
Demographics
As of the 2010 census, the population of Owings Mills was 30,622. The racial makeup of the area was 57.2% White, 28.2% African American, 0.3% Native American, 8.2% Asian, and 4.7% from other races. The median household income was $68,945, and the median family income was $77,845. The per capita income was $30,945.
Conclusion
Owings Mills is a census-designated place and unincorporated community located in Baltimore County, Maryland. It is located just northwest of the city of Baltimore and is part of the Baltimore metropolitan area. The area was originally inhabited by the Susquehannock Native Americans and was later settled by European settlers in the late 1700s. The area is home to several large corporate headquarters, shopping centers, and educational institutions. As of the 2010 census, the population of Owings Mills was 30,622, with a median household income of $68,945.
Common Questions
What is Per Capita Income in Owings Mills?
Per Capita income in Owings Mills is $44,865.
What is the Median Family Income in Owings Mills?
Median Family Income in Owings Mills is $107,462.
What is the Median Household income in Owings Mills?
Median Household Income in Owings Mills is $92,322.
What is Income or Wage Gap in Owings Mills?
Income or Wage Gap in Owings Mills is 26.8%.
Women in Owings Mills earn 73.2 cents for every dollar earned by a man.
What is Inequality or Gini Index in Owings Mills?
Inequality or Gini Index in Owings Mills is 0.37.
What is the Total Population of Owings Mills?
Total Population of Owings Mills is 34,999.
What is the Total Male Population of Owings Mills?
Total Male Population of Owings Mills is 15,214.
What is the Total Female Population of Owings Mills?
Total Female Population of Owings Mills is 19,785.
What is the Ratio of Males per 100 Females in Owings Mills?
There are 76.90 Males per 100 Females in Owings Mills.
What is the Ratio of Females per 100 Males in Owings Mills?
There are 130.04 Females per 100 Males in Owings Mills.
What is the Median Population Age in Owings Mills?
Median Population Age in Owings Mills is 34.4 Years.
What is the Average Family Size in Owings Mills
Average Family Size in Owings Mills is 3.1 People.
What is the Average Household Size in Owings Mills
Average Household Size in Owings Mills is 2.4 People.
How Large is the Labor Force in Owings Mills?
There are 20,871 People in the Labor Forcein in Owings Mills.
What is the Percentage of People in the Labor Force in Owings Mills?
73.6% of People are in the Labor Force in Owings Mills.
What is the Unemployment Rate in Owings Mills?
Unemployment Rate in Owings Mills is 5.7%.