Milford Mill, MD Map & Demographics
Milford Mill Map
Milford Mill Overview
$33,836
PER CAPITA INCOME
$85,375
AVG FAMILY INCOME
$71,846
AVG HOUSEHOLD INCOME
3.5%
WAGE / INCOME GAP [ % ]
96.5¢/ $1
WAGE / INCOME GAP [ $ ]
0.39
INEQUALITY / GINI INDEX
31,513
TOTAL POPULATION
14,068
MALE POPULATION
17,445
FEMALE POPULATION
80.64
MALES / 100 FEMALES
124.00
FEMALES / 100 MALES
35.2
MEDIAN AGE
3.5
AVG FAMILY SIZE
2.7
AVG HOUSEHOLD SIZE
18,387
LABOR FORCE [ PEOPLE ]
75.1%
PERCENT IN LABOR FORCE
7.1%
UNEMPLOYMENT RATE
Income in Milford Mill
Income Overview in Milford Mill
Per Capita Income in Milford Mill is $33,836, while median incomes of families and households are $85,375 and $71,846 respectively.
| Characteristic | Number | Measure |
| Per Capita Income | 31,513 | $33,836 |
| Median Family Income | 7,165 | $85,375 |
| Mean Family Income | 7,165 | $99,086 |
| Median Household Income | 11,589 | $71,846 |
| Mean Household Income | 11,589 | $87,538 |
| Income Deficit | 7,165 | $0 |
| Wage / Income Gap (%) | 31,513 | 3.53% |
| Wage / Income Gap ($) | 31,513 | 96.47¢ per $1 |
| Gini / Inequality Index | 31,513 | 0.39 |
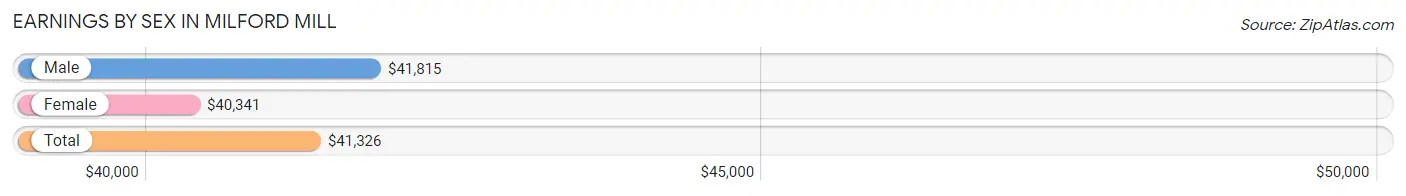
Earnings by Sex in Milford Mill
Average Earnings in Milford Mill are $41,326, $41,815 for men and $40,341 for women, a difference of 3.5%.
| Sex | Number | Average Earnings |
| Male | 8,006 (43.7%) | $41,815 |
| Female | 10,317 (56.3%) | $40,341 |
| Total | 18,323 (100.0%) | $41,326 |
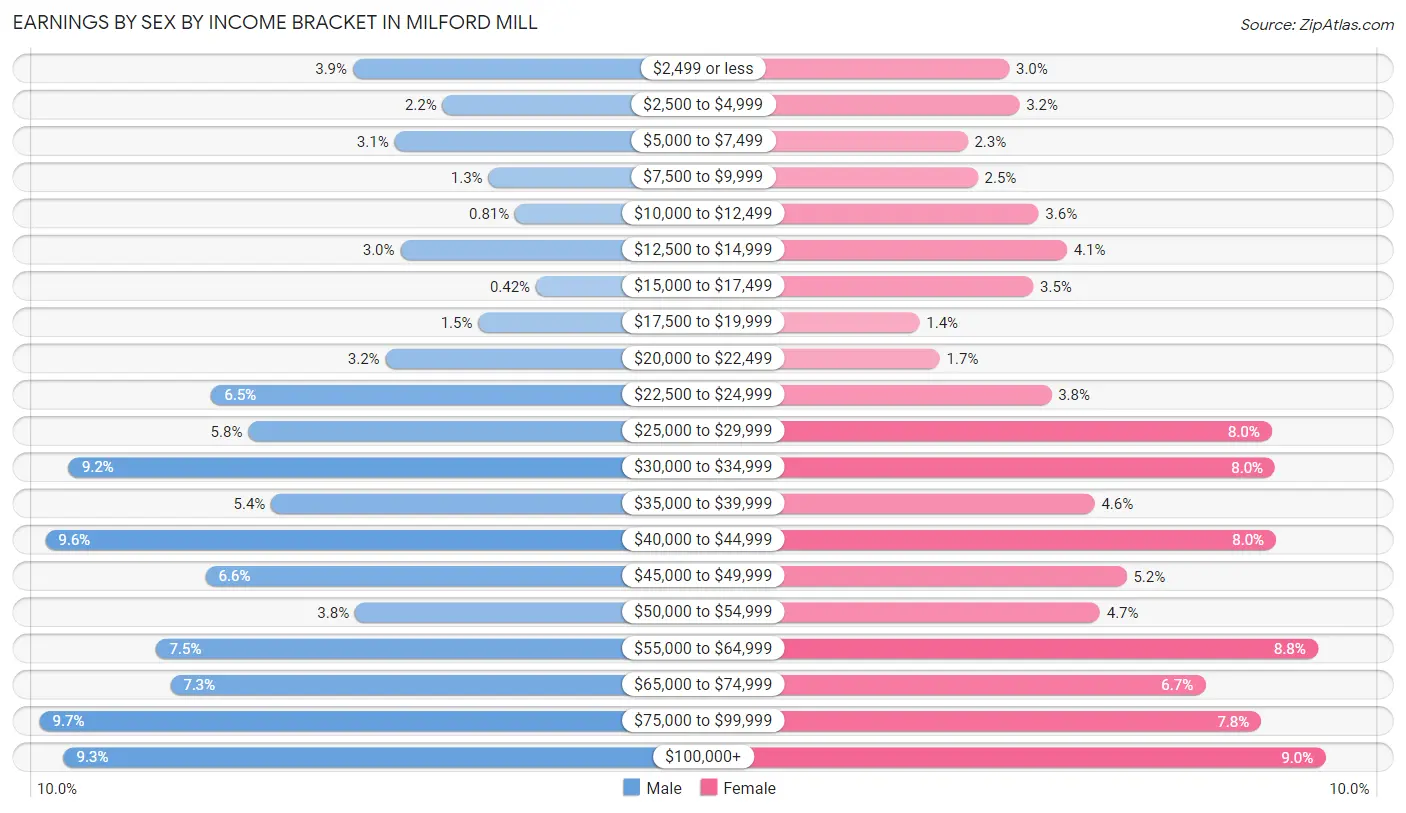
Earnings by Sex by Income Bracket in Milford Mill
The most common earnings brackets in Milford Mill are $75,000 to $99,999 for men (778 | 9.7%) and $100,000+ for women (924 | 9.0%).
| Income | Male | Female |
| $2,499 or less | 308 (3.8%) | 314 (3.0%) |
| $2,500 to $4,999 | 174 (2.2%) | 333 (3.2%) |
| $5,000 to $7,499 | 246 (3.1%) | 233 (2.3%) |
| $7,500 to $9,999 | 105 (1.3%) | 253 (2.5%) |
| $10,000 to $12,499 | 65 (0.8%) | 370 (3.6%) |
| $12,500 to $14,999 | 237 (3.0%) | 425 (4.1%) |
| $15,000 to $17,499 | 34 (0.4%) | 360 (3.5%) |
| $17,500 to $19,999 | 120 (1.5%) | 140 (1.4%) |
| $20,000 to $22,499 | 259 (3.2%) | 180 (1.7%) |
| $22,500 to $24,999 | 520 (6.5%) | 395 (3.8%) |
| $25,000 to $29,999 | 465 (5.8%) | 821 (8.0%) |
| $30,000 to $34,999 | 734 (9.2%) | 827 (8.0%) |
| $35,000 to $39,999 | 431 (5.4%) | 479 (4.6%) |
| $40,000 to $44,999 | 769 (9.6%) | 830 (8.0%) |
| $45,000 to $49,999 | 529 (6.6%) | 541 (5.2%) |
| $50,000 to $54,999 | 305 (3.8%) | 489 (4.7%) |
| $55,000 to $64,999 | 603 (7.5%) | 910 (8.8%) |
| $65,000 to $74,999 | 582 (7.3%) | 692 (6.7%) |
| $75,000 to $99,999 | 778 (9.7%) | 801 (7.8%) |
| $100,000+ | 742 (9.3%) | 924 (9.0%) |
| Total | 8,006 (100.0%) | 10,317 (100.0%) |
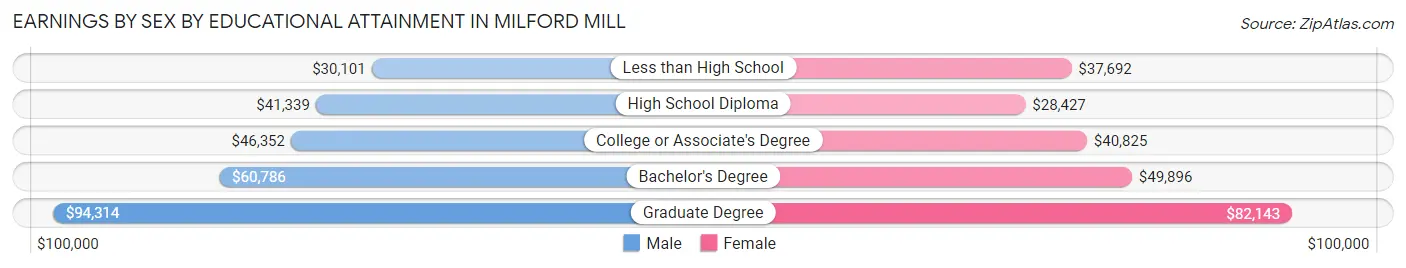
Earnings by Sex by Educational Attainment in Milford Mill
Average earnings in Milford Mill are $45,182 for men and $44,173 for women, a difference of 2.2%. Men with an educational attainment of graduate degree enjoy the highest average annual earnings of $94,314, while those with less than high school education earn the least with $30,101. Women with an educational attainment of graduate degree earn the most with the average annual earnings of $82,143, while those with high school diploma education have the smallest earnings of $28,427.
| Educational Attainment | Male Income | Female Income |
| Less than High School | $30,101 | $37,692 |
| High School Diploma | $41,339 | $28,427 |
| College or Associate's Degree | $46,352 | $40,825 |
| Bachelor's Degree | $60,786 | $49,896 |
| Graduate Degree | $94,314 | $82,143 |
| Total | $45,182 | $44,173 |
Family Income in Milford Mill
Family Income Brackets in Milford Mill
According to the Milford Mill family income data, there are 1,655 families falling into the $100,000 to $149,999 income range, which is the most common income bracket and makes up 23.1% of all families. Conversely, the less than $10,000 income bracket is the least frequent group with only 115 families (1.6%) belonging to this category.
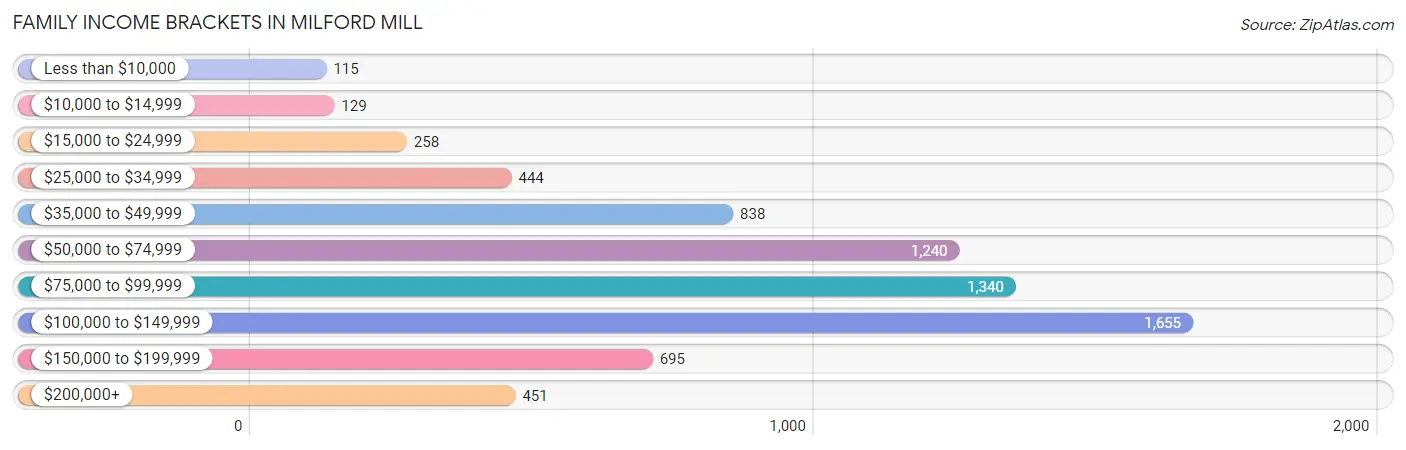
| Income Bracket | # Families | % Families |
| Less than $10,000 | 115 | 1.6% |
| $10,000 to $14,999 | 129 | 1.8% |
| $15,000 to $24,999 | 258 | 3.6% |
| $25,000 to $34,999 | 444 | 6.2% |
| $35,000 to $49,999 | 838 | 11.7% |
| $50,000 to $74,999 | 1,240 | 17.3% |
| $75,000 to $99,999 | 1,340 | 18.7% |
| $100,000 to $149,999 | 1,655 | 23.1% |
| $150,000 to $199,999 | 695 | 9.7% |
| $200,000+ | 451 | 6.3% |
Family Income by Famaliy Size in Milford Mill
6-person families (257 | 3.6%) account for the highest median family income in Milford Mill with $149,447 per family, while 2-person families (2,912 | 40.6%) have the highest median income of $35,746 per family member.
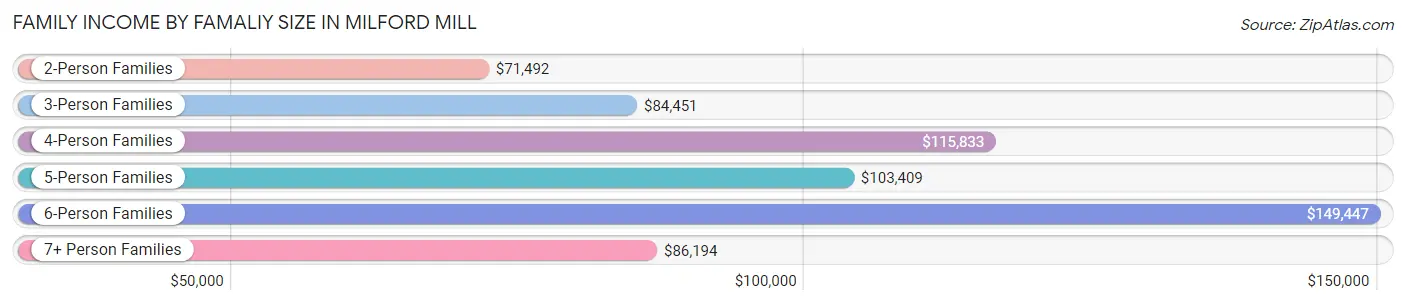
| Income Bracket | # Families | Median Income |
| 2-Person Families | 2,912 (40.6%) | $71,492 |
| 3-Person Families | 1,850 (25.8%) | $84,451 |
| 4-Person Families | 1,162 (16.2%) | $115,833 |
| 5-Person Families | 708 (9.9%) | $103,409 |
| 6-Person Families | 257 (3.6%) | $149,447 |
| 7+ Person Families | 276 (3.8%) | $86,194 |
| Total | 7,165 (100.0%) | $85,375 |
Family Income by Number of Earners in Milford Mill
The median family income in Milford Mill is $85,375, with families comprising 3+ earners (1,532) having the highest median family income of $141,423, while families with no earners (512) have the lowest median family income of $54,505, accounting for 21.4% and 7.1% of families, respectively.
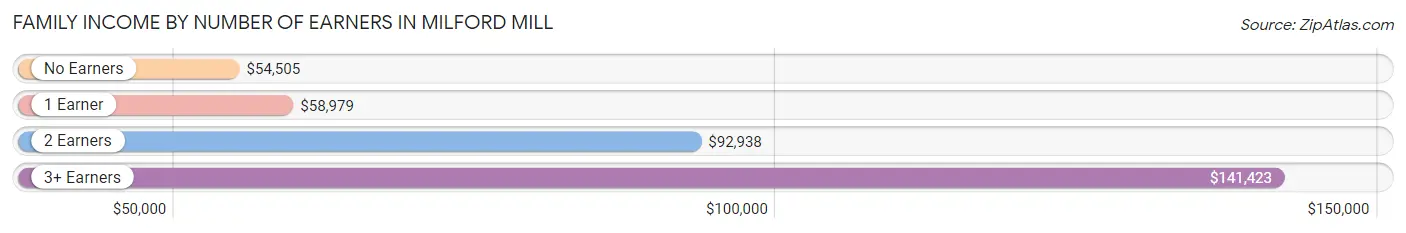
| Number of Earners | # Families | Median Income |
| No Earners | 512 (7.1%) | $54,505 |
| 1 Earner | 2,636 (36.8%) | $58,979 |
| 2 Earners | 2,485 (34.7%) | $92,938 |
| 3+ Earners | 1,532 (21.4%) | $141,423 |
| Total | 7,165 (100.0%) | $85,375 |
Household Income in Milford Mill
Household Income Brackets in Milford Mill
With 2,445 households falling in the category, the $100,000 to $149,999 income range is the most frequent in Milford Mill, accounting for 21.1% of all households. In contrast, only 429 households (3.7%) fall into the less than $10,000 income bracket, making it the least populous group.
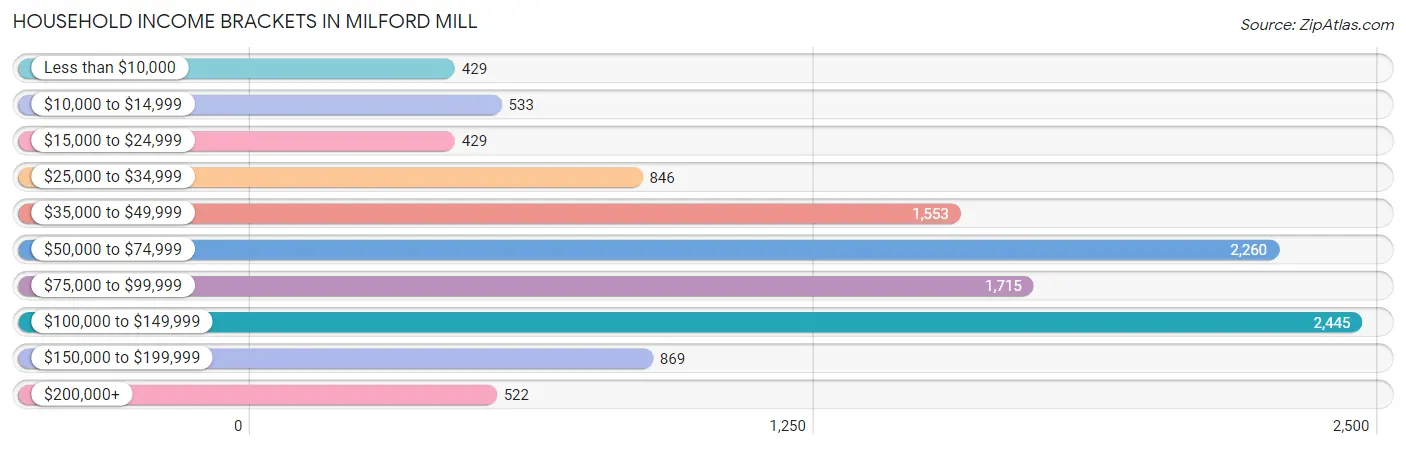
| Income Bracket | # Households | % Households |
| Less than $10,000 | 429 | 3.7% |
| $10,000 to $14,999 | 533 | 4.6% |
| $15,000 to $24,999 | 429 | 3.7% |
| $25,000 to $34,999 | 846 | 7.3% |
| $35,000 to $49,999 | 1,553 | 13.4% |
| $50,000 to $74,999 | 2,260 | 19.5% |
| $75,000 to $99,999 | 1,715 | 14.8% |
| $100,000 to $149,999 | 2,445 | 21.1% |
| $150,000 to $199,999 | 869 | 7.5% |
| $200,000+ | 522 | 4.5% |
Household Income by Householder Age in Milford Mill
The median household income in Milford Mill is $71,846, with the highest median household income of $86,208 found in the 45 to 64 years age bracket for the primary householder. A total of 4,776 households (41.2%) fall into this category. Meanwhile, the 65+ years age bracket for the primary householder has the lowest median household income of $51,754, with 2,564 households (22.1%) in this group.
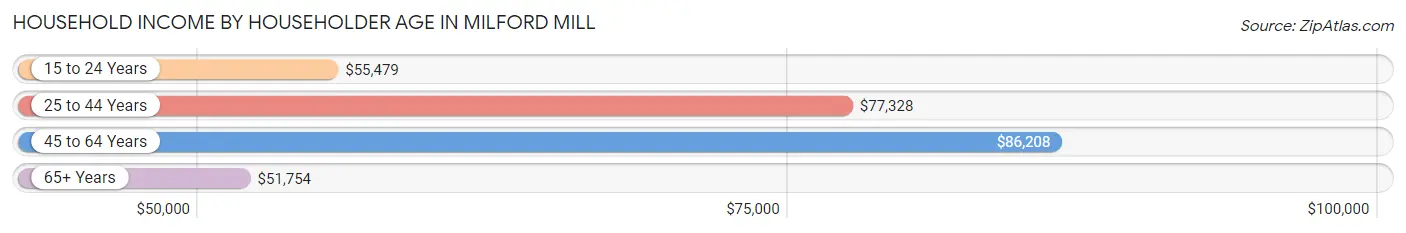
| Income Bracket | # Households | Median Income |
| 15 to 24 Years | 373 (3.2%) | $55,479 |
| 25 to 44 Years | 3,876 (33.5%) | $77,328 |
| 45 to 64 Years | 4,776 (41.2%) | $86,208 |
| 65+ Years | 2,564 (22.1%) | $51,754 |
| Total | 11,589 (100.0%) | $71,846 |
Poverty in Milford Mill
Income Below Poverty by Sex and Age in Milford Mill
With 8.5% poverty level for males and 9.8% for females among the residents of Milford Mill, 5 year old males and 16 and 17 year old females are the most vulnerable to poverty, with 73 males (33.8%) and 66 females (16.4%) in their respective age groups living below the poverty level.
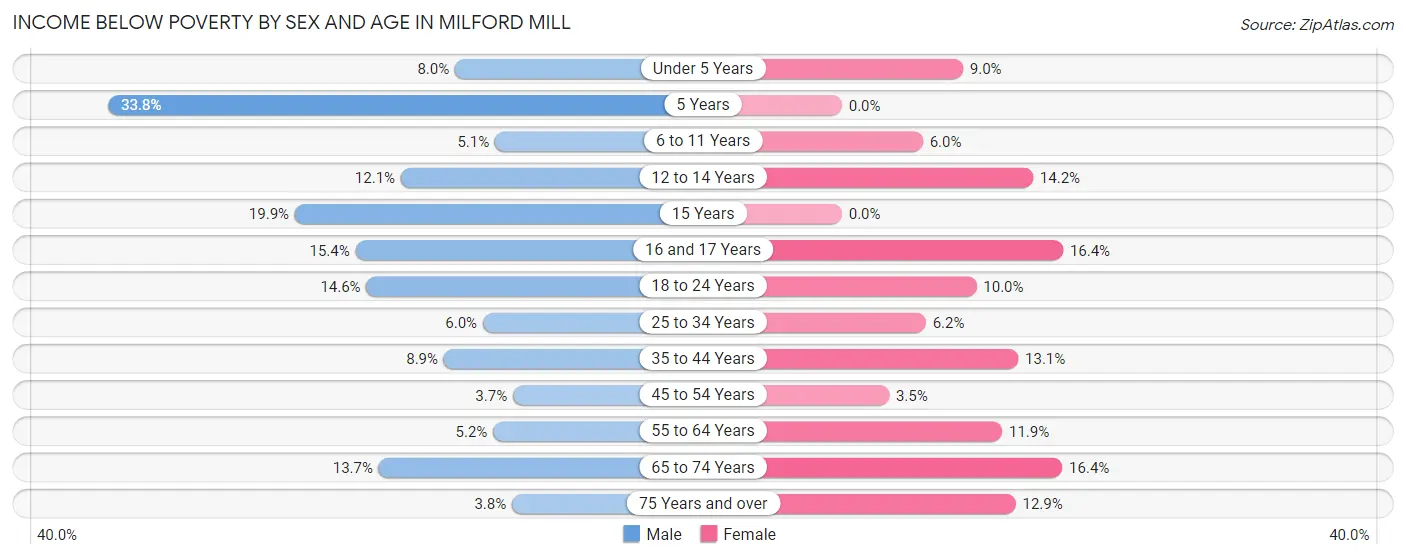
| Age Bracket | Male | Female |
| Under 5 Years | 91 (8.0%) | 85 (9.0%) |
| 5 Years | 73 (33.8%) | 0 (0.0%) |
| 6 to 11 Years | 62 (5.1%) | 62 (6.0%) |
| 12 to 14 Years | 72 (12.1%) | 142 (14.2%) |
| 15 Years | 55 (19.9%) | 0 (0.0%) |
| 16 and 17 Years | 79 (15.4%) | 66 (16.4%) |
| 18 to 24 Years | 181 (14.6%) | 172 (10.0%) |
| 25 to 34 Years | 138 (6.0%) | 151 (6.2%) |
| 35 to 44 Years | 135 (8.9%) | 317 (13.1%) |
| 45 to 54 Years | 64 (3.7%) | 84 (3.5%) |
| 55 to 64 Years | 97 (5.2%) | 249 (11.9%) |
| 65 to 74 Years | 111 (13.7%) | 247 (16.4%) |
| 75 Years and over | 18 (3.8%) | 121 (12.9%) |
| Total | 1,176 (8.5%) | 1,696 (9.8%) |
Income Above Poverty by Sex and Age in Milford Mill
According to the poverty statistics in Milford Mill, males aged 45 to 54 years and females aged 5 years are the age groups that are most secure financially, with 96.3% of males and 100.0% of females in these age groups living above the poverty line.
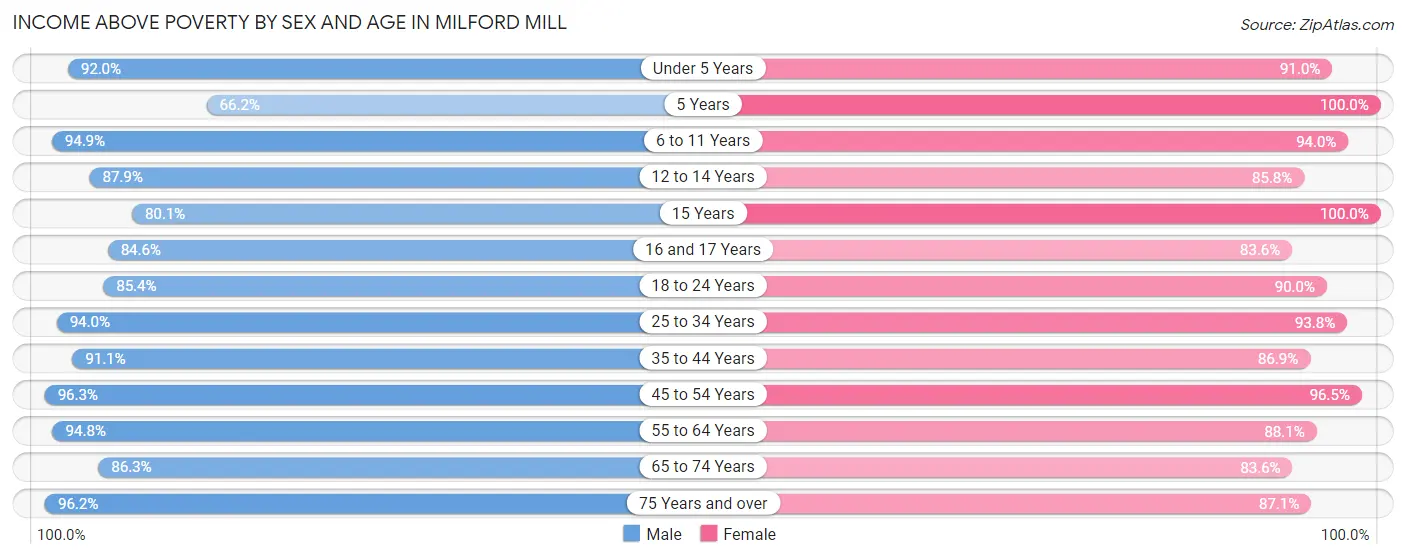
| Age Bracket | Male | Female |
| Under 5 Years | 1,041 (92.0%) | 860 (91.0%) |
| 5 Years | 143 (66.2%) | 116 (100.0%) |
| 6 to 11 Years | 1,160 (94.9%) | 969 (94.0%) |
| 12 to 14 Years | 525 (87.9%) | 859 (85.8%) |
| 15 Years | 221 (80.1%) | 231 (100.0%) |
| 16 and 17 Years | 433 (84.6%) | 336 (83.6%) |
| 18 to 24 Years | 1,057 (85.4%) | 1,549 (90.0%) |
| 25 to 34 Years | 2,174 (94.0%) | 2,271 (93.8%) |
| 35 to 44 Years | 1,387 (91.1%) | 2,104 (86.9%) |
| 45 to 54 Years | 1,648 (96.3%) | 2,317 (96.5%) |
| 55 to 64 Years | 1,764 (94.8%) | 1,844 (88.1%) |
| 65 to 74 Years | 699 (86.3%) | 1,263 (83.6%) |
| 75 Years and over | 454 (96.2%) | 817 (87.1%) |
| Total | 12,706 (91.5%) | 15,536 (90.2%) |
Income Below Poverty Among Married-Couple Families in Milford Mill
The poverty statistics for married-couple families in Milford Mill show that 5.7% or 193 of the total 3,377 families live below the poverty line. Families with 1 or 2 children have the highest poverty rate of 10.8%, comprising of 137 families. On the other hand, families with 3 or 4 children have the lowest poverty rate of 0.0%, which includes 0 families.
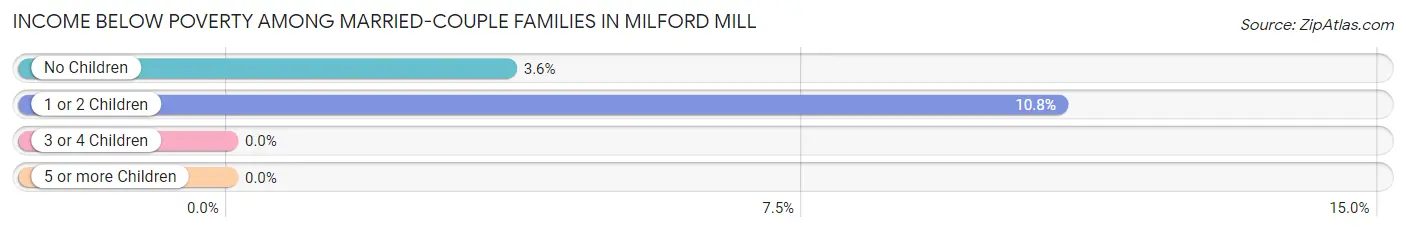
| Children | Above Poverty | Below Poverty |
| No Children | 1,482 (96.4%) | 56 (3.6%) |
| 1 or 2 Children | 1,128 (89.2%) | 137 (10.8%) |
| 3 or 4 Children | 540 (100.0%) | 0 (0.0%) |
| 5 or more Children | 34 (100.0%) | 0 (0.0%) |
| Total | 3,184 (94.3%) | 193 (5.7%) |
Income Below Poverty Among Single-Parent Households in Milford Mill
According to the poverty data in Milford Mill, 5.8% or 56 single-father households and 9.7% or 275 single-mother households are living below the poverty line. Among single-father households, those with 1 or 2 children have the highest poverty rate, with 56 households (11.9%) experiencing poverty. Likewise, among single-mother households, those with 3 or 4 children have the highest poverty rate, with 33 households (20.7%) falling below the poverty line.
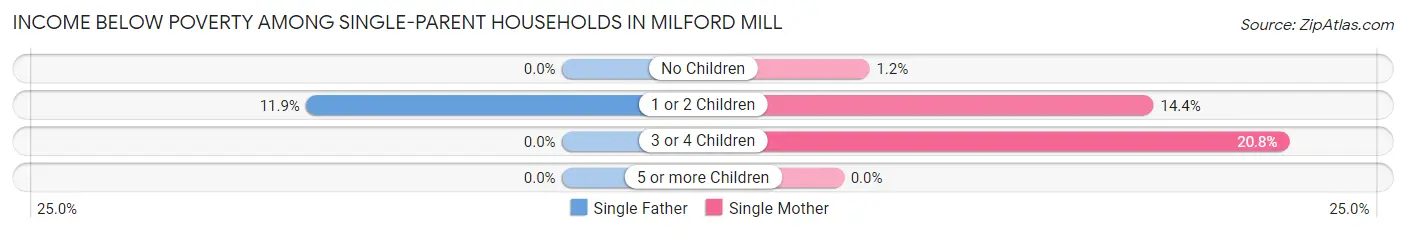
| Children | Single Father | Single Mother |
| No Children | 0 (0.0%) | 13 (1.2%) |
| 1 or 2 Children | 56 (11.9%) | 229 (14.4%) |
| 3 or 4 Children | 0 (0.0%) | 33 (20.7%) |
| 5 or more Children | 0 (0.0%) | 0 (0.0%) |
| Total | 56 (5.8%) | 275 (9.7%) |
Income Below Poverty Among Married-Couple vs Single-Parent Households in Milford Mill
The poverty data for Milford Mill shows that 193 of the married-couple family households (5.7%) and 331 of the single-parent households (8.7%) are living below the poverty level. Within the married-couple family households, those with 1 or 2 children have the highest poverty rate, with 137 households (10.8%) falling below the poverty line. Among the single-parent households, those with 3 or 4 children have the highest poverty rate, with 33 household (20.7%) living below poverty.
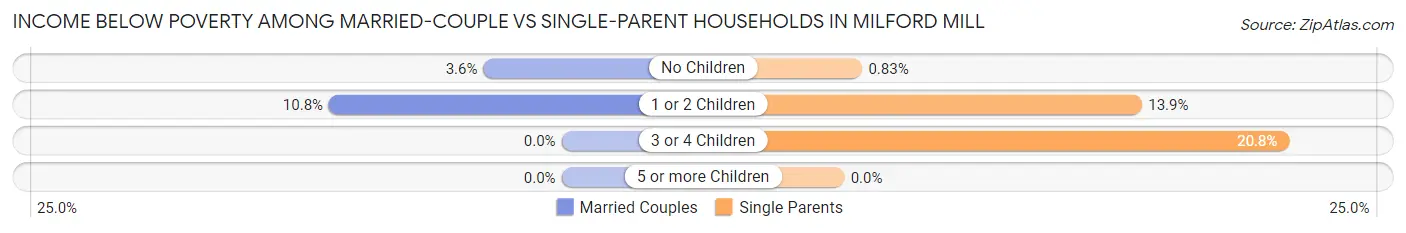
| Children | Married-Couple Families | Single-Parent Households |
| No Children | 56 (3.6%) | 13 (0.8%) |
| 1 or 2 Children | 137 (10.8%) | 285 (13.9%) |
| 3 or 4 Children | 0 (0.0%) | 33 (20.7%) |
| 5 or more Children | 0 (0.0%) | 0 (0.0%) |
| Total | 193 (5.7%) | 331 (8.7%) |
Race in Milford Mill
The most populous races in Milford Mill are Black / African American (25,609 | 81.3%), White / Caucasian (2,774 | 8.8%), and Hispanic or Latino (1,919 | 6.1%).
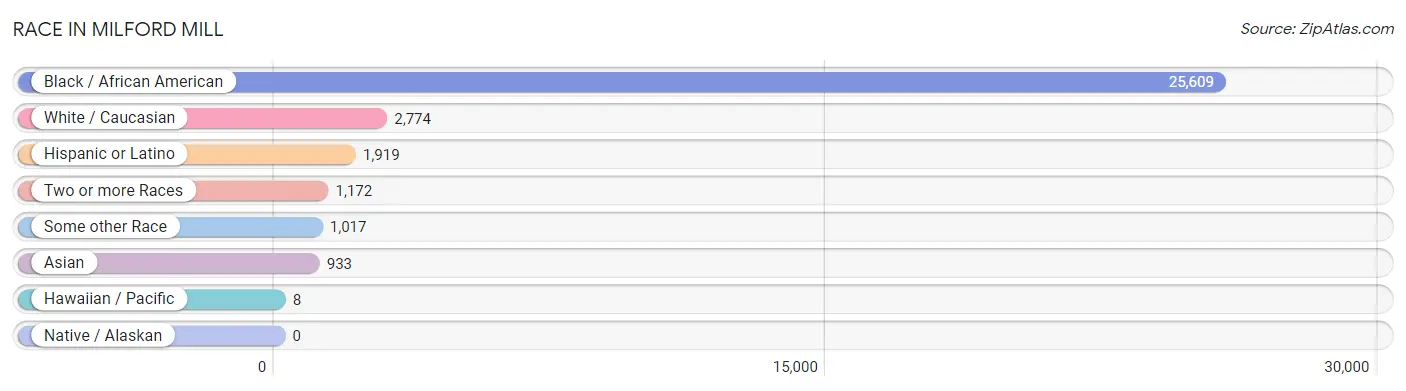
| Race | # Population | % Population |
| Asian | 933 | 3.0% |
| Black / African American | 25,609 | 81.3% |
| Hawaiian / Pacific | 8 | 0.0% |
| Hispanic or Latino | 1,919 | 6.1% |
| Native / Alaskan | 0 | 0.0% |
| White / Caucasian | 2,774 | 8.8% |
| Two or more Races | 1,172 | 3.7% |
| Some other Race | 1,017 | 3.2% |
| Total | 31,513 | 100.0% |
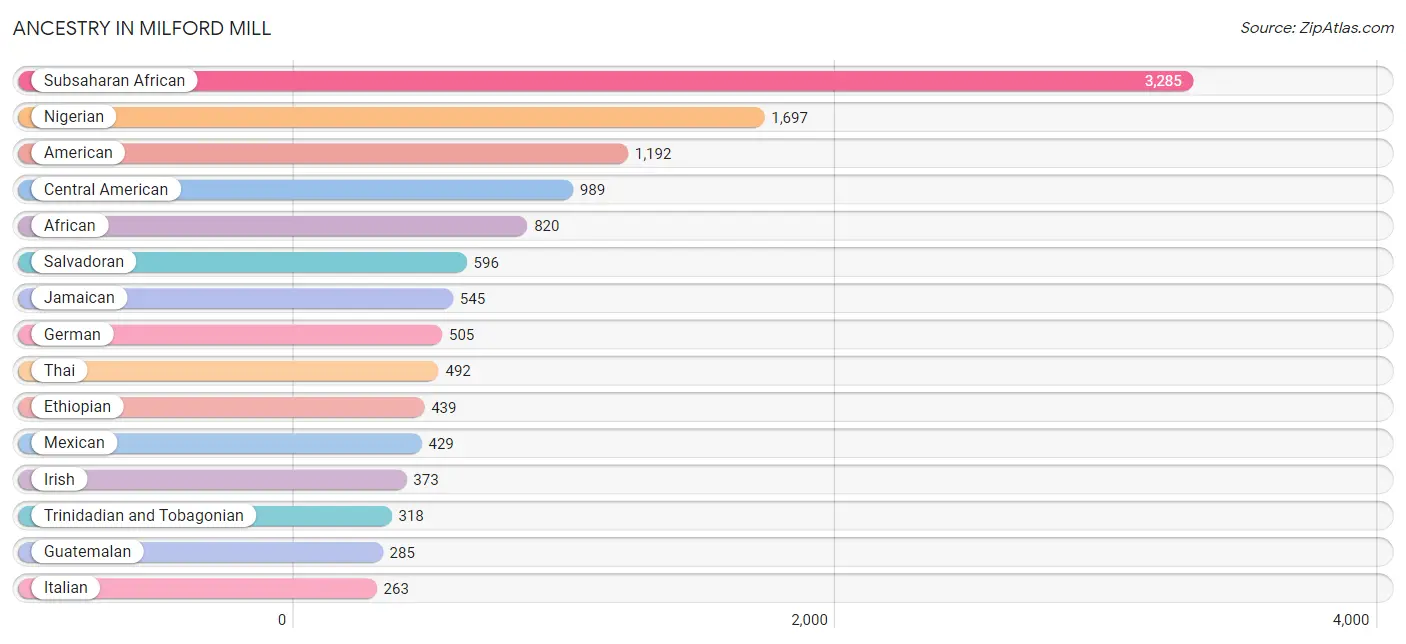
Ancestry in Milford Mill
The most populous ancestries reported in Milford Mill are Subsaharan African (3,285 | 10.4%), Nigerian (1,697 | 5.4%), American (1,192 | 3.8%), Central American (989 | 3.1%), and African (820 | 2.6%), together accounting for 25.3% of all Milford Mill residents.
| Ancestry | # Population | % Population |
| African | 820 | 2.6% |
| American | 1,192 | 3.8% |
| Arab | 105 | 0.3% |
| Austrian | 2 | 0.0% |
| Barbadian | 53 | 0.2% |
| Bhutanese | 119 | 0.4% |
| Brazilian | 8 | 0.0% |
| British | 54 | 0.2% |
| British West Indian | 111 | 0.4% |
| Burmese | 64 | 0.2% |
| Canadian | 17 | 0.1% |
| Central American | 989 | 3.1% |
| Cherokee | 48 | 0.2% |
| Colombian | 70 | 0.2% |
| Costa Rican | 11 | 0.0% |
| Cuban | 38 | 0.1% |
| Czech | 24 | 0.1% |
| Dominican | 8 | 0.0% |
| Eastern European | 42 | 0.1% |
| English | 258 | 0.8% |
| Ethiopian | 439 | 1.4% |
| European | 141 | 0.4% |
| French | 28 | 0.1% |
| German | 505 | 1.6% |
| Ghanaian | 180 | 0.6% |
| Guatemalan | 285 | 0.9% |
| Guyanese | 5 | 0.0% |
| Haitian | 93 | 0.3% |
| Hungarian | 9 | 0.0% |
| Indian (Asian) | 29 | 0.1% |
| Indonesian | 53 | 0.2% |
| Iranian | 49 | 0.2% |
| Irish | 373 | 1.2% |
| Italian | 263 | 0.8% |
| Jamaican | 545 | 1.7% |
| Japanese | 24 | 0.1% |
| Korean | 245 | 0.8% |
| Lithuanian | 19 | 0.1% |
| Lumbee | 48 | 0.2% |
| Mexican | 429 | 1.4% |
| Moroccan | 23 | 0.1% |
| New Zealander | 5 | 0.0% |
| Nicaraguan | 97 | 0.3% |
| Nigerian | 1,697 | 5.4% |
| Palestinian | 42 | 0.1% |
| Peruvian | 13 | 0.0% |
| Polish | 121 | 0.4% |
| Puerto Rican | 202 | 0.6% |
| Russian | 125 | 0.4% |
| Salvadoran | 596 | 1.9% |
| Samoan | 8 | 0.0% |
| Scandinavian | 24 | 0.1% |
| Scotch-Irish | 28 | 0.1% |
| Scottish | 9 | 0.0% |
| Slovak | 13 | 0.0% |
| South American | 83 | 0.3% |
| Spanish | 103 | 0.3% |
| Sri Lankan | 41 | 0.1% |
| Subsaharan African | 3,285 | 10.4% |
| Thai | 492 | 1.6% |
| Trinidadian and Tobagonian | 318 | 1.0% |
| Vietnamese | 36 | 0.1% |
| Welsh | 12 | 0.0% |
| West Indian | 96 | 0.3% | View All 64 Rows |
Immigrants in Milford Mill
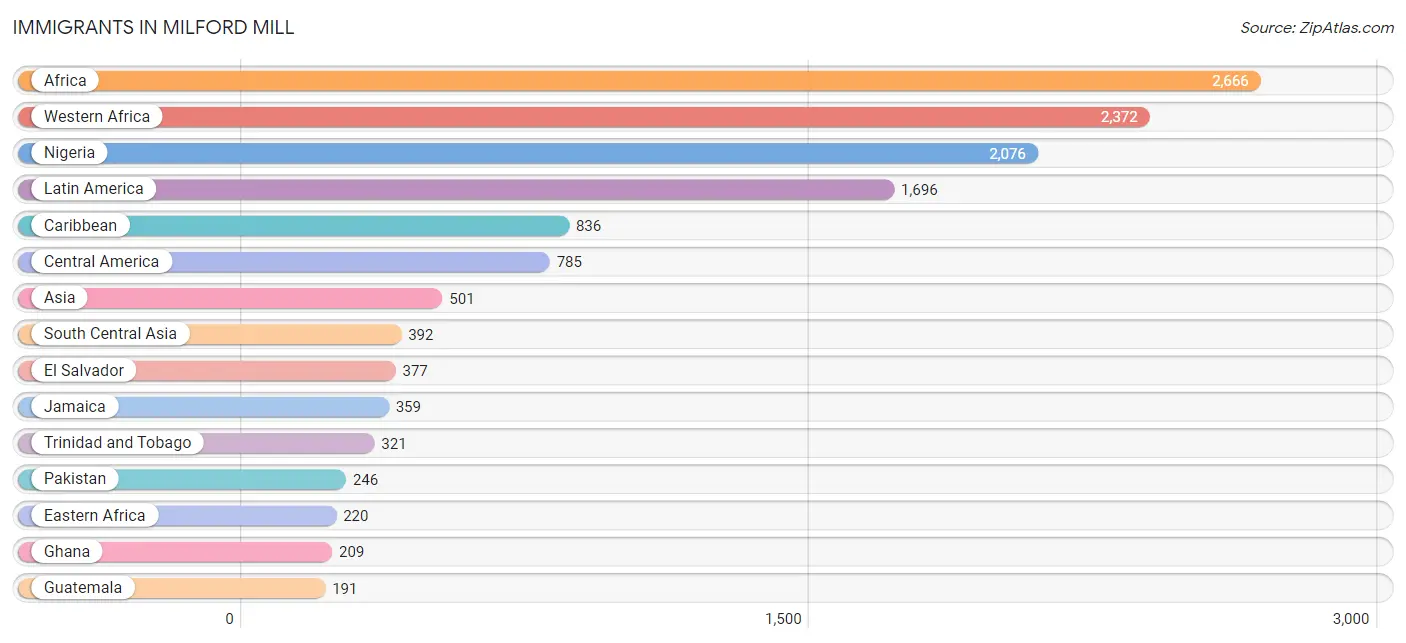
The most numerous immigrant groups reported in Milford Mill came from Africa (2,666 | 8.5%), Western Africa (2,372 | 7.5%), Nigeria (2,076 | 6.6%), Latin America (1,696 | 5.4%), and Caribbean (836 | 2.6%), together accounting for 30.6% of all Milford Mill residents.
| Immigration Origin | # Population | % Population |
| Africa | 2,666 | 8.5% |
| Asia | 501 | 1.6% |
| Bangladesh | 17 | 0.1% |
| Barbados | 24 | 0.1% |
| Brazil | 8 | 0.0% |
| Cameroon | 16 | 0.1% |
| Canada | 59 | 0.2% |
| Caribbean | 836 | 2.6% |
| Central America | 785 | 2.5% |
| Colombia | 35 | 0.1% |
| Costa Rica | 11 | 0.0% |
| Dominican Republic | 8 | 0.0% |
| Eastern Africa | 220 | 0.7% |
| Eastern Asia | 64 | 0.2% |
| Egypt | 13 | 0.0% |
| El Salvador | 377 | 1.2% |
| Eritrea | 74 | 0.2% |
| Ethiopia | 146 | 0.5% |
| Europe | 143 | 0.4% |
| Ghana | 209 | 0.7% |
| Grenada | 54 | 0.2% |
| Guatemala | 191 | 0.6% |
| Guyana | 19 | 0.1% |
| India | 96 | 0.3% |
| Iran | 33 | 0.1% |
| Ireland | 120 | 0.4% |
| Jamaica | 359 | 1.1% |
| Korea | 64 | 0.2% |
| Latin America | 1,696 | 5.4% |
| Liberia | 20 | 0.1% |
| Mexico | 109 | 0.4% |
| Middle Africa | 16 | 0.1% |
| Morocco | 45 | 0.1% |
| Nicaragua | 97 | 0.3% |
| Nigeria | 2,076 | 6.6% |
| Northern Africa | 58 | 0.2% |
| Northern Europe | 143 | 0.4% |
| Pakistan | 246 | 0.8% |
| Peru | 13 | 0.0% |
| Philippines | 28 | 0.1% |
| Senegal | 19 | 0.1% |
| South America | 75 | 0.2% |
| South Central Asia | 392 | 1.2% |
| South Eastern Asia | 45 | 0.1% |
| St. Vincent and the Grenadines | 29 | 0.1% |
| Sweden | 13 | 0.0% |
| Trinidad and Tobago | 321 | 1.0% |
| Vietnam | 17 | 0.1% |
| Western Africa | 2,372 | 7.5% | View All 49 Rows |
Sex and Age in Milford Mill
Sex and Age in Milford Mill
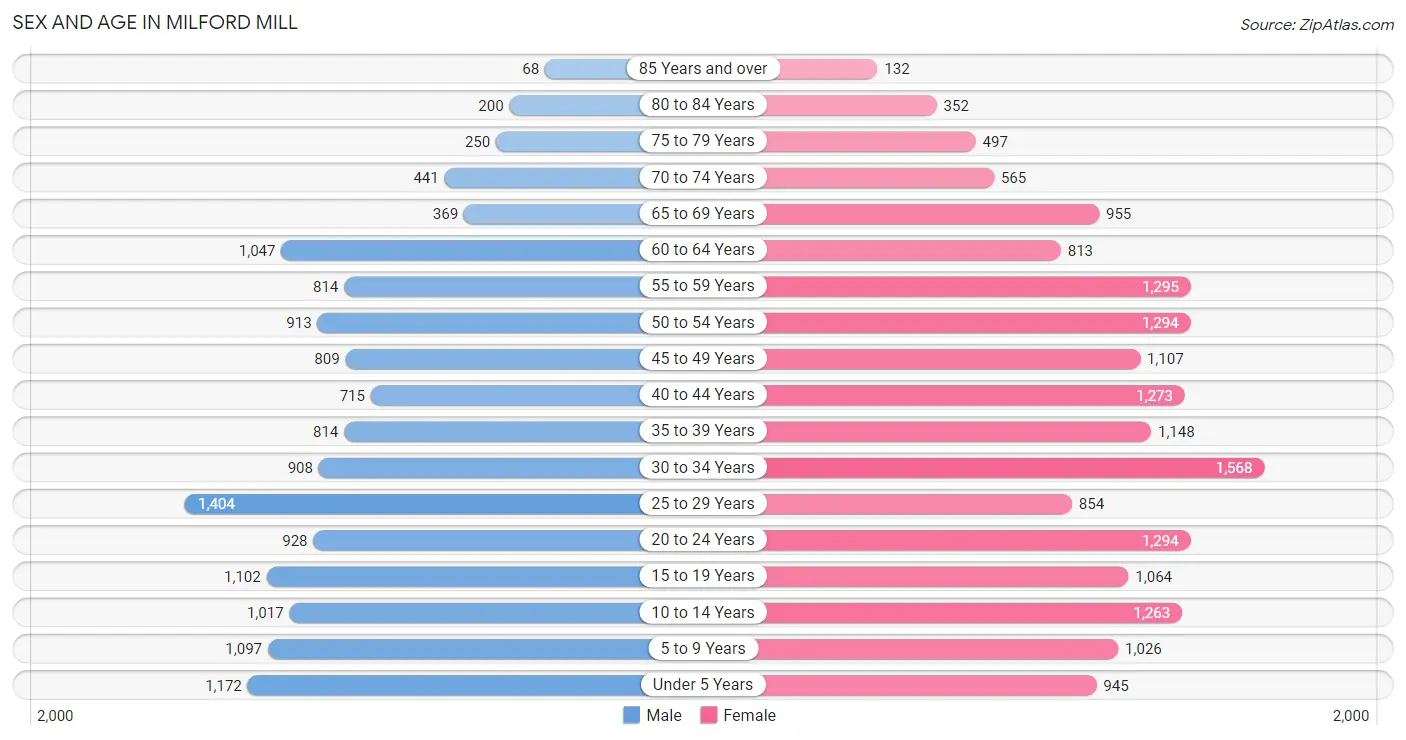
The most populous age groups in Milford Mill are 25 to 29 Years (1,404 | 10.0%) for men and 30 to 34 Years (1,568 | 9.0%) for women.
| Age Bracket | Male | Female |
| Under 5 Years | 1,172 (8.3%) | 945 (5.4%) |
| 5 to 9 Years | 1,097 (7.8%) | 1,026 (5.9%) |
| 10 to 14 Years | 1,017 (7.2%) | 1,263 (7.2%) |
| 15 to 19 Years | 1,102 (7.8%) | 1,064 (6.1%) |
| 20 to 24 Years | 928 (6.6%) | 1,294 (7.4%) |
| 25 to 29 Years | 1,404 (10.0%) | 854 (4.9%) |
| 30 to 34 Years | 908 (6.5%) | 1,568 (9.0%) |
| 35 to 39 Years | 814 (5.8%) | 1,148 (6.6%) |
| 40 to 44 Years | 715 (5.1%) | 1,273 (7.3%) |
| 45 to 49 Years | 809 (5.8%) | 1,107 (6.4%) |
| 50 to 54 Years | 913 (6.5%) | 1,294 (7.4%) |
| 55 to 59 Years | 814 (5.8%) | 1,295 (7.4%) |
| 60 to 64 Years | 1,047 (7.4%) | 813 (4.7%) |
| 65 to 69 Years | 369 (2.6%) | 955 (5.5%) |
| 70 to 74 Years | 441 (3.1%) | 565 (3.2%) |
| 75 to 79 Years | 250 (1.8%) | 497 (2.9%) |
| 80 to 84 Years | 200 (1.4%) | 352 (2.0%) |
| 85 Years and over | 68 (0.5%) | 132 (0.8%) |
| Total | 14,068 (100.0%) | 17,445 (100.0%) |
Families and Households in Milford Mill
Median Family Size in Milford Mill
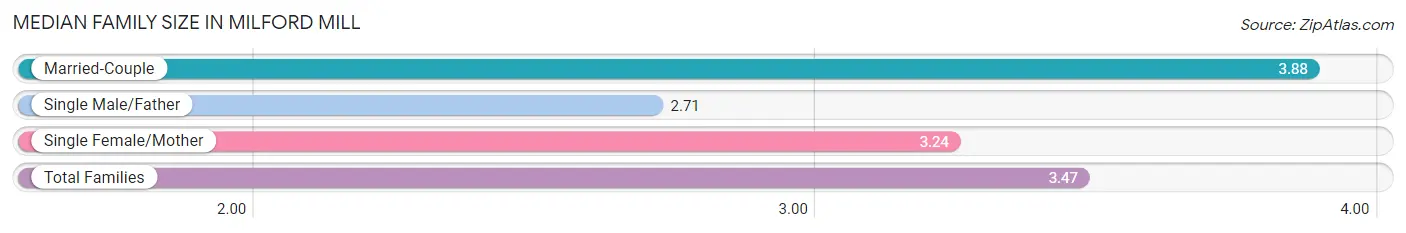
The median family size in Milford Mill is 3.47 persons per family, with married-couple families (3,377 | 47.1%) accounting for the largest median family size of 3.88 persons per family. On the other hand, single male/father families (963 | 13.4%) represent the smallest median family size with 2.71 persons per family.
| Family Type | # Families | Family Size |
| Married-Couple | 3,377 (47.1%) | 3.88 |
| Single Male/Father | 963 (13.4%) | 2.71 |
| Single Female/Mother | 2,825 (39.4%) | 3.24 |
| Total Families | 7,165 (100.0%) | 3.47 |
Median Household Size in Milford Mill
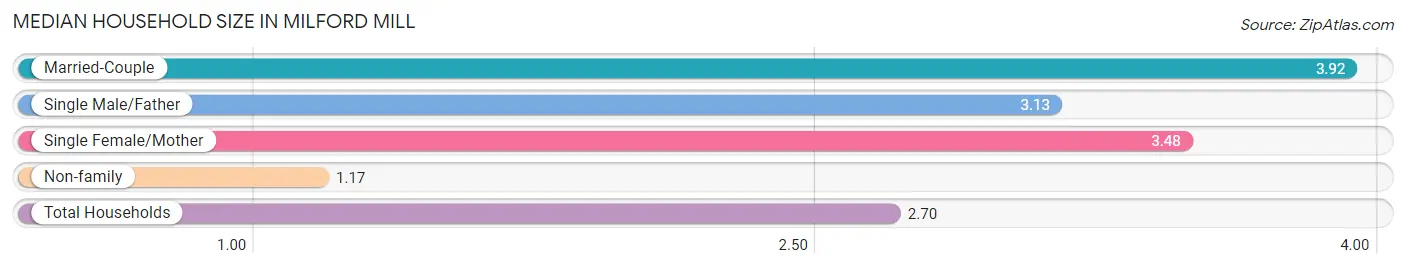
The median household size in Milford Mill is 2.70 persons per household, with married-couple households (3,377 | 29.1%) accounting for the largest median household size of 3.92 persons per household. non-family households (4,424 | 38.2%) represent the smallest median household size with 1.17 persons per household.
| Household Type | # Households | Household Size |
| Married-Couple | 3,377 (29.1%) | 3.92 |
| Single Male/Father | 963 (8.3%) | 3.13 |
| Single Female/Mother | 2,825 (24.4%) | 3.48 |
| Non-family | 4,424 (38.2%) | 1.17 |
| Total Households | 11,589 (100.0%) | 2.70 |
Household Size by Marriage Status in Milford Mill
Out of a total of 11,589 households in Milford Mill, 7,165 (61.8%) are family households, while 4,424 (38.2%) are nonfamily households. The most numerous type of family households are 2-person households, comprising 2,524, and the most common type of nonfamily households are 1-person households, comprising 3,891.
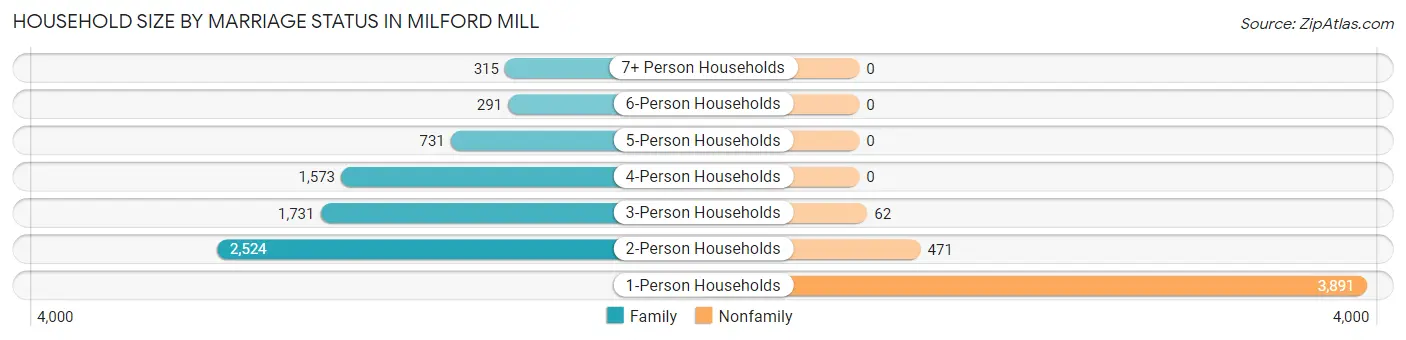
| Household Size | Family Households | Nonfamily Households |
| 1-Person Households | - | 3,891 (33.6%) |
| 2-Person Households | 2,524 (21.8%) | 471 (4.1%) |
| 3-Person Households | 1,731 (14.9%) | 62 (0.5%) |
| 4-Person Households | 1,573 (13.6%) | 0 (0.0%) |
| 5-Person Households | 731 (6.3%) | 0 (0.0%) |
| 6-Person Households | 291 (2.5%) | 0 (0.0%) |
| 7+ Person Households | 315 (2.7%) | 0 (0.0%) |
| Total | 7,165 (61.8%) | 4,424 (38.2%) |
Female Fertility in Milford Mill
Fertility by Age in Milford Mill
Average fertility rate in Milford Mill is 53.0 births per 1,000 women. Women in the age bracket of 20 to 34 years have the highest fertility rate with 115.0 births per 1,000 women. Women in the age bracket of 20 to 34 years acount for 97.5% of all women with births.
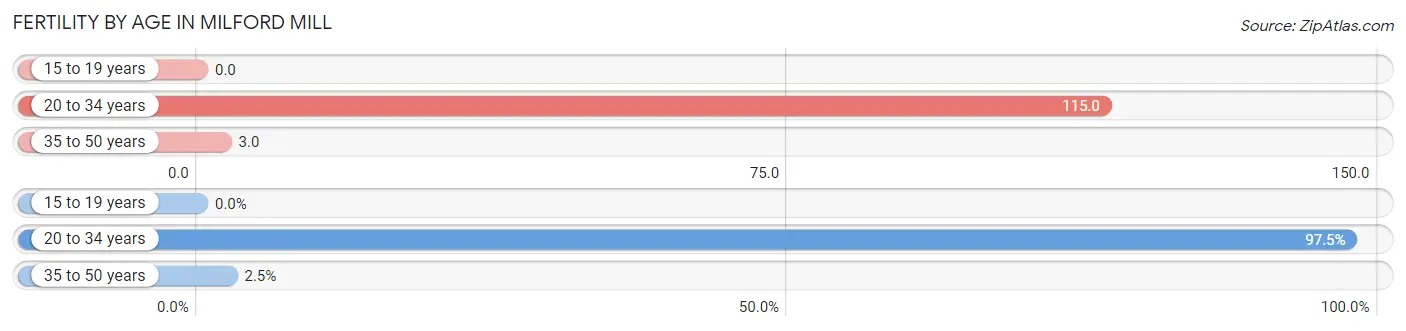
| Age Bracket | Women with Births | Births / 1,000 Women |
| 15 to 19 years | 0 (0.0%) | 0.0 |
| 20 to 34 years | 429 (97.5%) | 115.0 |
| 35 to 50 years | 11 (2.5%) | 3.0 |
| Total | 440 (100.0%) | 53.0 |
Fertility by Age by Marriage Status in Milford Mill
7.0% of women with births (440) in Milford Mill are married. The highest percentage of unmarried women with births falls into 35 to 50 years age bracket with 100.0% of them unmarried at the time of birth, while the lowest percentage of unmarried women with births belong to 20 to 34 years age bracket with 92.8% of them unmarried.
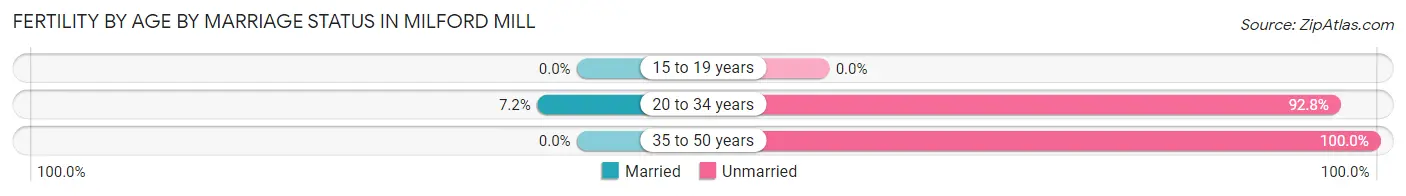
| Age Bracket | Married | Unmarried |
| 15 to 19 years | 0 (0.0%) | 0 (0.0%) |
| 20 to 34 years | 31 (7.2%) | 398 (92.8%) |
| 35 to 50 years | 0 (0.0%) | 11 (100.0%) |
| Total | 31 (7.0%) | 409 (92.9%) |
Fertility by Education in Milford Mill
Average fertility rate in Milford Mill is 53.0 births per 1,000 women. Women with the education attainment of graduate degree have the highest fertility rate of 149.0 births per 1,000 women, while women with the education attainment of less than high school have the lowest fertility at 12.0 births per 1,000 women. Women with the education attainment of graduate degree represent 36.4% of all women with births.
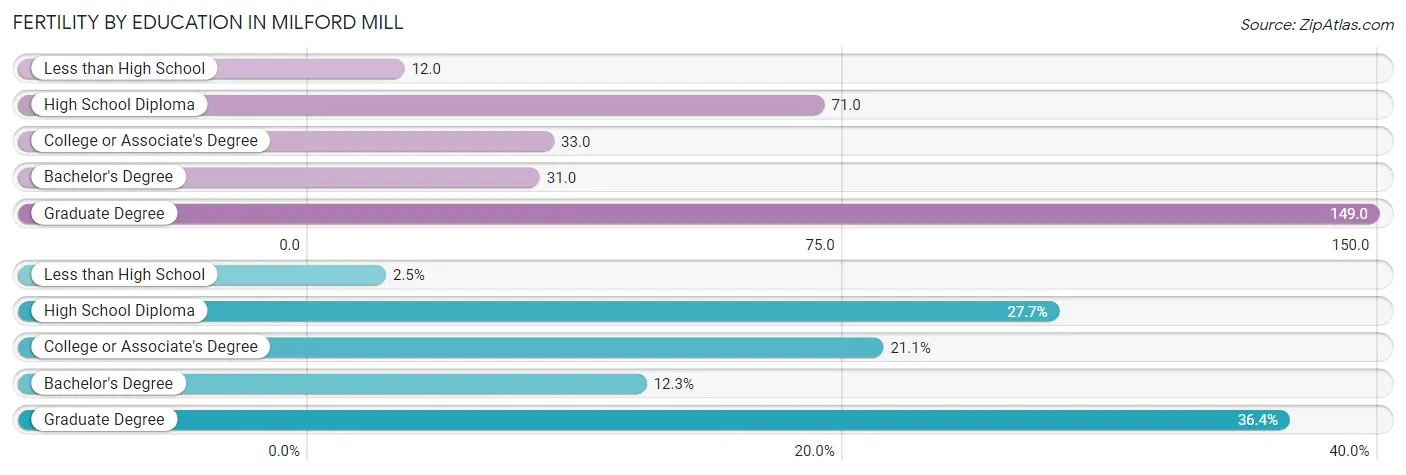
| Educational Attainment | Women with Births | Births / 1,000 Women |
| Less than High School | 11 (2.5%) | 12.0 |
| High School Diploma | 122 (27.7%) | 71.0 |
| College or Associate's Degree | 93 (21.1%) | 33.0 |
| Bachelor's Degree | 54 (12.3%) | 31.0 |
| Graduate Degree | 160 (36.4%) | 149.0 |
| Total | 440 (100.0%) | 53.0 |
Fertility by Education by Marriage Status in Milford Mill
92.9% of women with births in Milford Mill are unmarried. Women with the educational attainment of bachelor's degree are most likely to be married with 31.5% of them married at childbirth, while women with the educational attainment of less than high school are least likely to be married with 100.0% of them unmarried at childbirth.
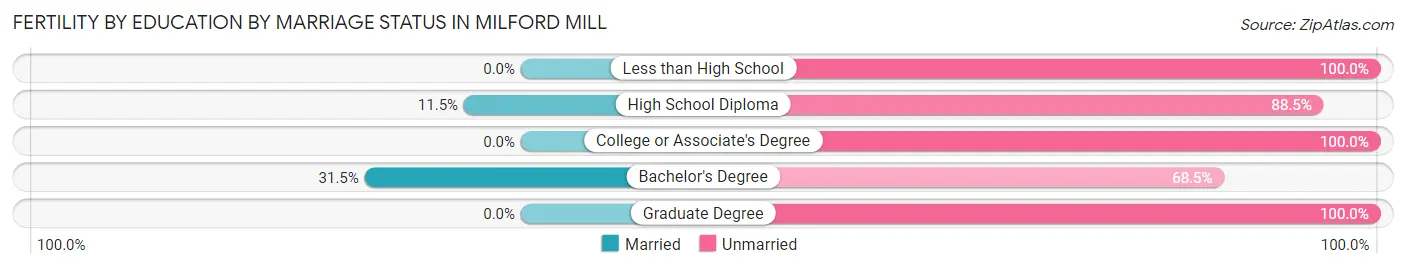
| Educational Attainment | Married | Unmarried |
| Less than High School | 0 (0.0%) | 11 (100.0%) |
| High School Diploma | 14 (11.5%) | 108 (88.5%) |
| College or Associate's Degree | 0 (0.0%) | 93 (100.0%) |
| Bachelor's Degree | 17 (31.5%) | 37 (68.5%) |
| Graduate Degree | 0 (0.0%) | 160 (100.0%) |
| Total | 31 (7.0%) | 409 (92.9%) |
Employment Characteristics in Milford Mill
Employment by Class of Employer in Milford Mill
Among the 16,589 employed individuals in Milford Mill, private company employees (10,472 | 63.1%), not-for-profit organizations (1,819 | 11.0%), and federal government employees (1,304 | 7.9%) make up the most common classes of employment.
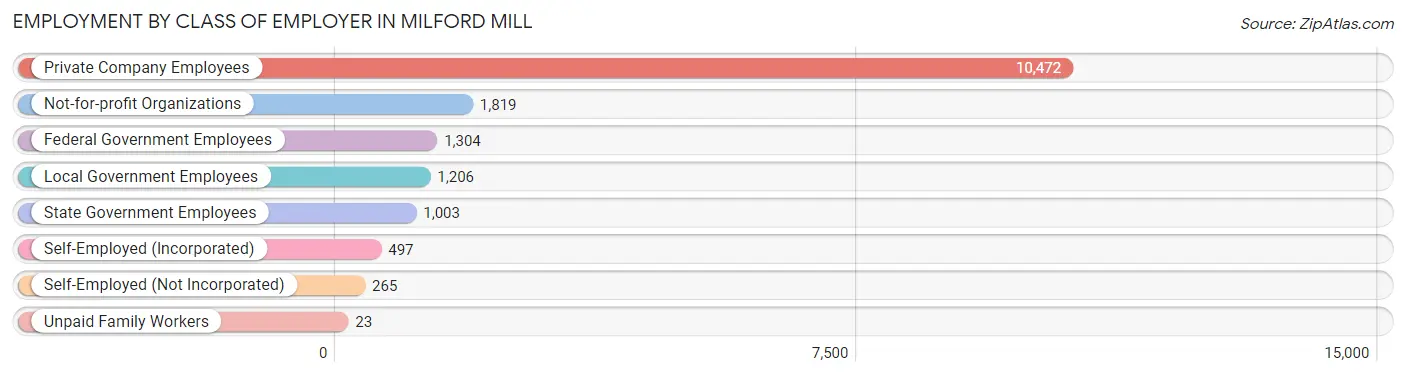
| Employer Class | # Employees | % Employees |
| Private Company Employees | 10,472 | 63.1% |
| Self-Employed (Incorporated) | 497 | 3.0% |
| Self-Employed (Not Incorporated) | 265 | 1.6% |
| Not-for-profit Organizations | 1,819 | 11.0% |
| Local Government Employees | 1,206 | 7.3% |
| State Government Employees | 1,003 | 6.0% |
| Federal Government Employees | 1,304 | 7.9% |
| Unpaid Family Workers | 23 | 0.1% |
| Total | 16,589 | 100.0% |
Employment Status by Age in Milford Mill
According to the labor force statistics for Milford Mill, out of the total population over 16 years of age (24,484), 75.1% or 18,387 individuals are in the labor force, with 7.1% or 1,305 of them unemployed. The age group with the highest labor force participation rate is 30 to 34 years, with 95.2% or 2,357 individuals in the labor force. Within the labor force, the 16 to 19 years age range has the highest percentage of unemployed individuals, with 30.9% or 253 of them being unemployed.
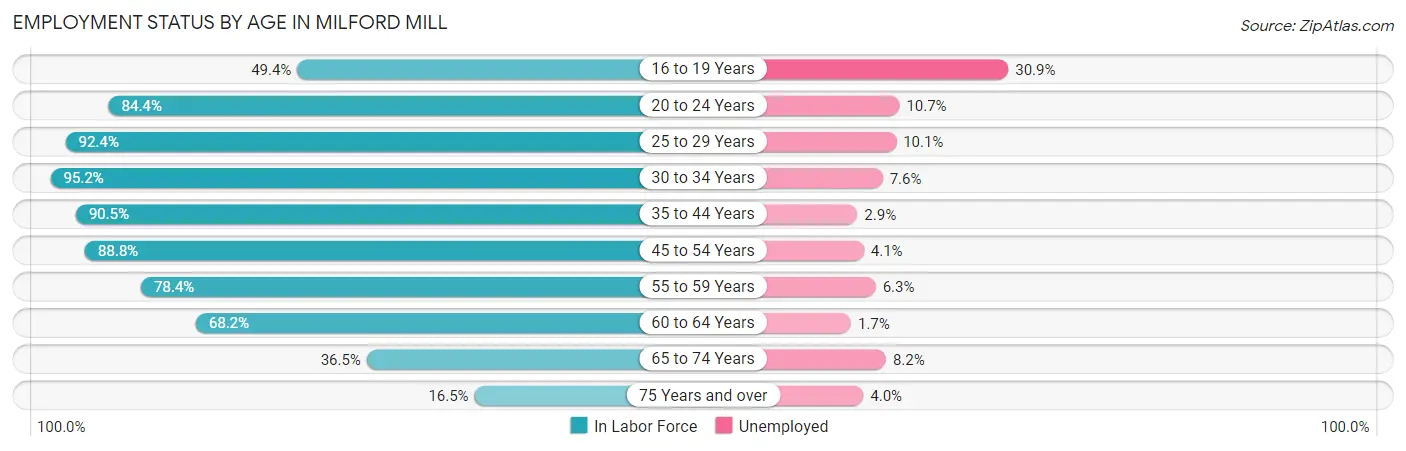
| Age Bracket | In Labor Force | Unemployed |
| 16 to 19 Years | 819 (49.4%) | 253 (30.9%) |
| 20 to 24 Years | 1,875 (84.4%) | 201 (10.7%) |
| 25 to 29 Years | 2,086 (92.4%) | 211 (10.1%) |
| 30 to 34 Years | 2,357 (95.2%) | 179 (7.6%) |
| 35 to 44 Years | 3,575 (90.5%) | 104 (2.9%) |
| 45 to 54 Years | 3,661 (88.8%) | 150 (4.1%) |
| 55 to 59 Years | 1,653 (78.4%) | 104 (6.3%) |
| 60 to 64 Years | 1,269 (68.2%) | 22 (1.7%) |
| 65 to 74 Years | 850 (36.5%) | 70 (8.2%) |
| 75 Years and over | 247 (16.5%) | 10 (4.0%) |
| Total | 18,387 (75.1%) | 1,305 (7.1%) |
Employment Status by Educational Attainment in Milford Mill
According to labor force statistics for Milford Mill, 87.1% of individuals (14,612) out of the total population between 25 and 64 years of age (16,776) are in the labor force, with 5.3% or 774 of them being unemployed. The group with the highest labor force participation rate are those with the educational attainment of bachelor's degree or higher, with 90.1% or 4,803 individuals in the labor force. Within the labor force, individuals with high school diploma education have the highest percentage of unemployment, with 8.5% or 304 of them being unemployed.
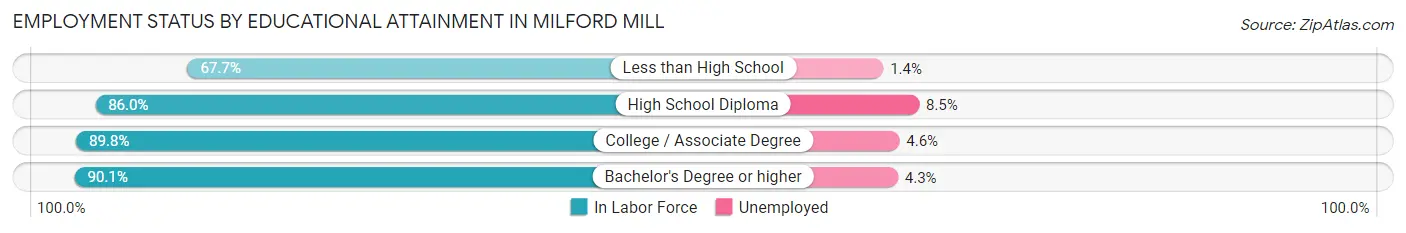
| Educational Attainment | In Labor Force | Unemployed |
| Less than High School | 973 (67.7%) | 20 (1.4%) |
| High School Diploma | 3,579 (86.0%) | 354 (8.5%) |
| College / Associate Degree | 5,250 (89.8%) | 269 (4.6%) |
| Bachelor's Degree or higher | 4,803 (90.1%) | 229 (4.3%) |
| Total | 14,612 (87.1%) | 889 (5.3%) |
Employment Occupations by Sex in Milford Mill
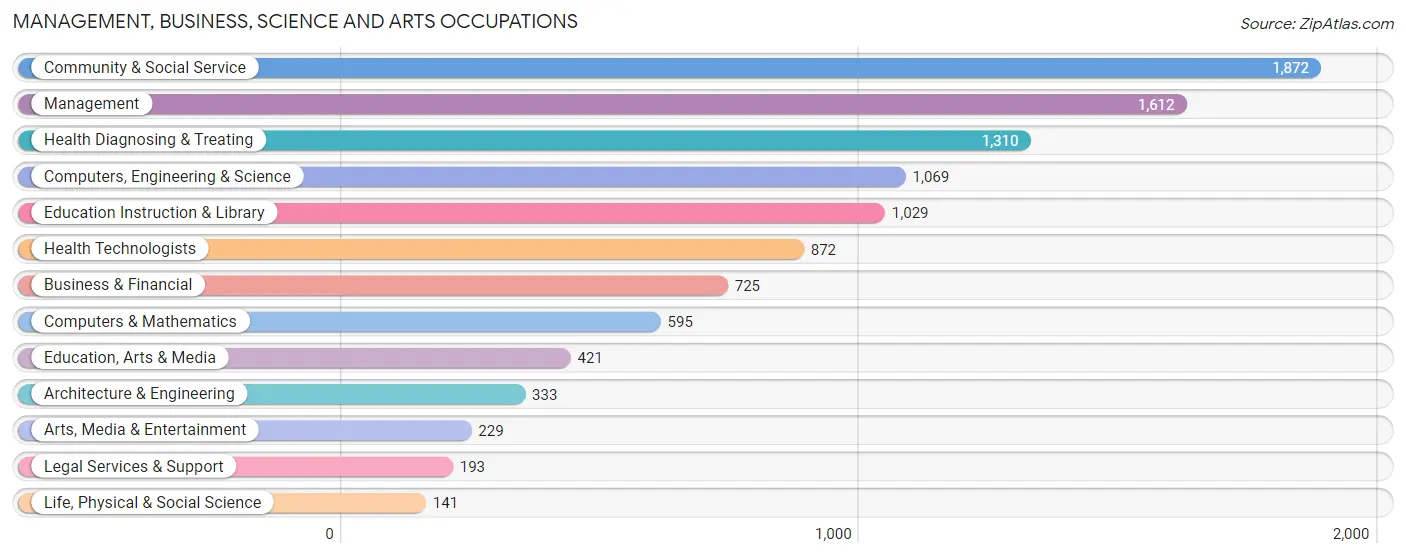
Management, Business, Science and Arts Occupations
The most common Management, Business, Science and Arts occupations in Milford Mill are Community & Social Service (1,872 | 11.0%), Management (1,612 | 9.4%), Health Diagnosing & Treating (1,310 | 7.7%), Computers, Engineering & Science (1,069 | 6.2%), and Education Instruction & Library (1,029 | 6.0%).
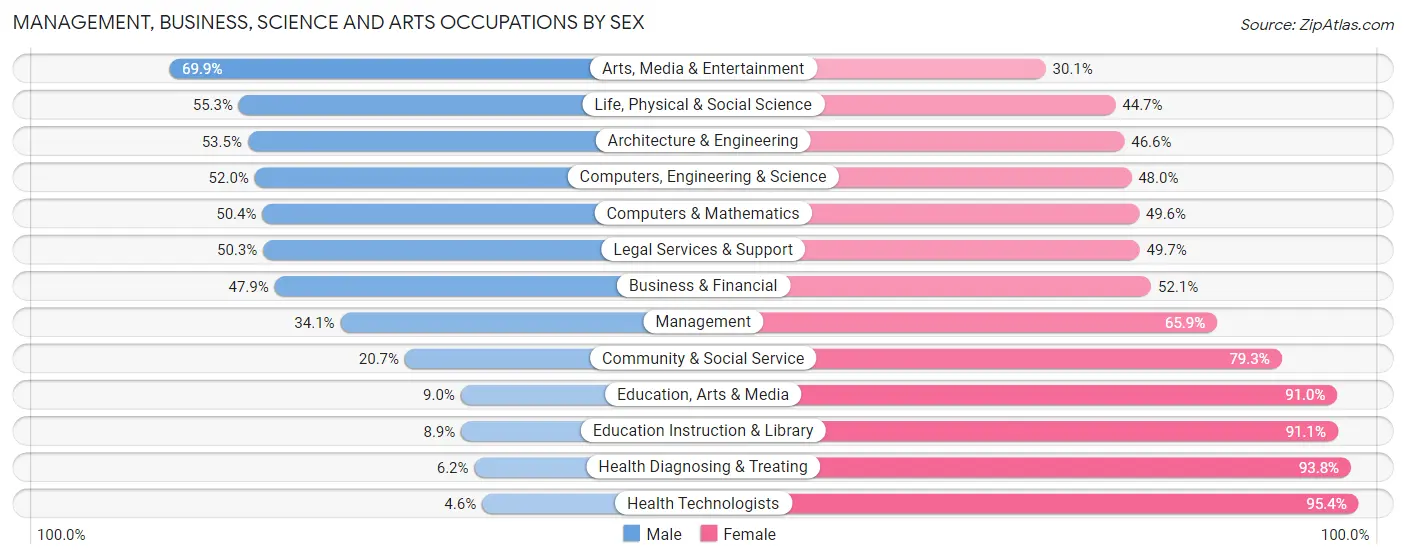
Management, Business, Science and Arts Occupations by Sex
Within the Management, Business, Science and Arts occupations in Milford Mill, the most male-oriented occupations are Arts, Media & Entertainment (69.9%), Life, Physical & Social Science (55.3%), and Architecture & Engineering (53.4%), while the most female-oriented occupations are Health Technologists (95.4%), Health Diagnosing & Treating (93.8%), and Education Instruction & Library (91.1%).
| Occupation | Male | Female |
| Management | 550 (34.1%) | 1,062 (65.9%) |
| Business & Financial | 347 (47.9%) | 378 (52.1%) |
| Computers, Engineering & Science | 556 (52.0%) | 513 (48.0%) |
| Computers & Mathematics | 300 (50.4%) | 295 (49.6%) |
| Architecture & Engineering | 178 (53.4%) | 155 (46.6%) |
| Life, Physical & Social Science | 78 (55.3%) | 63 (44.7%) |
| Community & Social Service | 387 (20.7%) | 1,485 (79.3%) |
| Education, Arts & Media | 38 (9.0%) | 383 (91.0%) |
| Legal Services & Support | 97 (50.3%) | 96 (49.7%) |
| Education Instruction & Library | 92 (8.9%) | 937 (91.1%) |
| Arts, Media & Entertainment | 160 (69.9%) | 69 (30.1%) |
| Health Diagnosing & Treating | 81 (6.2%) | 1,229 (93.8%) |
| Health Technologists | 40 (4.6%) | 832 (95.4%) |
| Total (Category) | 1,921 (29.2%) | 4,667 (70.8%) |
| Total (Overall) | 7,451 (43.6%) | 9,643 (56.4%) |
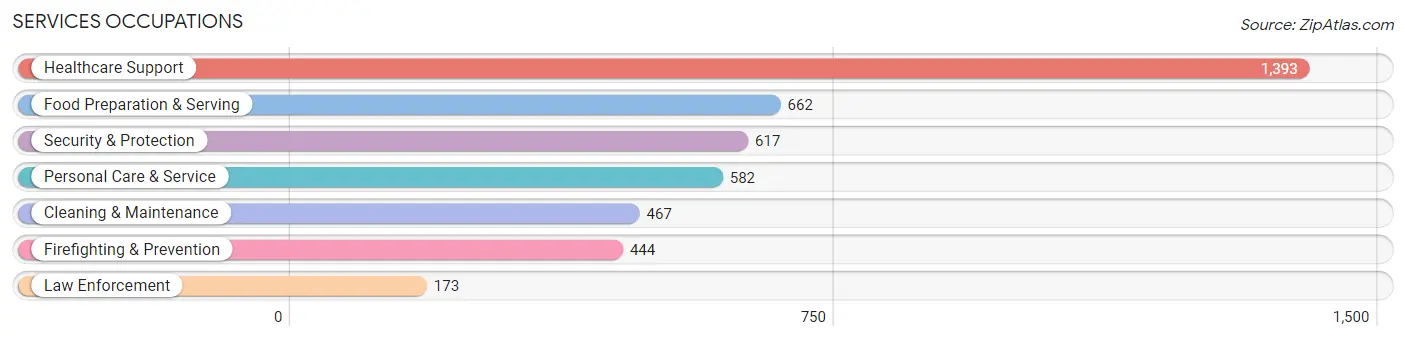
Services Occupations
The most common Services occupations in Milford Mill are Healthcare Support (1,393 | 8.2%), Food Preparation & Serving (662 | 3.9%), Security & Protection (617 | 3.6%), Personal Care & Service (582 | 3.4%), and Cleaning & Maintenance (467 | 2.7%).
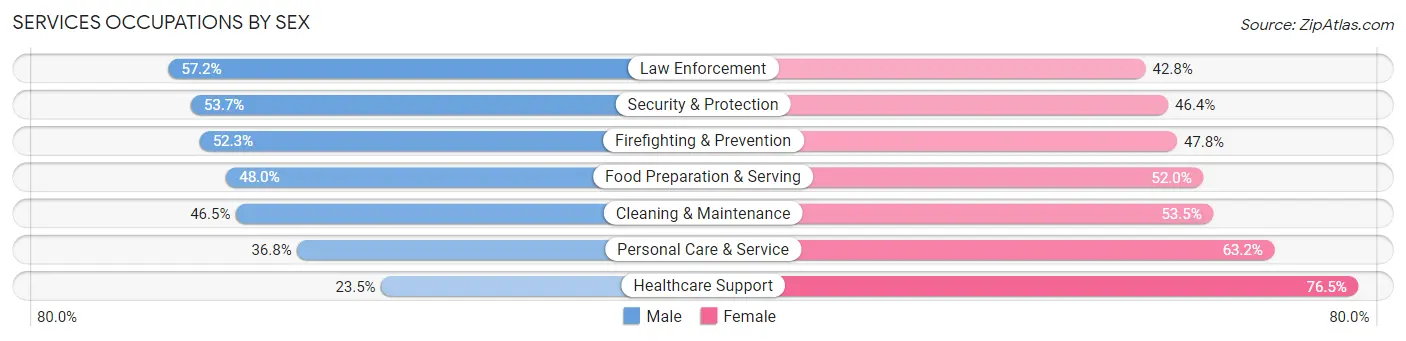
Services Occupations by Sex
Within the Services occupations in Milford Mill, the most male-oriented occupations are Law Enforcement (57.2%), Security & Protection (53.6%), and Firefighting & Prevention (52.2%), while the most female-oriented occupations are Healthcare Support (76.5%), Personal Care & Service (63.2%), and Cleaning & Maintenance (53.5%).
| Occupation | Male | Female |
| Healthcare Support | 327 (23.5%) | 1,066 (76.5%) |
| Security & Protection | 331 (53.6%) | 286 (46.4%) |
| Firefighting & Prevention | 232 (52.2%) | 212 (47.7%) |
| Law Enforcement | 99 (57.2%) | 74 (42.8%) |
| Food Preparation & Serving | 318 (48.0%) | 344 (52.0%) |
| Cleaning & Maintenance | 217 (46.5%) | 250 (53.5%) |
| Personal Care & Service | 214 (36.8%) | 368 (63.2%) |
| Total (Category) | 1,407 (37.8%) | 2,314 (62.2%) |
| Total (Overall) | 7,451 (43.6%) | 9,643 (56.4%) |
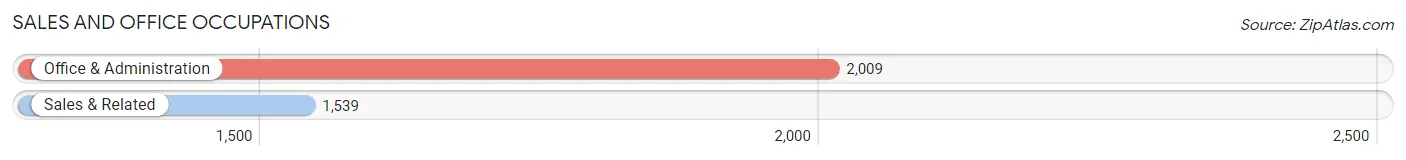
Sales and Office Occupations
The most common Sales and Office occupations in Milford Mill are Office & Administration (2,009 | 11.7%), and Sales & Related (1,539 | 9.0%).
Sales and Office Occupations by Sex
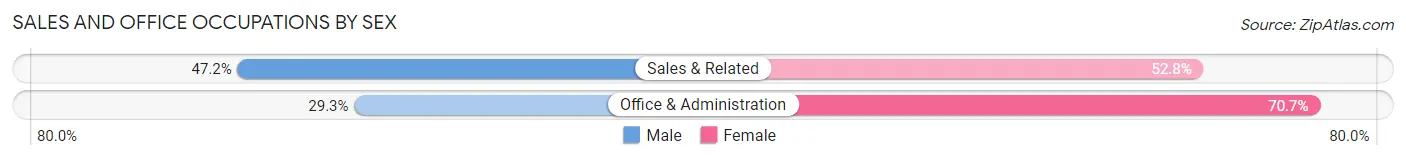
| Occupation | Male | Female |
| Sales & Related | 727 (47.2%) | 812 (52.8%) |
| Office & Administration | 588 (29.3%) | 1,421 (70.7%) |
| Total (Category) | 1,315 (37.1%) | 2,233 (62.9%) |
| Total (Overall) | 7,451 (43.6%) | 9,643 (56.4%) |
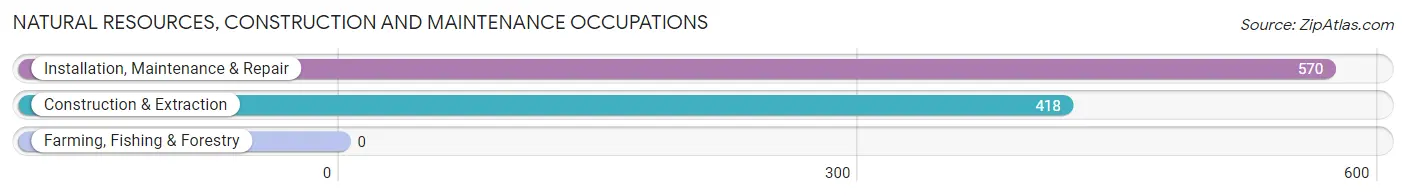
Natural Resources, Construction and Maintenance Occupations
The most common Natural Resources, Construction and Maintenance occupations in Milford Mill are Installation, Maintenance & Repair (570 | 3.3%), and Construction & Extraction (418 | 2.5%).
Natural Resources, Construction and Maintenance Occupations by Sex
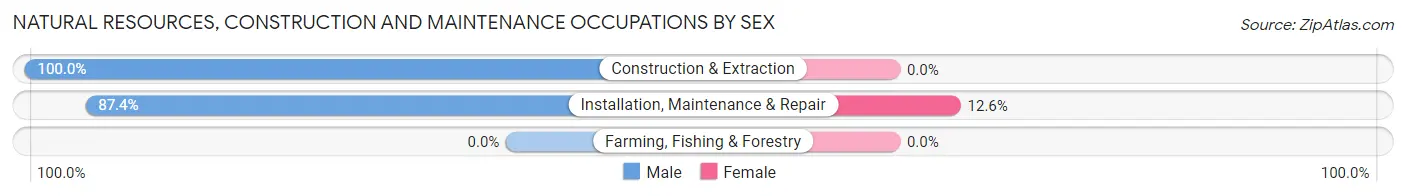
| Occupation | Male | Female |
| Farming, Fishing & Forestry | 0 (0.0%) | 0 (0.0%) |
| Construction & Extraction | 418 (100.0%) | 0 (0.0%) |
| Installation, Maintenance & Repair | 498 (87.4%) | 72 (12.6%) |
| Total (Category) | 916 (92.7%) | 72 (7.3%) |
| Total (Overall) | 7,451 (43.6%) | 9,643 (56.4%) |
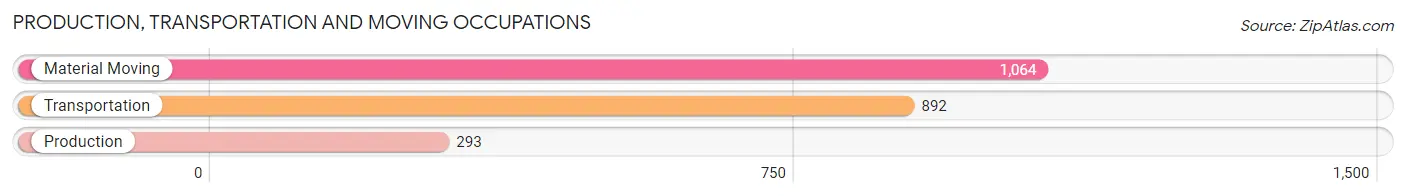
Production, Transportation and Moving Occupations
The most common Production, Transportation and Moving occupations in Milford Mill are Material Moving (1,064 | 6.2%), Transportation (892 | 5.2%), and Production (293 | 1.7%).
Production, Transportation and Moving Occupations by Sex
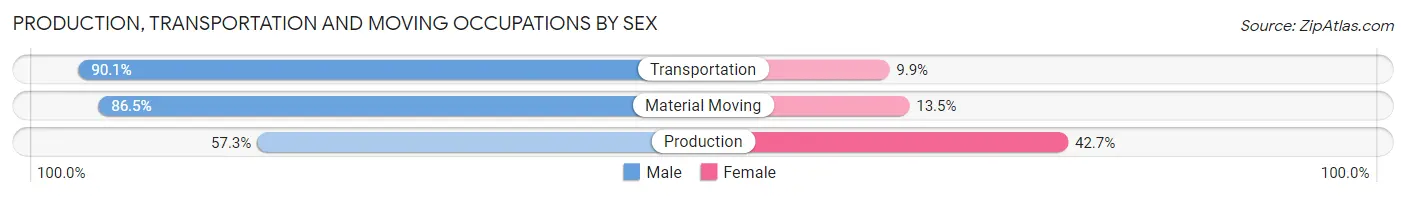
| Occupation | Male | Female |
| Production | 168 (57.3%) | 125 (42.7%) |
| Transportation | 804 (90.1%) | 88 (9.9%) |
| Material Moving | 920 (86.5%) | 144 (13.5%) |
| Total (Category) | 1,892 (84.1%) | 357 (15.9%) |
| Total (Overall) | 7,451 (43.6%) | 9,643 (56.4%) |
Employment Industries by Sex in Milford Mill
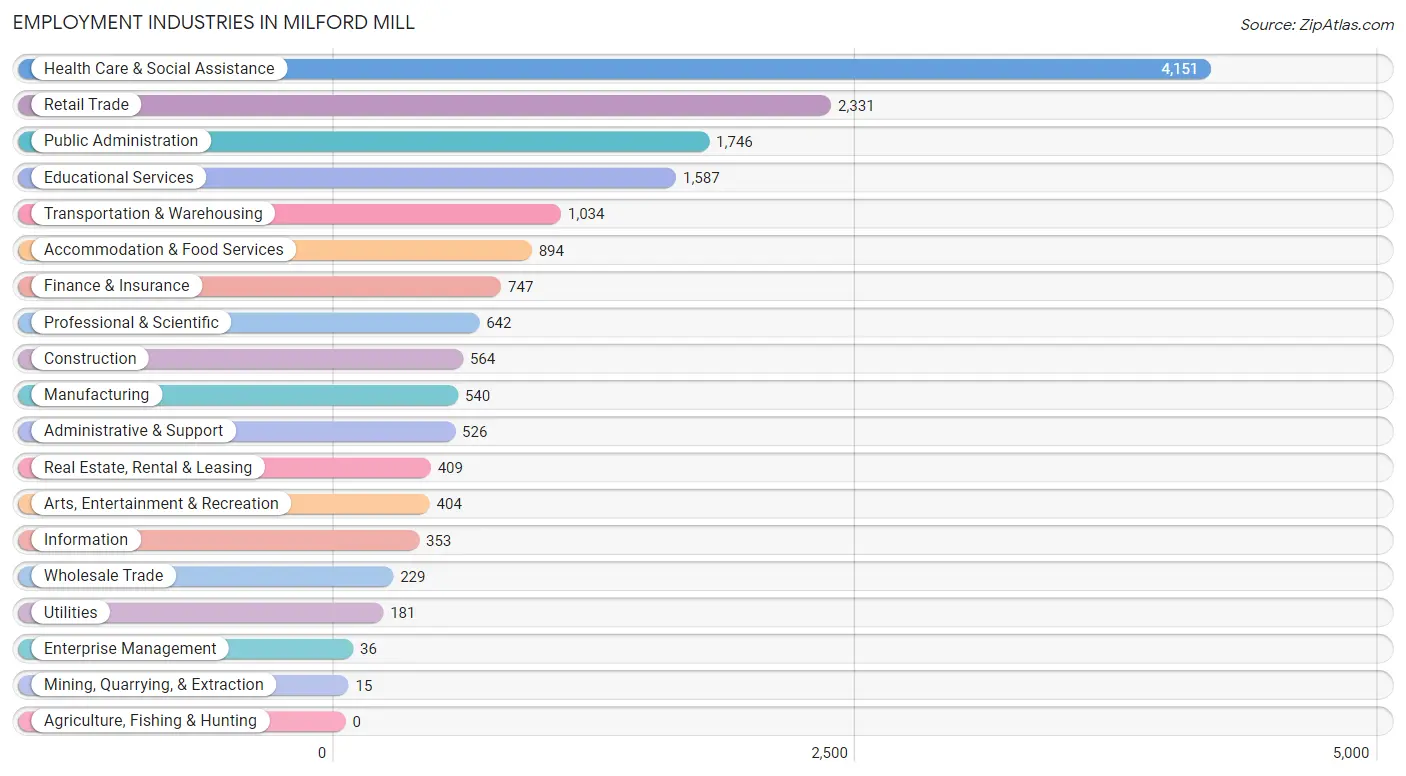
Employment Industries in Milford Mill
The major employment industries in Milford Mill include Health Care & Social Assistance (4,151 | 24.3%), Retail Trade (2,331 | 13.6%), Public Administration (1,746 | 10.2%), Educational Services (1,587 | 9.3%), and Transportation & Warehousing (1,034 | 6.0%).
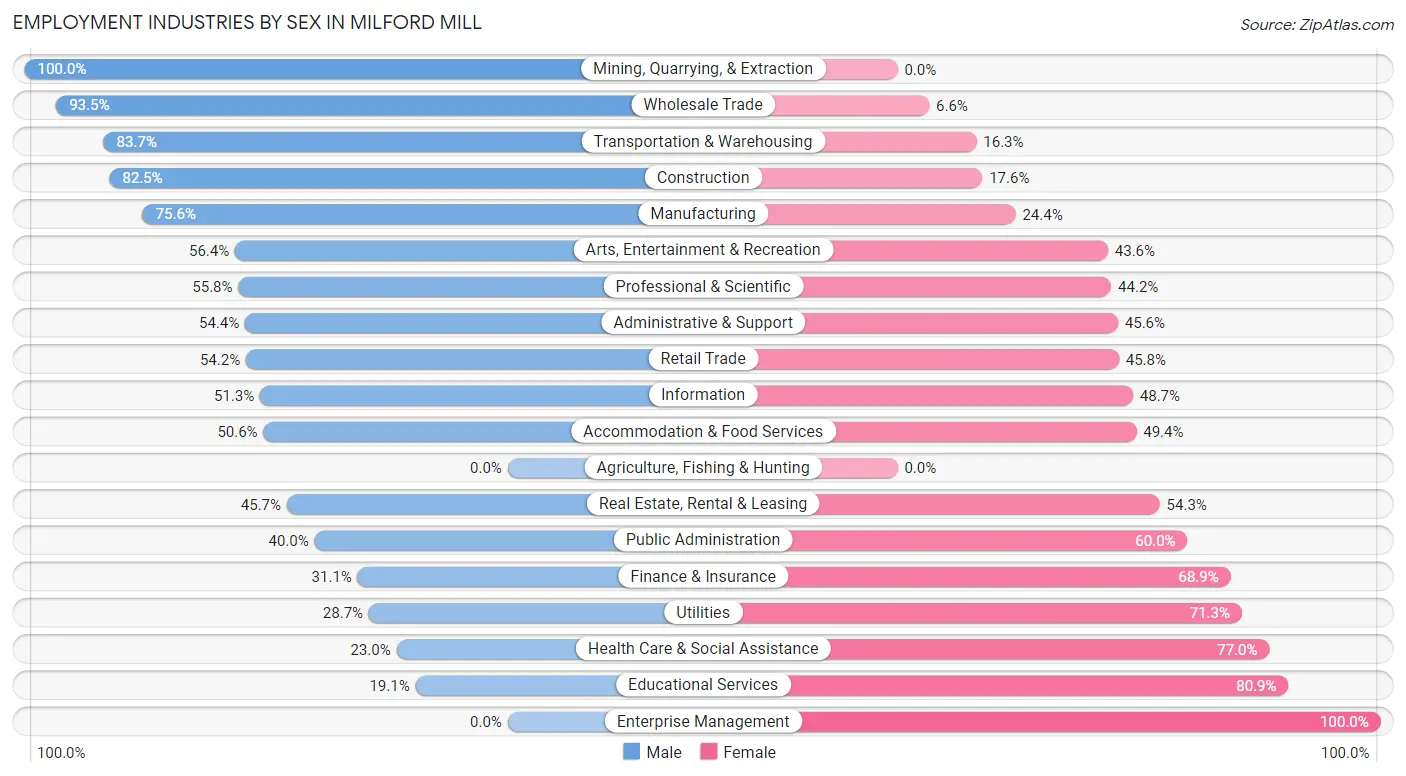
Employment Industries by Sex in Milford Mill
The Milford Mill industries that see more men than women are Mining, Quarrying, & Extraction (100.0%), Wholesale Trade (93.4%), and Transportation & Warehousing (83.7%), whereas the industries that tend to have a higher number of women are Enterprise Management (100.0%), Educational Services (80.9%), and Health Care & Social Assistance (77.0%).
| Industry | Male | Female |
| Agriculture, Fishing & Hunting | 0 (0.0%) | 0 (0.0%) |
| Mining, Quarrying, & Extraction | 15 (100.0%) | 0 (0.0%) |
| Construction | 465 (82.5%) | 99 (17.5%) |
| Manufacturing | 408 (75.6%) | 132 (24.4%) |
| Wholesale Trade | 214 (93.4%) | 15 (6.6%) |
| Retail Trade | 1,263 (54.2%) | 1,068 (45.8%) |
| Transportation & Warehousing | 865 (83.7%) | 169 (16.3%) |
| Utilities | 52 (28.7%) | 129 (71.3%) |
| Information | 181 (51.3%) | 172 (48.7%) |
| Finance & Insurance | 232 (31.1%) | 515 (68.9%) |
| Real Estate, Rental & Leasing | 187 (45.7%) | 222 (54.3%) |
| Professional & Scientific | 358 (55.8%) | 284 (44.2%) |
| Enterprise Management | 0 (0.0%) | 36 (100.0%) |
| Administrative & Support | 286 (54.4%) | 240 (45.6%) |
| Educational Services | 303 (19.1%) | 1,284 (80.9%) |
| Health Care & Social Assistance | 956 (23.0%) | 3,195 (77.0%) |
| Arts, Entertainment & Recreation | 228 (56.4%) | 176 (43.6%) |
| Accommodation & Food Services | 452 (50.6%) | 442 (49.4%) |
| Public Administration | 698 (40.0%) | 1,048 (60.0%) |
| Total | 7,451 (43.6%) | 9,643 (56.4%) |
Education in Milford Mill
School Enrollment in Milford Mill
The most common levels of schooling among the 8,912 students in Milford Mill are middle school (2,016 | 22.6%), college / undergraduate (1,995 | 22.4%), and high school (1,802 | 20.2%).
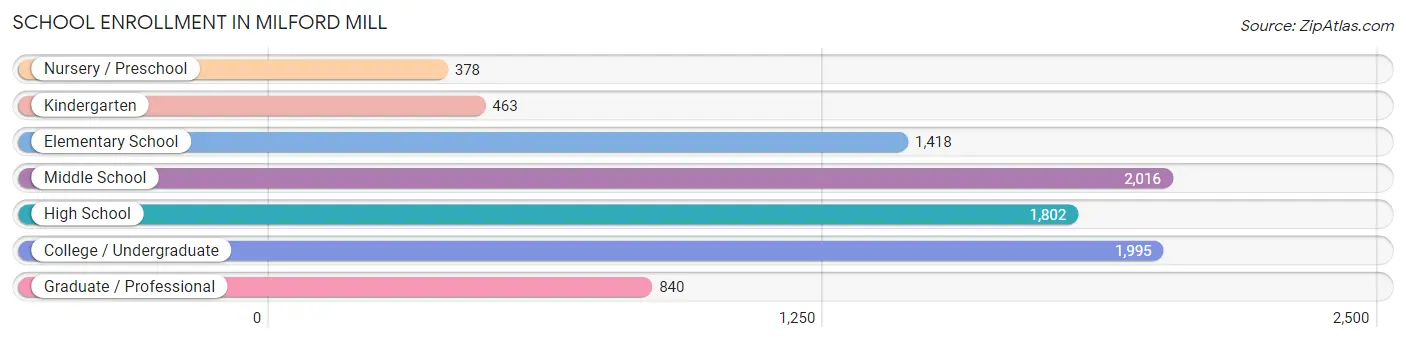
| School Level | # Students | % Students |
| Nursery / Preschool | 378 | 4.2% |
| Kindergarten | 463 | 5.2% |
| Elementary School | 1,418 | 15.9% |
| Middle School | 2,016 | 22.6% |
| High School | 1,802 | 20.2% |
| College / Undergraduate | 1,995 | 22.4% |
| Graduate / Professional | 840 | 9.4% |
| Total | 8,912 | 100.0% |
School Enrollment by Age by Funding Source in Milford Mill
Out of a total of 8,912 students who are enrolled in schools in Milford Mill, 1,283 (14.4%) attend a private institution, while the remaining 7,629 (85.6%) are enrolled in public schools. The age group of 3 to 4 year olds has the highest likelihood of being enrolled in private schools, with 72 (29.9% in the age bracket) enrolled. Conversely, the age group of 10 to 14 year olds has the lowest likelihood of being enrolled in a private school, with 2,120 (94.5% in the age bracket) attending a public institution.
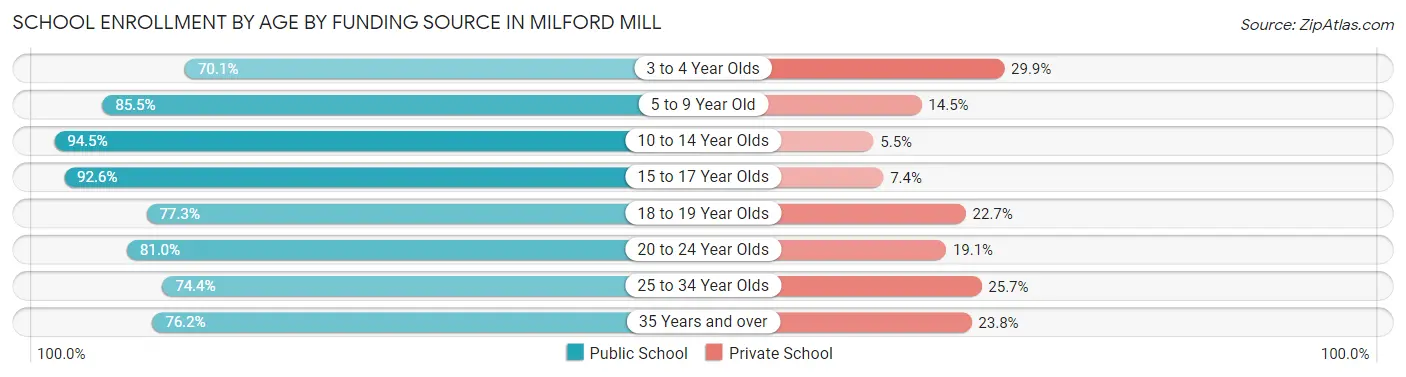
| Age Bracket | Public School | Private School |
| 3 to 4 Year Olds | 169 (70.1%) | 72 (29.9%) |
| 5 to 9 Year Old | 1,701 (85.5%) | 288 (14.5%) |
| 10 to 14 Year Olds | 2,120 (94.5%) | 124 (5.5%) |
| 15 to 17 Year Olds | 1,256 (92.6%) | 100 (7.4%) |
| 18 to 19 Year Olds | 422 (77.3%) | 124 (22.7%) |
| 20 to 24 Year Olds | 782 (80.9%) | 184 (19.1%) |
| 25 to 34 Year Olds | 661 (74.4%) | 228 (25.7%) |
| 35 Years and over | 519 (76.2%) | 162 (23.8%) |
| Total | 7,629 (85.6%) | 1,283 (14.4%) |
Educational Attainment by Field of Study in Milford Mill
Business (1,454 | 21.3%), arts & humanities (827 | 12.1%), science & technology (791 | 11.6%), education (589 | 8.6%), and bio, nature & agricultural (586 | 8.6%) are the most common fields of study among 6,836 individuals in Milford Mill who have obtained a bachelor's degree or higher.
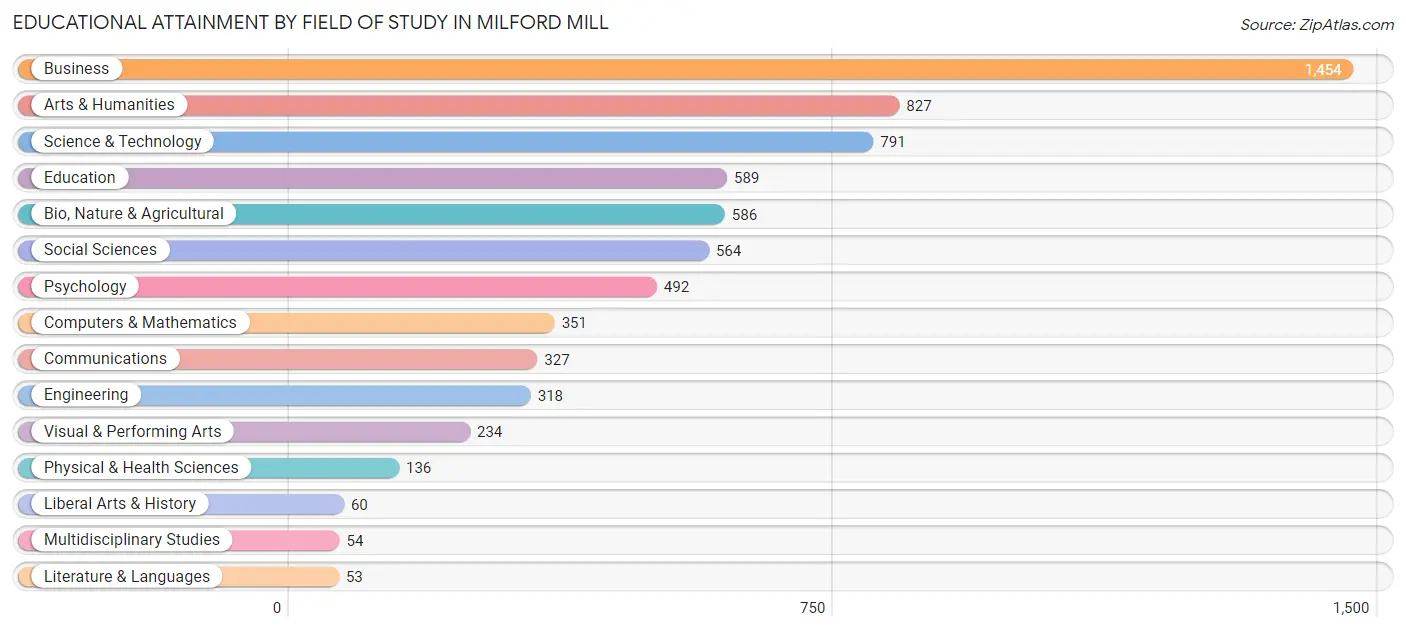
| Field of Study | # Graduates | % Graduates |
| Computers & Mathematics | 351 | 5.1% |
| Bio, Nature & Agricultural | 586 | 8.6% |
| Physical & Health Sciences | 136 | 2.0% |
| Psychology | 492 | 7.2% |
| Social Sciences | 564 | 8.3% |
| Engineering | 318 | 4.6% |
| Multidisciplinary Studies | 54 | 0.8% |
| Science & Technology | 791 | 11.6% |
| Business | 1,454 | 21.3% |
| Education | 589 | 8.6% |
| Literature & Languages | 53 | 0.8% |
| Liberal Arts & History | 60 | 0.9% |
| Visual & Performing Arts | 234 | 3.4% |
| Communications | 327 | 4.8% |
| Arts & Humanities | 827 | 12.1% |
| Total | 6,836 | 100.0% |
Transportation & Commute in Milford Mill
Vehicle Availability by Sex in Milford Mill
The most prevalent vehicle ownership categories in Milford Mill are males with 2 vehicles (3,088, accounting for 42.3%) and females with 2 vehicles (2,991, making up 33.3%).
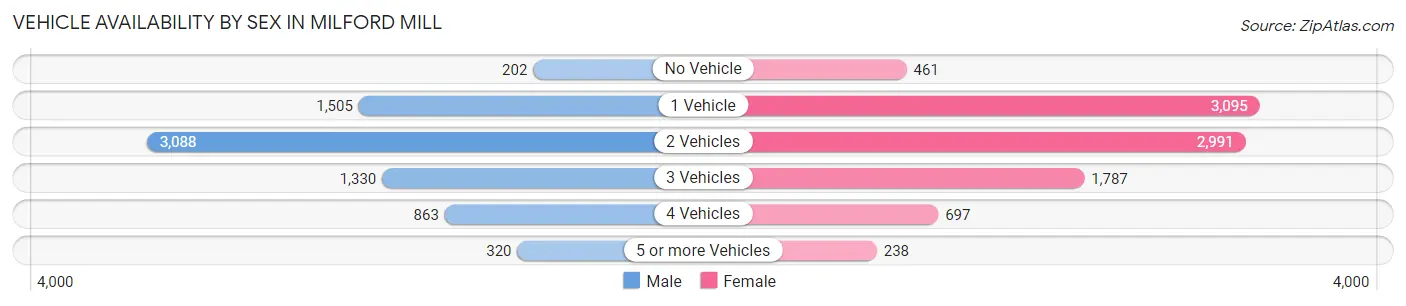
| Vehicles Available | Male | Female |
| No Vehicle | 202 (2.8%) | 461 (5.0%) |
| 1 Vehicle | 1,505 (20.6%) | 3,095 (33.4%) |
| 2 Vehicles | 3,088 (42.3%) | 2,991 (32.3%) |
| 3 Vehicles | 1,330 (18.2%) | 1,787 (19.3%) |
| 4 Vehicles | 863 (11.8%) | 697 (7.5%) |
| 5 or more Vehicles | 320 (4.4%) | 238 (2.6%) |
| Total | 7,308 (100.0%) | 9,269 (100.0%) |
Commute Time in Milford Mill
The most frequently occuring commute durations in Milford Mill are 30 to 34 minutes (3,669 commuters, 24.4%), 15 to 19 minutes (1,944 commuters, 12.9%), and 25 to 29 minutes (1,645 commuters, 11.0%).
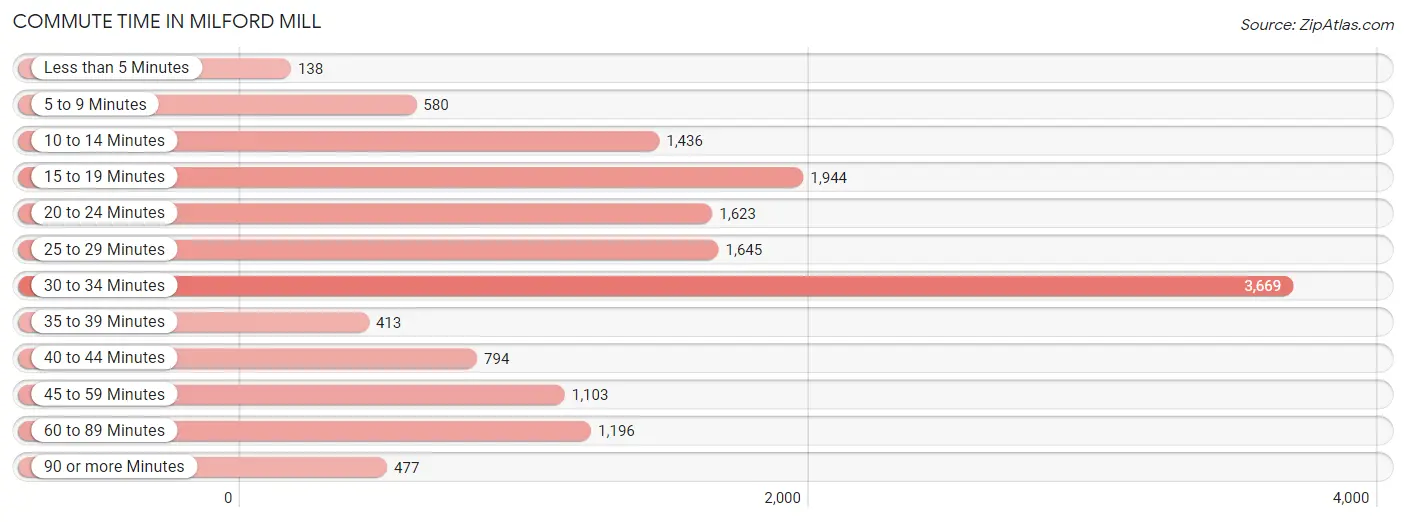
| Commute Time | # Commuters | % Commuters |
| Less than 5 Minutes | 138 | 0.9% |
| 5 to 9 Minutes | 580 | 3.9% |
| 10 to 14 Minutes | 1,436 | 9.6% |
| 15 to 19 Minutes | 1,944 | 12.9% |
| 20 to 24 Minutes | 1,623 | 10.8% |
| 25 to 29 Minutes | 1,645 | 11.0% |
| 30 to 34 Minutes | 3,669 | 24.4% |
| 35 to 39 Minutes | 413 | 2.8% |
| 40 to 44 Minutes | 794 | 5.3% |
| 45 to 59 Minutes | 1,103 | 7.3% |
| 60 to 89 Minutes | 1,196 | 8.0% |
| 90 or more Minutes | 477 | 3.2% |
Commute Time by Sex in Milford Mill
The most common commute times in Milford Mill are 30 to 34 minutes (1,334 commuters, 20.2%) for males and 30 to 34 minutes (2,335 commuters, 27.7%) for females.
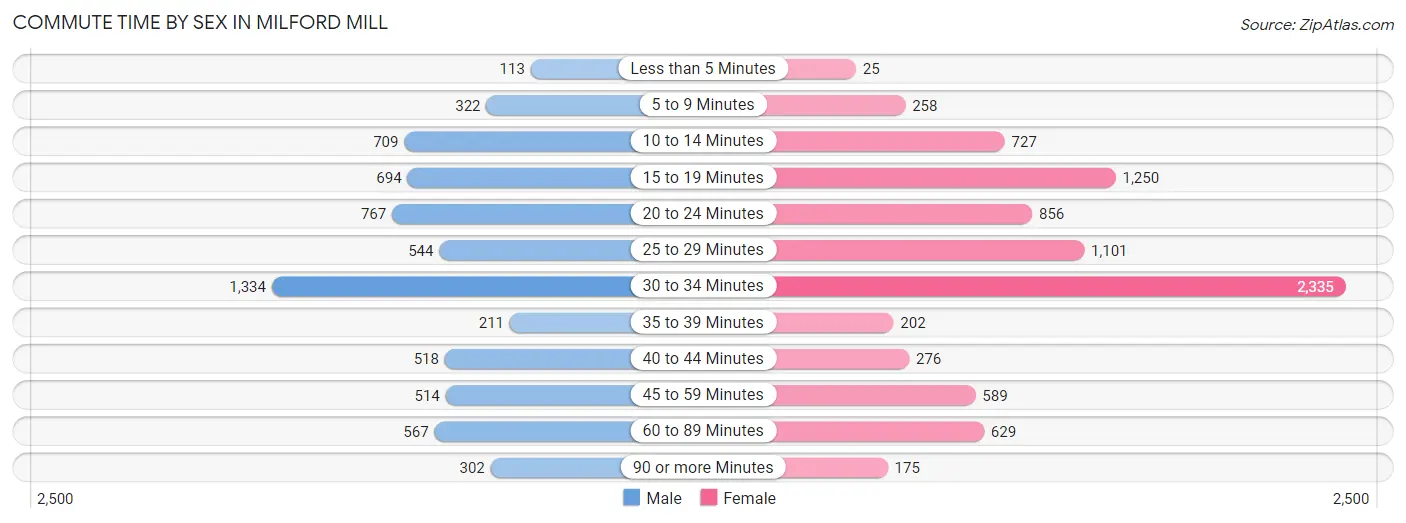
| Commute Time | Male | Female |
| Less than 5 Minutes | 113 (1.7%) | 25 (0.3%) |
| 5 to 9 Minutes | 322 (4.9%) | 258 (3.1%) |
| 10 to 14 Minutes | 709 (10.7%) | 727 (8.6%) |
| 15 to 19 Minutes | 694 (10.5%) | 1,250 (14.8%) |
| 20 to 24 Minutes | 767 (11.6%) | 856 (10.2%) |
| 25 to 29 Minutes | 544 (8.3%) | 1,101 (13.1%) |
| 30 to 34 Minutes | 1,334 (20.2%) | 2,335 (27.7%) |
| 35 to 39 Minutes | 211 (3.2%) | 202 (2.4%) |
| 40 to 44 Minutes | 518 (7.9%) | 276 (3.3%) |
| 45 to 59 Minutes | 514 (7.8%) | 589 (7.0%) |
| 60 to 89 Minutes | 567 (8.6%) | 629 (7.5%) |
| 90 or more Minutes | 302 (4.6%) | 175 (2.1%) |
Time of Departure to Work by Sex in Milford Mill
The most frequent times of departure to work in Milford Mill are 6:00 AM to 6:29 AM (913, 13.8%) for males and 7:30 AM to 7:59 AM (1,346, 16.0%) for females.
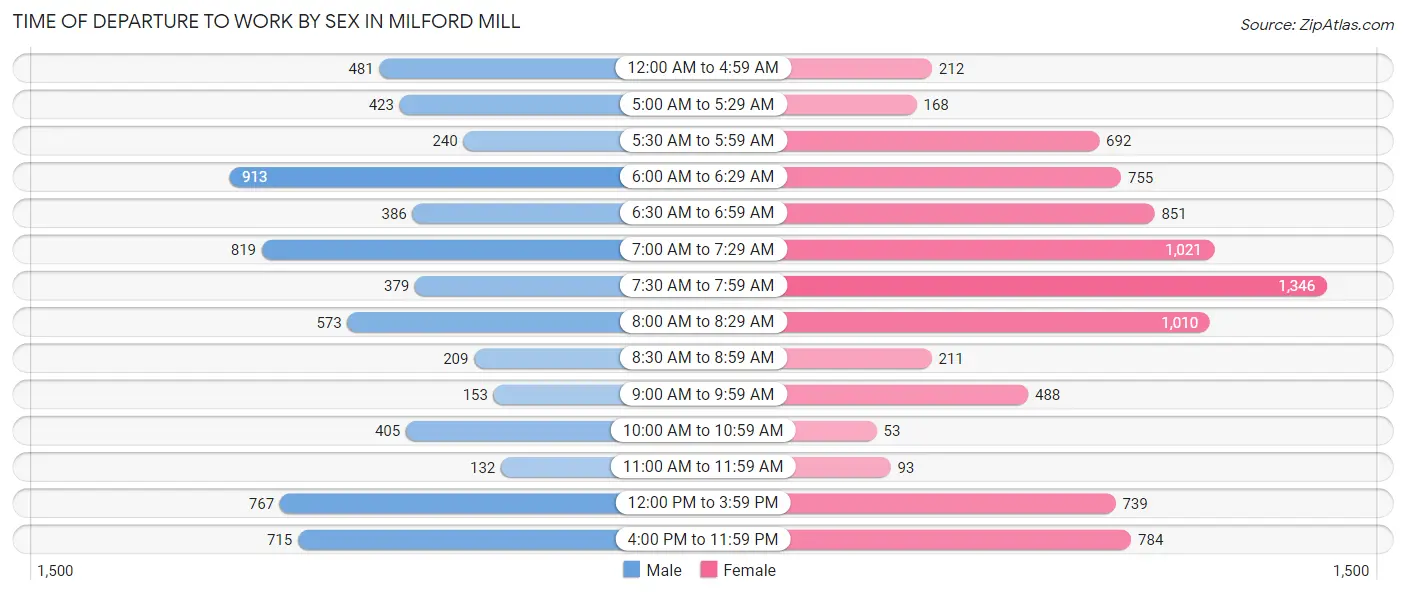
| Time of Departure | Male | Female |
| 12:00 AM to 4:59 AM | 481 (7.3%) | 212 (2.5%) |
| 5:00 AM to 5:29 AM | 423 (6.4%) | 168 (2.0%) |
| 5:30 AM to 5:59 AM | 240 (3.6%) | 692 (8.2%) |
| 6:00 AM to 6:29 AM | 913 (13.8%) | 755 (9.0%) |
| 6:30 AM to 6:59 AM | 386 (5.9%) | 851 (10.1%) |
| 7:00 AM to 7:29 AM | 819 (12.4%) | 1,021 (12.1%) |
| 7:30 AM to 7:59 AM | 379 (5.8%) | 1,346 (16.0%) |
| 8:00 AM to 8:29 AM | 573 (8.7%) | 1,010 (12.0%) |
| 8:30 AM to 8:59 AM | 209 (3.2%) | 211 (2.5%) |
| 9:00 AM to 9:59 AM | 153 (2.3%) | 488 (5.8%) |
| 10:00 AM to 10:59 AM | 405 (6.1%) | 53 (0.6%) |
| 11:00 AM to 11:59 AM | 132 (2.0%) | 93 (1.1%) |
| 12:00 PM to 3:59 PM | 767 (11.6%) | 739 (8.8%) |
| 4:00 PM to 11:59 PM | 715 (10.8%) | 784 (9.3%) |
| Total | 6,595 (100.0%) | 8,423 (100.0%) |
Housing Occupancy in Milford Mill
Occupancy by Ownership in Milford Mill
Of the total 11,589 dwellings in Milford Mill, owner-occupied units account for 5,168 (44.6%), while renter-occupied units make up 6,421 (55.4%).
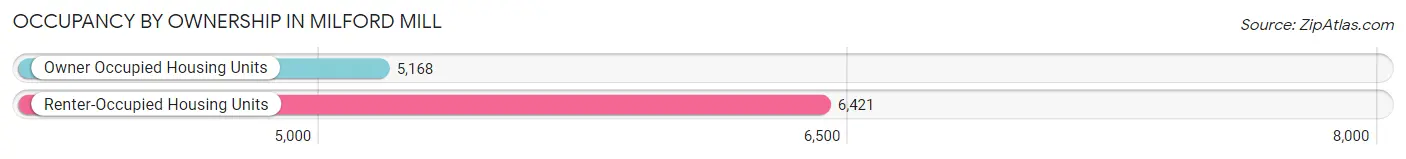
| Occupancy | # Housing Units | % Housing Units |
| Owner Occupied Housing Units | 5,168 | 44.6% |
| Renter-Occupied Housing Units | 6,421 | 55.4% |
| Total Occupied Housing Units | 11,589 | 100.0% |
Occupancy by Household Size in Milford Mill
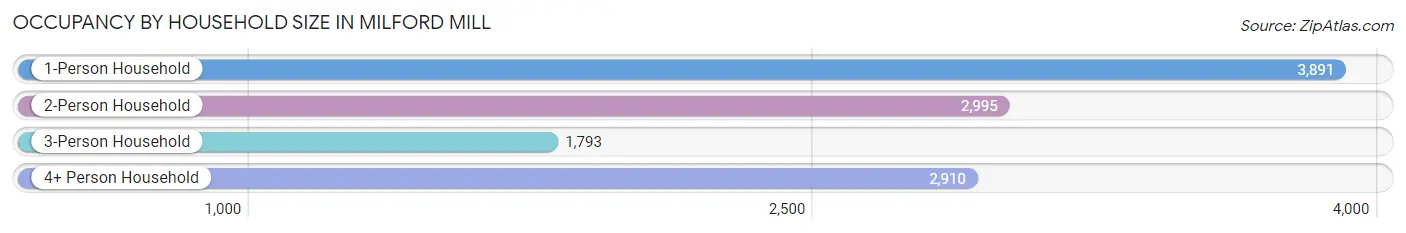
| Household Size | # Housing Units | % Housing Units |
| 1-Person Household | 3,891 | 33.6% |
| 2-Person Household | 2,995 | 25.8% |
| 3-Person Household | 1,793 | 15.5% |
| 4+ Person Household | 2,910 | 25.1% |
| Total Housing Units | 11,589 | 100.0% |
Occupancy by Ownership by Household Size in Milford Mill
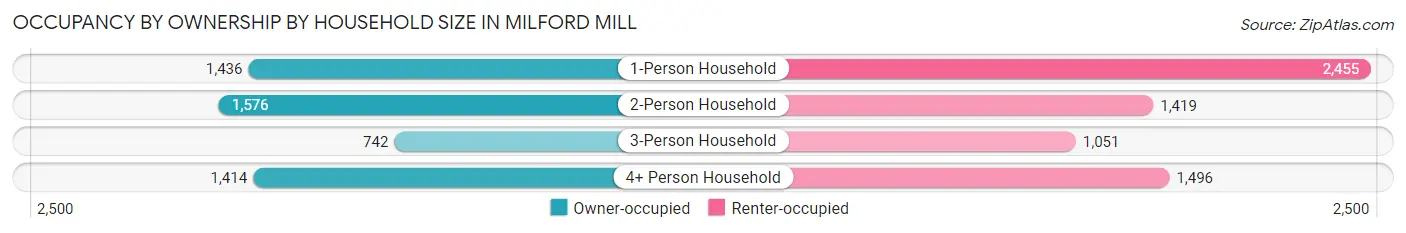
| Household Size | Owner-occupied | Renter-occupied |
| 1-Person Household | 1,436 (36.9%) | 2,455 (63.1%) |
| 2-Person Household | 1,576 (52.6%) | 1,419 (47.4%) |
| 3-Person Household | 742 (41.4%) | 1,051 (58.6%) |
| 4+ Person Household | 1,414 (48.6%) | 1,496 (51.4%) |
| Total Housing Units | 5,168 (44.6%) | 6,421 (55.4%) |
Occupancy by Educational Attainment in Milford Mill
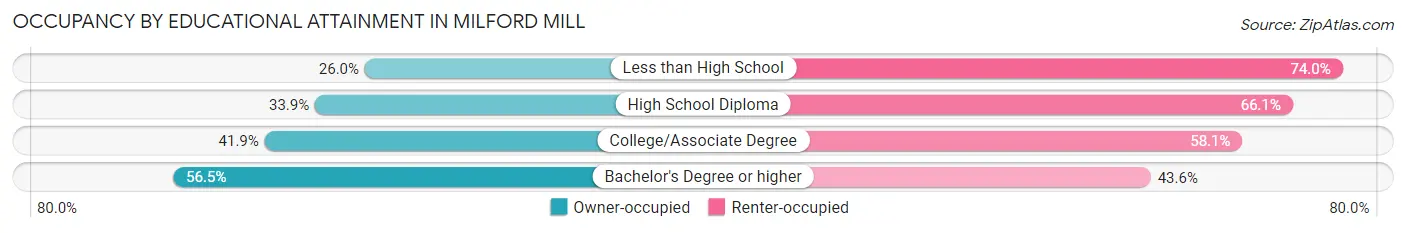
| Household Size | Owner-occupied | Renter-occupied |
| Less than High School | 145 (26.0%) | 412 (74.0%) |
| High School Diploma | 840 (33.9%) | 1,636 (66.1%) |
| College/Associate Degree | 1,868 (41.9%) | 2,587 (58.1%) |
| Bachelor's Degree or higher | 2,315 (56.5%) | 1,786 (43.5%) |
Occupancy by Age of Householder in Milford Mill
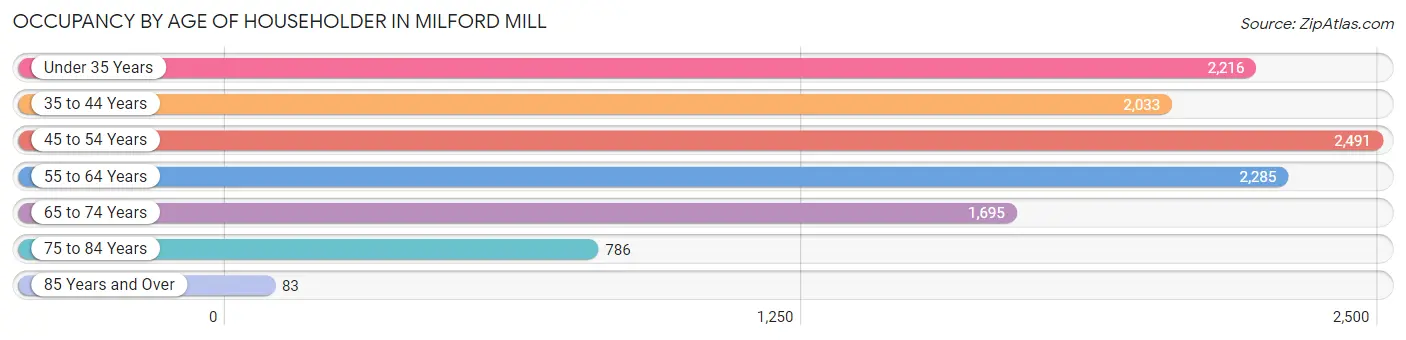
| Age Bracket | # Households | % Households |
| Under 35 Years | 2,216 | 19.1% |
| 35 to 44 Years | 2,033 | 17.5% |
| 45 to 54 Years | 2,491 | 21.5% |
| 55 to 64 Years | 2,285 | 19.7% |
| 65 to 74 Years | 1,695 | 14.6% |
| 75 to 84 Years | 786 | 6.8% |
| 85 Years and Over | 83 | 0.7% |
| Total | 11,589 | 100.0% |
Housing Finances in Milford Mill
Median Income by Occupancy in Milford Mill
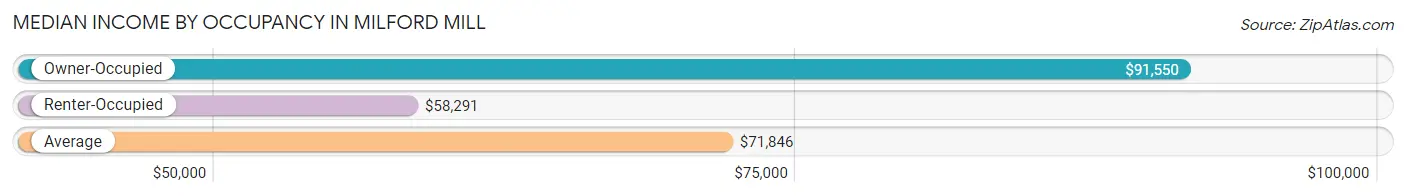
| Occupancy Type | # Households | Median Income |
| Owner-Occupied | 5,168 (44.6%) | $91,550 |
| Renter-Occupied | 6,421 (55.4%) | $58,291 |
| Average | 11,589 (100.0%) | $71,846 |
Occupancy by Householder Income Bracket in Milford Mill
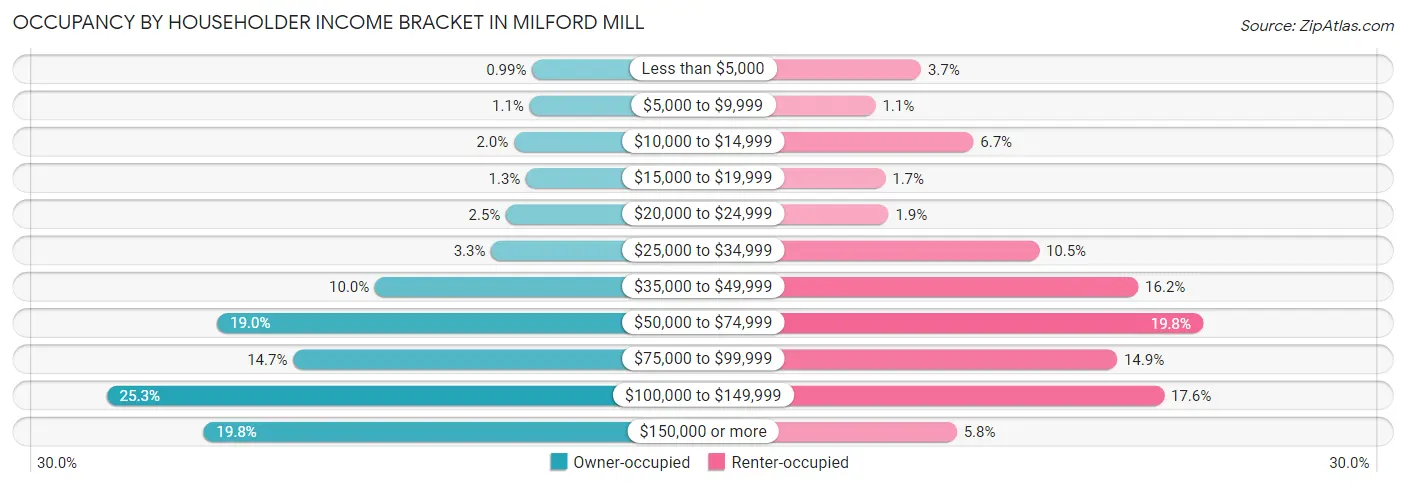
| Income Bracket | Owner-occupied | Renter-occupied |
| Less than $5,000 | 51 (1.0%) | 240 (3.7%) |
| $5,000 to $9,999 | 59 (1.1%) | 73 (1.1%) |
| $10,000 to $14,999 | 105 (2.0%) | 432 (6.7%) |
| $15,000 to $19,999 | 69 (1.3%) | 109 (1.7%) |
| $20,000 to $24,999 | 128 (2.5%) | 121 (1.9%) |
| $25,000 to $34,999 | 172 (3.3%) | 673 (10.5%) |
| $35,000 to $49,999 | 515 (10.0%) | 1,037 (16.2%) |
| $50,000 to $74,999 | 982 (19.0%) | 1,274 (19.8%) |
| $75,000 to $99,999 | 757 (14.6%) | 959 (14.9%) |
| $100,000 to $149,999 | 1,308 (25.3%) | 1,132 (17.6%) |
| $150,000 or more | 1,022 (19.8%) | 371 (5.8%) |
| Total | 5,168 (100.0%) | 6,421 (100.0%) |
Monthly Housing Cost Tiers in Milford Mill
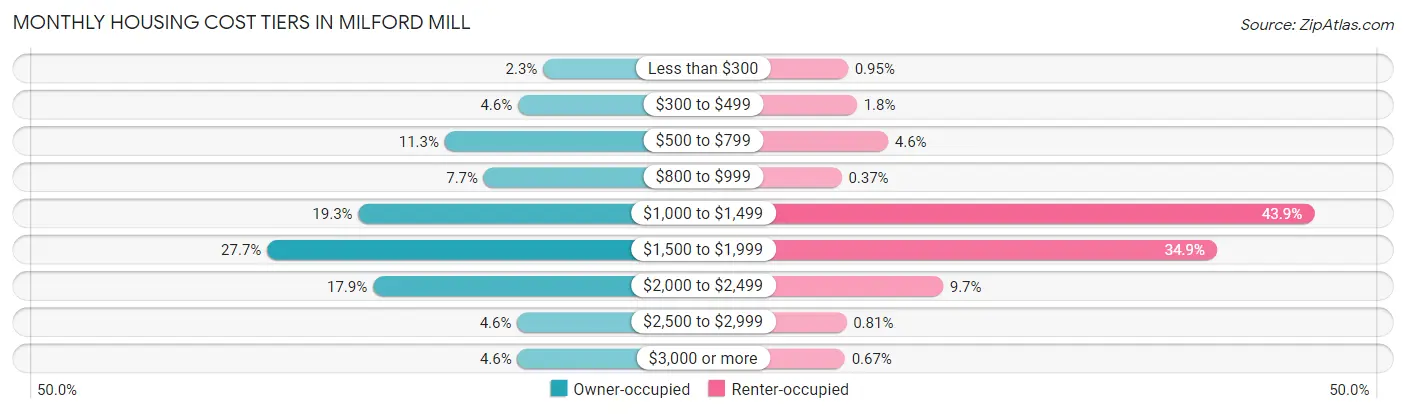
| Monthly Cost | Owner-occupied | Renter-occupied |
| Less than $300 | 117 (2.3%) | 61 (0.9%) |
| $300 to $499 | 236 (4.6%) | 114 (1.8%) |
| $500 to $799 | 585 (11.3%) | 298 (4.6%) |
| $800 to $999 | 399 (7.7%) | 24 (0.4%) |
| $1,000 to $1,499 | 996 (19.3%) | 2,817 (43.9%) |
| $1,500 to $1,999 | 1,430 (27.7%) | 2,242 (34.9%) |
| $2,000 to $2,499 | 926 (17.9%) | 623 (9.7%) |
| $2,500 to $2,999 | 240 (4.6%) | 52 (0.8%) |
| $3,000 or more | 239 (4.6%) | 43 (0.7%) |
| Total | 5,168 (100.0%) | 6,421 (100.0%) |
Physical Housing Characteristics in Milford Mill
Housing Structures in Milford Mill
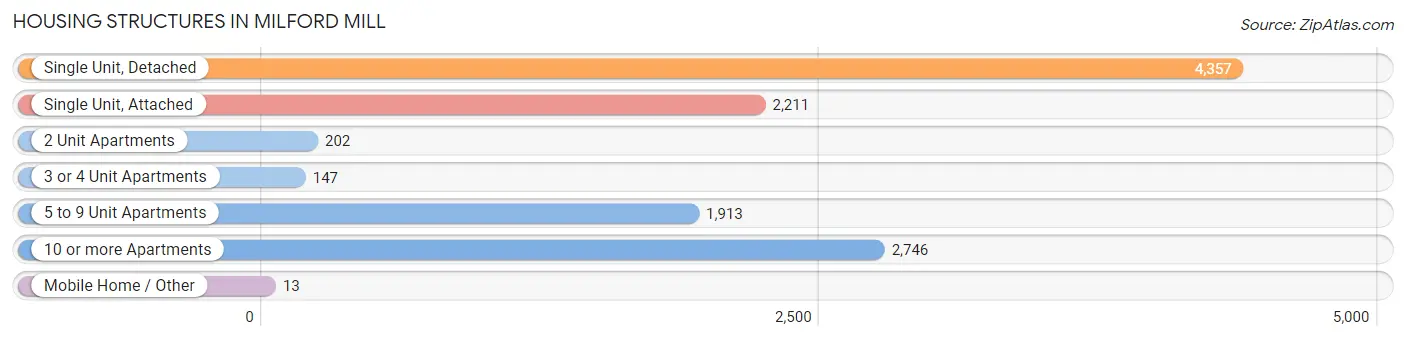
| Structure Type | # Housing Units | % Housing Units |
| Single Unit, Detached | 4,357 | 37.6% |
| Single Unit, Attached | 2,211 | 19.1% |
| 2 Unit Apartments | 202 | 1.7% |
| 3 or 4 Unit Apartments | 147 | 1.3% |
| 5 to 9 Unit Apartments | 1,913 | 16.5% |
| 10 or more Apartments | 2,746 | 23.7% |
| Mobile Home / Other | 13 | 0.1% |
| Total | 11,589 | 100.0% |
Housing Structures by Occupancy in Milford Mill
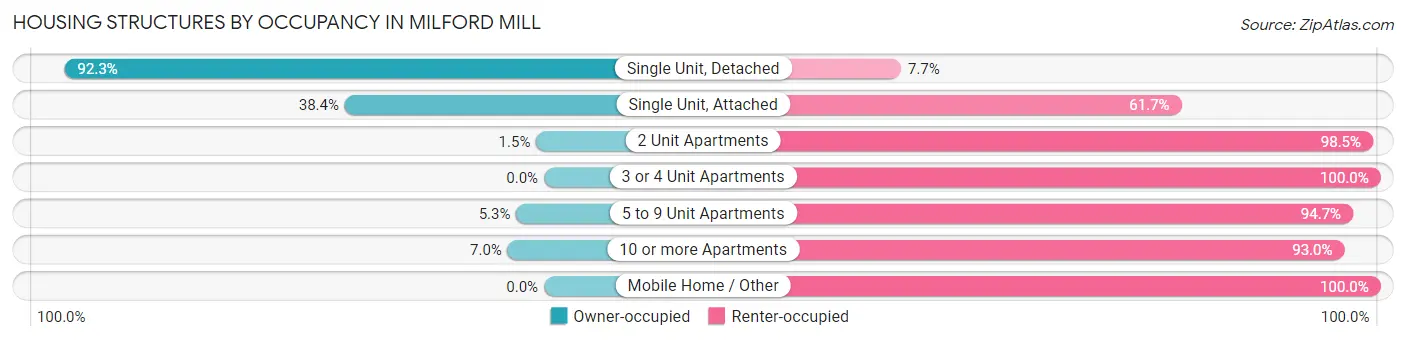
| Structure Type | Owner-occupied | Renter-occupied |
| Single Unit, Detached | 4,023 (92.3%) | 334 (7.7%) |
| Single Unit, Attached | 848 (38.4%) | 1,363 (61.7%) |
| 2 Unit Apartments | 3 (1.5%) | 199 (98.5%) |
| 3 or 4 Unit Apartments | 0 (0.0%) | 147 (100.0%) |
| 5 to 9 Unit Apartments | 102 (5.3%) | 1,811 (94.7%) |
| 10 or more Apartments | 192 (7.0%) | 2,554 (93.0%) |
| Mobile Home / Other | 0 (0.0%) | 13 (100.0%) |
| Total | 5,168 (44.6%) | 6,421 (55.4%) |
Housing Structures by Number of Rooms in Milford Mill
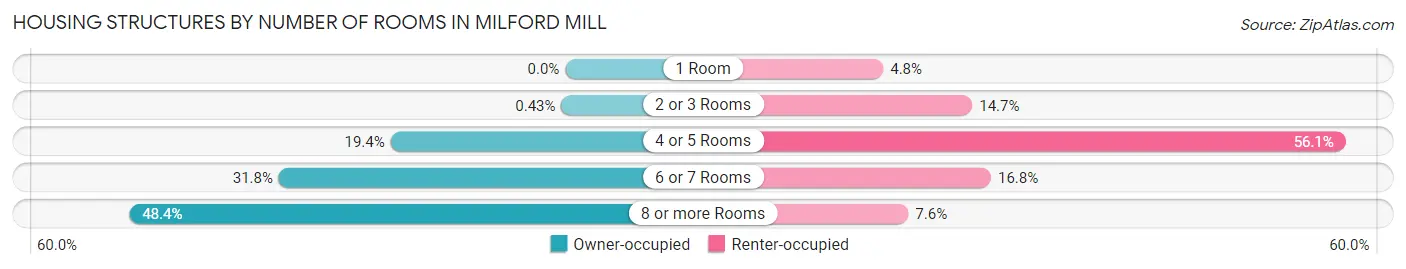
| Number of Rooms | Owner-occupied | Renter-occupied |
| 1 Room | 0 (0.0%) | 309 (4.8%) |
| 2 or 3 Rooms | 22 (0.4%) | 943 (14.7%) |
| 4 or 5 Rooms | 1,002 (19.4%) | 3,604 (56.1%) |
| 6 or 7 Rooms | 1,643 (31.8%) | 1,077 (16.8%) |
| 8 or more Rooms | 2,501 (48.4%) | 488 (7.6%) |
| Total | 5,168 (100.0%) | 6,421 (100.0%) |
Housing Structure by Heating Type in Milford Mill
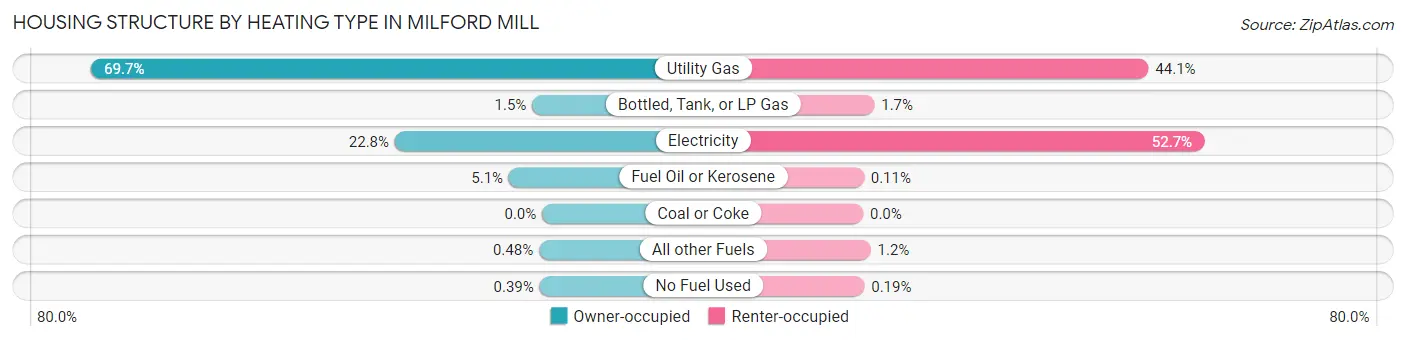
| Heating Type | Owner-occupied | Renter-occupied |
| Utility Gas | 3,603 (69.7%) | 2,832 (44.1%) |
| Bottled, Tank, or LP Gas | 79 (1.5%) | 112 (1.7%) |
| Electricity | 1,176 (22.8%) | 3,383 (52.7%) |
| Fuel Oil or Kerosene | 265 (5.1%) | 7 (0.1%) |
| Coal or Coke | 0 (0.0%) | 0 (0.0%) |
| All other Fuels | 25 (0.5%) | 75 (1.2%) |
| No Fuel Used | 20 (0.4%) | 12 (0.2%) |
| Total | 5,168 (100.0%) | 6,421 (100.0%) |
Household Vehicle Usage in Milford Mill
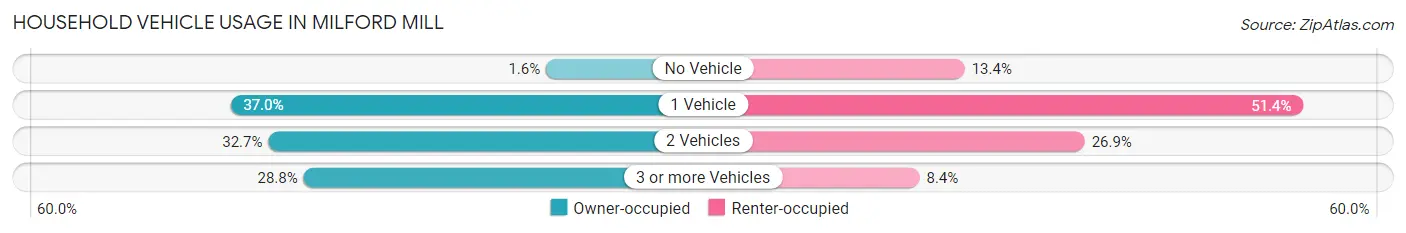
| Vehicles per Household | Owner-occupied | Renter-occupied |
| No Vehicle | 82 (1.6%) | 862 (13.4%) |
| 1 Vehicle | 1,910 (37.0%) | 3,297 (51.3%) |
| 2 Vehicles | 1,690 (32.7%) | 1,725 (26.9%) |
| 3 or more Vehicles | 1,486 (28.7%) | 537 (8.4%) |
| Total | 5,168 (100.0%) | 6,421 (100.0%) |
Real Estate & Mortgages in Milford Mill
Real Estate and Mortgage Overview in Milford Mill
| Characteristic | Without Mortgage | With Mortgage |
| Housing Units | 1,263 | 3,905 |
| Median Property Value | $243,100 | $256,100 |
| Median Household Income | $65,497 | $947 |
| Monthly Housing Costs | $718 | $239 |
| Real Estate Taxes | $2,746 | $160 |
Property Value by Mortgage Status in Milford Mill
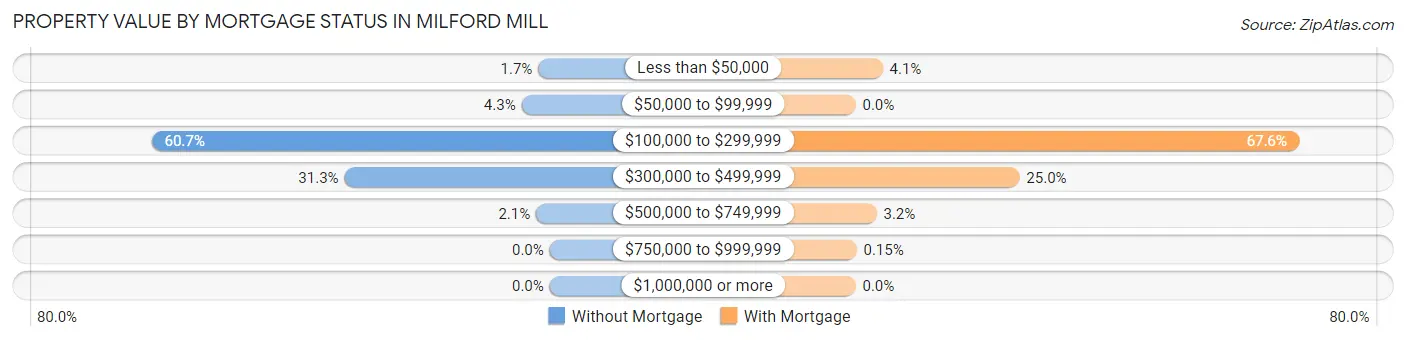
| Property Value | Without Mortgage | With Mortgage |
| Less than $50,000 | 22 (1.7%) | 161 (4.1%) |
| $50,000 to $99,999 | 54 (4.3%) | 0 (0.0%) |
| $100,000 to $299,999 | 766 (60.7%) | 2,638 (67.5%) |
| $300,000 to $499,999 | 395 (31.3%) | 975 (25.0%) |
| $500,000 to $749,999 | 26 (2.1%) | 125 (3.2%) |
| $750,000 to $999,999 | 0 (0.0%) | 6 (0.2%) |
| $1,000,000 or more | 0 (0.0%) | 0 (0.0%) |
| Total | 1,263 (100.0%) | 3,905 (100.0%) |
Household Income by Mortgage Status in Milford Mill
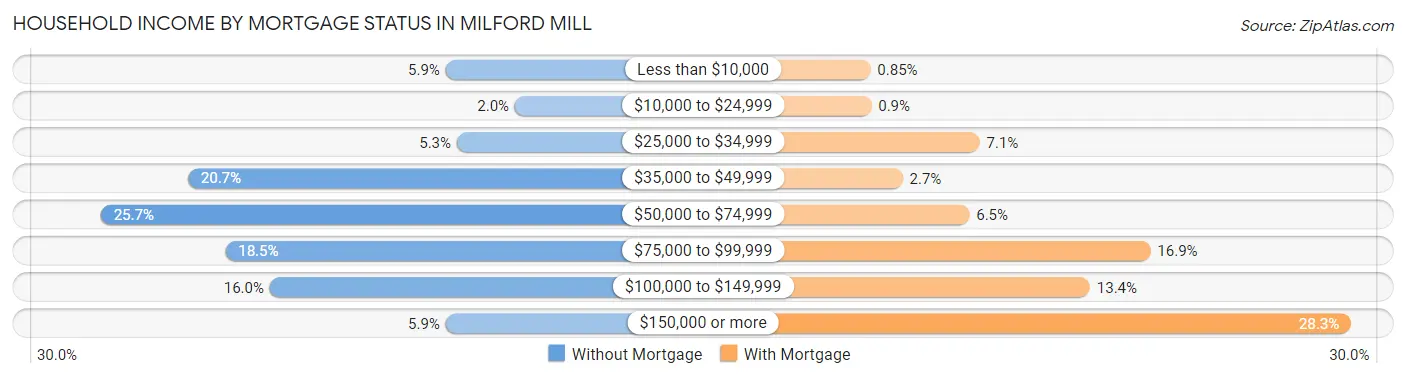
| Household Income | Without Mortgage | With Mortgage |
| Less than $10,000 | 75 (5.9%) | 33 (0.9%) |
| $10,000 to $24,999 | 25 (2.0%) | 35 (0.9%) |
| $25,000 to $34,999 | 67 (5.3%) | 277 (7.1%) |
| $35,000 to $49,999 | 261 (20.7%) | 105 (2.7%) |
| $50,000 to $74,999 | 324 (25.7%) | 254 (6.5%) |
| $75,000 to $99,999 | 234 (18.5%) | 658 (16.9%) |
| $100,000 to $149,999 | 202 (16.0%) | 523 (13.4%) |
| $150,000 or more | 75 (5.9%) | 1,106 (28.3%) |
| Total | 1,263 (100.0%) | 3,905 (100.0%) |
Property Value to Household Income Ratio in Milford Mill
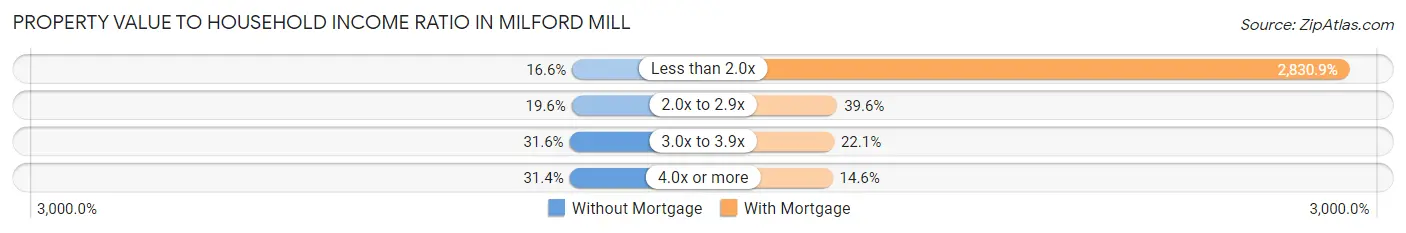
| Value-to-Income Ratio | Without Mortgage | With Mortgage |
| Less than 2.0x | 209 (16.6%) | 110,547 (2,830.9%) |
| 2.0x to 2.9x | 248 (19.6%) | 1,547 (39.6%) |
| 3.0x to 3.9x | 399 (31.6%) | 861 (22.1%) |
| 4.0x or more | 396 (31.4%) | 568 (14.5%) |
| Total | 1,263 (100.0%) | 3,905 (100.0%) |
Real Estate Taxes by Mortgage Status in Milford Mill
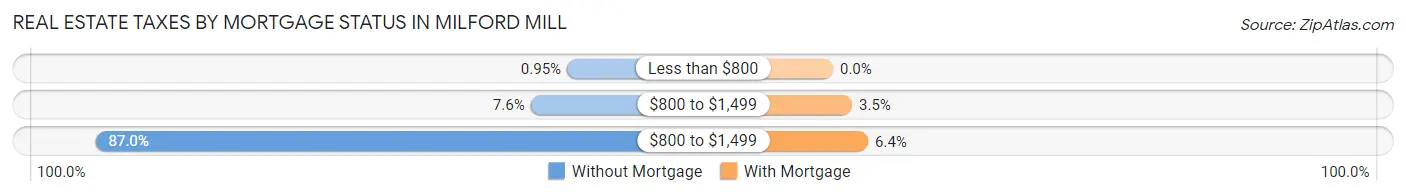
| Property Taxes | Without Mortgage | With Mortgage |
| Less than $800 | 12 (0.9%) | 0 (0.0%) |
| $800 to $1,499 | 96 (7.6%) | 136 (3.5%) |
| $800 to $1,499 | 1,099 (87.0%) | 250 (6.4%) |
| Total | 1,263 (100.0%) | 3,905 (100.0%) |
Health & Disability in Milford Mill
Health Insurance Coverage by Age in Milford Mill
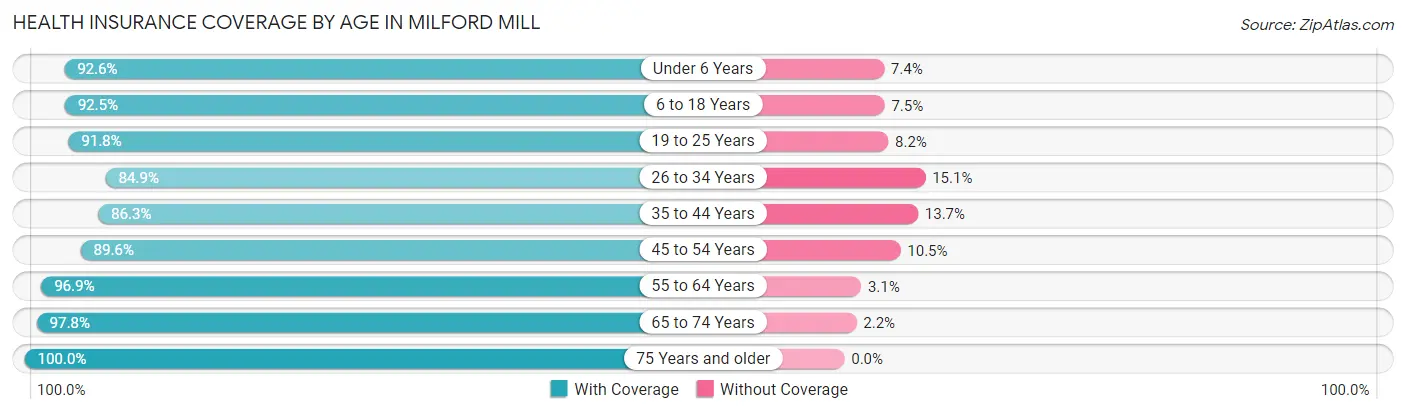
| Age Bracket | With Coverage | Without Coverage |
| Under 6 Years | 2,268 (92.6%) | 181 (7.4%) |
| 6 to 18 Years | 5,372 (92.5%) | 435 (7.5%) |
| 19 to 25 Years | 2,742 (91.8%) | 244 (8.2%) |
| 26 to 34 Years | 3,726 (84.9%) | 662 (15.1%) |
| 35 to 44 Years | 3,402 (86.3%) | 541 (13.7%) |
| 45 to 54 Years | 3,683 (89.5%) | 430 (10.4%) |
| 55 to 64 Years | 3,831 (96.9%) | 123 (3.1%) |
| 65 to 74 Years | 2,268 (97.8%) | 52 (2.2%) |
| 75 Years and older | 1,410 (100.0%) | 0 (0.0%) |
| Total | 28,702 (91.5%) | 2,668 (8.5%) |
Health Insurance Coverage by Citizenship Status in Milford Mill

| Citizenship Status | With Coverage | Without Coverage |
| Native Born | 2,268 (92.6%) | 181 (7.4%) |
| Foreign Born, Citizen | 5,372 (92.5%) | 435 (7.5%) |
| Foreign Born, not a Citizen | 2,742 (91.8%) | 244 (8.2%) |
Health Insurance Coverage by Household Income in Milford Mill
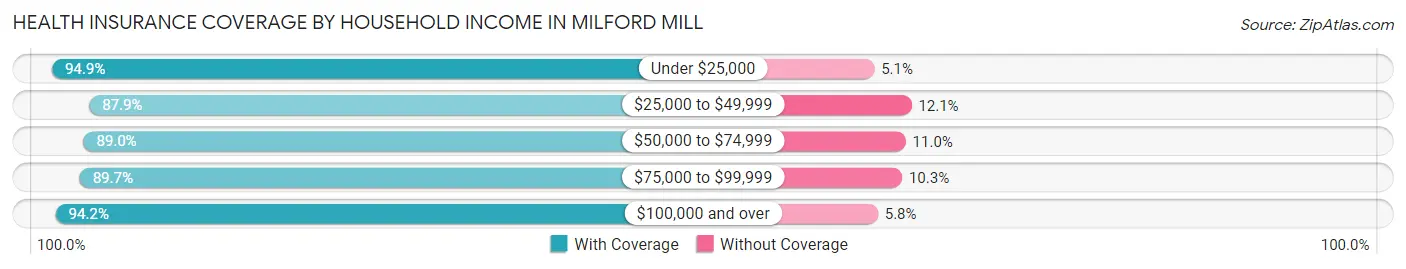
| Household Income | With Coverage | Without Coverage |
| Under $25,000 | 2,158 (94.9%) | 117 (5.1%) |
| $25,000 to $49,999 | 4,653 (87.9%) | 641 (12.1%) |
| $50,000 to $74,999 | 4,652 (89.0%) | 577 (11.0%) |
| $75,000 to $99,999 | 4,884 (89.7%) | 563 (10.3%) |
| $100,000 and over | 12,250 (94.2%) | 756 (5.8%) |
Public vs Private Health Insurance Coverage by Age in Milford Mill
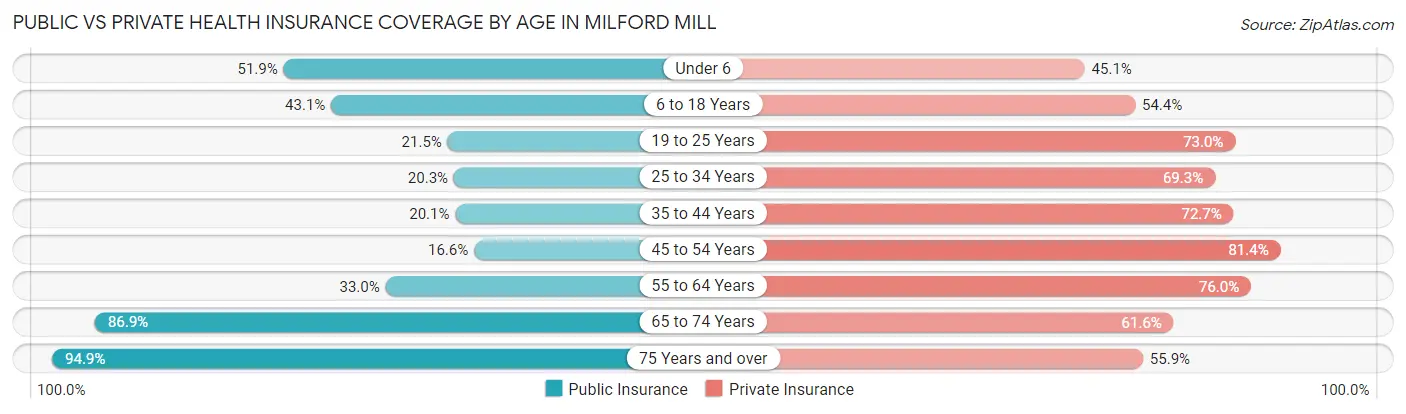
| Age Bracket | Public Insurance | Private Insurance |
| Under 6 | 1,272 (51.9%) | 1,104 (45.1%) |
| 6 to 18 Years | 2,503 (43.1%) | 3,161 (54.4%) |
| 19 to 25 Years | 641 (21.5%) | 2,180 (73.0%) |
| 25 to 34 Years | 891 (20.3%) | 3,039 (69.3%) |
| 35 to 44 Years | 791 (20.1%) | 2,867 (72.7%) |
| 45 to 54 Years | 682 (16.6%) | 3,349 (81.4%) |
| 55 to 64 Years | 1,305 (33.0%) | 3,003 (75.9%) |
| 65 to 74 Years | 2,017 (86.9%) | 1,429 (61.6%) |
| 75 Years and over | 1,338 (94.9%) | 788 (55.9%) |
| Total | 11,440 (36.5%) | 20,920 (66.7%) |
Disability Status by Sex by Age in Milford Mill
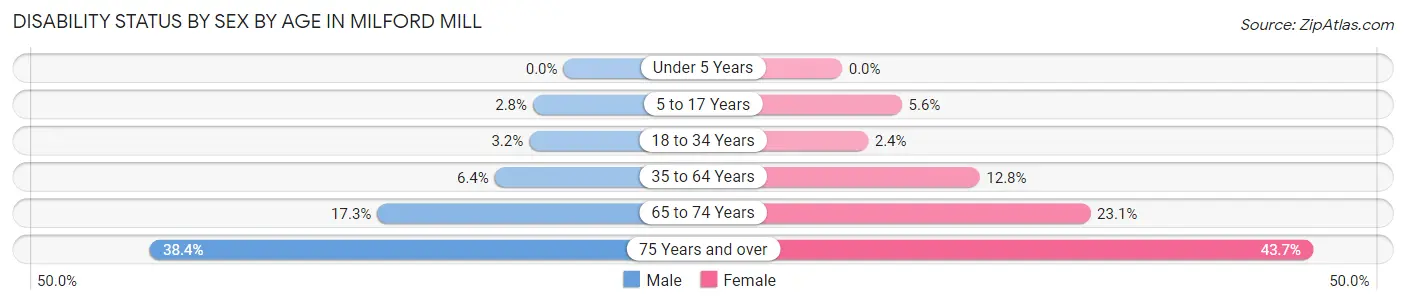
| Age Bracket | Male | Female |
| Under 5 Years | 0 (0.0%) | 0 (0.0%) |
| 5 to 17 Years | 82 (2.8%) | 162 (5.6%) |
| 18 to 34 Years | 113 (3.2%) | 100 (2.4%) |
| 35 to 64 Years | 325 (6.4%) | 883 (12.8%) |
| 65 to 74 Years | 140 (17.3%) | 348 (23.1%) |
| 75 Years and over | 181 (38.4%) | 410 (43.7%) |
Disability Class by Sex by Age in Milford Mill
Disability Class: Hearing Difficulty
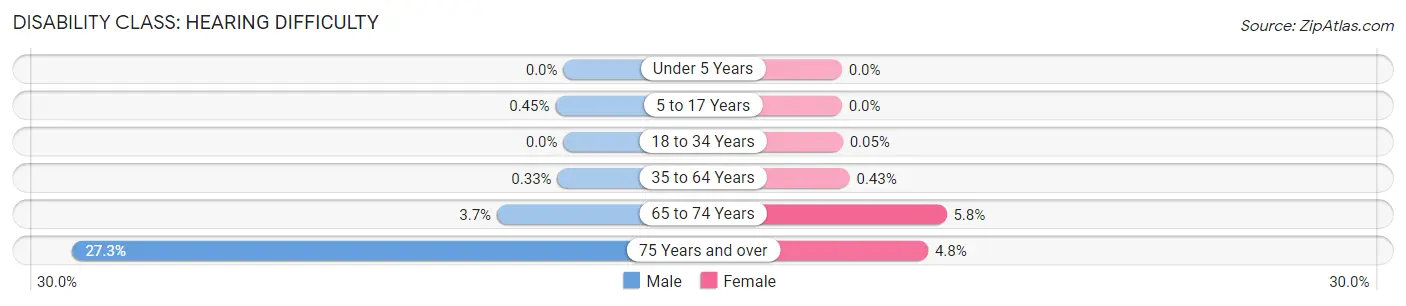
| Age Bracket | Male | Female |
| Under 5 Years | 0 (0.0%) | 0 (0.0%) |
| 5 to 17 Years | 13 (0.4%) | 0 (0.0%) |
| 18 to 34 Years | 0 (0.0%) | 2 (0.1%) |
| 35 to 64 Years | 17 (0.3%) | 30 (0.4%) |
| 65 to 74 Years | 30 (3.7%) | 88 (5.8%) |
| 75 Years and over | 129 (27.3%) | 45 (4.8%) |
Disability Class: Vision Difficulty
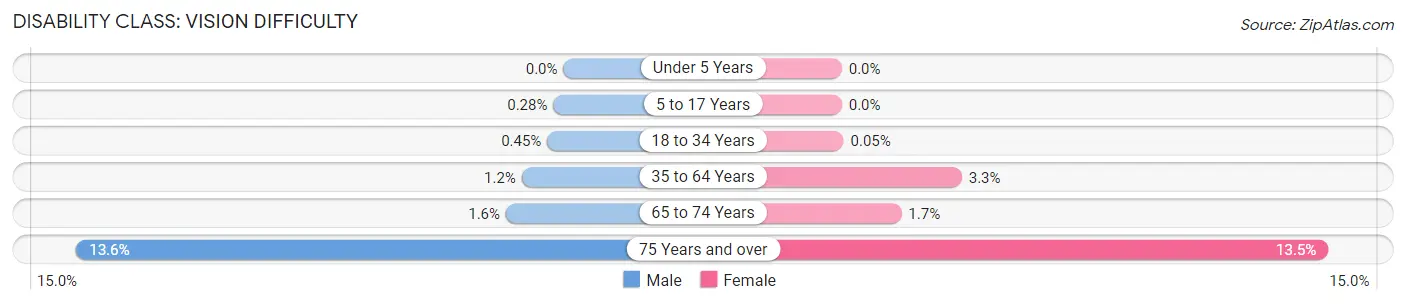
| Age Bracket | Male | Female |
| Under 5 Years | 0 (0.0%) | 0 (0.0%) |
| 5 to 17 Years | 8 (0.3%) | 0 (0.0%) |
| 18 to 34 Years | 16 (0.4%) | 2 (0.1%) |
| 35 to 64 Years | 59 (1.2%) | 231 (3.3%) |
| 65 to 74 Years | 13 (1.6%) | 25 (1.7%) |
| 75 Years and over | 64 (13.6%) | 127 (13.5%) |
Disability Class: Cognitive Difficulty
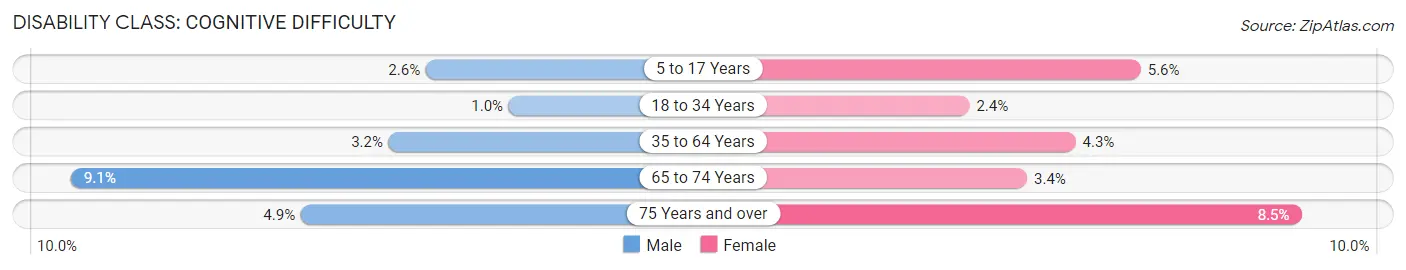
| Age Bracket | Male | Female |
| 5 to 17 Years | 74 (2.5%) | 162 (5.6%) |
| 18 to 34 Years | 36 (1.0%) | 98 (2.4%) |
| 35 to 64 Years | 165 (3.2%) | 300 (4.3%) |
| 65 to 74 Years | 74 (9.1%) | 52 (3.4%) |
| 75 Years and over | 23 (4.9%) | 80 (8.5%) |
Disability Class: Ambulatory Difficulty
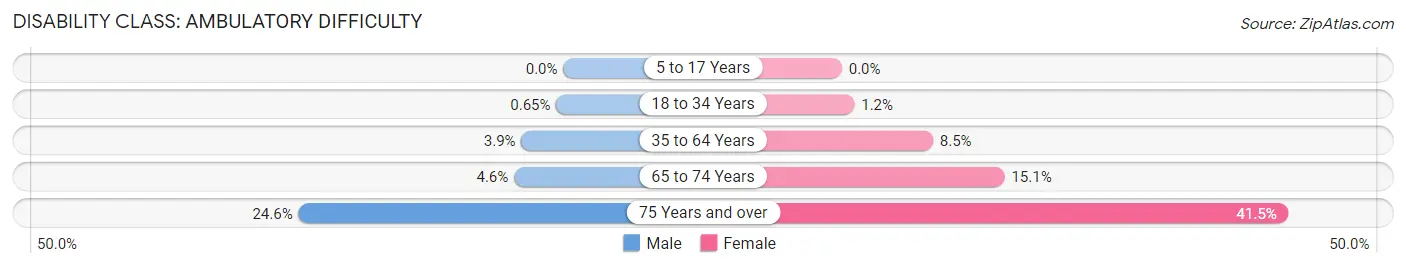
| Age Bracket | Male | Female |
| 5 to 17 Years | 0 (0.0%) | 0 (0.0%) |
| 18 to 34 Years | 23 (0.6%) | 48 (1.2%) |
| 35 to 64 Years | 198 (3.9%) | 584 (8.5%) |
| 65 to 74 Years | 37 (4.6%) | 228 (15.1%) |
| 75 Years and over | 116 (24.6%) | 389 (41.5%) |
Disability Class: Self-Care Difficulty
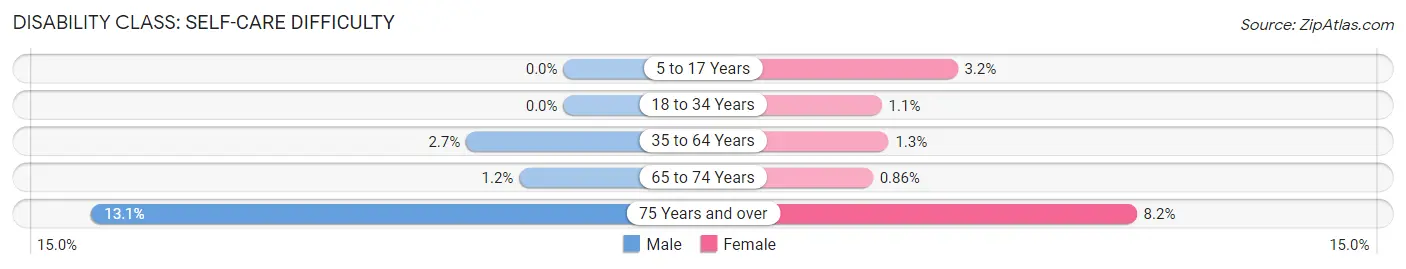
| Age Bracket | Male | Female |
| 5 to 17 Years | 0 (0.0%) | 94 (3.2%) |
| 18 to 34 Years | 0 (0.0%) | 46 (1.1%) |
| 35 to 64 Years | 138 (2.7%) | 90 (1.3%) |
| 65 to 74 Years | 10 (1.2%) | 13 (0.9%) |
| 75 Years and over | 62 (13.1%) | 77 (8.2%) |
Technology Access in Milford Mill
Computing Device Access in Milford Mill
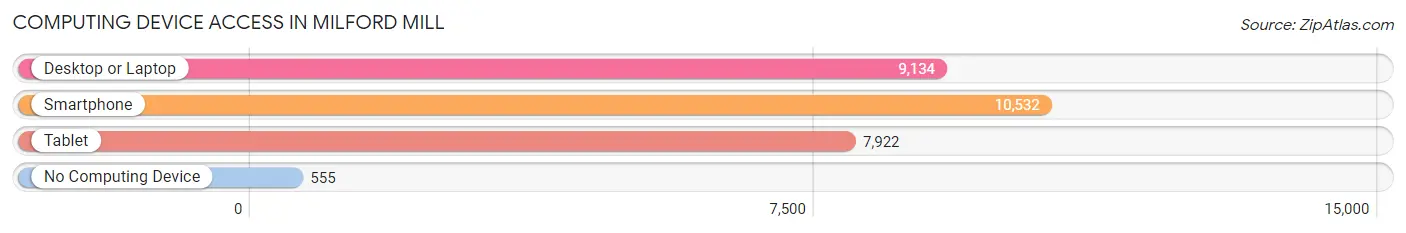
| Device Type | # Households | % Households |
| Desktop or Laptop | 9,134 | 78.8% |
| Smartphone | 10,532 | 90.9% |
| Tablet | 7,922 | 68.4% |
| No Computing Device | 555 | 4.8% |
| Total | 11,589 | 100.0% |
Internet Access in Milford Mill
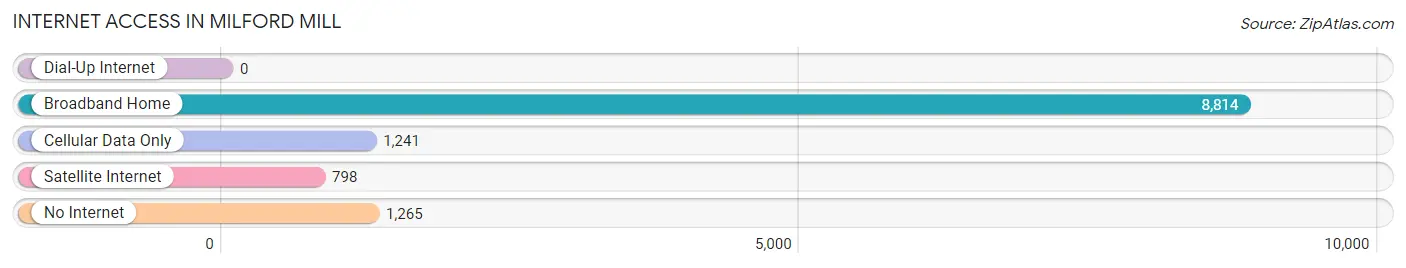
| Internet Type | # Households | % Households |
| Dial-Up Internet | 0 | 0.0% |
| Broadband Home | 8,814 | 76.0% |
| Cellular Data Only | 1,241 | 10.7% |
| Satellite Internet | 798 | 6.9% |
| No Internet | 1,265 | 10.9% |
| Total | 11,589 | 100.0% |
Milford Mill Summary
Milford Mill is a census-designated place (CDP) located in Baltimore County, Maryland, United States. The population was 8,945 at the 2010 census. It is located in the western part of the county, near the city of Baltimore.
Geography
Milford Mill is located at 39 19 45 North 76 45 45 West 39 329167 76 762500
According to the United States Census Bureau, the CDP has a total area of 2.3 square miles (6.0 km2), all of it land.
History
Milford Mill was first settled in the early 19th century by the Milford family, who owned a large mill on the site. The mill was destroyed by fire in 1871, but the family rebuilt it and continued to operate it until the early 20th century. The area was then developed as a residential community, with the first homes being built in the 1920s.
The area was officially designated as a CDP in the 1990 census
Demographics
As of the census of 2000, there were 8,945 people, 3,093 households, and 2,092 families residing in the CDP. The population density was 3,902.3 people per square mile (1,504.2/km2). There were 3,213 housing units at an average density of 1,395.3/sq mi (538.7/km2). The racial makeup of the CDP was 57.45% African American, 37.45% White, 0.37% Native American, 1.45% Asian, 0.05% Pacific Islander, 1.45% from other races, and 2.27% from two or more races. Hispanic or Latino of any race were 2.45% of the population.
There were 3,093 households, out of which 33.2% had children under the age of 18 living with them, 37.2% were married couples living together, 24.2% had a female householder with no husband present, and 32.2% were non-families. 26.2% of all households were made up of individuals, and 8.2% had someone living alone who was 65 years of age or older. The average household size was 2.86 and the average family size was 3.45.
In the CDP, the population was spread out, with 28.2% under the age of 18, 8.7% from 18 to 24, 30.2% from 25 to 44, 21.7% from 45 to 64, and 11.2% who were 65 years of age or older. The median age was 34 years. For every 100 females, there were 87.2 males. For every 100 females age 18 and over, there were 81.2 males.
The median income for a household in the CDP was $41,944, and the median income for a family was $45,938. Males had a median income of $35,938 versus $30,938 for females. The per capita income for the CDP was $17,938. About 8.2% of families and 10.2% of the population were below the poverty line, including 14.2% of those under age 18 and 8.2% of those age 65 or over.
Economy
Milford Mill is home to a variety of businesses, including retail stores, restaurants, and professional services. The area is also home to a number of industrial and manufacturing businesses.
The area is served by the Milford Mill Metro Station, which provides access to the Baltimore Metro Subway system. The station is located on the northwest corner of the intersection of Liberty Road and Milford Mill Road.
The area is also served by the Milford Mill Shopping Center, which is located on the northeast corner of the intersection of Liberty Road and Milford Mill Road. The shopping center includes a variety of stores, including a grocery store, a pharmacy, a bank, and a variety of other retail stores.
The area is also served by the Milford Mill Library, which is located on the southwest corner of the intersection of Liberty Road and Milford Mill Road. The library offers a variety of services, including books, magazines, newspapers, and other media.
Common Questions
What is Per Capita Income in Milford Mill?
Per Capita income in Milford Mill is $33,836.
What is the Median Family Income in Milford Mill?
Median Family Income in Milford Mill is $85,375.
What is the Median Household income in Milford Mill?
Median Household Income in Milford Mill is $71,846.
What is Income or Wage Gap in Milford Mill?
Income or Wage Gap in Milford Mill is 3.5%.
Women in Milford Mill earn 96.5 cents for every dollar earned by a man.
What is Inequality or Gini Index in Milford Mill?
Inequality or Gini Index in Milford Mill is 0.39.
What is the Total Population of Milford Mill?
Total Population of Milford Mill is 31,513.
What is the Total Male Population of Milford Mill?
Total Male Population of Milford Mill is 14,068.
What is the Total Female Population of Milford Mill?
Total Female Population of Milford Mill is 17,445.
What is the Ratio of Males per 100 Females in Milford Mill?
There are 80.64 Males per 100 Females in Milford Mill.
What is the Ratio of Females per 100 Males in Milford Mill?
There are 124.00 Females per 100 Males in Milford Mill.
What is the Median Population Age in Milford Mill?
Median Population Age in Milford Mill is 35.2 Years.
What is the Average Family Size in Milford Mill
Average Family Size in Milford Mill is 3.5 People.
What is the Average Household Size in Milford Mill
Average Household Size in Milford Mill is 2.7 People.
How Large is the Labor Force in Milford Mill?
There are 18,387 People in the Labor Forcein in Milford Mill.
What is the Percentage of People in the Labor Force in Milford Mill?
75.1% of People are in the Labor Force in Milford Mill.
What is the Unemployment Rate in Milford Mill?
Unemployment Rate in Milford Mill is 7.1%.