Marlow Heights, MD Map & Demographics
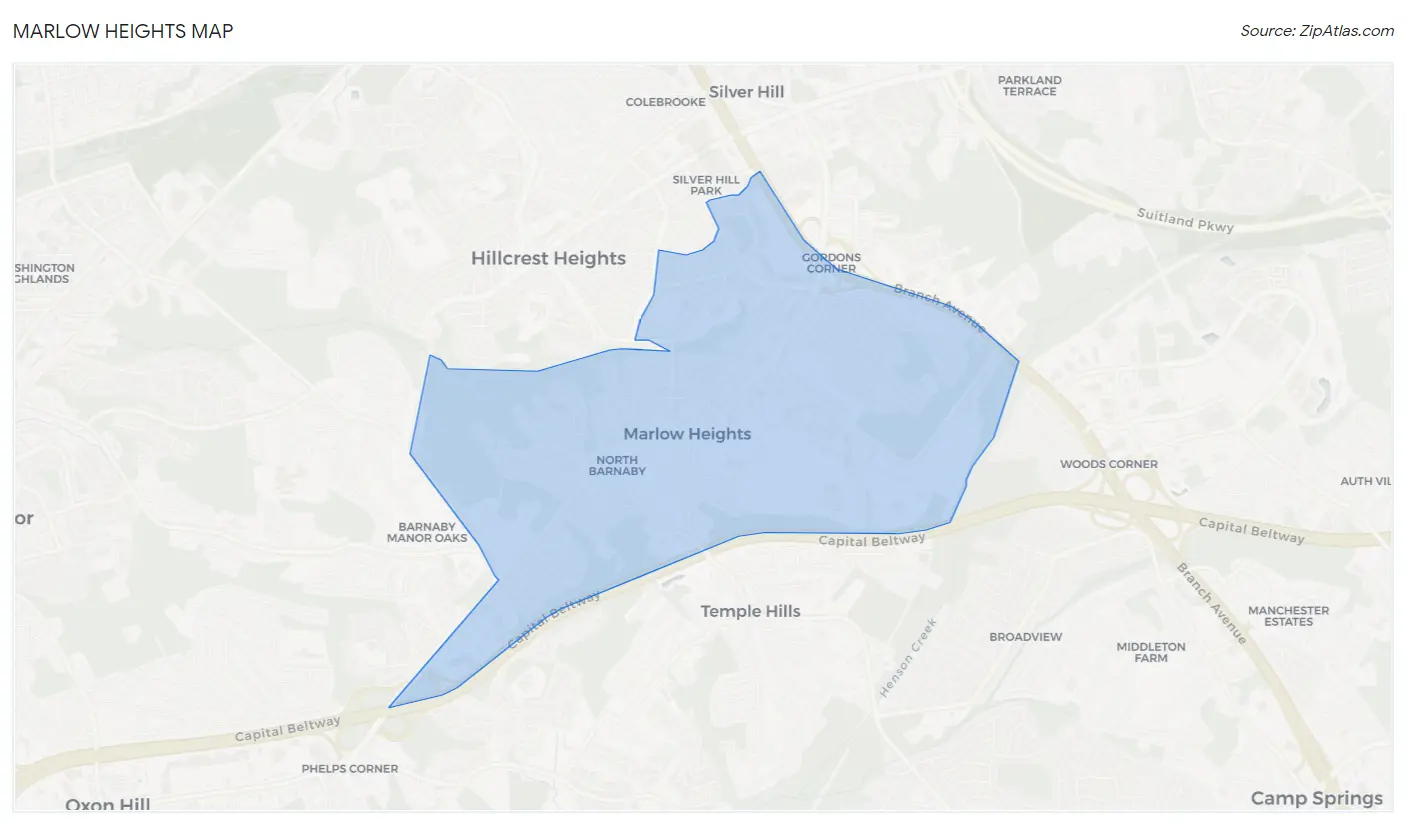
Marlow Heights Map
Marlow Heights Overview
$37,130
PER CAPITA INCOME
$81,250
AVG FAMILY INCOME
$60,361
AVG HOUSEHOLD INCOME
17.8%
WAGE / INCOME GAP [ % ]
82.2¢/ $1
WAGE / INCOME GAP [ $ ]
$5,724
FAMILY INCOME DEFICIT
0.43
INEQUALITY / GINI INDEX
6,254
TOTAL POPULATION
3,000
MALE POPULATION
3,254
FEMALE POPULATION
92.19
MALES / 100 FEMALES
108.47
FEMALES / 100 MALES
40.1
MEDIAN AGE
3.1
AVG FAMILY SIZE
2.4
AVG HOUSEHOLD SIZE
3,362
LABOR FORCE [ PEOPLE ]
66.5%
PERCENT IN LABOR FORCE
12.9%
UNEMPLOYMENT RATE
Income in Marlow Heights
Income Overview in Marlow Heights
Per Capita Income in Marlow Heights is $37,130, while median incomes of families and households are $81,250 and $60,361 respectively.
| Characteristic | Number | Measure |
| Per Capita Income | 6,254 | $37,130 |
| Median Family Income | 1,575 | $81,250 |
| Mean Family Income | 1,575 | $100,257 |
| Median Household Income | 2,619 | $60,361 |
| Mean Household Income | 2,619 | $85,690 |
| Income Deficit | 1,575 | $5,724 |
| Wage / Income Gap (%) | 6,254 | 17.83% |
| Wage / Income Gap ($) | 6,254 | 82.17¢ per $1 |
| Gini / Inequality Index | 6,254 | 0.43 |
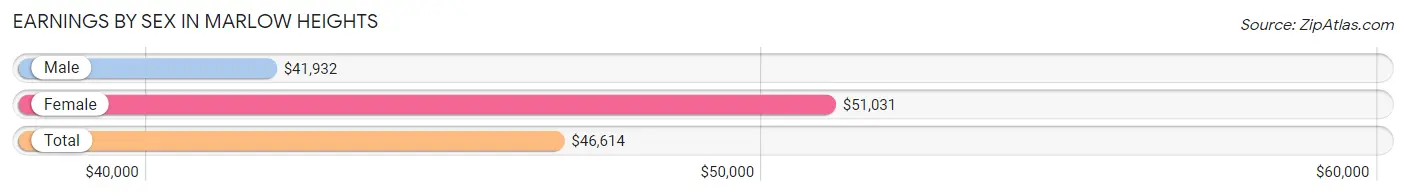
Earnings by Sex in Marlow Heights
Average Earnings in Marlow Heights are $46,614, $41,932 for men and $51,031 for women, a difference of 17.8%.
| Sex | Number | Average Earnings |
| Male | 1,362 (41.9%) | $41,932 |
| Female | 1,888 (58.1%) | $51,031 |
| Total | 3,250 (100.0%) | $46,614 |
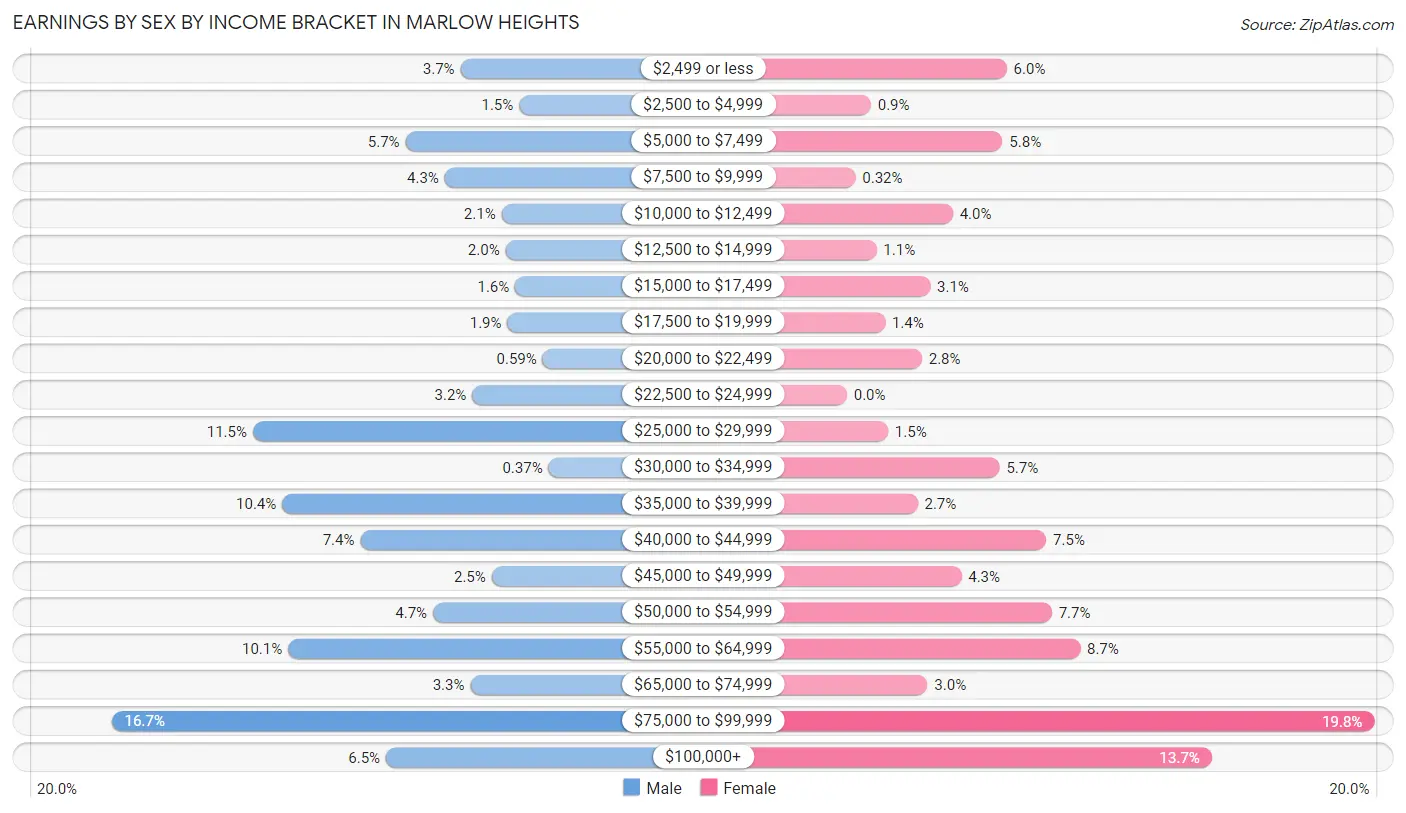
Earnings by Sex by Income Bracket in Marlow Heights
The most common earnings brackets in Marlow Heights are $75,000 to $99,999 for men (228 | 16.7%) and $75,000 to $99,999 for women (373 | 19.8%).
| Income | Male | Female |
| $2,499 or less | 50 (3.7%) | 113 (6.0%) |
| $2,500 to $4,999 | 20 (1.5%) | 17 (0.9%) |
| $5,000 to $7,499 | 78 (5.7%) | 110 (5.8%) |
| $7,500 to $9,999 | 58 (4.3%) | 6 (0.3%) |
| $10,000 to $12,499 | 29 (2.1%) | 75 (4.0%) |
| $12,500 to $14,999 | 27 (2.0%) | 21 (1.1%) |
| $15,000 to $17,499 | 22 (1.6%) | 59 (3.1%) |
| $17,500 to $19,999 | 26 (1.9%) | 27 (1.4%) |
| $20,000 to $22,499 | 8 (0.6%) | 53 (2.8%) |
| $22,500 to $24,999 | 44 (3.2%) | 0 (0.0%) |
| $25,000 to $29,999 | 156 (11.5%) | 29 (1.5%) |
| $30,000 to $34,999 | 5 (0.4%) | 108 (5.7%) |
| $35,000 to $39,999 | 141 (10.3%) | 50 (2.6%) |
| $40,000 to $44,999 | 101 (7.4%) | 141 (7.5%) |
| $45,000 to $49,999 | 34 (2.5%) | 81 (4.3%) |
| $50,000 to $54,999 | 64 (4.7%) | 145 (7.7%) |
| $55,000 to $64,999 | 138 (10.1%) | 165 (8.7%) |
| $65,000 to $74,999 | 45 (3.3%) | 57 (3.0%) |
| $75,000 to $99,999 | 228 (16.7%) | 373 (19.8%) |
| $100,000+ | 88 (6.5%) | 258 (13.7%) |
| Total | 1,362 (100.0%) | 1,888 (100.0%) |
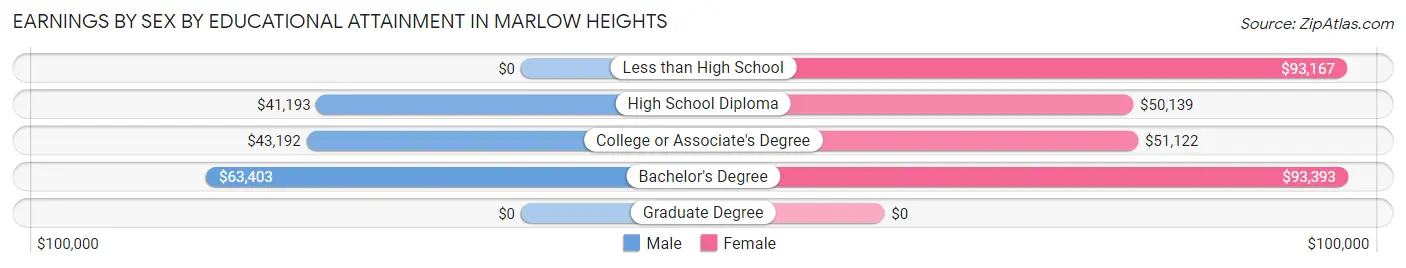
Earnings by Sex by Educational Attainment in Marlow Heights
Average earnings in Marlow Heights are $43,560 for men and $52,443 for women, a difference of 16.9%. Men with an educational attainment of bachelor's degree enjoy the highest average annual earnings of $63,403, while those with high school diploma education earn the least with $41,193. Women with an educational attainment of bachelor's degree earn the most with the average annual earnings of $93,393, while those with high school diploma education have the smallest earnings of $50,139.
| Educational Attainment | Male Income | Female Income |
| Less than High School | - | - |
| High School Diploma | $41,193 | $50,139 |
| College or Associate's Degree | $43,192 | $51,122 |
| Bachelor's Degree | $63,403 | $93,393 |
| Graduate Degree | - | - |
| Total | $43,560 | $52,443 |
Family Income in Marlow Heights
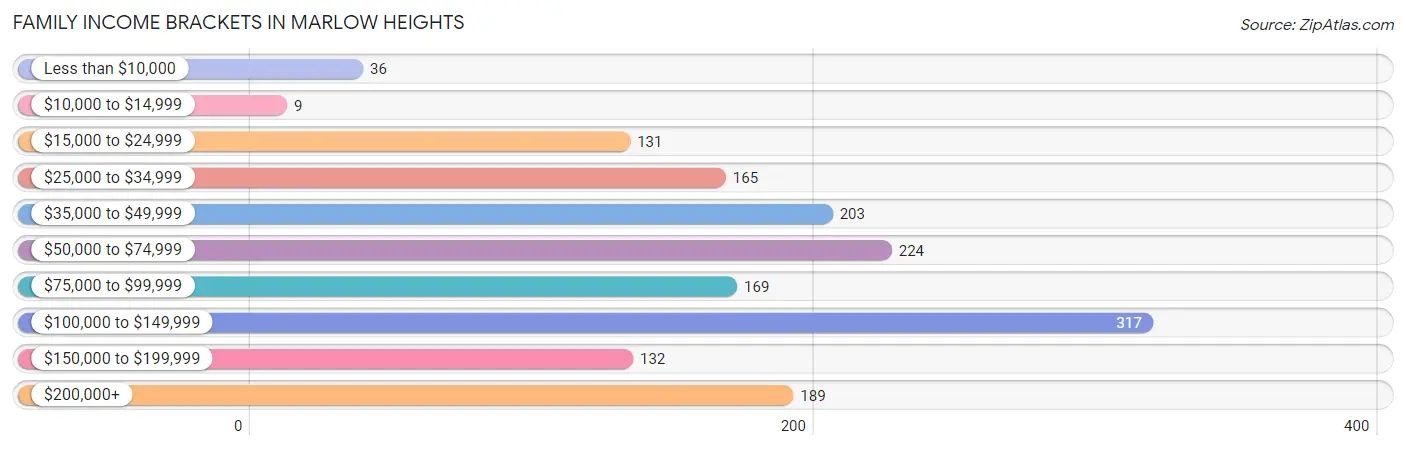
Family Income Brackets in Marlow Heights
According to the Marlow Heights family income data, there are 317 families falling into the $100,000 to $149,999 income range, which is the most common income bracket and makes up 20.1% of all families. Conversely, the $10,000 to $14,999 income bracket is the least frequent group with only 9 families (0.6%) belonging to this category.
| Income Bracket | # Families | % Families |
| Less than $10,000 | 36 | 2.3% |
| $10,000 to $14,999 | 9 | 0.6% |
| $15,000 to $24,999 | 131 | 8.3% |
| $25,000 to $34,999 | 165 | 10.5% |
| $35,000 to $49,999 | 203 | 12.9% |
| $50,000 to $74,999 | 224 | 14.2% |
| $75,000 to $99,999 | 169 | 10.7% |
| $100,000 to $149,999 | 317 | 20.1% |
| $150,000 to $199,999 | 132 | 8.4% |
| $200,000+ | 189 | 12.0% |
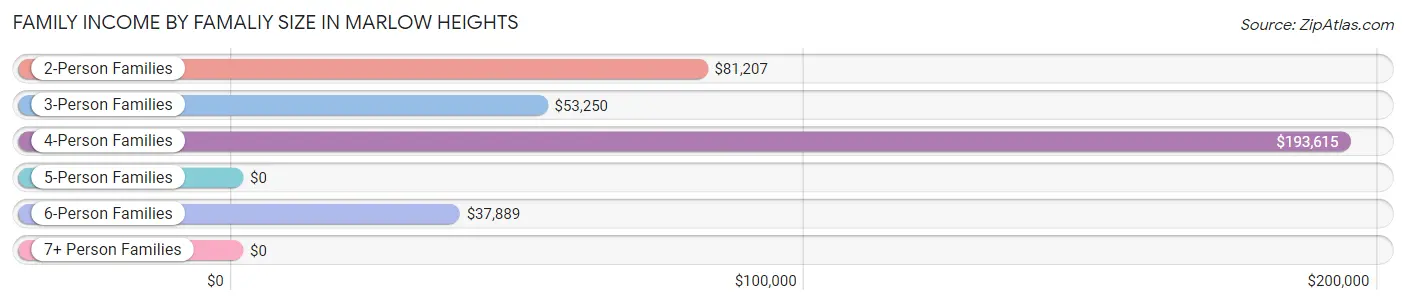
Family Income by Famaliy Size in Marlow Heights
4-person families (181 | 11.5%) account for the highest median family income in Marlow Heights with $193,615 per family, while 4-person families (181 | 11.5%) have the highest median income of $48,404 per family member.
| Income Bracket | # Families | Median Income |
| 2-Person Families | 818 (51.9%) | $81,207 |
| 3-Person Families | 381 (24.2%) | $53,250 |
| 4-Person Families | 181 (11.5%) | $193,615 |
| 5-Person Families | 82 (5.2%) | $0 |
| 6-Person Families | 108 (6.9%) | $37,889 |
| 7+ Person Families | 5 (0.3%) | $0 |
| Total | 1,575 (100.0%) | $81,250 |
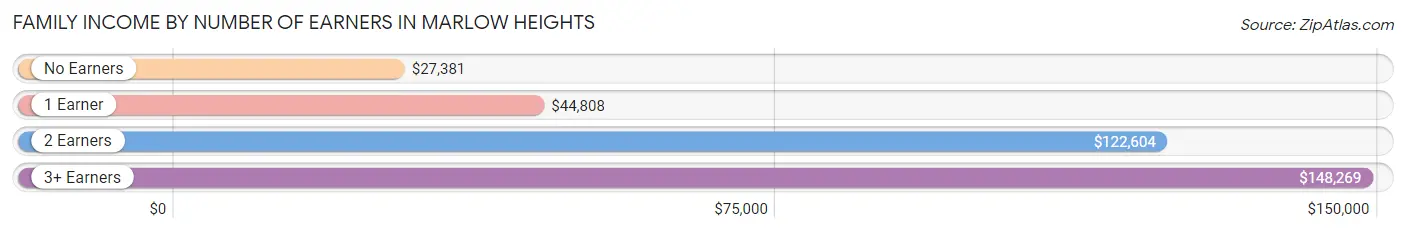
Family Income by Number of Earners in Marlow Heights
The median family income in Marlow Heights is $81,250, with families comprising 3+ earners (232) having the highest median family income of $148,269, while families with no earners (262) have the lowest median family income of $27,381, accounting for 14.7% and 16.6% of families, respectively.
| Number of Earners | # Families | Median Income |
| No Earners | 262 (16.6%) | $27,381 |
| 1 Earner | 614 (39.0%) | $44,808 |
| 2 Earners | 467 (29.6%) | $122,604 |
| 3+ Earners | 232 (14.7%) | $148,269 |
| Total | 1,575 (100.0%) | $81,250 |
Household Income in Marlow Heights
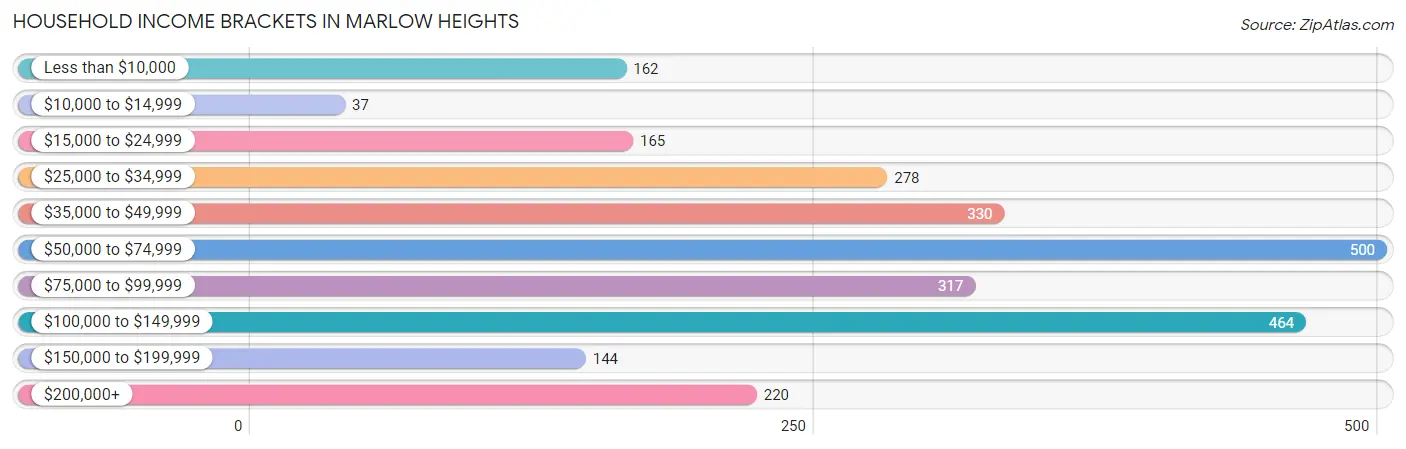
Household Income Brackets in Marlow Heights
With 500 households falling in the category, the $50,000 to $74,999 income range is the most frequent in Marlow Heights, accounting for 19.1% of all households. In contrast, only 37 households (1.4%) fall into the $10,000 to $14,999 income bracket, making it the least populous group.
| Income Bracket | # Households | % Households |
| Less than $10,000 | 162 | 6.2% |
| $10,000 to $14,999 | 37 | 1.4% |
| $15,000 to $24,999 | 165 | 6.3% |
| $25,000 to $34,999 | 278 | 10.6% |
| $35,000 to $49,999 | 330 | 12.6% |
| $50,000 to $74,999 | 500 | 19.1% |
| $75,000 to $99,999 | 317 | 12.1% |
| $100,000 to $149,999 | 464 | 17.7% |
| $150,000 to $199,999 | 144 | 5.5% |
| $200,000+ | 220 | 8.4% |
Household Income by Householder Age in Marlow Heights
The median household income in Marlow Heights is $60,361, with the highest median household income of $96,250 found in the 45 to 64 years age bracket for the primary householder. A total of 974 households (37.2%) fall into this category. Meanwhile, the 15 to 24 years age bracket for the primary householder has the lowest median household income of $0, with 126 households (4.8%) in this group.
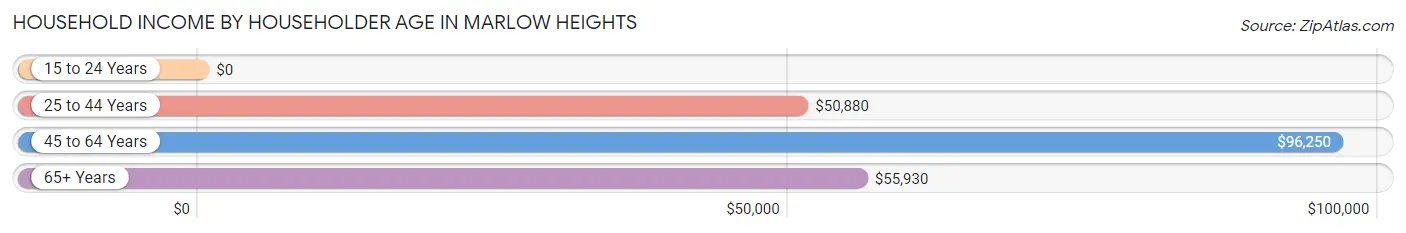
| Income Bracket | # Households | Median Income |
| 15 to 24 Years | 126 (4.8%) | $0 |
| 25 to 44 Years | 767 (29.3%) | $50,880 |
| 45 to 64 Years | 974 (37.2%) | $96,250 |
| 65+ Years | 752 (28.7%) | $55,930 |
| Total | 2,619 (100.0%) | $60,361 |
Poverty in Marlow Heights
Income Below Poverty by Sex and Age in Marlow Heights
With 25.1% poverty level for males and 22.7% for females among the residents of Marlow Heights, 12 to 14 year old males and 6 to 11 year old females are the most vulnerable to poverty, with 202 males (75.1%) and 171 females (80.3%) in their respective age groups living below the poverty level.
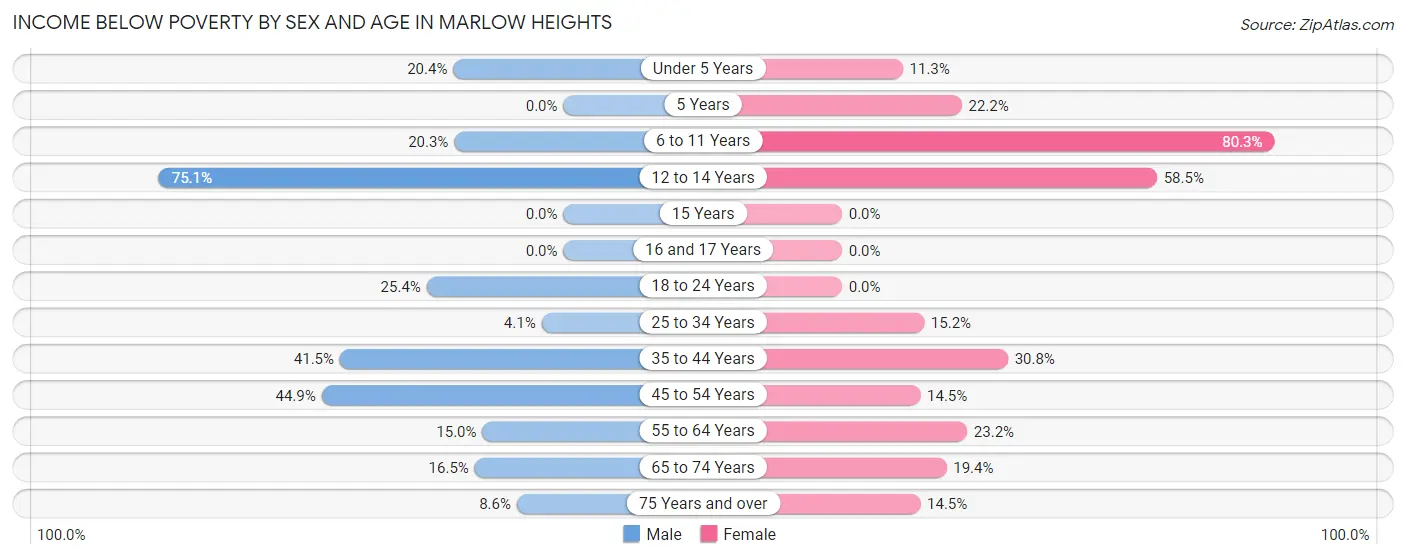
| Age Bracket | Male | Female |
| Under 5 Years | 65 (20.4%) | 7 (11.3%) |
| 5 Years | 0 (0.0%) | 6 (22.2%) |
| 6 to 11 Years | 47 (20.3%) | 171 (80.3%) |
| 12 to 14 Years | 202 (75.1%) | 38 (58.5%) |
| 15 Years | 0 (0.0%) | 0 (0.0%) |
| 16 and 17 Years | 0 (0.0%) | 0 (0.0%) |
| 18 to 24 Years | 34 (25.4%) | 0 (0.0%) |
| 25 to 34 Years | 26 (4.1%) | 73 (15.2%) |
| 35 to 44 Years | 151 (41.5%) | 141 (30.8%) |
| 45 to 54 Years | 127 (44.9%) | 89 (14.5%) |
| 55 to 64 Years | 49 (15.0%) | 101 (23.2%) |
| 65 to 74 Years | 39 (16.5%) | 64 (19.4%) |
| 75 Years and over | 14 (8.6%) | 49 (14.5%) |
| Total | 754 (25.1%) | 739 (22.7%) |
Income Above Poverty by Sex and Age in Marlow Heights
According to the poverty statistics in Marlow Heights, males aged 5 years and females aged 16 and 17 years are the age groups that are most secure financially, with 100.0% of males and 100.0% of females in these age groups living above the poverty line.
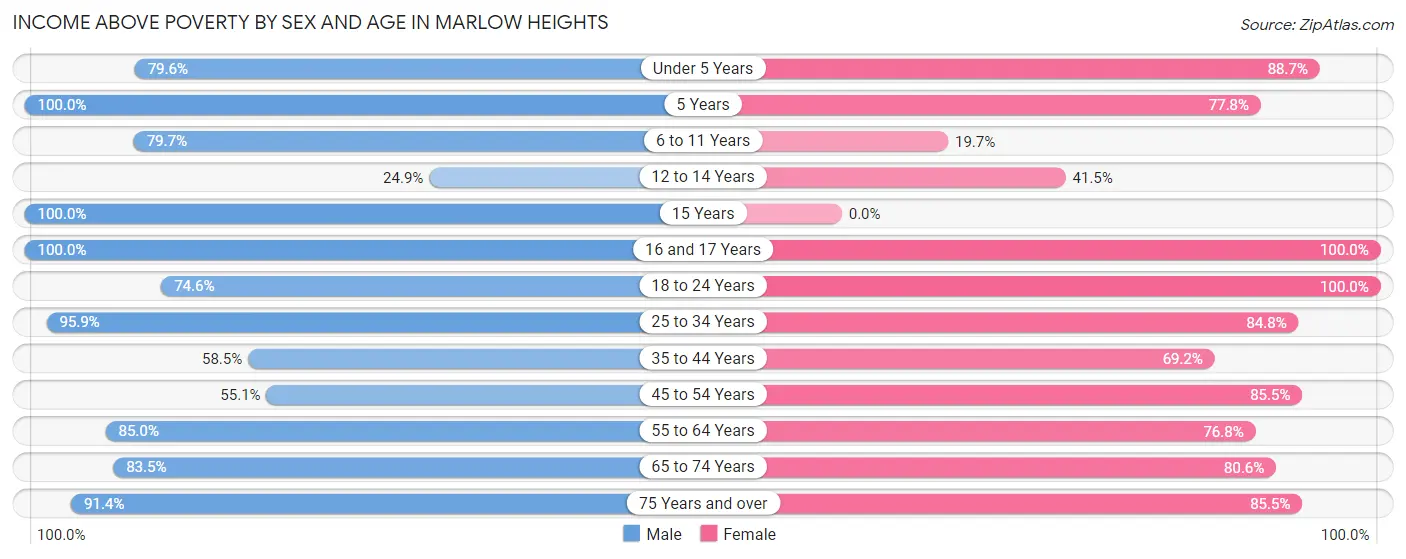
| Age Bracket | Male | Female |
| Under 5 Years | 253 (79.6%) | 55 (88.7%) |
| 5 Years | 7 (100.0%) | 21 (77.8%) |
| 6 to 11 Years | 185 (79.7%) | 42 (19.7%) |
| 12 to 14 Years | 67 (24.9%) | 27 (41.5%) |
| 15 Years | 6 (100.0%) | 0 (0.0%) |
| 16 and 17 Years | 22 (100.0%) | 30 (100.0%) |
| 18 to 24 Years | 100 (74.6%) | 206 (100.0%) |
| 25 to 34 Years | 614 (95.9%) | 406 (84.8%) |
| 35 to 44 Years | 213 (58.5%) | 317 (69.2%) |
| 45 to 54 Years | 156 (55.1%) | 523 (85.5%) |
| 55 to 64 Years | 277 (85.0%) | 334 (76.8%) |
| 65 to 74 Years | 198 (83.5%) | 266 (80.6%) |
| 75 Years and over | 148 (91.4%) | 288 (85.5%) |
| Total | 2,246 (74.9%) | 2,515 (77.3%) |
Income Below Poverty Among Married-Couple Families in Marlow Heights
The poverty statistics for married-couple families in Marlow Heights show that 14.2% or 113 of the total 793 families live below the poverty line. Families with 1 or 2 children have the highest poverty rate of 46.4%, comprising of 103 families. On the other hand, families with 3 or 4 children have the lowest poverty rate of 0.0%, which includes 0 families.
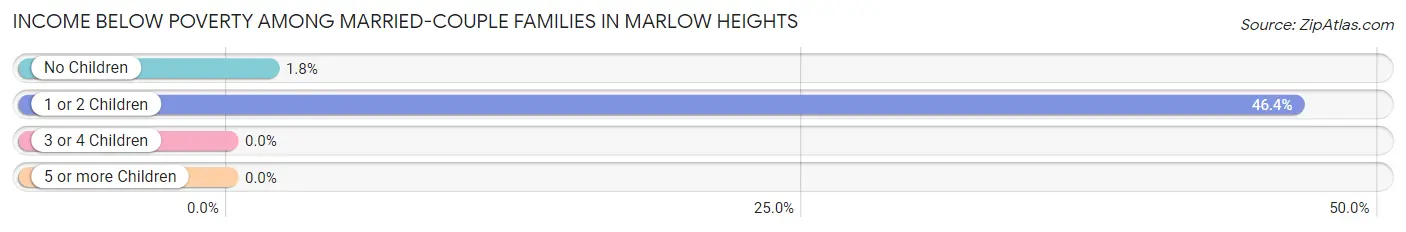
| Children | Above Poverty | Below Poverty |
| No Children | 551 (98.2%) | 10 (1.8%) |
| 1 or 2 Children | 119 (53.6%) | 103 (46.4%) |
| 3 or 4 Children | 10 (100.0%) | 0 (0.0%) |
| 5 or more Children | 0 (0.0%) | 0 (0.0%) |
| Total | 680 (85.8%) | 113 (14.2%) |
Income Below Poverty Among Single-Parent Households in Marlow Heights
According to the poverty data in Marlow Heights, 32.2% or 68 single-father households and 11.0% or 63 single-mother households are living below the poverty line. Among single-father households, those with 5 or more children have the highest poverty rate, with 41 households (100.0%) experiencing poverty. Likewise, among single-mother households, those with 1 or 2 children have the highest poverty rate, with 59 households (18.1%) falling below the poverty line.
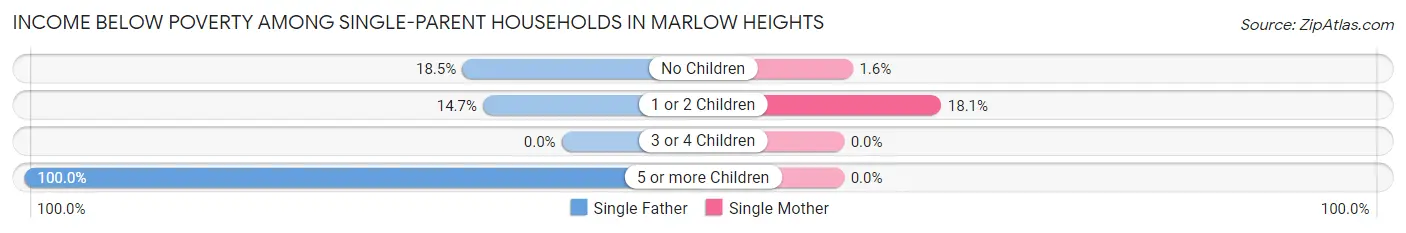
| Children | Single Father | Single Mother |
| No Children | 10 (18.5%) | 4 (1.6%) |
| 1 or 2 Children | 17 (14.7%) | 59 (18.1%) |
| 3 or 4 Children | 0 (0.0%) | 0 (0.0%) |
| 5 or more Children | 41 (100.0%) | 0 (0.0%) |
| Total | 68 (32.2%) | 63 (11.0%) |
Income Below Poverty Among Married-Couple vs Single-Parent Households in Marlow Heights
The poverty data for Marlow Heights shows that 113 of the married-couple family households (14.2%) and 131 of the single-parent households (16.8%) are living below the poverty level. Within the married-couple family households, those with 1 or 2 children have the highest poverty rate, with 103 households (46.4%) falling below the poverty line. Among the single-parent households, those with 5 or more children have the highest poverty rate, with 41 household (100.0%) living below poverty.
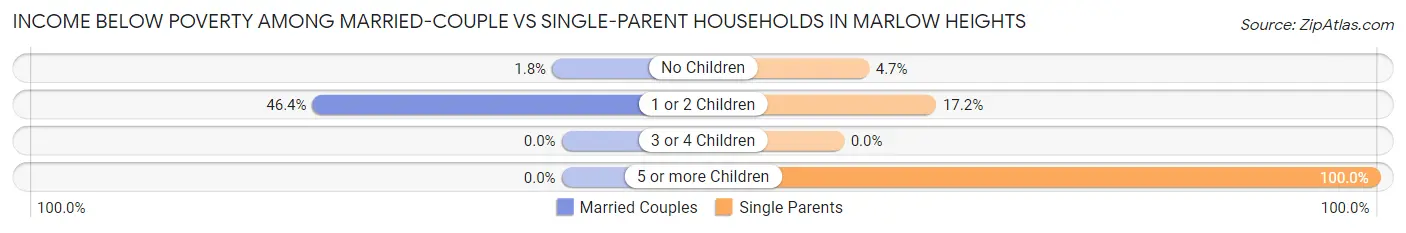
| Children | Married-Couple Families | Single-Parent Households |
| No Children | 10 (1.8%) | 14 (4.7%) |
| 1 or 2 Children | 103 (46.4%) | 76 (17.2%) |
| 3 or 4 Children | 0 (0.0%) | 0 (0.0%) |
| 5 or more Children | 0 (0.0%) | 41 (100.0%) |
| Total | 113 (14.2%) | 131 (16.8%) |
Race in Marlow Heights
The most populous races in Marlow Heights are Black / African American (5,301 | 84.8%), Hispanic or Latino (419 | 6.7%), and Some other Race (335 | 5.4%).
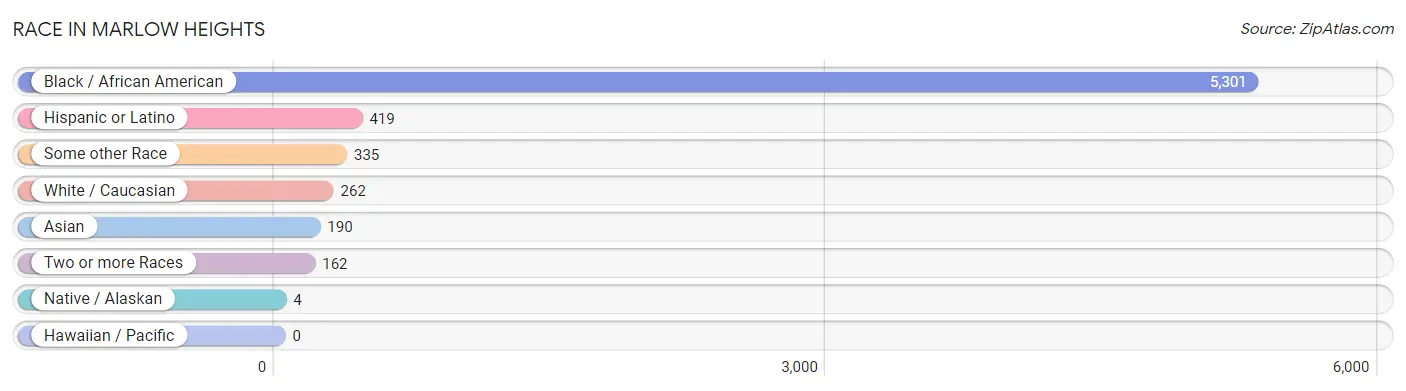
| Race | # Population | % Population |
| Asian | 190 | 3.0% |
| Black / African American | 5,301 | 84.8% |
| Hawaiian / Pacific | 0 | 0.0% |
| Hispanic or Latino | 419 | 6.7% |
| Native / Alaskan | 4 | 0.1% |
| White / Caucasian | 262 | 4.2% |
| Two or more Races | 162 | 2.6% |
| Some other Race | 335 | 5.4% |
| Total | 6,254 | 100.0% |
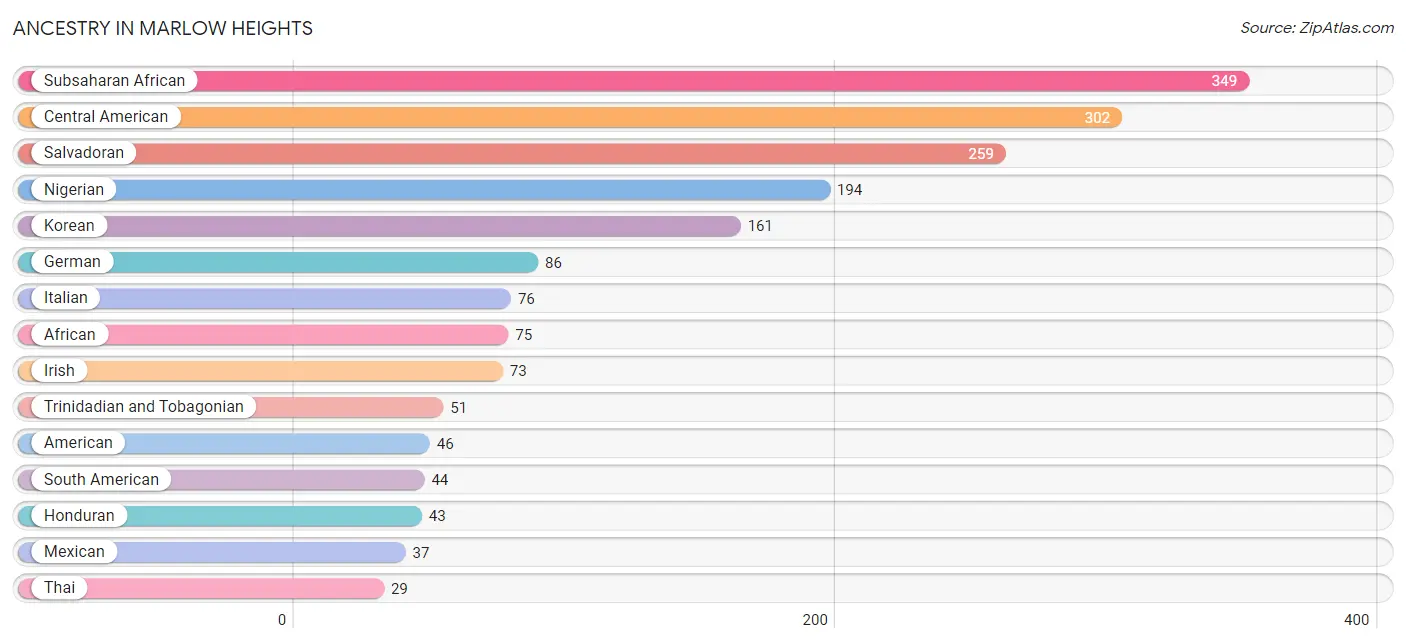
Ancestry in Marlow Heights
The most populous ancestries reported in Marlow Heights are Subsaharan African (349 | 5.6%), Central American (302 | 4.8%), Salvadoran (259 | 4.1%), Nigerian (194 | 3.1%), and Korean (161 | 2.6%), together accounting for 20.2% of all Marlow Heights residents.
| Ancestry | # Population | % Population |
| African | 75 | 1.2% |
| American | 46 | 0.7% |
| Barbadian | 7 | 0.1% |
| Bolivian | 19 | 0.3% |
| British | 5 | 0.1% |
| Central American | 302 | 4.8% |
| Cherokee | 9 | 0.1% |
| Colombian | 10 | 0.2% |
| Dominican | 23 | 0.4% |
| Ecuadorian | 11 | 0.2% |
| English | 12 | 0.2% |
| French | 5 | 0.1% |
| German | 86 | 1.4% |
| Guyanese | 18 | 0.3% |
| Honduran | 43 | 0.7% |
| Irish | 73 | 1.2% |
| Italian | 76 | 1.2% |
| Jamaican | 25 | 0.4% |
| Korean | 161 | 2.6% |
| Mexican | 37 | 0.6% |
| Nigerian | 194 | 3.1% |
| Norwegian | 11 | 0.2% |
| Peruvian | 4 | 0.1% |
| Portuguese | 4 | 0.1% |
| Puerto Rican | 5 | 0.1% |
| Salvadoran | 259 | 4.1% |
| Scottish | 10 | 0.2% |
| South American | 44 | 0.7% |
| South American Indian | 4 | 0.1% |
| Subsaharan African | 349 | 5.6% |
| Thai | 29 | 0.5% |
| Trinidadian and Tobagonian | 51 | 0.8% | View All 32 Rows |
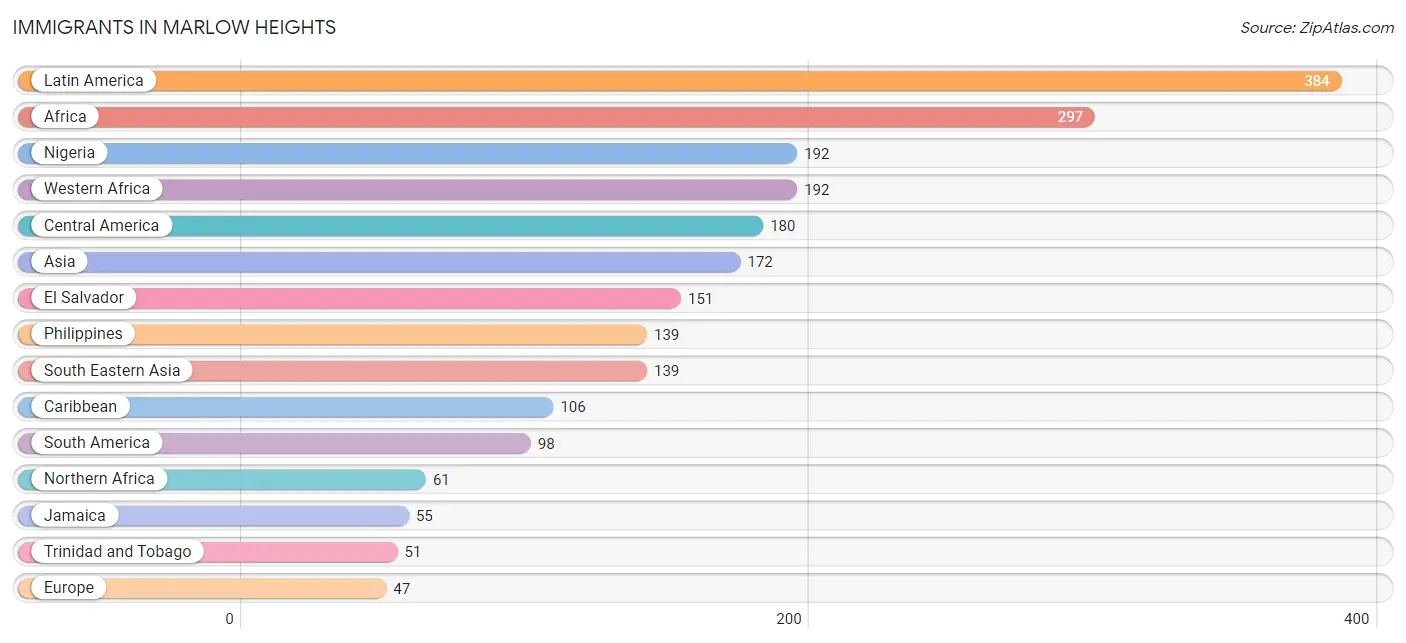
Immigrants in Marlow Heights
The most numerous immigrant groups reported in Marlow Heights came from Latin America (384 | 6.1%), Africa (297 | 4.8%), Nigeria (192 | 3.1%), Western Africa (192 | 3.1%), and Central America (180 | 2.9%), together accounting for 19.9% of all Marlow Heights residents.
| Immigration Origin | # Population | % Population |
| Africa | 297 | 4.8% |
| Asia | 172 | 2.8% |
| Bolivia | 19 | 0.3% |
| Cameroon | 9 | 0.1% |
| Caribbean | 106 | 1.7% |
| Central America | 180 | 2.9% |
| Colombia | 10 | 0.2% |
| Eastern Africa | 6 | 0.1% |
| Ecuador | 11 | 0.2% |
| El Salvador | 151 | 2.4% |
| Ethiopia | 6 | 0.1% |
| Europe | 47 | 0.7% |
| Guyana | 26 | 0.4% |
| Honduras | 24 | 0.4% |
| Iran | 33 | 0.5% |
| Italy | 47 | 0.7% |
| Jamaica | 55 | 0.9% |
| Latin America | 384 | 6.1% |
| Mexico | 5 | 0.1% |
| Middle Africa | 9 | 0.1% |
| Nigeria | 192 | 3.1% |
| Northern Africa | 61 | 1.0% |
| Peru | 4 | 0.1% |
| Philippines | 139 | 2.2% |
| South Africa | 29 | 0.5% |
| South America | 98 | 1.6% |
| South Central Asia | 33 | 0.5% |
| South Eastern Asia | 139 | 2.2% |
| Southern Europe | 47 | 0.7% |
| Trinidad and Tobago | 51 | 0.8% |
| Western Africa | 192 | 3.1% | View All 31 Rows |
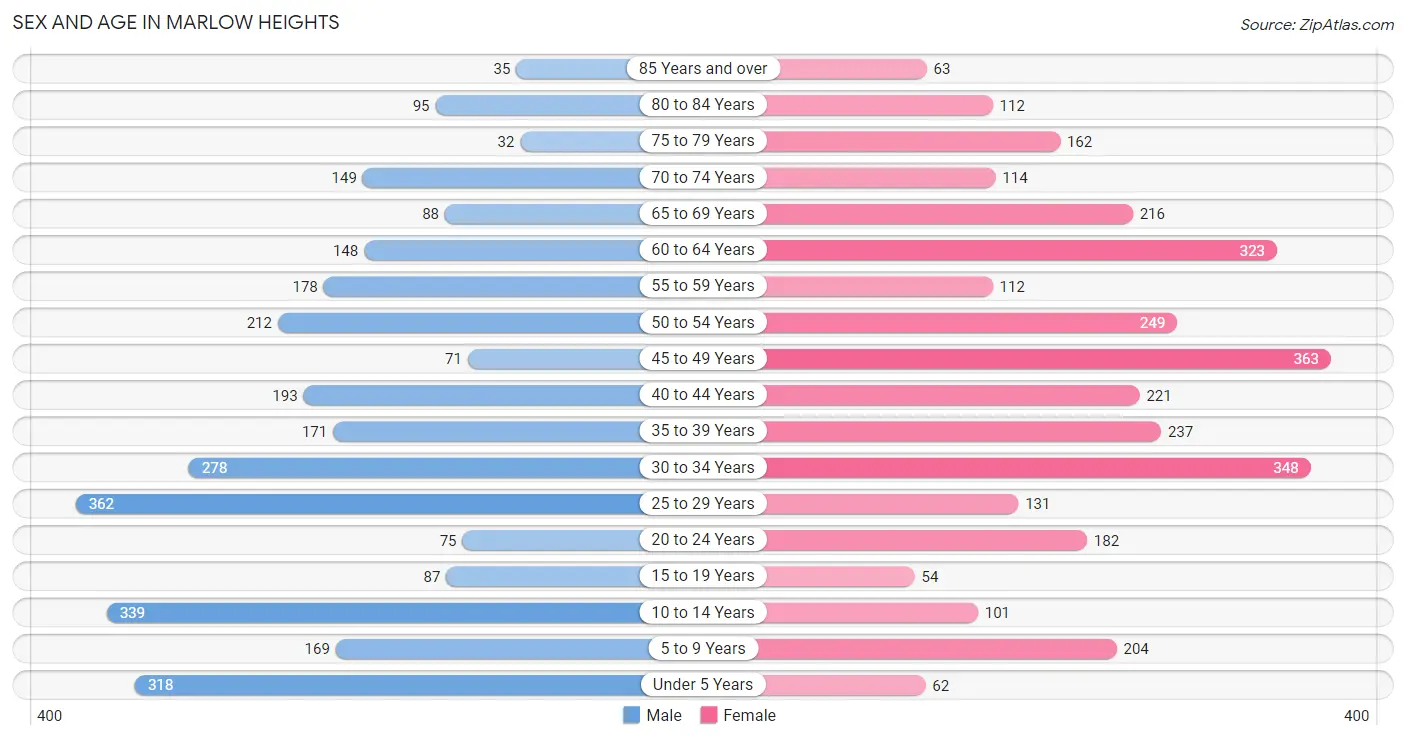
Sex and Age in Marlow Heights
Sex and Age in Marlow Heights
The most populous age groups in Marlow Heights are 25 to 29 Years (362 | 12.1%) for men and 45 to 49 Years (363 | 11.2%) for women.
| Age Bracket | Male | Female |
| Under 5 Years | 318 (10.6%) | 62 (1.9%) |
| 5 to 9 Years | 169 (5.6%) | 204 (6.3%) |
| 10 to 14 Years | 339 (11.3%) | 101 (3.1%) |
| 15 to 19 Years | 87 (2.9%) | 54 (1.7%) |
| 20 to 24 Years | 75 (2.5%) | 182 (5.6%) |
| 25 to 29 Years | 362 (12.1%) | 131 (4.0%) |
| 30 to 34 Years | 278 (9.3%) | 348 (10.7%) |
| 35 to 39 Years | 171 (5.7%) | 237 (7.3%) |
| 40 to 44 Years | 193 (6.4%) | 221 (6.8%) |
| 45 to 49 Years | 71 (2.4%) | 363 (11.2%) |
| 50 to 54 Years | 212 (7.1%) | 249 (7.6%) |
| 55 to 59 Years | 178 (5.9%) | 112 (3.4%) |
| 60 to 64 Years | 148 (4.9%) | 323 (9.9%) |
| 65 to 69 Years | 88 (2.9%) | 216 (6.6%) |
| 70 to 74 Years | 149 (5.0%) | 114 (3.5%) |
| 75 to 79 Years | 32 (1.1%) | 162 (5.0%) |
| 80 to 84 Years | 95 (3.2%) | 112 (3.4%) |
| 85 Years and over | 35 (1.2%) | 63 (1.9%) |
| Total | 3,000 (100.0%) | 3,254 (100.0%) |
Families and Households in Marlow Heights
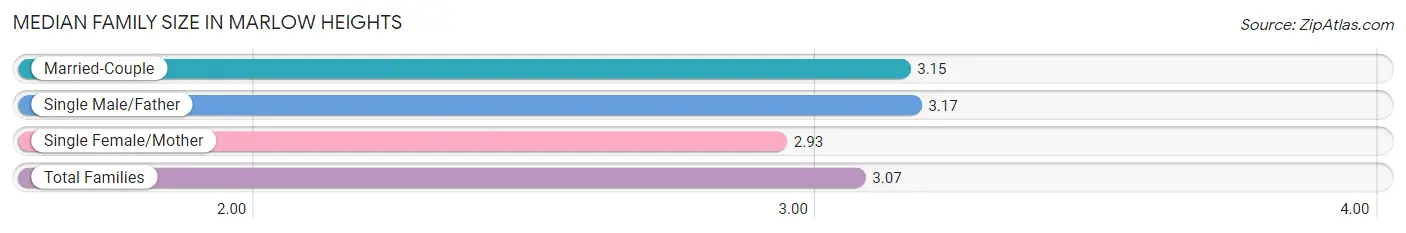
Median Family Size in Marlow Heights
The median family size in Marlow Heights is 3.07 persons per family, with single male/father families (211 | 13.4%) accounting for the largest median family size of 3.17 persons per family. On the other hand, single female/mother families (571 | 36.2%) represent the smallest median family size with 2.93 persons per family.
| Family Type | # Families | Family Size |
| Married-Couple | 793 (50.3%) | 3.15 |
| Single Male/Father | 211 (13.4%) | 3.17 |
| Single Female/Mother | 571 (36.2%) | 2.93 |
| Total Families | 1,575 (100.0%) | 3.07 |
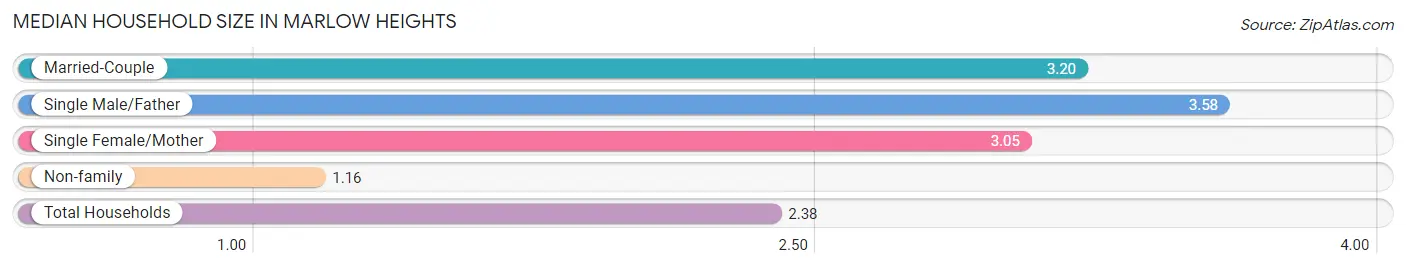
Median Household Size in Marlow Heights
The median household size in Marlow Heights is 2.38 persons per household, with single male/father households (211 | 8.1%) accounting for the largest median household size of 3.58 persons per household. non-family households (1,044 | 39.9%) represent the smallest median household size with 1.16 persons per household.
| Household Type | # Households | Household Size |
| Married-Couple | 793 (30.3%) | 3.20 |
| Single Male/Father | 211 (8.1%) | 3.58 |
| Single Female/Mother | 571 (21.8%) | 3.05 |
| Non-family | 1,044 (39.9%) | 1.16 |
| Total Households | 2,619 (100.0%) | 2.38 |
Household Size by Marriage Status in Marlow Heights
Out of a total of 2,619 households in Marlow Heights, 1,575 (60.1%) are family households, while 1,044 (39.9%) are nonfamily households. The most numerous type of family households are 2-person households, comprising 758, and the most common type of nonfamily households are 1-person households, comprising 921.
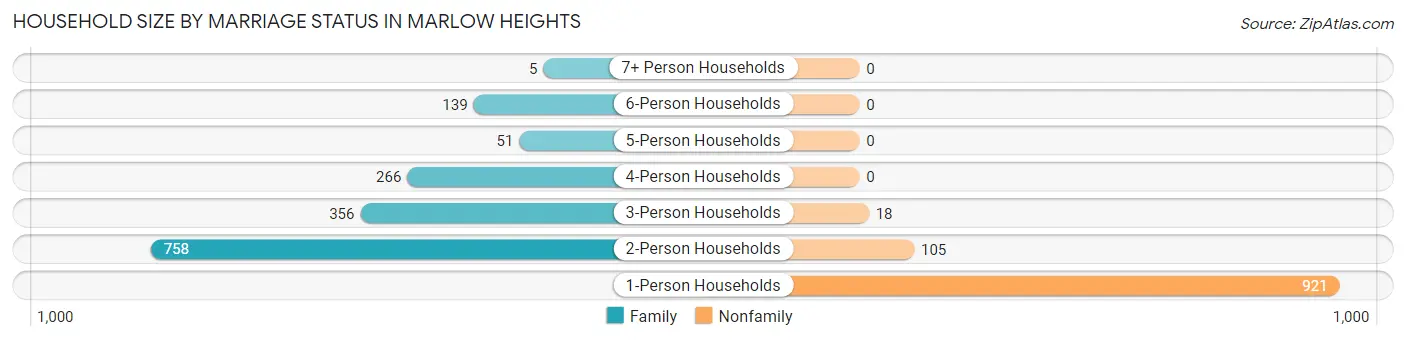
| Household Size | Family Households | Nonfamily Households |
| 1-Person Households | - | 921 (35.2%) |
| 2-Person Households | 758 (28.9%) | 105 (4.0%) |
| 3-Person Households | 356 (13.6%) | 18 (0.7%) |
| 4-Person Households | 266 (10.2%) | 0 (0.0%) |
| 5-Person Households | 51 (1.9%) | 0 (0.0%) |
| 6-Person Households | 139 (5.3%) | 0 (0.0%) |
| 7+ Person Households | 5 (0.2%) | 0 (0.0%) |
| Total | 1,575 (60.1%) | 1,044 (39.9%) |
Female Fertility in Marlow Heights
Fertility by Age in Marlow Heights
Average fertility rate in Marlow Heights is 8.0 births per 1,000 women. Women in the age bracket of 35 to 50 years have the highest fertility rate with 10.0 births per 1,000 women. Women in the age bracket of 35 to 50 years acount for 61.5% of all women with births.
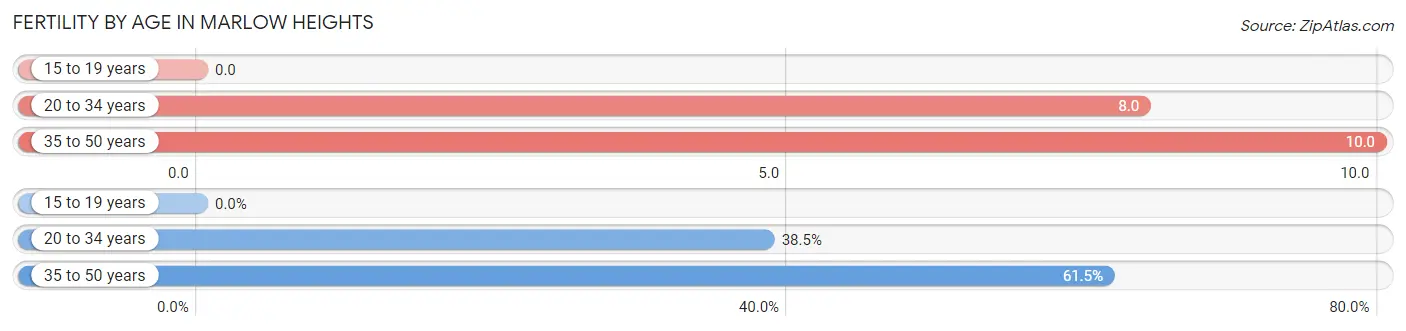
| Age Bracket | Women with Births | Births / 1,000 Women |
| 15 to 19 years | 0 (0.0%) | 0.0 |
| 20 to 34 years | 5 (38.5%) | 8.0 |
| 35 to 50 years | 8 (61.5%) | 10.0 |
| Total | 13 (100.0%) | 8.0 |
Fertility by Age by Marriage Status in Marlow Heights
38.5% of women with births (13) in Marlow Heights are married. The highest percentage of unmarried women with births falls into 35 to 50 years age bracket with 100.0% of them unmarried at the time of birth, while the lowest percentage of unmarried women with births belong to 20 to 34 years age bracket with 0.0% of them unmarried.
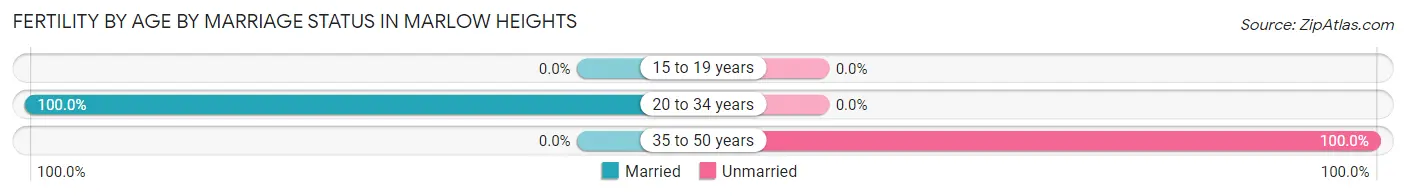
| Age Bracket | Married | Unmarried |
| 15 to 19 years | 0 (0.0%) | 0 (0.0%) |
| 20 to 34 years | 5 (100.0%) | 0 (0.0%) |
| 35 to 50 years | 0 (0.0%) | 8 (100.0%) |
| Total | 5 (38.5%) | 8 (61.5%) |
Fertility by Education in Marlow Heights
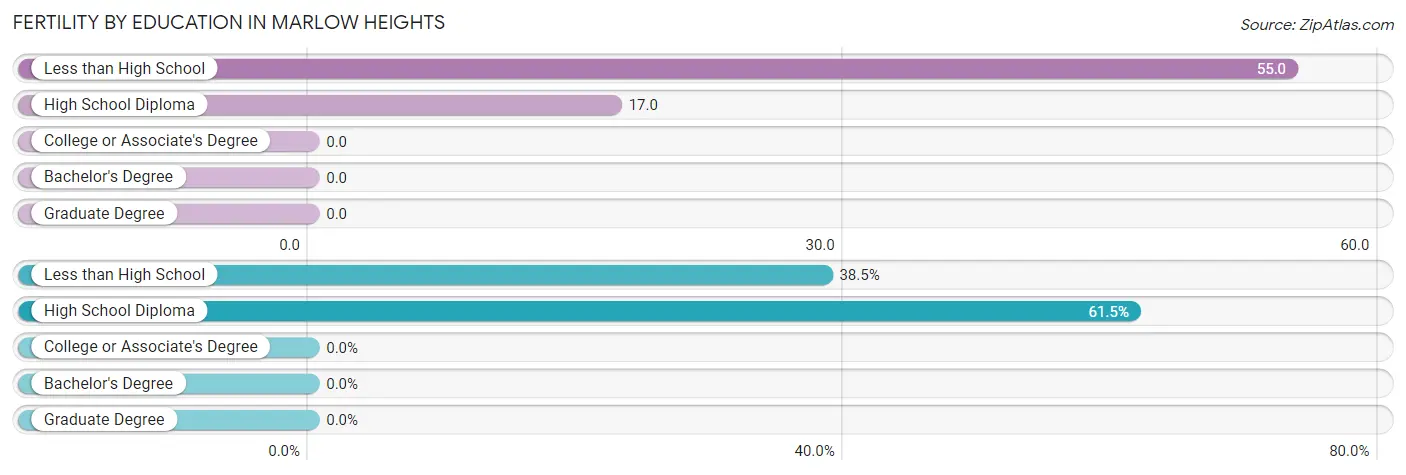
| Educational Attainment | Women with Births | Births / 1,000 Women |
| Less than High School | 5 (38.5%) | 55.0 |
| High School Diploma | 8 (61.5%) | 17.0 |
| College or Associate's Degree | 0 (0.0%) | 0.0 |
| Bachelor's Degree | 0 (0.0%) | 0.0 |
| Graduate Degree | 0 (0.0%) | 0.0 |
| Total | 13 (100.0%) | 8.0 |
Fertility by Education by Marriage Status in Marlow Heights
61.5% of women with births in Marlow Heights are unmarried. Women with the educational attainment of less than high school are most likely to be married with 100.0% of them married at childbirth, while women with the educational attainment of high school diploma are least likely to be married with 100.0% of them unmarried at childbirth.
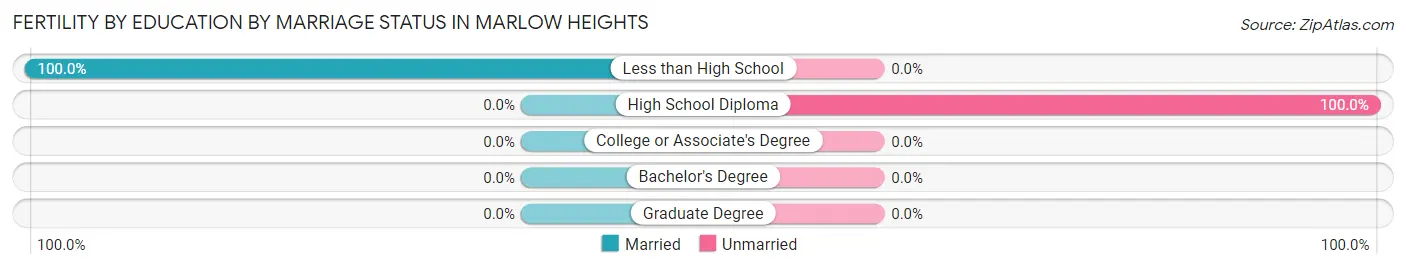
| Educational Attainment | Married | Unmarried |
| Less than High School | 5 (100.0%) | 0 (0.0%) |
| High School Diploma | 0 (0.0%) | 8 (100.0%) |
| College or Associate's Degree | 0 (0.0%) | 0 (0.0%) |
| Bachelor's Degree | 0 (0.0%) | 0 (0.0%) |
| Graduate Degree | 0 (0.0%) | 0 (0.0%) |
| Total | 5 (38.5%) | 8 (61.5%) |
Employment Characteristics in Marlow Heights
Employment by Class of Employer in Marlow Heights
Among the 2,878 employed individuals in Marlow Heights, private company employees (1,568 | 54.5%), federal government employees (507 | 17.6%), and not-for-profit organizations (310 | 10.8%) make up the most common classes of employment.
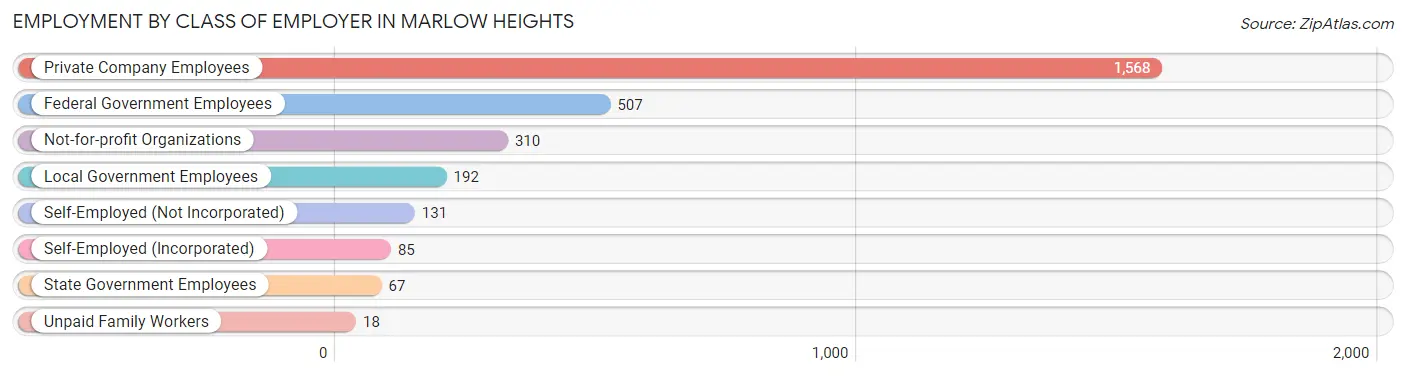
| Employer Class | # Employees | % Employees |
| Private Company Employees | 1,568 | 54.5% |
| Self-Employed (Incorporated) | 85 | 2.9% |
| Self-Employed (Not Incorporated) | 131 | 4.5% |
| Not-for-profit Organizations | 310 | 10.8% |
| Local Government Employees | 192 | 6.7% |
| State Government Employees | 67 | 2.3% |
| Federal Government Employees | 507 | 17.6% |
| Unpaid Family Workers | 18 | 0.6% |
| Total | 2,878 | 100.0% |
Employment Status by Age in Marlow Heights
According to the labor force statistics for Marlow Heights, out of the total population over 16 years of age (5,055), 66.5% or 3,362 individuals are in the labor force, with 12.9% or 434 of them unemployed. The age group with the highest labor force participation rate is 25 to 29 years, with 93.3% or 460 individuals in the labor force. Within the labor force, the 75 years and over age range has the highest percentage of unemployed individuals, with 56.3% or 27 of them being unemployed.
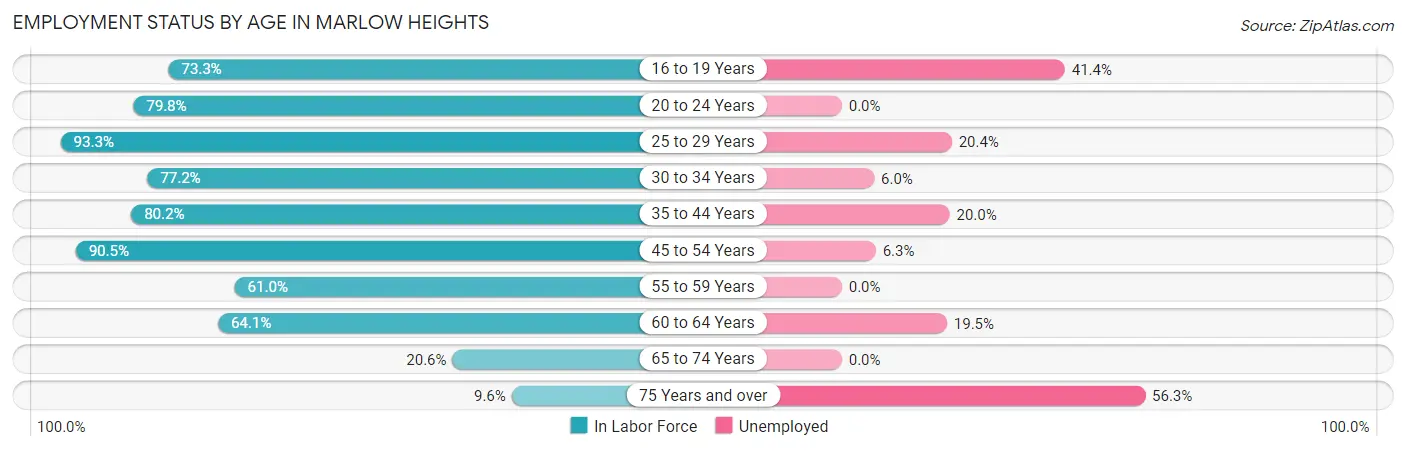
| Age Bracket | In Labor Force | Unemployed |
| 16 to 19 Years | 99 (73.3%) | 41 (41.4%) |
| 20 to 24 Years | 205 (79.8%) | 0 (0.0%) |
| 25 to 29 Years | 460 (93.3%) | 94 (20.4%) |
| 30 to 34 Years | 483 (77.2%) | 29 (6.0%) |
| 35 to 44 Years | 659 (80.2%) | 132 (20.0%) |
| 45 to 54 Years | 810 (90.5%) | 51 (6.3%) |
| 55 to 59 Years | 177 (61.0%) | 0 (0.0%) |
| 60 to 64 Years | 302 (64.1%) | 59 (19.5%) |
| 65 to 74 Years | 117 (20.6%) | 0 (0.0%) |
| 75 Years and over | 48 (9.6%) | 27 (56.3%) |
| Total | 3,362 (66.5%) | 434 (12.9%) |
Employment Status by Educational Attainment in Marlow Heights
According to labor force statistics for Marlow Heights, 80.4% of individuals (2,892) out of the total population between 25 and 64 years of age (3,597) are in the labor force, with 12.6% or 364 of them being unemployed. The group with the highest labor force participation rate are those with the educational attainment of high school diploma, with 84.9% or 906 individuals in the labor force. Within the labor force, individuals with less than high school education have the highest percentage of unemployment, with 34.0% or 54 of them being unemployed.
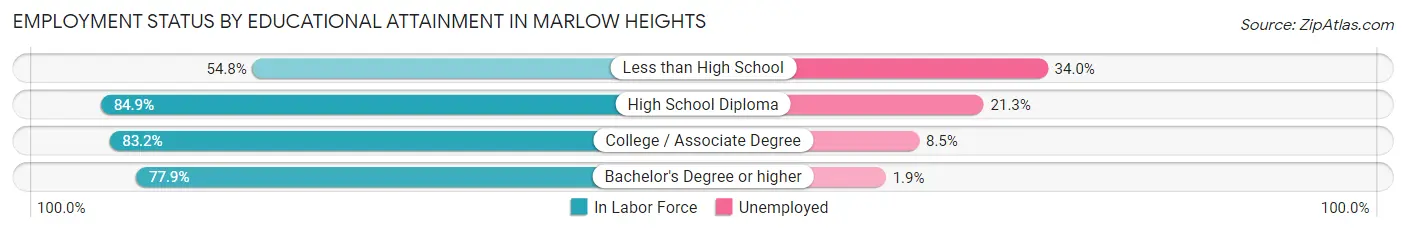
| Educational Attainment | In Labor Force | Unemployed |
| Less than High School | 159 (54.8%) | 99 (34.0%) |
| High School Diploma | 906 (84.9%) | 227 (21.3%) |
| College / Associate Degree | 1,260 (83.2%) | 129 (8.5%) |
| Bachelor's Degree or higher | 565 (77.9%) | 14 (1.9%) |
| Total | 2,892 (80.4%) | 453 (12.6%) |
Employment Occupations by Sex in Marlow Heights
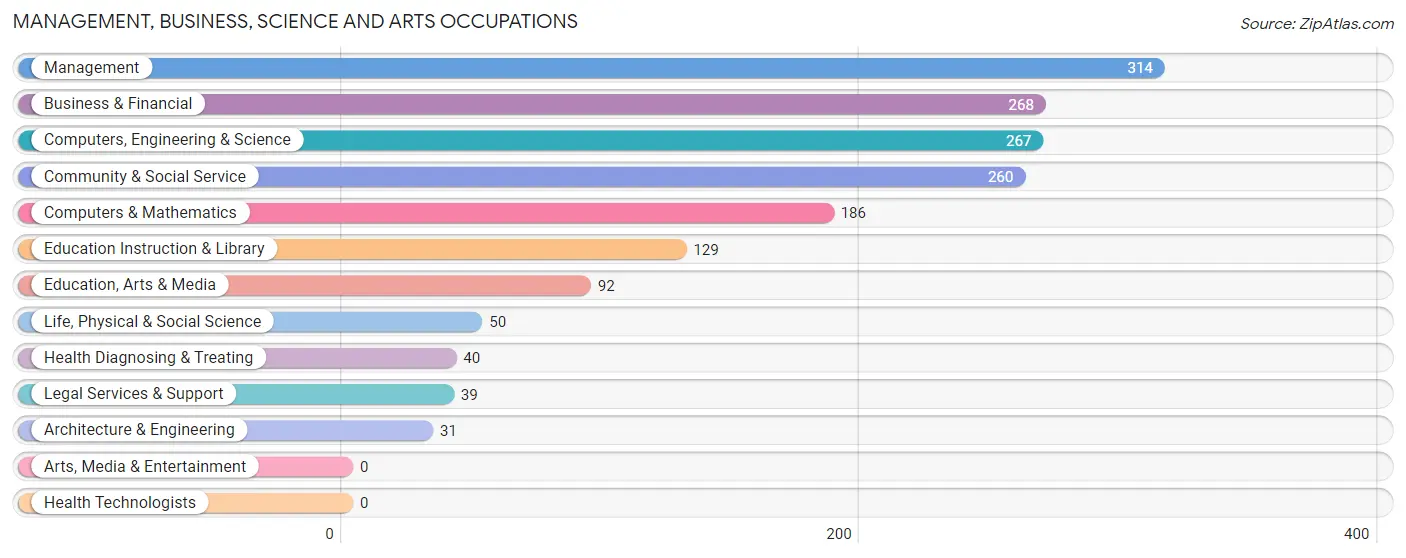
Management, Business, Science and Arts Occupations
The most common Management, Business, Science and Arts occupations in Marlow Heights are Management (314 | 10.7%), Business & Financial (268 | 9.2%), Computers, Engineering & Science (267 | 9.1%), Community & Social Service (260 | 8.9%), and Computers & Mathematics (186 | 6.4%).
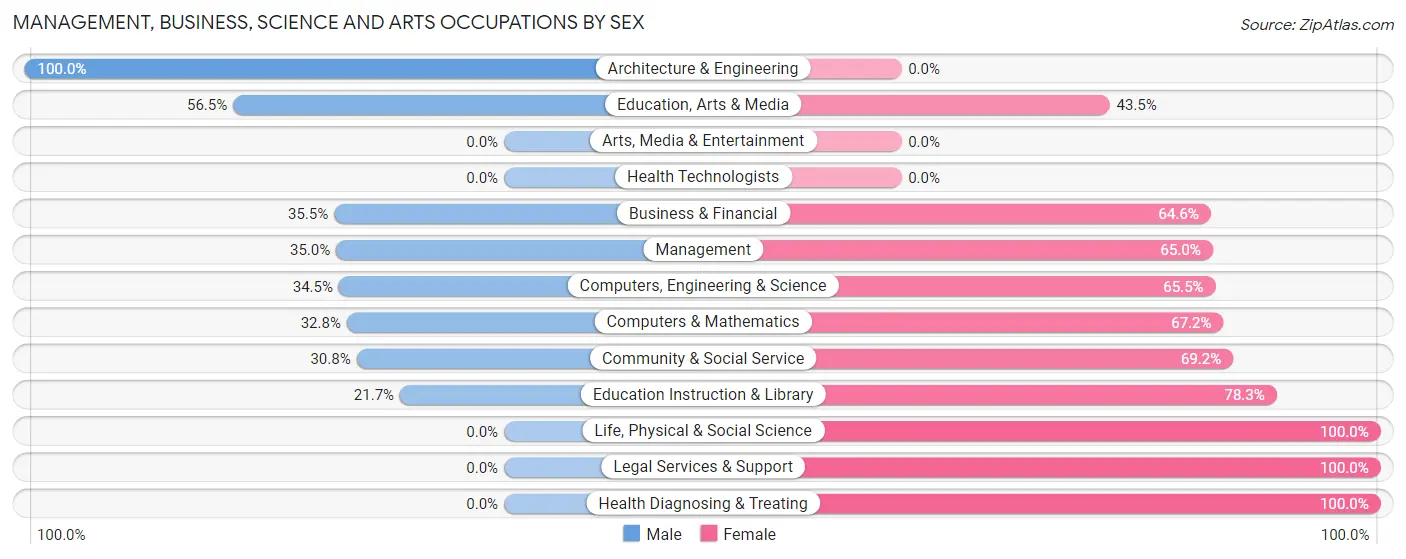
Management, Business, Science and Arts Occupations by Sex
Within the Management, Business, Science and Arts occupations in Marlow Heights, the most male-oriented occupations are Architecture & Engineering (100.0%), Education, Arts & Media (56.5%), and Business & Financial (35.4%), while the most female-oriented occupations are Life, Physical & Social Science (100.0%), Legal Services & Support (100.0%), and Health Diagnosing & Treating (100.0%).
| Occupation | Male | Female |
| Management | 110 (35.0%) | 204 (65.0%) |
| Business & Financial | 95 (35.4%) | 173 (64.5%) |
| Computers, Engineering & Science | 92 (34.5%) | 175 (65.5%) |
| Computers & Mathematics | 61 (32.8%) | 125 (67.2%) |
| Architecture & Engineering | 31 (100.0%) | 0 (0.0%) |
| Life, Physical & Social Science | 0 (0.0%) | 50 (100.0%) |
| Community & Social Service | 80 (30.8%) | 180 (69.2%) |
| Education, Arts & Media | 52 (56.5%) | 40 (43.5%) |
| Legal Services & Support | 0 (0.0%) | 39 (100.0%) |
| Education Instruction & Library | 28 (21.7%) | 101 (78.3%) |
| Arts, Media & Entertainment | 0 (0.0%) | 0 (0.0%) |
| Health Diagnosing & Treating | 0 (0.0%) | 40 (100.0%) |
| Health Technologists | 0 (0.0%) | 0 (0.0%) |
| Total (Category) | 377 (32.8%) | 772 (67.2%) |
| Total (Overall) | 1,240 (42.4%) | 1,687 (57.6%) |
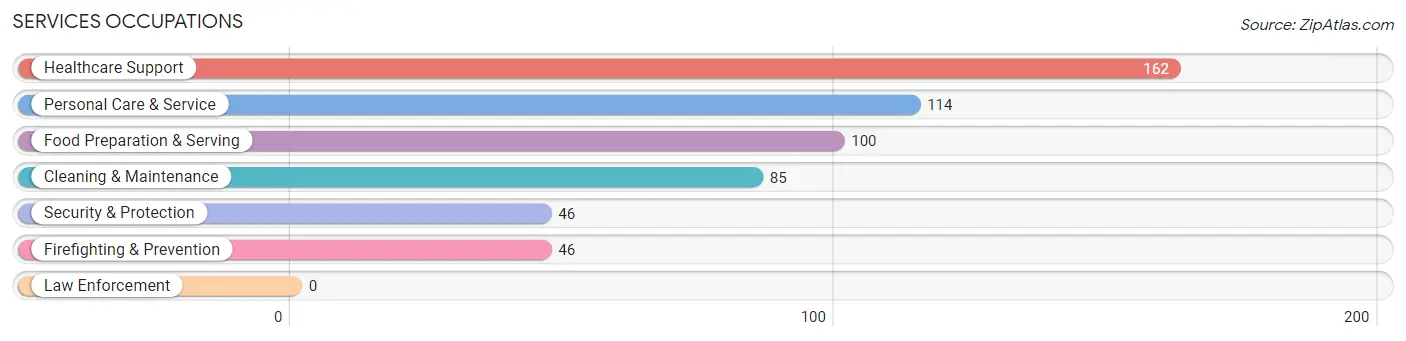
Services Occupations
The most common Services occupations in Marlow Heights are Healthcare Support (162 | 5.5%), Personal Care & Service (114 | 3.9%), Food Preparation & Serving (100 | 3.4%), Cleaning & Maintenance (85 | 2.9%), and Security & Protection (46 | 1.6%).
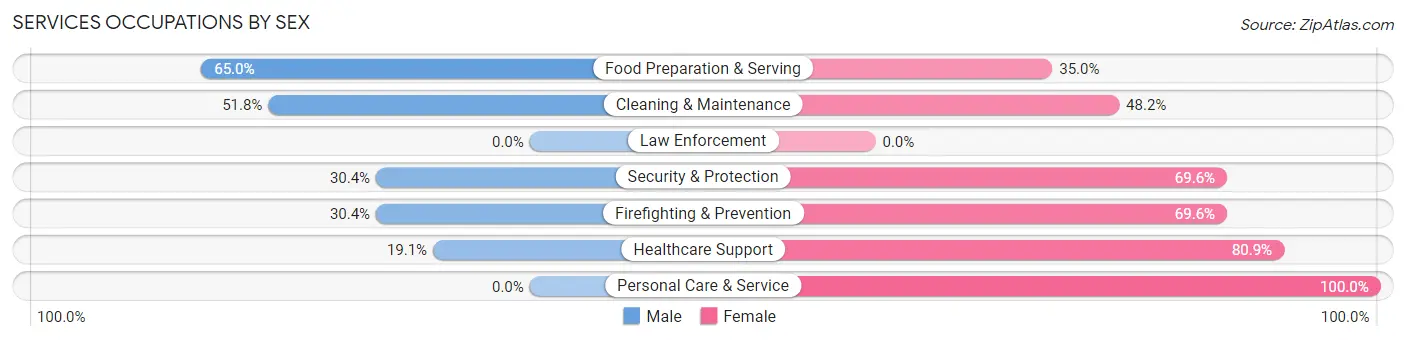
Services Occupations by Sex
Within the Services occupations in Marlow Heights, the most male-oriented occupations are Food Preparation & Serving (65.0%), Cleaning & Maintenance (51.8%), and Security & Protection (30.4%), while the most female-oriented occupations are Personal Care & Service (100.0%), Healthcare Support (80.9%), and Security & Protection (69.6%).
| Occupation | Male | Female |
| Healthcare Support | 31 (19.1%) | 131 (80.9%) |
| Security & Protection | 14 (30.4%) | 32 (69.6%) |
| Firefighting & Prevention | 14 (30.4%) | 32 (69.6%) |
| Law Enforcement | 0 (0.0%) | 0 (0.0%) |
| Food Preparation & Serving | 65 (65.0%) | 35 (35.0%) |
| Cleaning & Maintenance | 44 (51.8%) | 41 (48.2%) |
| Personal Care & Service | 0 (0.0%) | 114 (100.0%) |
| Total (Category) | 154 (30.4%) | 353 (69.6%) |
| Total (Overall) | 1,240 (42.4%) | 1,687 (57.6%) |
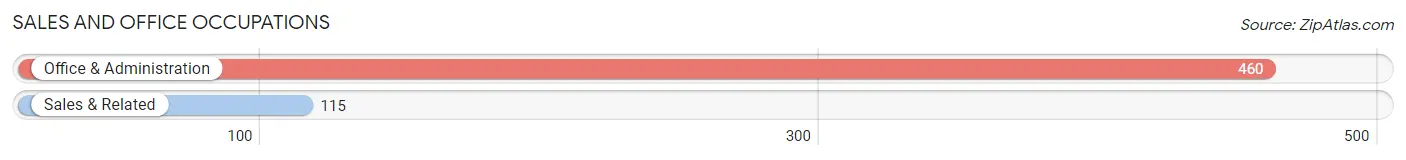
Sales and Office Occupations
The most common Sales and Office occupations in Marlow Heights are Office & Administration (460 | 15.7%), and Sales & Related (115 | 3.9%).
Sales and Office Occupations by Sex
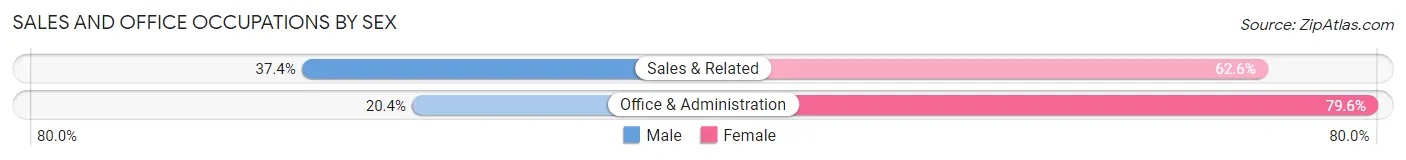
| Occupation | Male | Female |
| Sales & Related | 43 (37.4%) | 72 (62.6%) |
| Office & Administration | 94 (20.4%) | 366 (79.6%) |
| Total (Category) | 137 (23.8%) | 438 (76.2%) |
| Total (Overall) | 1,240 (42.4%) | 1,687 (57.6%) |
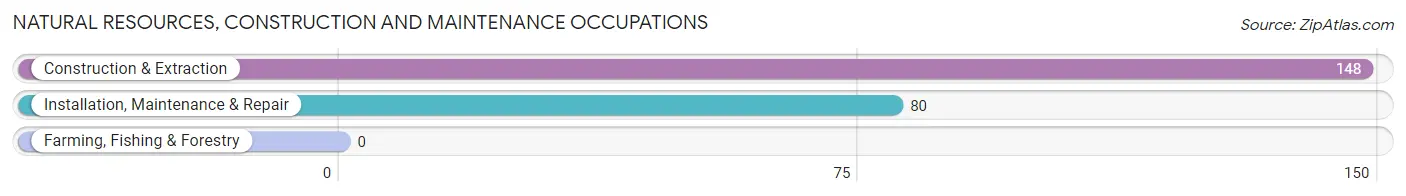
Natural Resources, Construction and Maintenance Occupations
The most common Natural Resources, Construction and Maintenance occupations in Marlow Heights are Construction & Extraction (148 | 5.1%), and Installation, Maintenance & Repair (80 | 2.7%).
Natural Resources, Construction and Maintenance Occupations by Sex
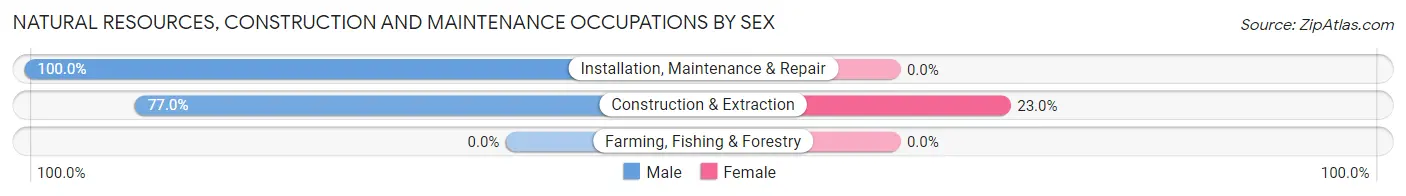
| Occupation | Male | Female |
| Farming, Fishing & Forestry | 0 (0.0%) | 0 (0.0%) |
| Construction & Extraction | 114 (77.0%) | 34 (23.0%) |
| Installation, Maintenance & Repair | 80 (100.0%) | 0 (0.0%) |
| Total (Category) | 194 (85.1%) | 34 (14.9%) |
| Total (Overall) | 1,240 (42.4%) | 1,687 (57.6%) |
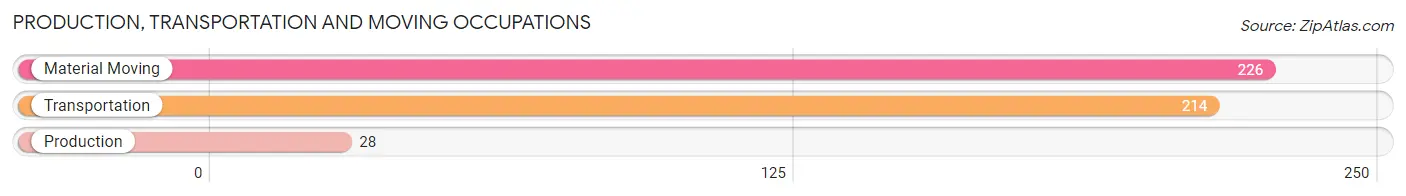
Production, Transportation and Moving Occupations
The most common Production, Transportation and Moving occupations in Marlow Heights are Material Moving (226 | 7.7%), Transportation (214 | 7.3%), and Production (28 | 1.0%).
Production, Transportation and Moving Occupations by Sex
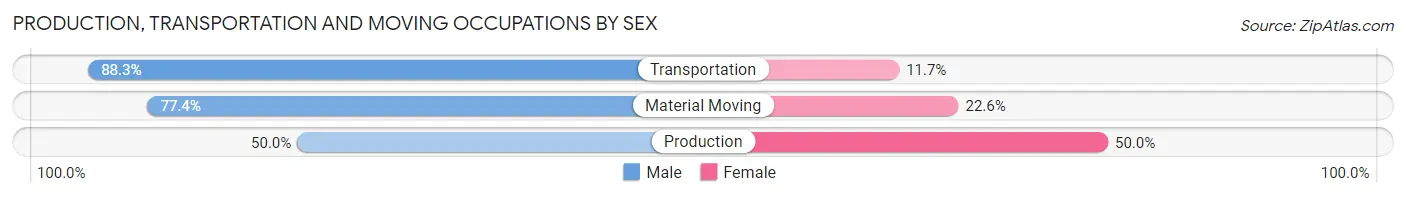
| Occupation | Male | Female |
| Production | 14 (50.0%) | 14 (50.0%) |
| Transportation | 189 (88.3%) | 25 (11.7%) |
| Material Moving | 175 (77.4%) | 51 (22.6%) |
| Total (Category) | 378 (80.8%) | 90 (19.2%) |
| Total (Overall) | 1,240 (42.4%) | 1,687 (57.6%) |
Employment Industries by Sex in Marlow Heights
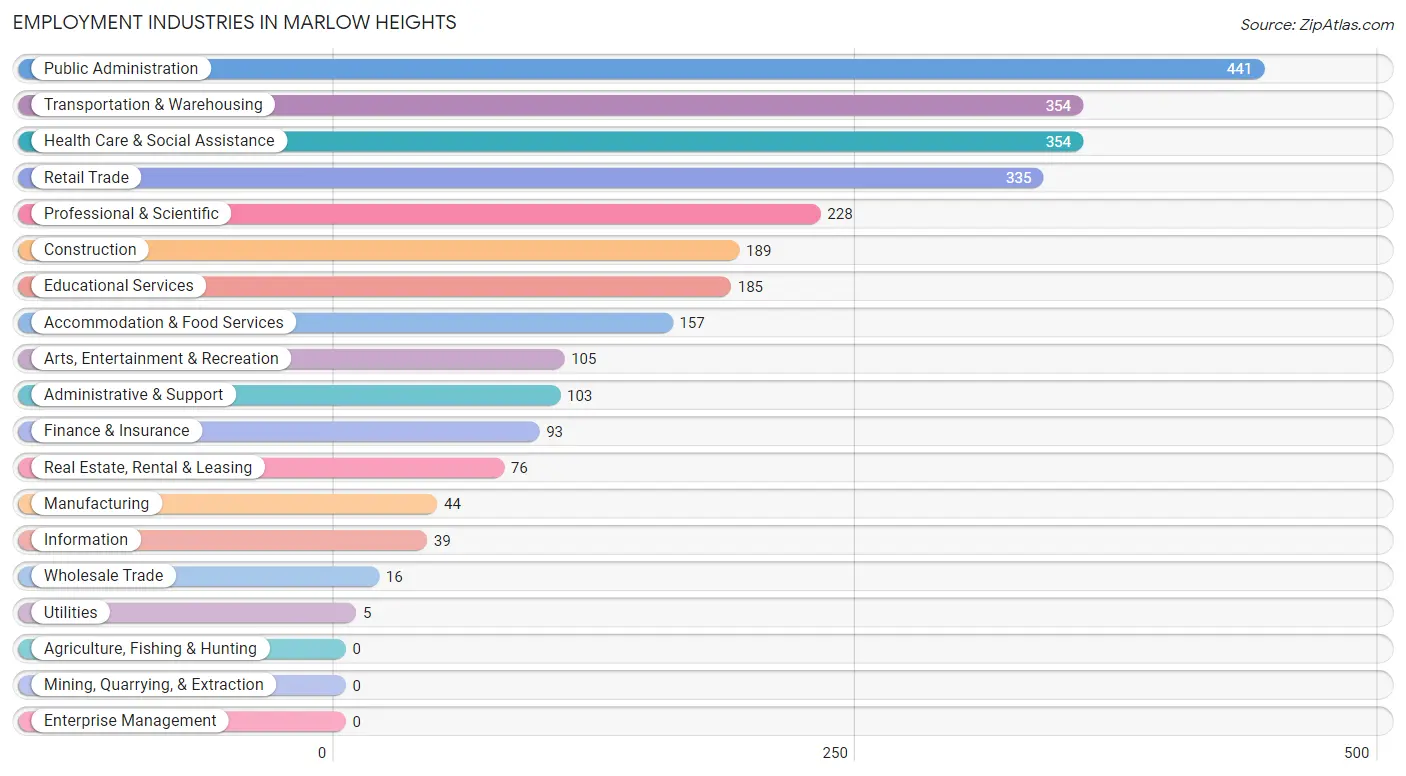
Employment Industries in Marlow Heights
The major employment industries in Marlow Heights include Public Administration (441 | 15.1%), Transportation & Warehousing (354 | 12.1%), Health Care & Social Assistance (354 | 12.1%), Retail Trade (335 | 11.5%), and Professional & Scientific (228 | 7.8%).
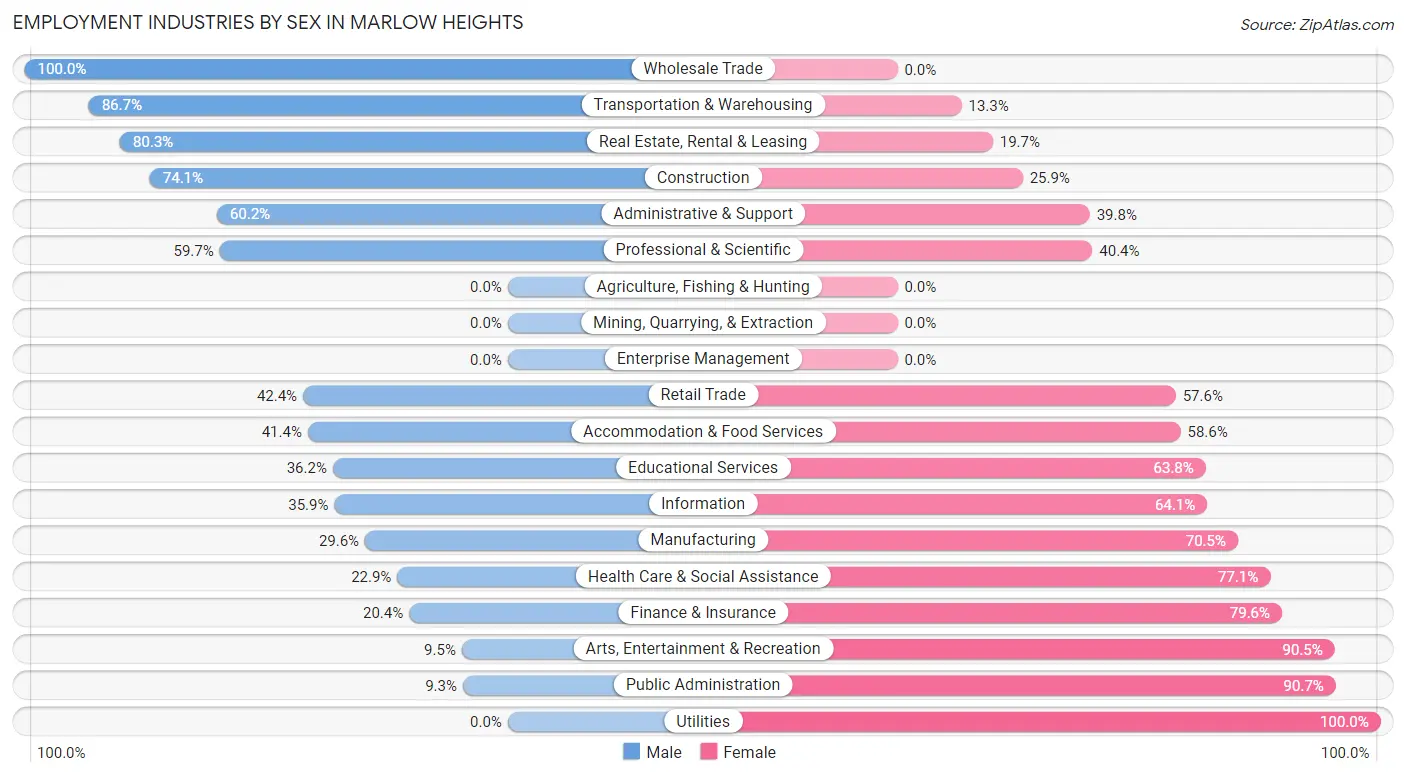
Employment Industries by Sex in Marlow Heights
The Marlow Heights industries that see more men than women are Wholesale Trade (100.0%), Transportation & Warehousing (86.7%), and Real Estate, Rental & Leasing (80.3%), whereas the industries that tend to have a higher number of women are Utilities (100.0%), Public Administration (90.7%), and Arts, Entertainment & Recreation (90.5%).
| Industry | Male | Female |
| Agriculture, Fishing & Hunting | 0 (0.0%) | 0 (0.0%) |
| Mining, Quarrying, & Extraction | 0 (0.0%) | 0 (0.0%) |
| Construction | 140 (74.1%) | 49 (25.9%) |
| Manufacturing | 13 (29.5%) | 31 (70.5%) |
| Wholesale Trade | 16 (100.0%) | 0 (0.0%) |
| Retail Trade | 142 (42.4%) | 193 (57.6%) |
| Transportation & Warehousing | 307 (86.7%) | 47 (13.3%) |
| Utilities | 0 (0.0%) | 5 (100.0%) |
| Information | 14 (35.9%) | 25 (64.1%) |
| Finance & Insurance | 19 (20.4%) | 74 (79.6%) |
| Real Estate, Rental & Leasing | 61 (80.3%) | 15 (19.7%) |
| Professional & Scientific | 136 (59.7%) | 92 (40.4%) |
| Enterprise Management | 0 (0.0%) | 0 (0.0%) |
| Administrative & Support | 62 (60.2%) | 41 (39.8%) |
| Educational Services | 67 (36.2%) | 118 (63.8%) |
| Health Care & Social Assistance | 81 (22.9%) | 273 (77.1%) |
| Arts, Entertainment & Recreation | 10 (9.5%) | 95 (90.5%) |
| Accommodation & Food Services | 65 (41.4%) | 92 (58.6%) |
| Public Administration | 41 (9.3%) | 400 (90.7%) |
| Total | 1,240 (42.4%) | 1,687 (57.6%) |
Education in Marlow Heights
School Enrollment in Marlow Heights
The most common levels of schooling among the 1,043 students in Marlow Heights are middle school (366 | 35.1%), elementary school (315 | 30.2%), and high school (145 | 13.9%).
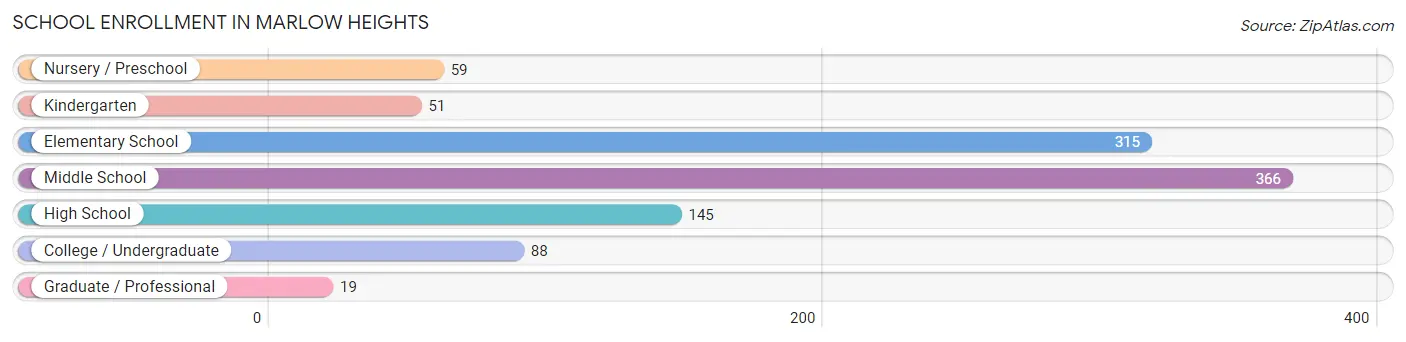
| School Level | # Students | % Students |
| Nursery / Preschool | 59 | 5.7% |
| Kindergarten | 51 | 4.9% |
| Elementary School | 315 | 30.2% |
| Middle School | 366 | 35.1% |
| High School | 145 | 13.9% |
| College / Undergraduate | 88 | 8.4% |
| Graduate / Professional | 19 | 1.8% |
| Total | 1,043 | 100.0% |
School Enrollment by Age by Funding Source in Marlow Heights
Out of a total of 1,043 students who are enrolled in schools in Marlow Heights, 59 (5.7%) attend a private institution, while the remaining 984 (94.3%) are enrolled in public schools. The age group of 3 to 4 year olds has the highest likelihood of being enrolled in private schools, with 27 (46.6% in the age bracket) enrolled. Conversely, the age group of 15 to 17 year olds has the lowest likelihood of being enrolled in a private school, with 58 (100.0% in the age bracket) attending a public institution.
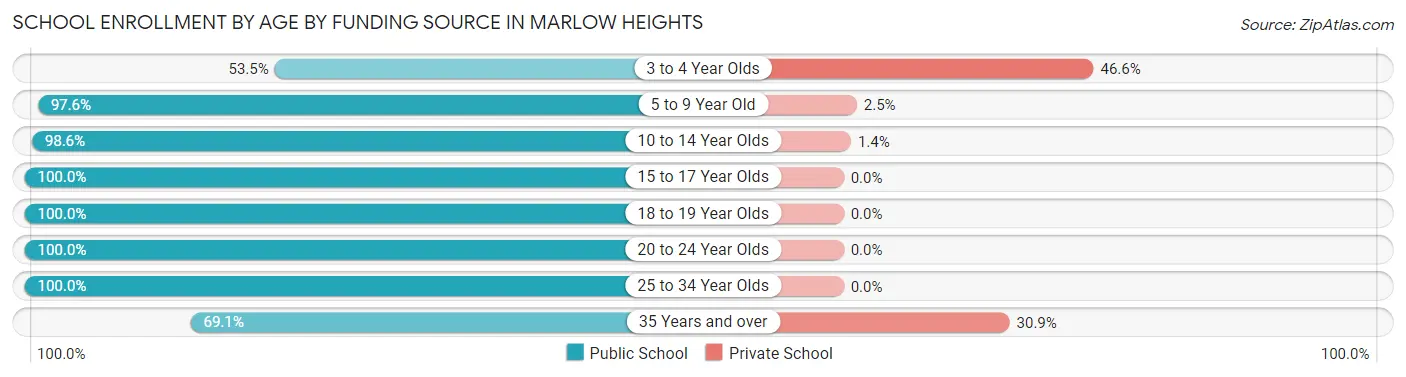
| Age Bracket | Public School | Private School |
| 3 to 4 Year Olds | 31 (53.4%) | 27 (46.6%) |
| 5 to 9 Year Old | 358 (97.6%) | 9 (2.5%) |
| 10 to 14 Year Olds | 434 (98.6%) | 6 (1.4%) |
| 15 to 17 Year Olds | 58 (100.0%) | 0 (0.0%) |
| 18 to 19 Year Olds | 9 (100.0%) | 0 (0.0%) |
| 20 to 24 Year Olds | 29 (100.0%) | 0 (0.0%) |
| 25 to 34 Year Olds | 27 (100.0%) | 0 (0.0%) |
| 35 Years and over | 38 (69.1%) | 17 (30.9%) |
| Total | 984 (94.3%) | 59 (5.7%) |
Educational Attainment by Field of Study in Marlow Heights
Business (288 | 26.9%), social sciences (187 | 17.5%), education (160 | 14.9%), computers & mathematics (67 | 6.3%), and engineering (62 | 5.8%) are the most common fields of study among 1,070 individuals in Marlow Heights who have obtained a bachelor's degree or higher.
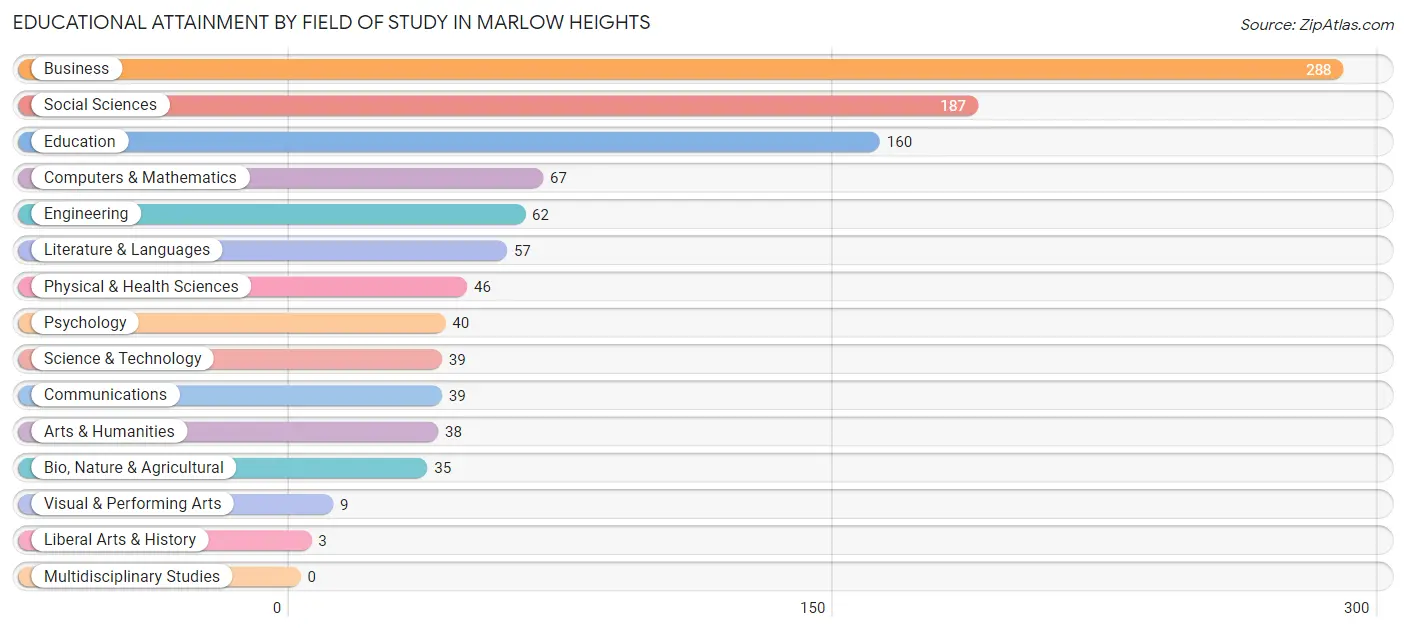
| Field of Study | # Graduates | % Graduates |
| Computers & Mathematics | 67 | 6.3% |
| Bio, Nature & Agricultural | 35 | 3.3% |
| Physical & Health Sciences | 46 | 4.3% |
| Psychology | 40 | 3.7% |
| Social Sciences | 187 | 17.5% |
| Engineering | 62 | 5.8% |
| Multidisciplinary Studies | 0 | 0.0% |
| Science & Technology | 39 | 3.6% |
| Business | 288 | 26.9% |
| Education | 160 | 14.9% |
| Literature & Languages | 57 | 5.3% |
| Liberal Arts & History | 3 | 0.3% |
| Visual & Performing Arts | 9 | 0.8% |
| Communications | 39 | 3.6% |
| Arts & Humanities | 38 | 3.5% |
| Total | 1,070 | 100.0% |
Transportation & Commute in Marlow Heights
Vehicle Availability by Sex in Marlow Heights
The most prevalent vehicle ownership categories in Marlow Heights are males with 2 vehicles (525, accounting for 42.3%) and females with 2 vehicles (465, making up 32.1%).
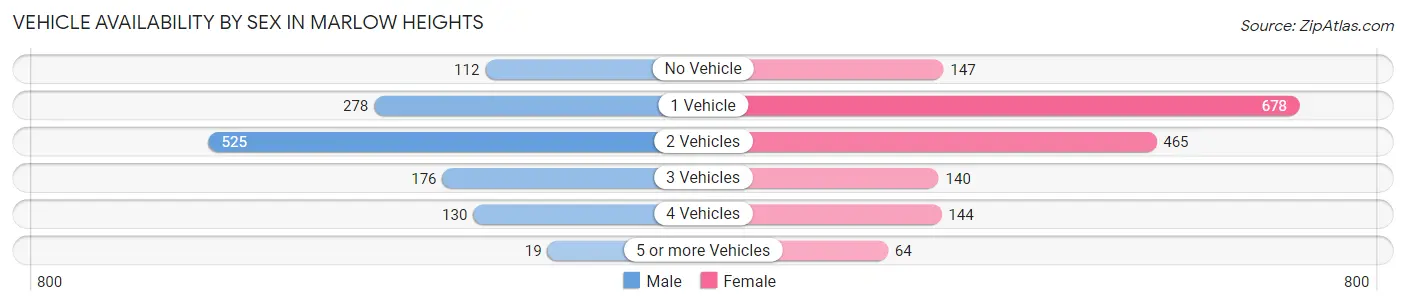
| Vehicles Available | Male | Female |
| No Vehicle | 112 (9.0%) | 147 (9.0%) |
| 1 Vehicle | 278 (22.4%) | 678 (41.4%) |
| 2 Vehicles | 525 (42.3%) | 465 (28.4%) |
| 3 Vehicles | 176 (14.2%) | 140 (8.6%) |
| 4 Vehicles | 130 (10.5%) | 144 (8.8%) |
| 5 or more Vehicles | 19 (1.5%) | 64 (3.9%) |
| Total | 1,240 (100.0%) | 1,638 (100.0%) |
Commute Time in Marlow Heights
The most frequently occuring commute durations in Marlow Heights are 30 to 34 minutes (720 commuters, 26.6%), 60 to 89 minutes (437 commuters, 16.1%), and 45 to 59 minutes (420 commuters, 15.5%).
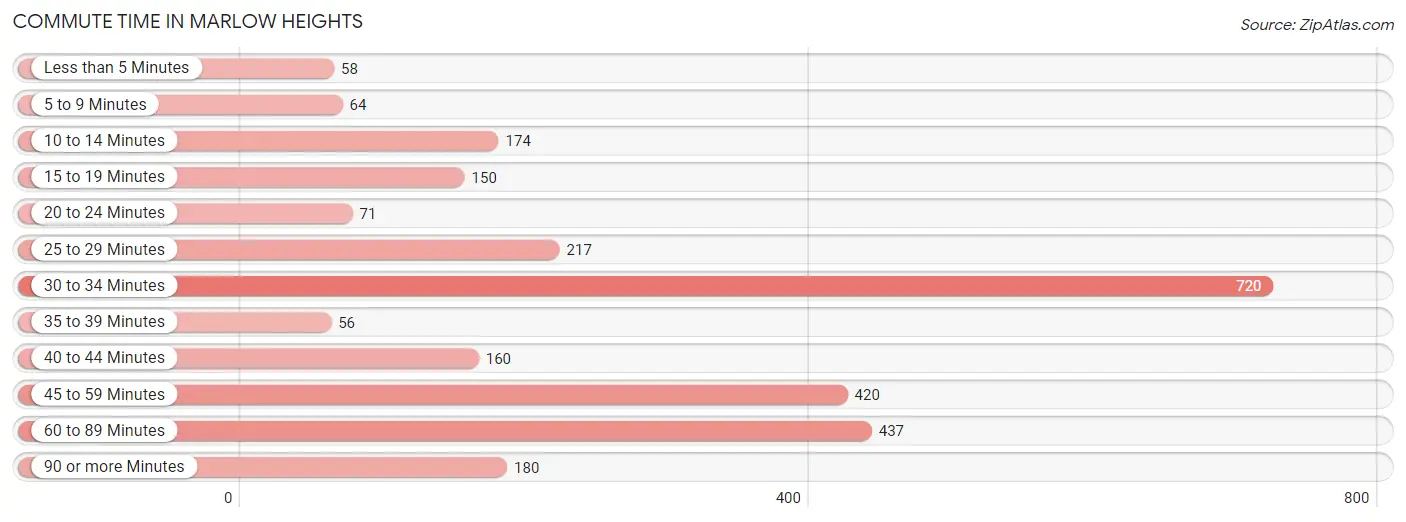
| Commute Time | # Commuters | % Commuters |
| Less than 5 Minutes | 58 | 2.1% |
| 5 to 9 Minutes | 64 | 2.4% |
| 10 to 14 Minutes | 174 | 6.4% |
| 15 to 19 Minutes | 150 | 5.5% |
| 20 to 24 Minutes | 71 | 2.6% |
| 25 to 29 Minutes | 217 | 8.0% |
| 30 to 34 Minutes | 720 | 26.6% |
| 35 to 39 Minutes | 56 | 2.1% |
| 40 to 44 Minutes | 160 | 5.9% |
| 45 to 59 Minutes | 420 | 15.5% |
| 60 to 89 Minutes | 437 | 16.1% |
| 90 or more Minutes | 180 | 6.7% |
Commute Time by Sex in Marlow Heights
The most common commute times in Marlow Heights are 30 to 34 minutes (291 commuters, 25.4%) for males and 30 to 34 minutes (429 commuters, 27.5%) for females.
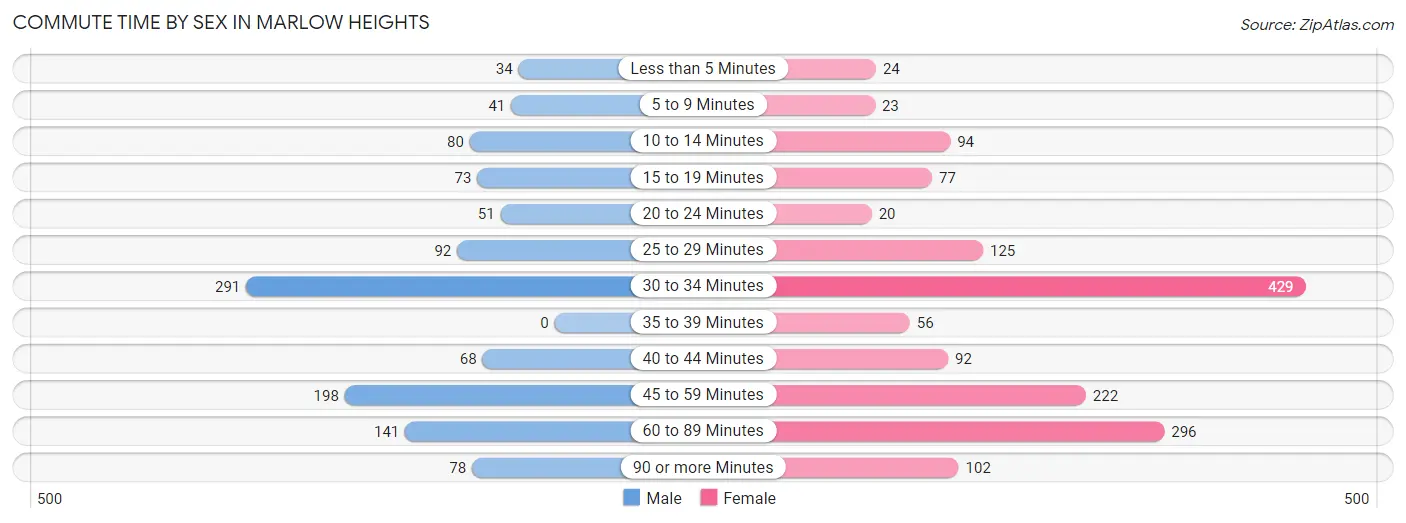
| Commute Time | Male | Female |
| Less than 5 Minutes | 34 (3.0%) | 24 (1.5%) |
| 5 to 9 Minutes | 41 (3.6%) | 23 (1.5%) |
| 10 to 14 Minutes | 80 (7.0%) | 94 (6.0%) |
| 15 to 19 Minutes | 73 (6.4%) | 77 (4.9%) |
| 20 to 24 Minutes | 51 (4.4%) | 20 (1.3%) |
| 25 to 29 Minutes | 92 (8.0%) | 125 (8.0%) |
| 30 to 34 Minutes | 291 (25.4%) | 429 (27.5%) |
| 35 to 39 Minutes | 0 (0.0%) | 56 (3.6%) |
| 40 to 44 Minutes | 68 (5.9%) | 92 (5.9%) |
| 45 to 59 Minutes | 198 (17.3%) | 222 (14.2%) |
| 60 to 89 Minutes | 141 (12.3%) | 296 (19.0%) |
| 90 or more Minutes | 78 (6.8%) | 102 (6.5%) |
Time of Departure to Work by Sex in Marlow Heights
The most frequent times of departure to work in Marlow Heights are 12:00 AM to 4:59 AM (164, 14.3%) for males and 7:00 AM to 7:29 AM (336, 21.5%) for females.
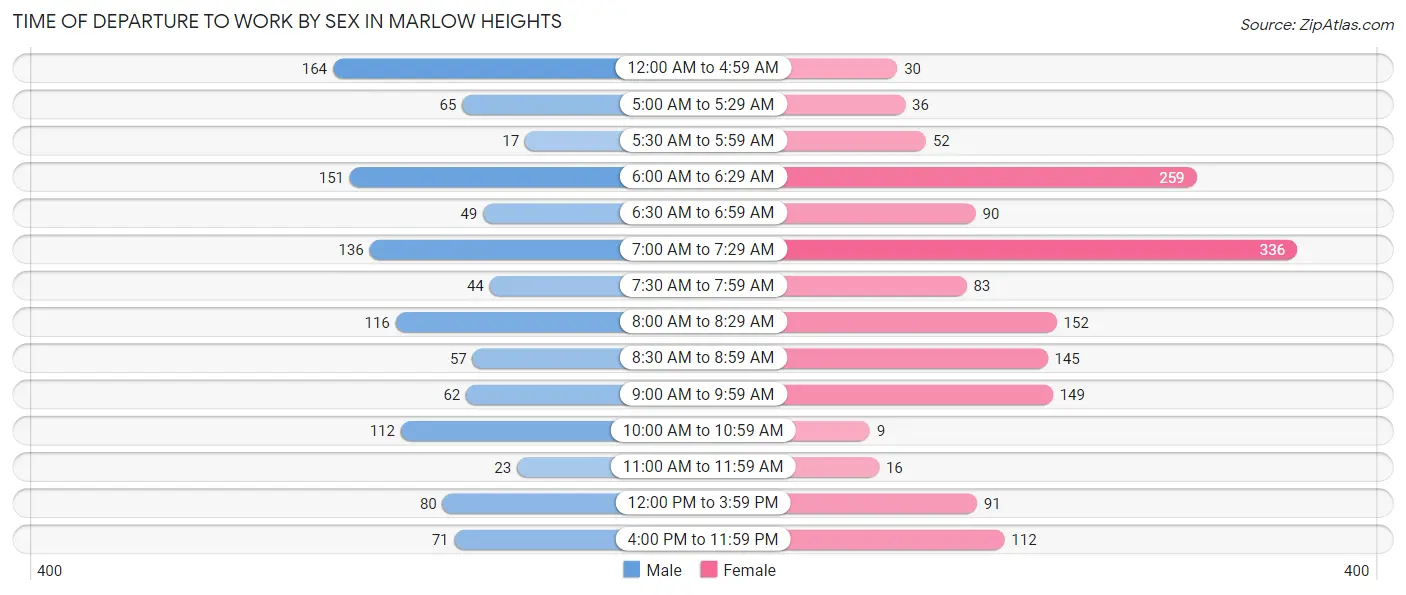
| Time of Departure | Male | Female |
| 12:00 AM to 4:59 AM | 164 (14.3%) | 30 (1.9%) |
| 5:00 AM to 5:29 AM | 65 (5.7%) | 36 (2.3%) |
| 5:30 AM to 5:59 AM | 17 (1.5%) | 52 (3.3%) |
| 6:00 AM to 6:29 AM | 151 (13.2%) | 259 (16.6%) |
| 6:30 AM to 6:59 AM | 49 (4.3%) | 90 (5.8%) |
| 7:00 AM to 7:29 AM | 136 (11.9%) | 336 (21.5%) |
| 7:30 AM to 7:59 AM | 44 (3.8%) | 83 (5.3%) |
| 8:00 AM to 8:29 AM | 116 (10.1%) | 152 (9.7%) |
| 8:30 AM to 8:59 AM | 57 (5.0%) | 145 (9.3%) |
| 9:00 AM to 9:59 AM | 62 (5.4%) | 149 (9.6%) |
| 10:00 AM to 10:59 AM | 112 (9.8%) | 9 (0.6%) |
| 11:00 AM to 11:59 AM | 23 (2.0%) | 16 (1.0%) |
| 12:00 PM to 3:59 PM | 80 (7.0%) | 91 (5.8%) |
| 4:00 PM to 11:59 PM | 71 (6.2%) | 112 (7.2%) |
| Total | 1,147 (100.0%) | 1,560 (100.0%) |
Housing Occupancy in Marlow Heights
Occupancy by Ownership in Marlow Heights
Of the total 2,619 dwellings in Marlow Heights, owner-occupied units account for 1,175 (44.9%), while renter-occupied units make up 1,444 (55.1%).
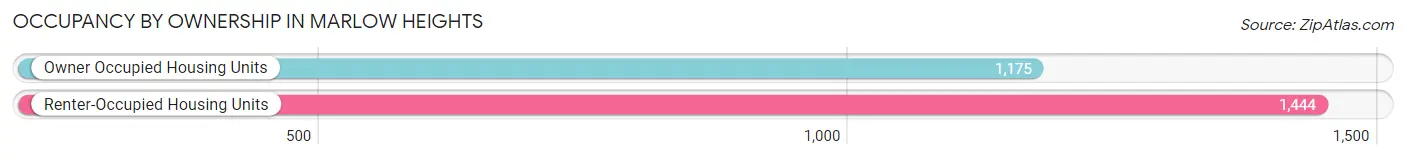
| Occupancy | # Housing Units | % Housing Units |
| Owner Occupied Housing Units | 1,175 | 44.9% |
| Renter-Occupied Housing Units | 1,444 | 55.1% |
| Total Occupied Housing Units | 2,619 | 100.0% |
Occupancy by Household Size in Marlow Heights
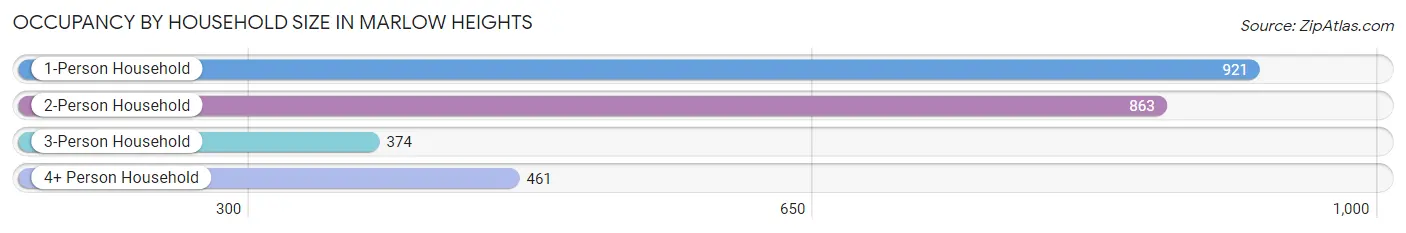
| Household Size | # Housing Units | % Housing Units |
| 1-Person Household | 921 | 35.2% |
| 2-Person Household | 863 | 33.0% |
| 3-Person Household | 374 | 14.3% |
| 4+ Person Household | 461 | 17.6% |
| Total Housing Units | 2,619 | 100.0% |
Occupancy by Ownership by Household Size in Marlow Heights
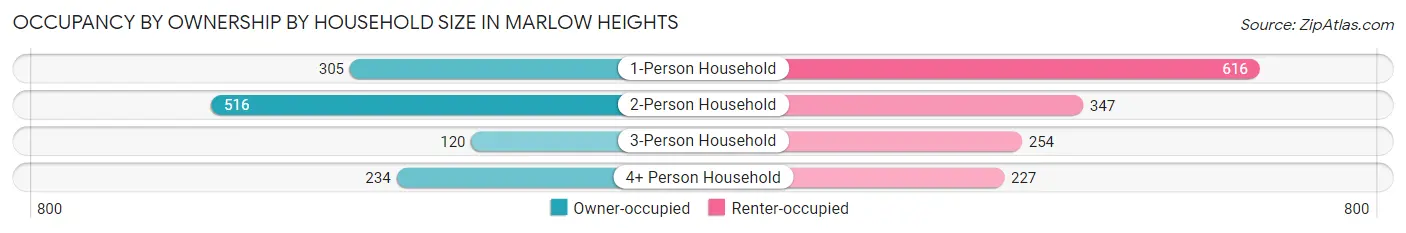
| Household Size | Owner-occupied | Renter-occupied |
| 1-Person Household | 305 (33.1%) | 616 (66.9%) |
| 2-Person Household | 516 (59.8%) | 347 (40.2%) |
| 3-Person Household | 120 (32.1%) | 254 (67.9%) |
| 4+ Person Household | 234 (50.8%) | 227 (49.2%) |
| Total Housing Units | 1,175 (44.9%) | 1,444 (55.1%) |
Occupancy by Educational Attainment in Marlow Heights
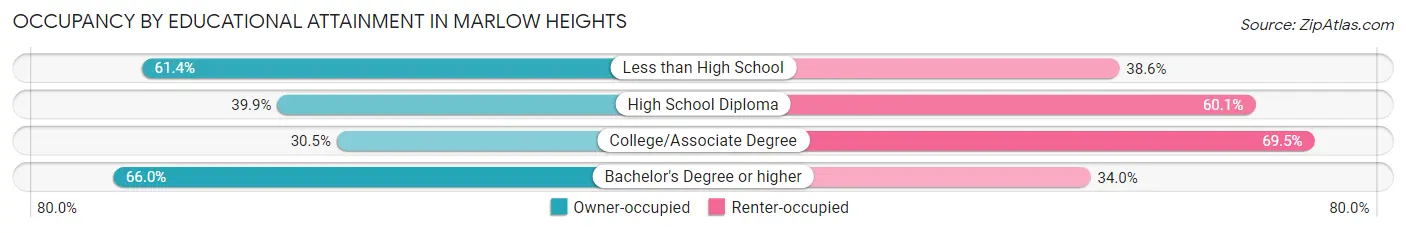
| Household Size | Owner-occupied | Renter-occupied |
| Less than High School | 180 (61.4%) | 113 (38.6%) |
| High School Diploma | 317 (39.9%) | 477 (60.1%) |
| College/Associate Degree | 286 (30.5%) | 652 (69.5%) |
| Bachelor's Degree or higher | 392 (66.0%) | 202 (34.0%) |
Occupancy by Age of Householder in Marlow Heights
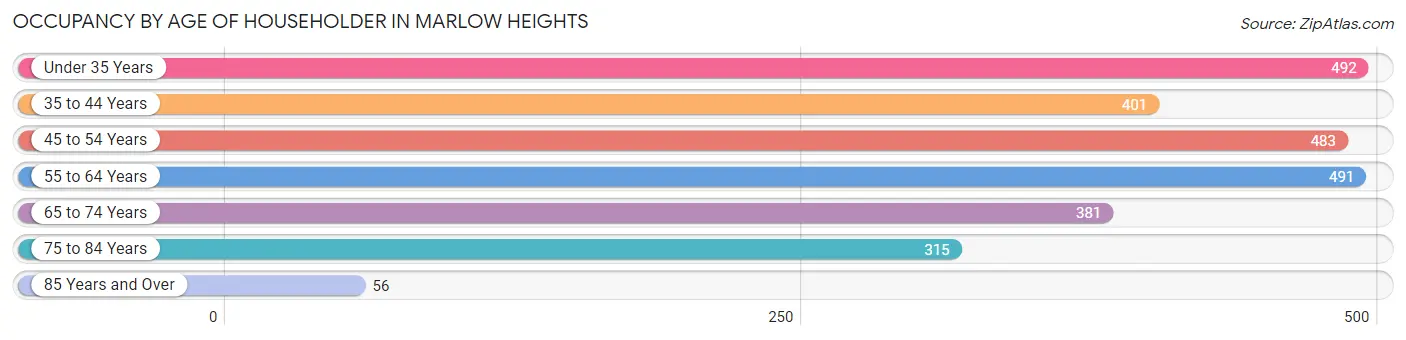
| Age Bracket | # Households | % Households |
| Under 35 Years | 492 | 18.8% |
| 35 to 44 Years | 401 | 15.3% |
| 45 to 54 Years | 483 | 18.4% |
| 55 to 64 Years | 491 | 18.8% |
| 65 to 74 Years | 381 | 14.5% |
| 75 to 84 Years | 315 | 12.0% |
| 85 Years and Over | 56 | 2.1% |
| Total | 2,619 | 100.0% |
Housing Finances in Marlow Heights
Median Income by Occupancy in Marlow Heights
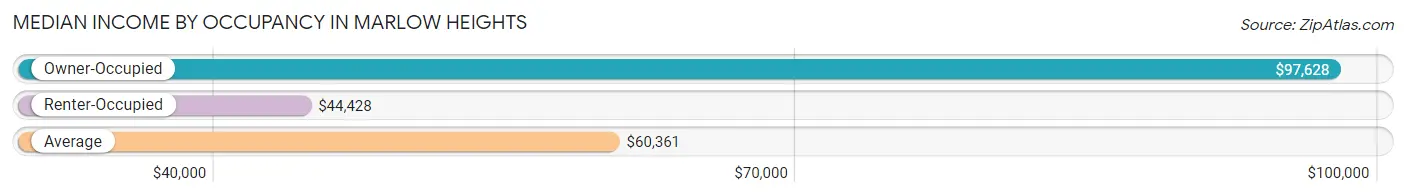
| Occupancy Type | # Households | Median Income |
| Owner-Occupied | 1,175 (44.9%) | $97,628 |
| Renter-Occupied | 1,444 (55.1%) | $44,428 |
| Average | 2,619 (100.0%) | $60,361 |
Occupancy by Householder Income Bracket in Marlow Heights
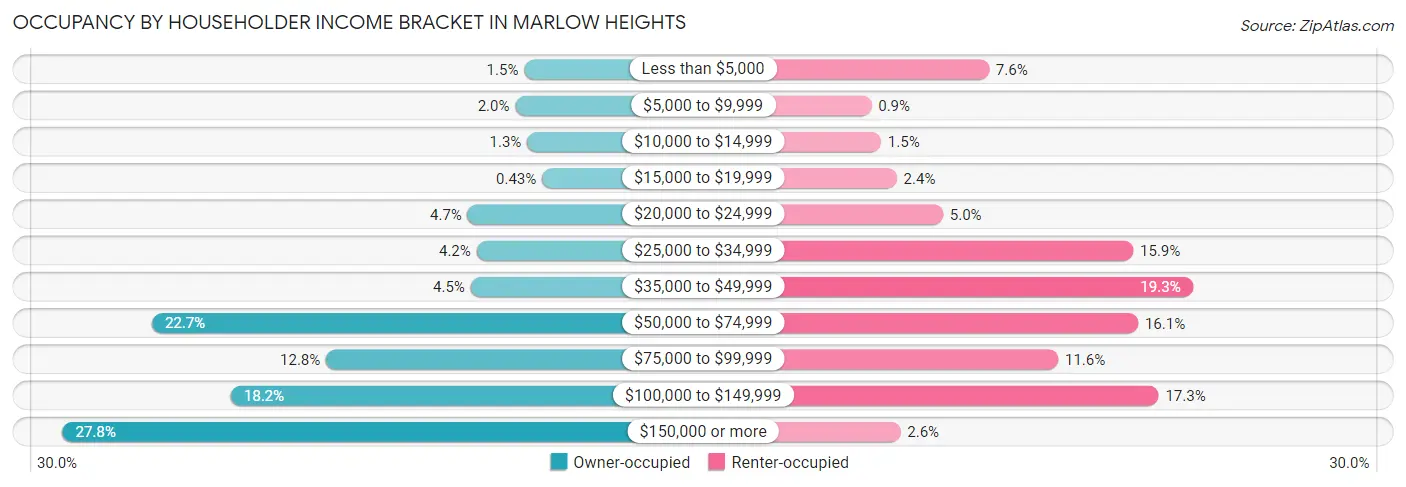
| Income Bracket | Owner-occupied | Renter-occupied |
| Less than $5,000 | 17 (1.5%) | 110 (7.6%) |
| $5,000 to $9,999 | 23 (2.0%) | 13 (0.9%) |
| $10,000 to $14,999 | 15 (1.3%) | 21 (1.5%) |
| $15,000 to $19,999 | 5 (0.4%) | 34 (2.4%) |
| $20,000 to $24,999 | 55 (4.7%) | 72 (5.0%) |
| $25,000 to $34,999 | 49 (4.2%) | 229 (15.9%) |
| $35,000 to $49,999 | 53 (4.5%) | 278 (19.3%) |
| $50,000 to $74,999 | 267 (22.7%) | 233 (16.1%) |
| $75,000 to $99,999 | 150 (12.8%) | 167 (11.6%) |
| $100,000 to $149,999 | 214 (18.2%) | 250 (17.3%) |
| $150,000 or more | 327 (27.8%) | 37 (2.6%) |
| Total | 1,175 (100.0%) | 1,444 (100.0%) |
Monthly Housing Cost Tiers in Marlow Heights
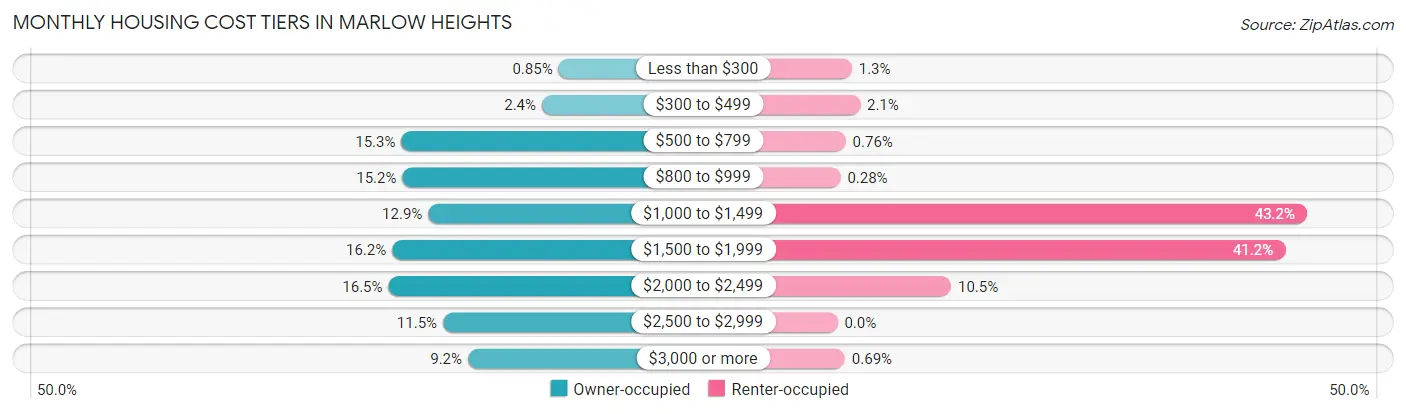
| Monthly Cost | Owner-occupied | Renter-occupied |
| Less than $300 | 10 (0.9%) | 19 (1.3%) |
| $300 to $499 | 28 (2.4%) | 30 (2.1%) |
| $500 to $799 | 180 (15.3%) | 11 (0.8%) |
| $800 to $999 | 179 (15.2%) | 4 (0.3%) |
| $1,000 to $1,499 | 151 (12.9%) | 624 (43.2%) |
| $1,500 to $1,999 | 190 (16.2%) | 595 (41.2%) |
| $2,000 to $2,499 | 194 (16.5%) | 151 (10.5%) |
| $2,500 to $2,999 | 135 (11.5%) | 0 (0.0%) |
| $3,000 or more | 108 (9.2%) | 10 (0.7%) |
| Total | 1,175 (100.0%) | 1,444 (100.0%) |
Physical Housing Characteristics in Marlow Heights
Housing Structures in Marlow Heights
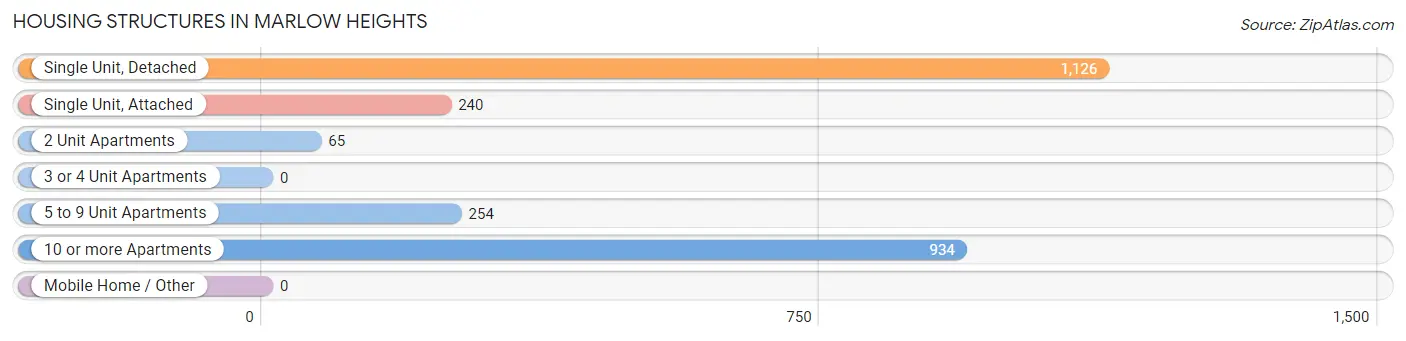
| Structure Type | # Housing Units | % Housing Units |
| Single Unit, Detached | 1,126 | 43.0% |
| Single Unit, Attached | 240 | 9.2% |
| 2 Unit Apartments | 65 | 2.5% |
| 3 or 4 Unit Apartments | 0 | 0.0% |
| 5 to 9 Unit Apartments | 254 | 9.7% |
| 10 or more Apartments | 934 | 35.7% |
| Mobile Home / Other | 0 | 0.0% |
| Total | 2,619 | 100.0% |
Housing Structures by Occupancy in Marlow Heights
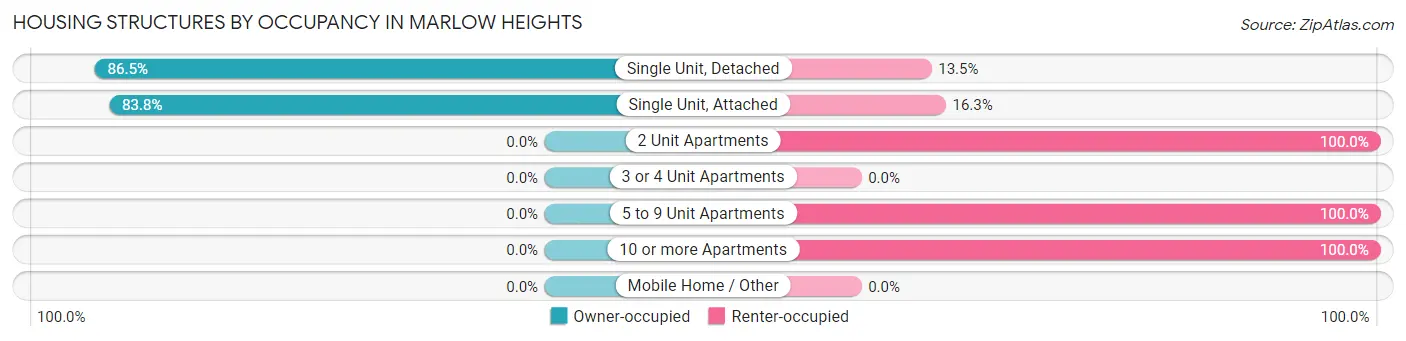
| Structure Type | Owner-occupied | Renter-occupied |
| Single Unit, Detached | 974 (86.5%) | 152 (13.5%) |
| Single Unit, Attached | 201 (83.8%) | 39 (16.3%) |
| 2 Unit Apartments | 0 (0.0%) | 65 (100.0%) |
| 3 or 4 Unit Apartments | 0 (0.0%) | 0 (0.0%) |
| 5 to 9 Unit Apartments | 0 (0.0%) | 254 (100.0%) |
| 10 or more Apartments | 0 (0.0%) | 934 (100.0%) |
| Mobile Home / Other | 0 (0.0%) | 0 (0.0%) |
| Total | 1,175 (44.9%) | 1,444 (55.1%) |
Housing Structures by Number of Rooms in Marlow Heights
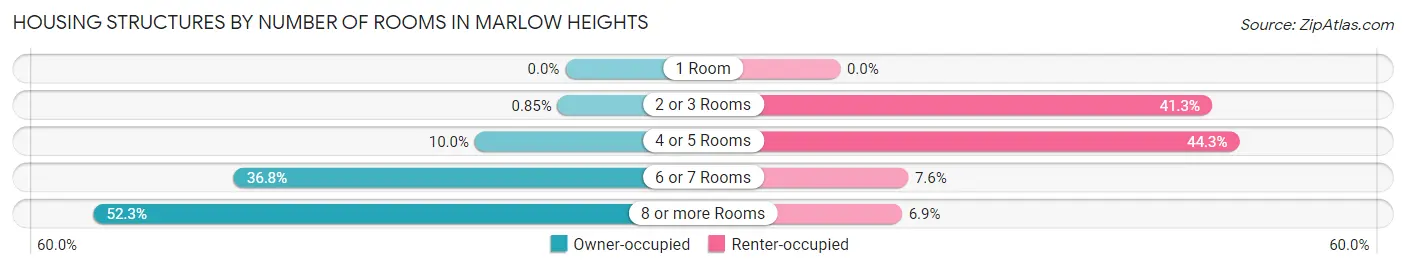
| Number of Rooms | Owner-occupied | Renter-occupied |
| 1 Room | 0 (0.0%) | 0 (0.0%) |
| 2 or 3 Rooms | 10 (0.9%) | 596 (41.3%) |
| 4 or 5 Rooms | 118 (10.0%) | 640 (44.3%) |
| 6 or 7 Rooms | 432 (36.8%) | 109 (7.5%) |
| 8 or more Rooms | 615 (52.3%) | 99 (6.9%) |
| Total | 1,175 (100.0%) | 1,444 (100.0%) |
Housing Structure by Heating Type in Marlow Heights
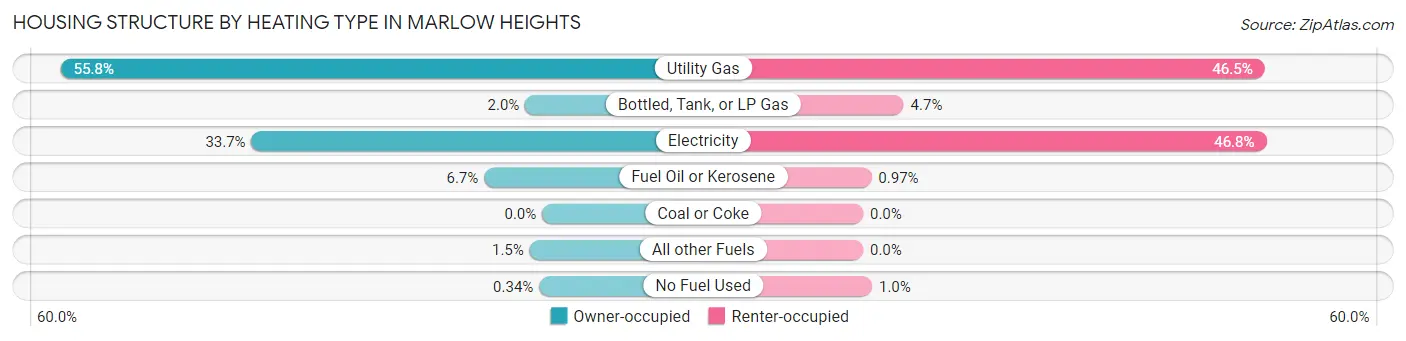
| Heating Type | Owner-occupied | Renter-occupied |
| Utility Gas | 656 (55.8%) | 672 (46.5%) |
| Bottled, Tank, or LP Gas | 23 (2.0%) | 68 (4.7%) |
| Electricity | 396 (33.7%) | 675 (46.8%) |
| Fuel Oil or Kerosene | 79 (6.7%) | 14 (1.0%) |
| Coal or Coke | 0 (0.0%) | 0 (0.0%) |
| All other Fuels | 17 (1.5%) | 0 (0.0%) |
| No Fuel Used | 4 (0.3%) | 15 (1.0%) |
| Total | 1,175 (100.0%) | 1,444 (100.0%) |
Household Vehicle Usage in Marlow Heights
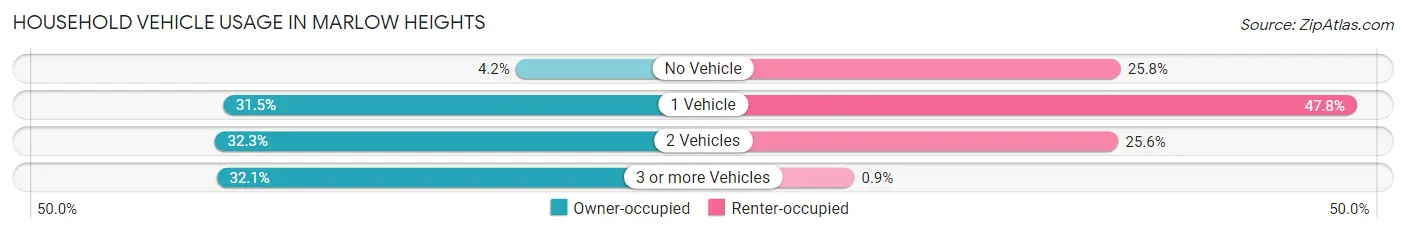
| Vehicles per Household | Owner-occupied | Renter-occupied |
| No Vehicle | 49 (4.2%) | 372 (25.8%) |
| 1 Vehicle | 370 (31.5%) | 690 (47.8%) |
| 2 Vehicles | 379 (32.3%) | 369 (25.6%) |
| 3 or more Vehicles | 377 (32.1%) | 13 (0.9%) |
| Total | 1,175 (100.0%) | 1,444 (100.0%) |
Real Estate & Mortgages in Marlow Heights
Real Estate and Mortgage Overview in Marlow Heights
| Characteristic | Without Mortgage | With Mortgage |
| Housing Units | 384 | 791 |
| Median Property Value | $379,900 | $322,800 |
| Median Household Income | $55,690 | $271 |
| Monthly Housing Costs | $820 | $108 |
| Real Estate Taxes | $3,977 | $7 |
Property Value by Mortgage Status in Marlow Heights
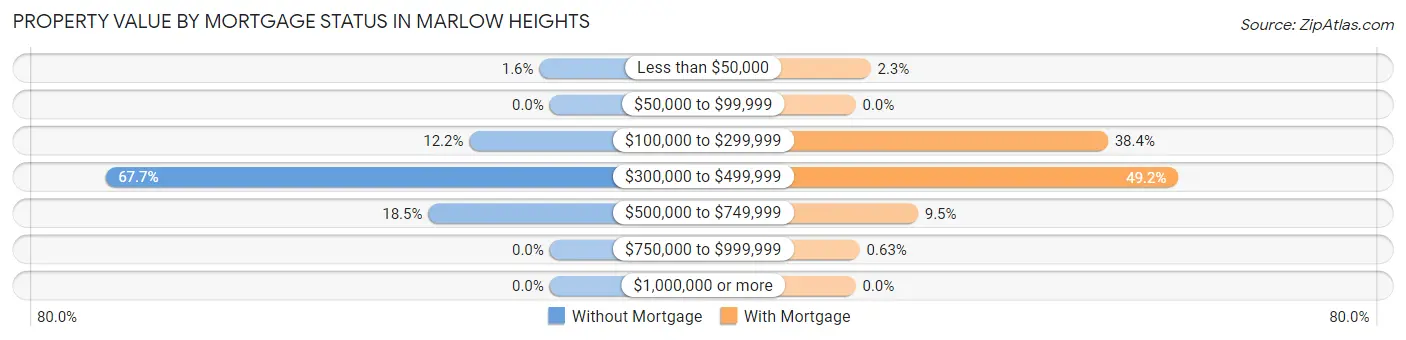
| Property Value | Without Mortgage | With Mortgage |
| Less than $50,000 | 6 (1.6%) | 18 (2.3%) |
| $50,000 to $99,999 | 0 (0.0%) | 0 (0.0%) |
| $100,000 to $299,999 | 47 (12.2%) | 304 (38.4%) |
| $300,000 to $499,999 | 260 (67.7%) | 389 (49.2%) |
| $500,000 to $749,999 | 71 (18.5%) | 75 (9.5%) |
| $750,000 to $999,999 | 0 (0.0%) | 5 (0.6%) |
| $1,000,000 or more | 0 (0.0%) | 0 (0.0%) |
| Total | 384 (100.0%) | 791 (100.0%) |
Household Income by Mortgage Status in Marlow Heights
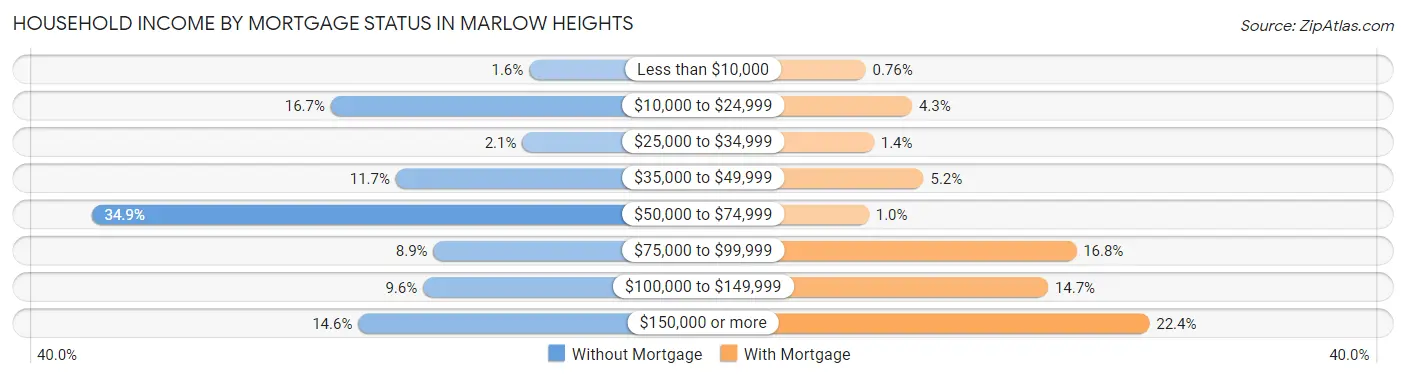
| Household Income | Without Mortgage | With Mortgage |
| Less than $10,000 | 6 (1.6%) | 6 (0.8%) |
| $10,000 to $24,999 | 64 (16.7%) | 34 (4.3%) |
| $25,000 to $34,999 | 8 (2.1%) | 11 (1.4%) |
| $35,000 to $49,999 | 45 (11.7%) | 41 (5.2%) |
| $50,000 to $74,999 | 134 (34.9%) | 8 (1.0%) |
| $75,000 to $99,999 | 34 (8.8%) | 133 (16.8%) |
| $100,000 to $149,999 | 37 (9.6%) | 116 (14.7%) |
| $150,000 or more | 56 (14.6%) | 177 (22.4%) |
| Total | 384 (100.0%) | 791 (100.0%) |
Property Value to Household Income Ratio in Marlow Heights
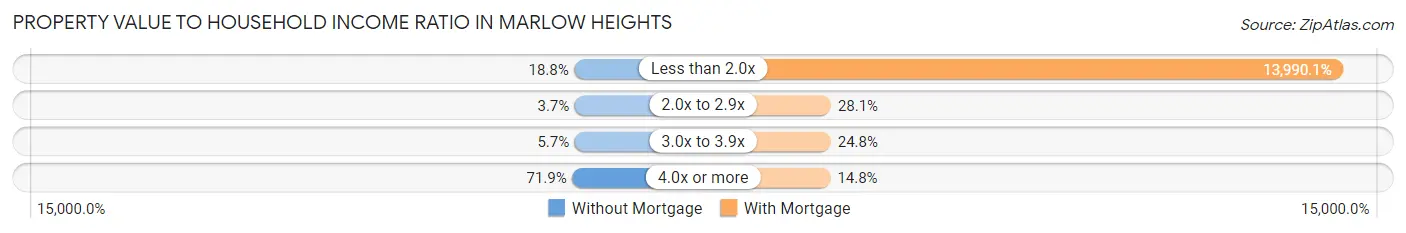
| Value-to-Income Ratio | Without Mortgage | With Mortgage |
| Less than 2.0x | 72 (18.8%) | 110,662 (13,990.1%) |
| 2.0x to 2.9x | 14 (3.6%) | 222 (28.1%) |
| 3.0x to 3.9x | 22 (5.7%) | 196 (24.8%) |
| 4.0x or more | 276 (71.9%) | 117 (14.8%) |
| Total | 384 (100.0%) | 791 (100.0%) |
Real Estate Taxes by Mortgage Status in Marlow Heights
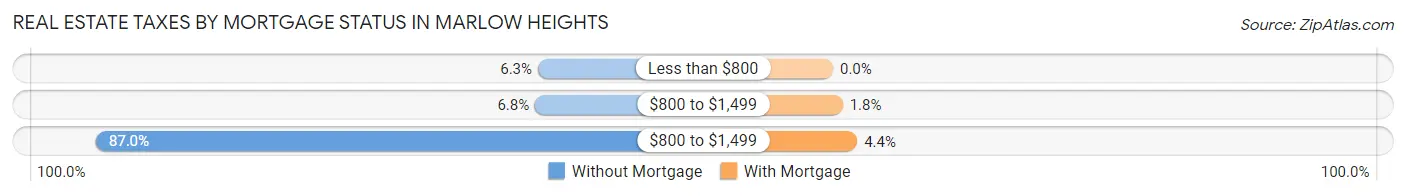
| Property Taxes | Without Mortgage | With Mortgage |
| Less than $800 | 24 (6.2%) | 0 (0.0%) |
| $800 to $1,499 | 26 (6.8%) | 14 (1.8%) |
| $800 to $1,499 | 334 (87.0%) | 35 (4.4%) |
| Total | 384 (100.0%) | 791 (100.0%) |
Health & Disability in Marlow Heights
Health Insurance Coverage by Age in Marlow Heights
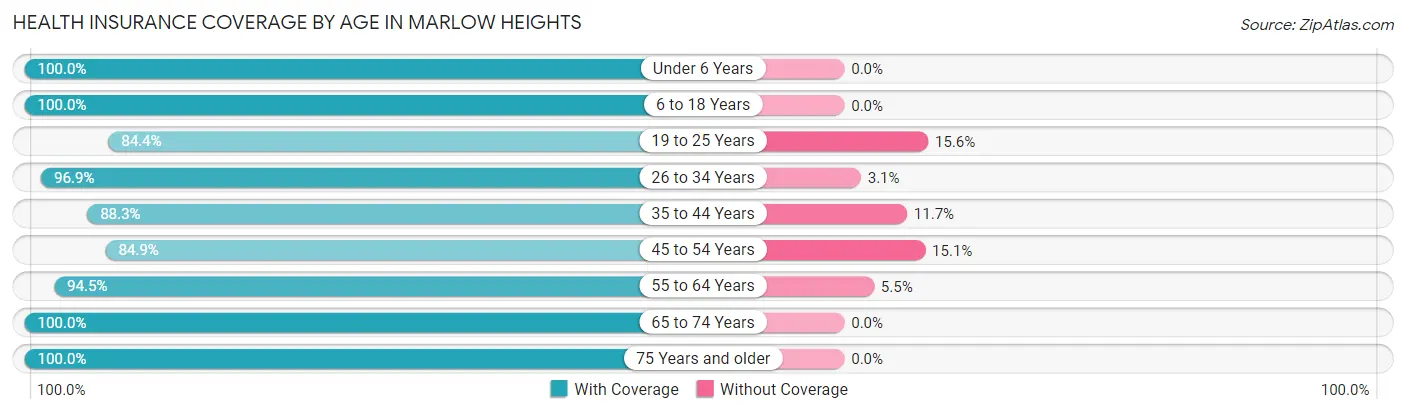
| Age Bracket | With Coverage | Without Coverage |
| Under 6 Years | 414 (100.0%) | 0 (0.0%) |
| 6 to 18 Years | 861 (100.0%) | 0 (0.0%) |
| 19 to 25 Years | 362 (84.4%) | 67 (15.6%) |
| 26 to 34 Years | 975 (96.9%) | 31 (3.1%) |
| 35 to 44 Years | 726 (88.3%) | 96 (11.7%) |
| 45 to 54 Years | 760 (84.9%) | 135 (15.1%) |
| 55 to 64 Years | 719 (94.5%) | 42 (5.5%) |
| 65 to 74 Years | 567 (100.0%) | 0 (0.0%) |
| 75 Years and older | 499 (100.0%) | 0 (0.0%) |
| Total | 5,883 (94.1%) | 371 (5.9%) |
Health Insurance Coverage by Citizenship Status in Marlow Heights
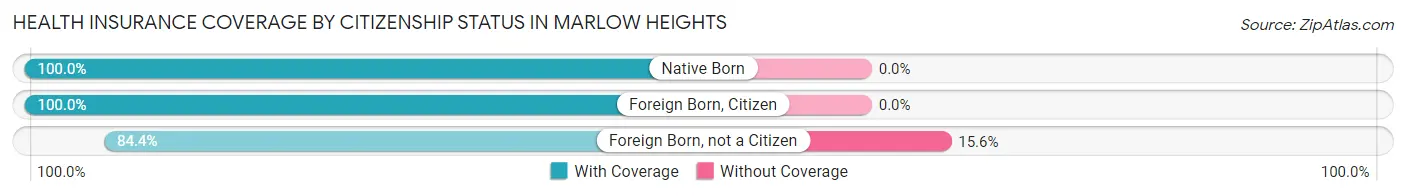
| Citizenship Status | With Coverage | Without Coverage |
| Native Born | 414 (100.0%) | 0 (0.0%) |
| Foreign Born, Citizen | 861 (100.0%) | 0 (0.0%) |
| Foreign Born, not a Citizen | 362 (84.4%) | 67 (15.6%) |
Health Insurance Coverage by Household Income in Marlow Heights
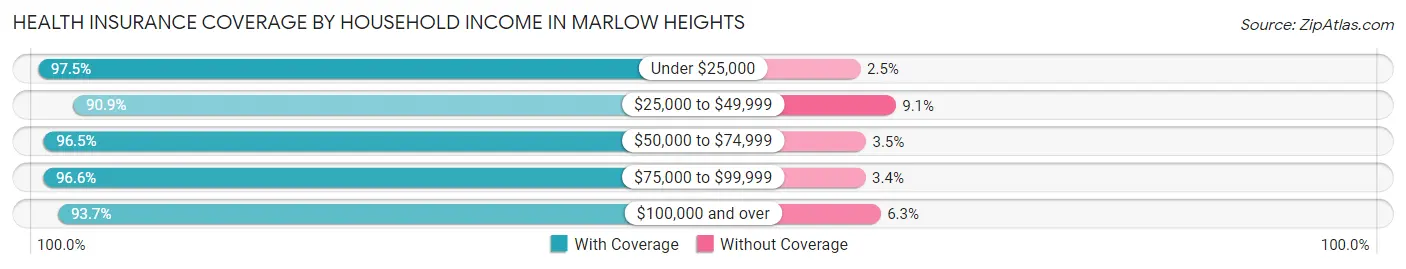
| Household Income | With Coverage | Without Coverage |
| Under $25,000 | 665 (97.5%) | 17 (2.5%) |
| $25,000 to $49,999 | 1,563 (90.9%) | 156 (9.1%) |
| $50,000 to $74,999 | 798 (96.5%) | 29 (3.5%) |
| $75,000 to $99,999 | 673 (96.6%) | 24 (3.4%) |
| $100,000 and over | 2,170 (93.7%) | 145 (6.3%) |
Public vs Private Health Insurance Coverage by Age in Marlow Heights
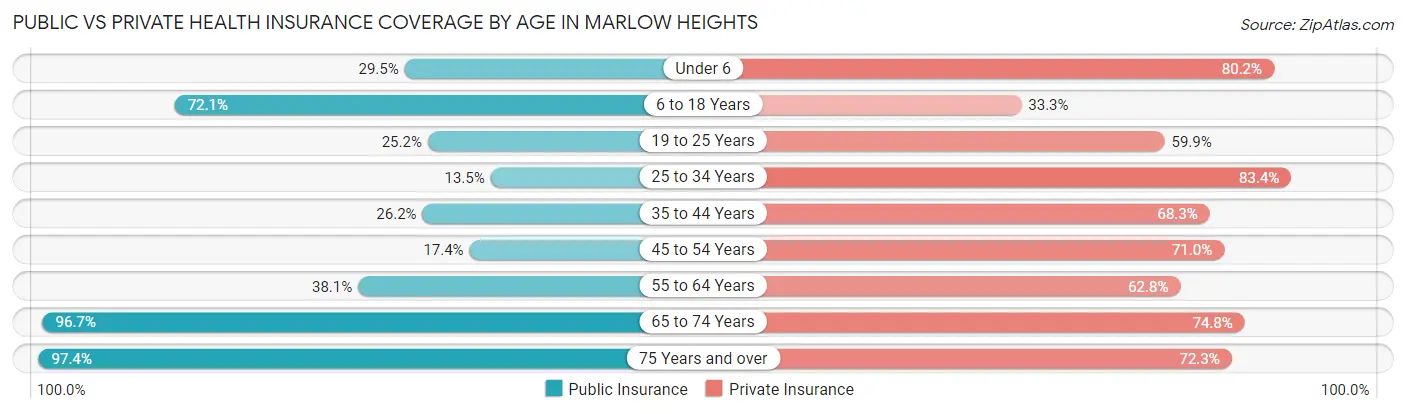
| Age Bracket | Public Insurance | Private Insurance |
| Under 6 | 122 (29.5%) | 332 (80.2%) |
| 6 to 18 Years | 621 (72.1%) | 287 (33.3%) |
| 19 to 25 Years | 108 (25.2%) | 257 (59.9%) |
| 25 to 34 Years | 136 (13.5%) | 839 (83.4%) |
| 35 to 44 Years | 215 (26.2%) | 561 (68.2%) |
| 45 to 54 Years | 156 (17.4%) | 635 (71.0%) |
| 55 to 64 Years | 290 (38.1%) | 478 (62.8%) |
| 65 to 74 Years | 548 (96.7%) | 424 (74.8%) |
| 75 Years and over | 486 (97.4%) | 361 (72.3%) |
| Total | 2,682 (42.9%) | 4,174 (66.7%) |
Disability Status by Sex by Age in Marlow Heights
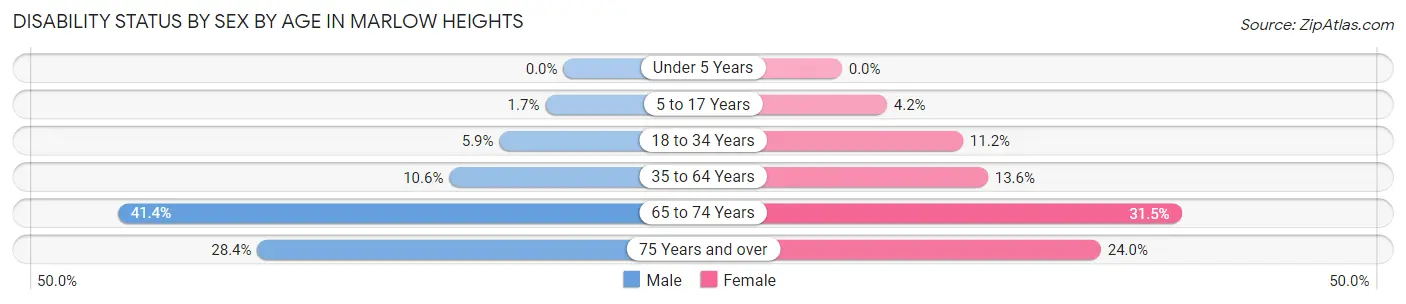
| Age Bracket | Male | Female |
| Under 5 Years | 0 (0.0%) | 0 (0.0%) |
| 5 to 17 Years | 9 (1.7%) | 14 (4.2%) |
| 18 to 34 Years | 46 (5.9%) | 77 (11.2%) |
| 35 to 64 Years | 103 (10.6%) | 204 (13.6%) |
| 65 to 74 Years | 98 (41.3%) | 104 (31.5%) |
| 75 Years and over | 46 (28.4%) | 81 (24.0%) |
Disability Class by Sex by Age in Marlow Heights
Disability Class: Hearing Difficulty
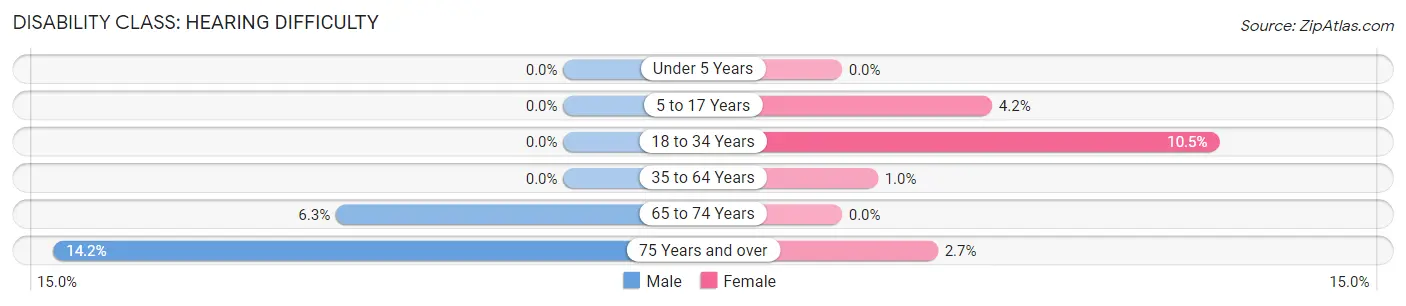
| Age Bracket | Male | Female |
| Under 5 Years | 0 (0.0%) | 0 (0.0%) |
| 5 to 17 Years | 0 (0.0%) | 14 (4.2%) |
| 18 to 34 Years | 0 (0.0%) | 72 (10.5%) |
| 35 to 64 Years | 0 (0.0%) | 15 (1.0%) |
| 65 to 74 Years | 15 (6.3%) | 0 (0.0%) |
| 75 Years and over | 23 (14.2%) | 9 (2.7%) |
Disability Class: Vision Difficulty
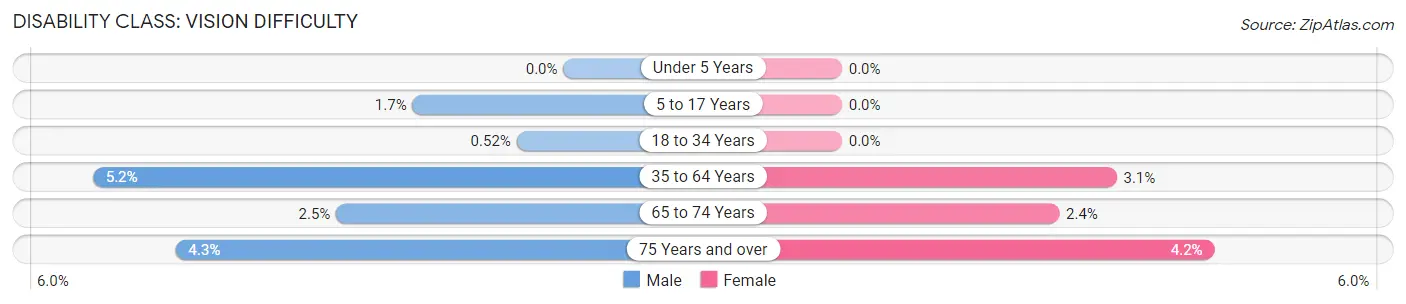
| Age Bracket | Male | Female |
| Under 5 Years | 0 (0.0%) | 0 (0.0%) |
| 5 to 17 Years | 9 (1.7%) | 0 (0.0%) |
| 18 to 34 Years | 4 (0.5%) | 0 (0.0%) |
| 35 to 64 Years | 51 (5.2%) | 46 (3.1%) |
| 65 to 74 Years | 6 (2.5%) | 8 (2.4%) |
| 75 Years and over | 7 (4.3%) | 14 (4.2%) |
Disability Class: Cognitive Difficulty
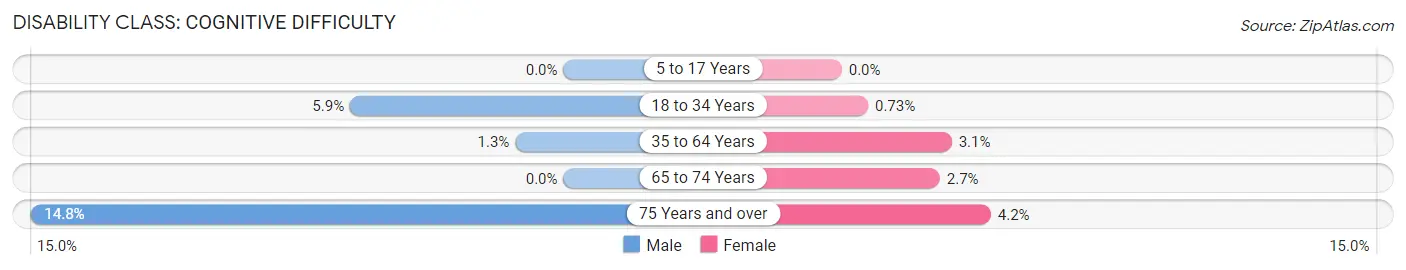
| Age Bracket | Male | Female |
| 5 to 17 Years | 0 (0.0%) | 0 (0.0%) |
| 18 to 34 Years | 46 (5.9%) | 5 (0.7%) |
| 35 to 64 Years | 13 (1.3%) | 46 (3.1%) |
| 65 to 74 Years | 0 (0.0%) | 9 (2.7%) |
| 75 Years and over | 24 (14.8%) | 14 (4.2%) |
Disability Class: Ambulatory Difficulty
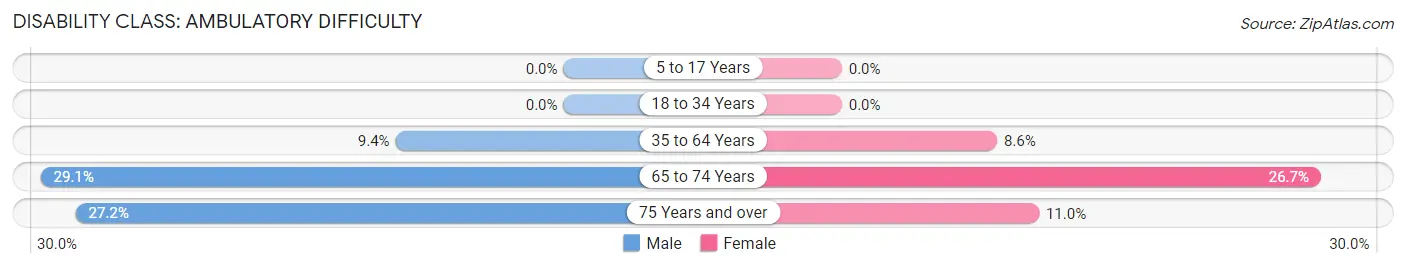
| Age Bracket | Male | Female |
| 5 to 17 Years | 0 (0.0%) | 0 (0.0%) |
| 18 to 34 Years | 0 (0.0%) | 0 (0.0%) |
| 35 to 64 Years | 91 (9.3%) | 130 (8.6%) |
| 65 to 74 Years | 69 (29.1%) | 88 (26.7%) |
| 75 Years and over | 44 (27.2%) | 37 (11.0%) |
Disability Class: Self-Care Difficulty
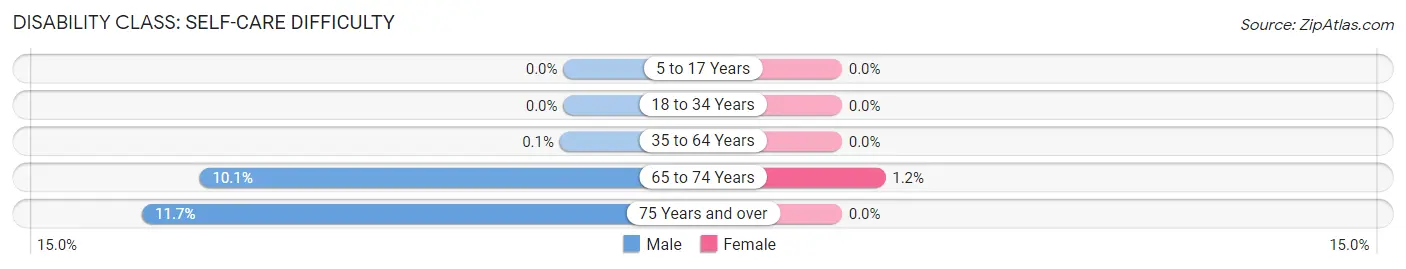
| Age Bracket | Male | Female |
| 5 to 17 Years | 0 (0.0%) | 0 (0.0%) |
| 18 to 34 Years | 0 (0.0%) | 0 (0.0%) |
| 35 to 64 Years | 1 (0.1%) | 0 (0.0%) |
| 65 to 74 Years | 24 (10.1%) | 4 (1.2%) |
| 75 Years and over | 19 (11.7%) | 0 (0.0%) |
Technology Access in Marlow Heights
Computing Device Access in Marlow Heights
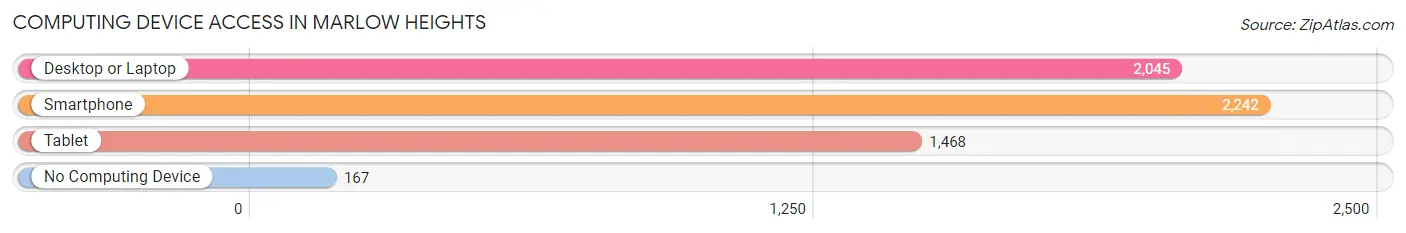
| Device Type | # Households | % Households |
| Desktop or Laptop | 2,045 | 78.1% |
| Smartphone | 2,242 | 85.6% |
| Tablet | 1,468 | 56.0% |
| No Computing Device | 167 | 6.4% |
| Total | 2,619 | 100.0% |
Internet Access in Marlow Heights
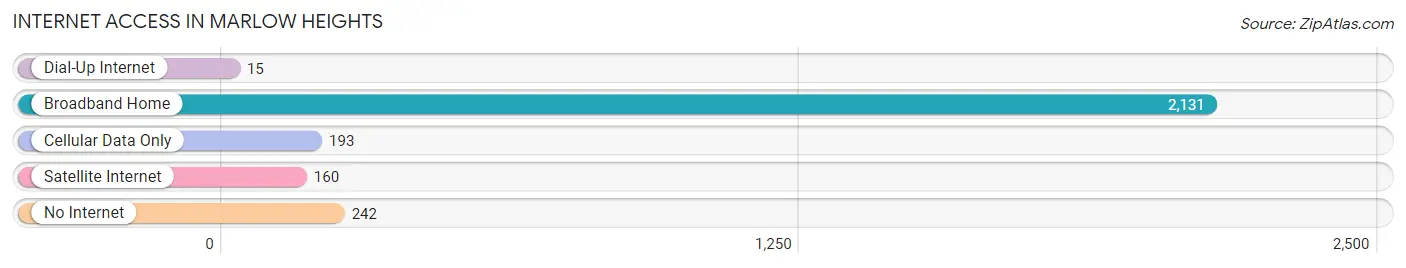
| Internet Type | # Households | % Households |
| Dial-Up Internet | 15 | 0.6% |
| Broadband Home | 2,131 | 81.4% |
| Cellular Data Only | 193 | 7.4% |
| Satellite Internet | 160 | 6.1% |
| No Internet | 242 | 9.2% |
| Total | 2,619 | 100.0% |
Marlow Heights Summary
Marlow Heights is a census-designated place (CDP) located in Prince George’s County, Maryland, United States. The population was 8,845 at the 2010 census. It is located near the Washington, D.C. border and is part of the Washington metropolitan area.
History
Marlow Heights was originally part of the Marlow Plantation, which was established in the early 1700s. The plantation was owned by the Marlow family until the early 1900s, when it was sold to developers. The area was developed in the 1950s and 1960s as a residential community.
Geography
Marlow Heights is located at 38°48'17" North, 76°55'45" West (38.804722, -76.929167). According to the United States Census Bureau, the CDP has a total area of 2.2 square miles (5.7 km2), all of it land.
Economy
Marlow Heights is home to several businesses, including a Walmart Supercenter, a Giant Food grocery store, and a variety of restaurants and retail stores. The area is also home to several government offices, including the Prince George’s County Police Department and the Prince George’s County Fire and Rescue Department.
Demographics
As of the census of 2000, there were 8,845 people, 3,541 households, and 2,092 families residing in the CDP. The population density was 4,039.2 people per square mile (1,561.2/km2). There were 3,717 housing units at an average density of 1,683.3/sq mi (650.2/km2). The racial makeup of the CDP was 28.2% White, 57.2% African American, 0.3% Native American, 5.2% Asian, 0.1% Pacific Islander, 5.2% from other races, and 4.0% from two or more races. Hispanic or Latino of any race were 10.2% of the population.
There were 3,541 households, out of which 33.2% had children under the age of 18 living with them, 33.2% were married couples living together, 22.2% had a female householder with no husband present, and 38.2% were non-families. 30.2% of all households were made up of individuals, and 6.2% had someone living alone who was 65 years of age or older. The average household size was 2.50 and the average family size was 3.14.
In the CDP, the population was spread out, with 26.2% under the age of 18, 10.2% from 18 to 24, 35.2% from 25 to 44, 19.2% from 45 to 64, and 9.2% who were 65 years of age or older. The median age was 33 years. For every 100 females, there were 91.2 males. For every 100 females age 18 and over, there were 87.2 males.
The median income for a household in the CDP was $41,944, and the median income for a family was $45,938. Males had a median income of $32,917 versus $30,917 for females. The per capita income for the CDP was $19,945. About 8.2% of families and 10.2% of the population were below the poverty line, including 14.2% of those under age 18 and 8.2% of those age 65 or over.
Common Questions
What is Per Capita Income in Marlow Heights?
Per Capita income in Marlow Heights is $37,130.
What is the Median Family Income in Marlow Heights?
Median Family Income in Marlow Heights is $81,250.
What is the Median Household income in Marlow Heights?
Median Household Income in Marlow Heights is $60,361.
What is Income or Wage Gap in Marlow Heights?
Income or Wage Gap in Marlow Heights is 17.8%.
Women in Marlow Heights earn 82.2 cents for every dollar earned by a man.
What is Family Income Deficit in Marlow Heights?
Family Income Deficit in Marlow Heights is $5,724.
Families that are below poverty line in Marlow Heights earn $5,724 less on average than the poverty threshold level.
What is Inequality or Gini Index in Marlow Heights?
Inequality or Gini Index in Marlow Heights is 0.43.
What is the Total Population of Marlow Heights?
Total Population of Marlow Heights is 6,254.
What is the Total Male Population of Marlow Heights?
Total Male Population of Marlow Heights is 3,000.
What is the Total Female Population of Marlow Heights?
Total Female Population of Marlow Heights is 3,254.
What is the Ratio of Males per 100 Females in Marlow Heights?
There are 92.19 Males per 100 Females in Marlow Heights.
What is the Ratio of Females per 100 Males in Marlow Heights?
There are 108.47 Females per 100 Males in Marlow Heights.
What is the Median Population Age in Marlow Heights?
Median Population Age in Marlow Heights is 40.1 Years.
What is the Average Family Size in Marlow Heights
Average Family Size in Marlow Heights is 3.1 People.
What is the Average Household Size in Marlow Heights
Average Household Size in Marlow Heights is 2.4 People.
How Large is the Labor Force in Marlow Heights?
There are 3,362 People in the Labor Forcein in Marlow Heights.
What is the Percentage of People in the Labor Force in Marlow Heights?
66.5% of People are in the Labor Force in Marlow Heights.
What is the Unemployment Rate in Marlow Heights?
Unemployment Rate in Marlow Heights is 12.9%.