Riviera Beach, MD Map & Demographics
Riviera Beach Map
Riviera Beach Overview
$45,069
PER CAPITA INCOME
$114,773
AVG FAMILY INCOME
$105,242
AVG HOUSEHOLD INCOME
14.9%
WAGE / INCOME GAP [ % ]
85.1¢/ $1
WAGE / INCOME GAP [ $ ]
0.35
INEQUALITY / GINI INDEX
12,121
TOTAL POPULATION
5,275
MALE POPULATION
6,846
FEMALE POPULATION
77.05
MALES / 100 FEMALES
129.78
FEMALES / 100 MALES
38.8
MEDIAN AGE
3.2
AVG FAMILY SIZE
2.6
AVG HOUSEHOLD SIZE
6,835
LABOR FORCE [ PEOPLE ]
70.7%
PERCENT IN LABOR FORCE
5.2%
UNEMPLOYMENT RATE
Income in Riviera Beach
Income Overview in Riviera Beach
Per Capita Income in Riviera Beach is $45,069, while median incomes of families and households are $114,773 and $105,242 respectively.
| Characteristic | Number | Measure |
| Per Capita Income | 12,121 | $45,069 |
| Median Family Income | 3,044 | $114,773 |
| Mean Family Income | 3,044 | $128,347 |
| Median Household Income | 4,569 | $105,242 |
| Mean Household Income | 4,569 | $114,924 |
| Income Deficit | 3,044 | $0 |
| Wage / Income Gap (%) | 12,121 | 14.92% |
| Wage / Income Gap ($) | 12,121 | 85.08¢ per $1 |
| Gini / Inequality Index | 12,121 | 0.35 |
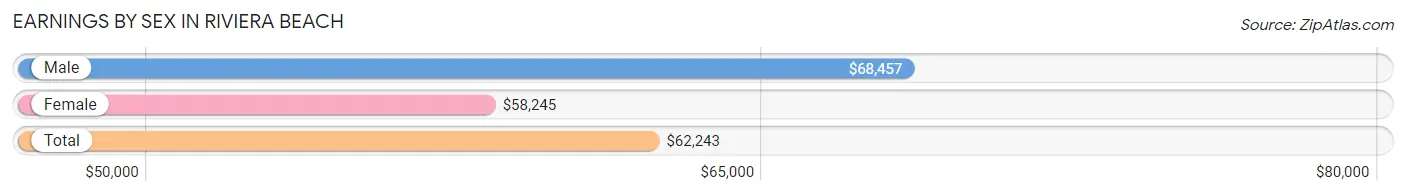
Earnings by Sex in Riviera Beach
Average Earnings in Riviera Beach are $62,243, $68,457 for men and $58,245 for women, a difference of 14.9%.
| Sex | Number | Average Earnings |
| Male | 3,700 (53.5%) | $68,457 |
| Female | 3,212 (46.5%) | $58,245 |
| Total | 6,912 (100.0%) | $62,243 |
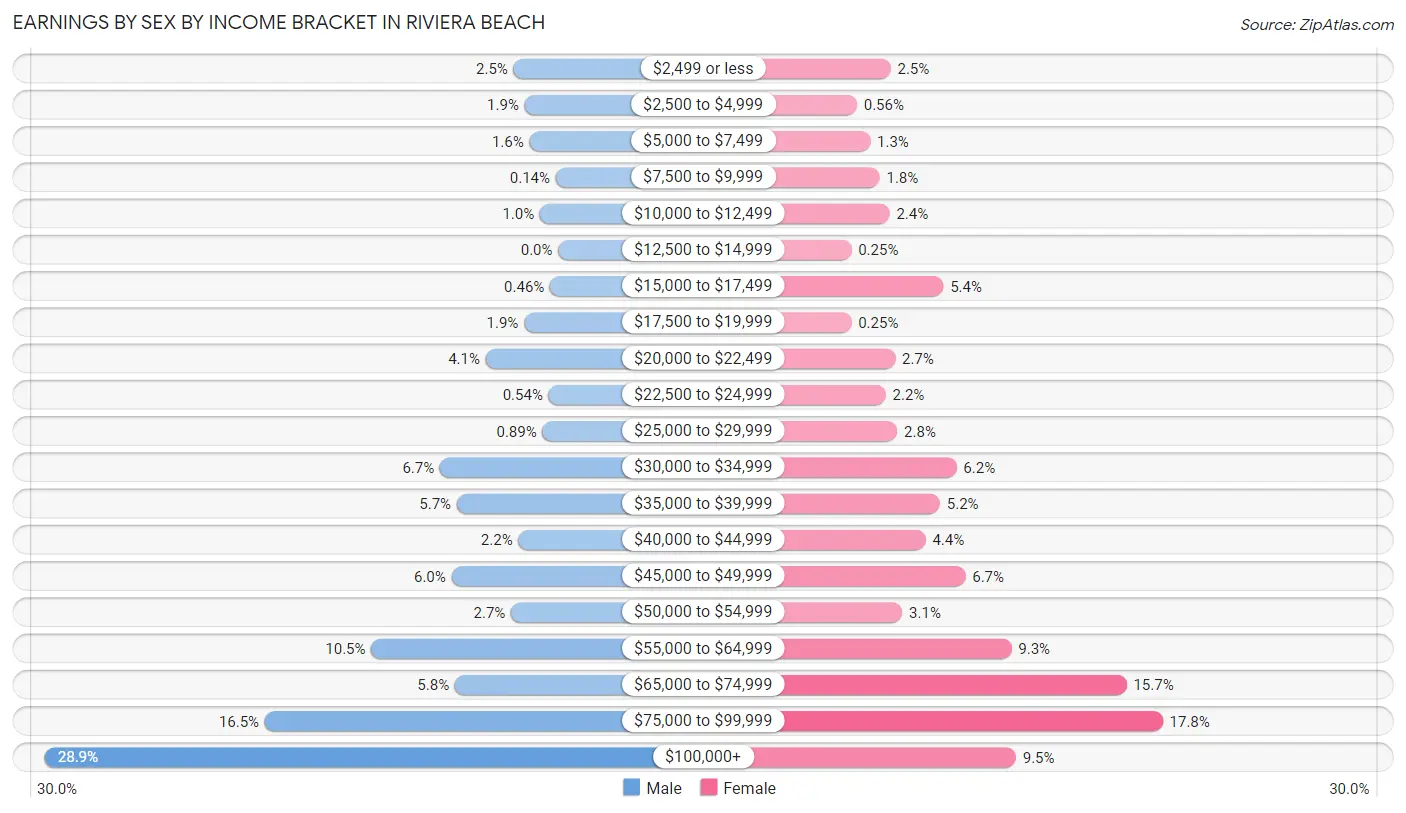
Earnings by Sex by Income Bracket in Riviera Beach
The most common earnings brackets in Riviera Beach are $100,000+ for men (1,068 | 28.9%) and $75,000 to $99,999 for women (570 | 17.7%).
| Income | Male | Female |
| $2,499 or less | 93 (2.5%) | 79 (2.5%) |
| $2,500 to $4,999 | 70 (1.9%) | 18 (0.6%) |
| $5,000 to $7,499 | 60 (1.6%) | 42 (1.3%) |
| $7,500 to $9,999 | 5 (0.1%) | 59 (1.8%) |
| $10,000 to $12,499 | 38 (1.0%) | 77 (2.4%) |
| $12,500 to $14,999 | 0 (0.0%) | 8 (0.3%) |
| $15,000 to $17,499 | 17 (0.5%) | 174 (5.4%) |
| $17,500 to $19,999 | 71 (1.9%) | 8 (0.3%) |
| $20,000 to $22,499 | 151 (4.1%) | 87 (2.7%) |
| $22,500 to $24,999 | 20 (0.5%) | 70 (2.2%) |
| $25,000 to $29,999 | 33 (0.9%) | 91 (2.8%) |
| $30,000 to $34,999 | 246 (6.7%) | 198 (6.2%) |
| $35,000 to $39,999 | 211 (5.7%) | 168 (5.2%) |
| $40,000 to $44,999 | 83 (2.2%) | 142 (4.4%) |
| $45,000 to $49,999 | 222 (6.0%) | 214 (6.7%) |
| $50,000 to $54,999 | 98 (2.6%) | 100 (3.1%) |
| $55,000 to $64,999 | 389 (10.5%) | 297 (9.2%) |
| $65,000 to $74,999 | 215 (5.8%) | 505 (15.7%) |
| $75,000 to $99,999 | 610 (16.5%) | 570 (17.7%) |
| $100,000+ | 1,068 (28.9%) | 305 (9.5%) |
| Total | 3,700 (100.0%) | 3,212 (100.0%) |
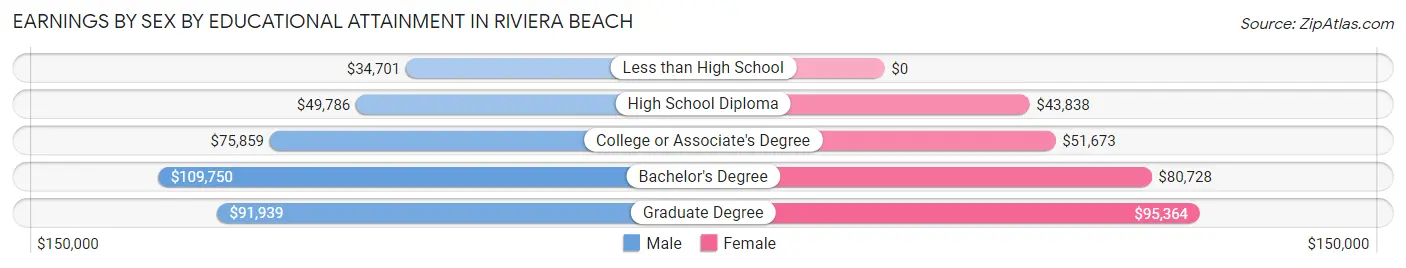
Earnings by Sex by Educational Attainment in Riviera Beach
Average earnings in Riviera Beach are $72,173 for men and $60,907 for women, a difference of 15.6%. Men with an educational attainment of bachelor's degree enjoy the highest average annual earnings of $109,750, while those with less than high school education earn the least with $34,701. Women with an educational attainment of graduate degree earn the most with the average annual earnings of $95,364, while those with high school diploma education have the smallest earnings of $43,838.
| Educational Attainment | Male Income | Female Income |
| Less than High School | $34,701 | $0 |
| High School Diploma | $49,786 | $43,838 |
| College or Associate's Degree | $75,859 | $51,673 |
| Bachelor's Degree | $109,750 | $80,728 |
| Graduate Degree | $91,939 | $95,364 |
| Total | $72,173 | $60,907 |
Family Income in Riviera Beach
Family Income Brackets in Riviera Beach
According to the Riviera Beach family income data, there are 685 families falling into the $100,000 to $149,999 income range, which is the most common income bracket and makes up 22.5% of all families. Conversely, the $25,000 to $34,999 income bracket is the least frequent group with only 33 families (1.1%) belonging to this category.
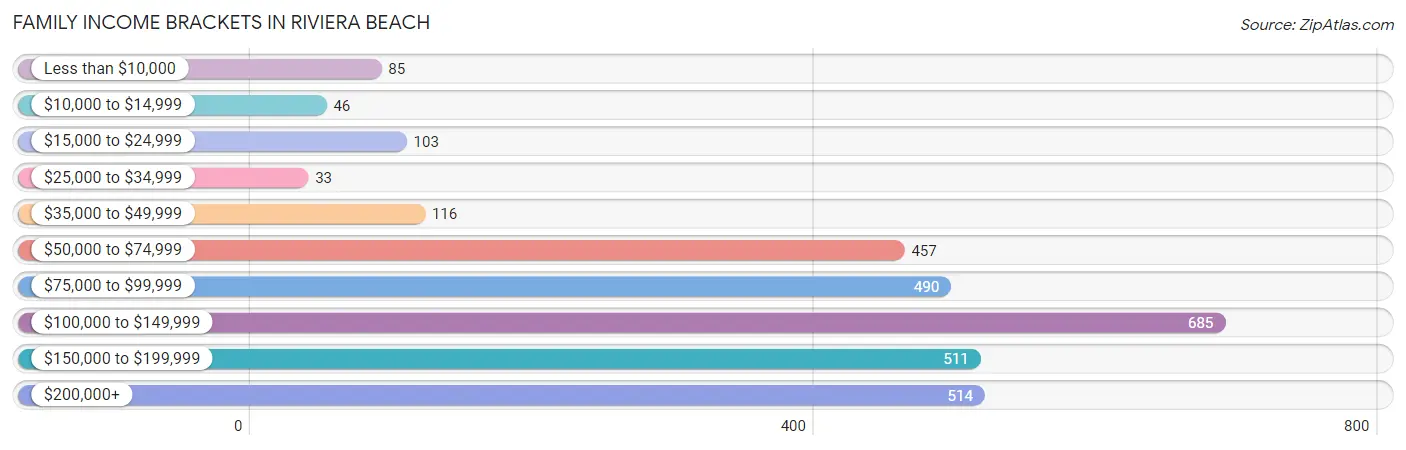
| Income Bracket | # Families | % Families |
| Less than $10,000 | 85 | 2.8% |
| $10,000 to $14,999 | 46 | 1.5% |
| $15,000 to $24,999 | 103 | 3.4% |
| $25,000 to $34,999 | 33 | 1.1% |
| $35,000 to $49,999 | 116 | 3.8% |
| $50,000 to $74,999 | 457 | 15.0% |
| $75,000 to $99,999 | 490 | 16.1% |
| $100,000 to $149,999 | 685 | 22.5% |
| $150,000 to $199,999 | 511 | 16.8% |
| $200,000+ | 514 | 16.9% |
Family Income by Famaliy Size in Riviera Beach
4-person families (616 | 20.2%) account for the highest median family income in Riviera Beach with $152,414 per family, while 3-person families (915 | 30.1%) have the highest median income of $42,535 per family member.
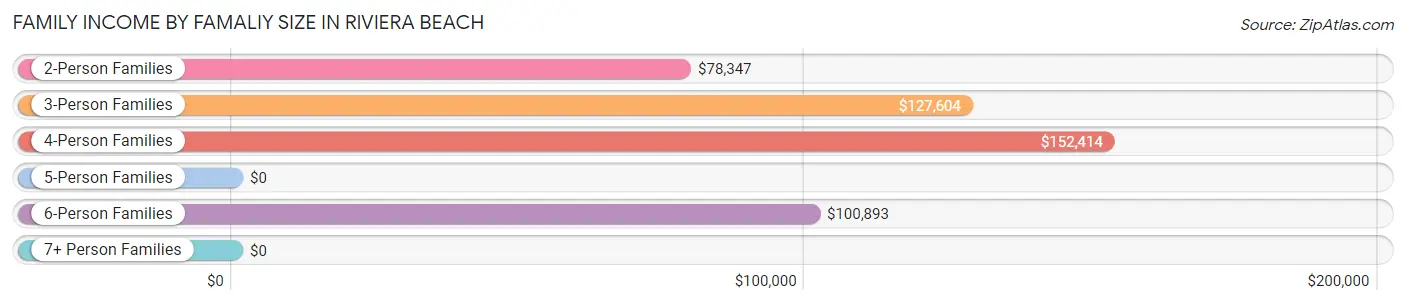
| Income Bracket | # Families | Median Income |
| 2-Person Families | 1,265 (41.6%) | $78,347 |
| 3-Person Families | 915 (30.1%) | $127,604 |
| 4-Person Families | 616 (20.2%) | $152,414 |
| 5-Person Families | 165 (5.4%) | $0 |
| 6-Person Families | 76 (2.5%) | $100,893 |
| 7+ Person Families | 7 (0.2%) | $0 |
| Total | 3,044 (100.0%) | $114,773 |
Family Income by Number of Earners in Riviera Beach
The median family income in Riviera Beach is $114,773, with families comprising 3+ earners (373) having the highest median family income of $214,821, while families with no earners (257) have the lowest median family income of $69,188, accounting for 12.2% and 8.4% of families, respectively.
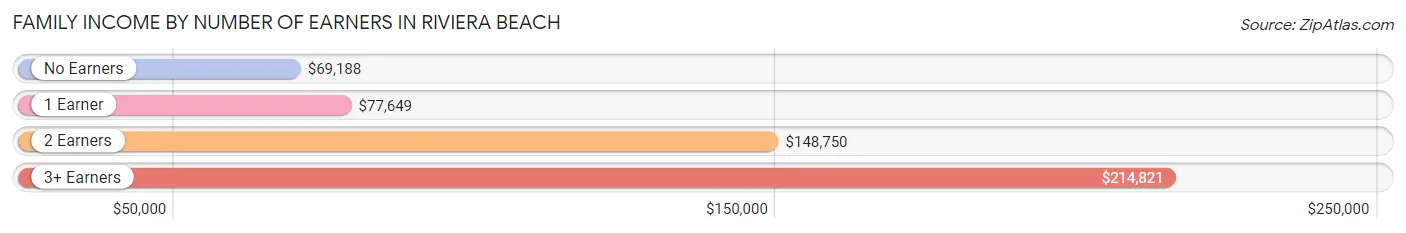
| Number of Earners | # Families | Median Income |
| No Earners | 257 (8.4%) | $69,188 |
| 1 Earner | 1,156 (38.0%) | $77,649 |
| 2 Earners | 1,258 (41.3%) | $148,750 |
| 3+ Earners | 373 (12.2%) | $214,821 |
| Total | 3,044 (100.0%) | $114,773 |
Household Income in Riviera Beach
Household Income Brackets in Riviera Beach
With 1,243 households falling in the category, the $100,000 to $149,999 income range is the most frequent in Riviera Beach, accounting for 27.2% of all households. In contrast, only 18 households (0.4%) fall into the $10,000 to $14,999 income bracket, making it the least populous group.
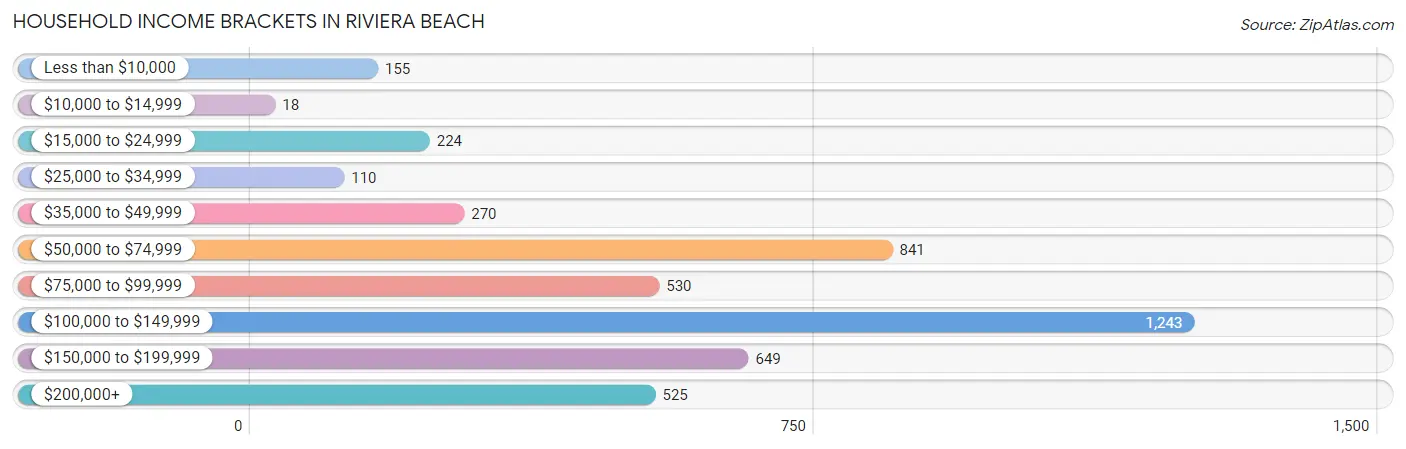
| Income Bracket | # Households | % Households |
| Less than $10,000 | 155 | 3.4% |
| $10,000 to $14,999 | 18 | 0.4% |
| $15,000 to $24,999 | 224 | 4.9% |
| $25,000 to $34,999 | 110 | 2.4% |
| $35,000 to $49,999 | 270 | 5.9% |
| $50,000 to $74,999 | 841 | 18.4% |
| $75,000 to $99,999 | 530 | 11.6% |
| $100,000 to $149,999 | 1,243 | 27.2% |
| $150,000 to $199,999 | 649 | 14.2% |
| $200,000+ | 525 | 11.5% |
Household Income by Householder Age in Riviera Beach
The median household income in Riviera Beach is $105,242, with the highest median household income of $119,242 found in the 15 to 24 years age bracket for the primary householder. A total of 102 households (2.2%) fall into this category. Meanwhile, the 65+ years age bracket for the primary householder has the lowest median household income of $67,031, with 945 households (20.7%) in this group.
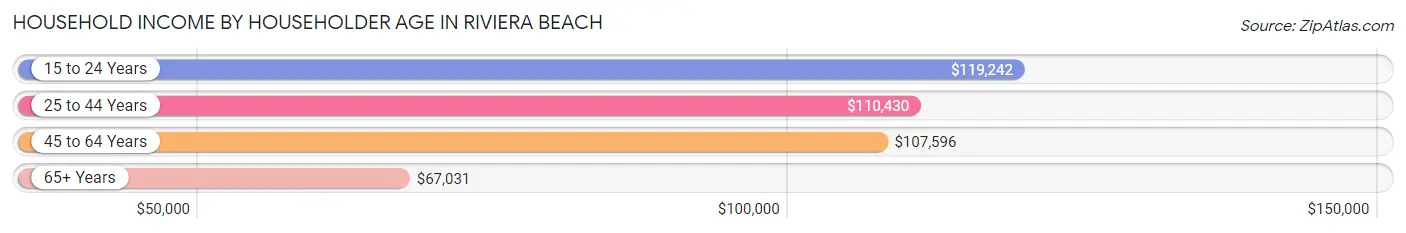
| Income Bracket | # Households | Median Income |
| 15 to 24 Years | 102 (2.2%) | $119,242 |
| 25 to 44 Years | 1,697 (37.1%) | $110,430 |
| 45 to 64 Years | 1,825 (39.9%) | $107,596 |
| 65+ Years | 945 (20.7%) | $67,031 |
| Total | 4,569 (100.0%) | $105,242 |
Poverty in Riviera Beach
Income Below Poverty by Sex and Age in Riviera Beach
With 3.9% poverty level for males and 6.3% for females among the residents of Riviera Beach, 5 year old males and 75 year old and over females are the most vulnerable to poverty, with 38 males (71.7%) and 109 females (23.9%) in their respective age groups living below the poverty level.
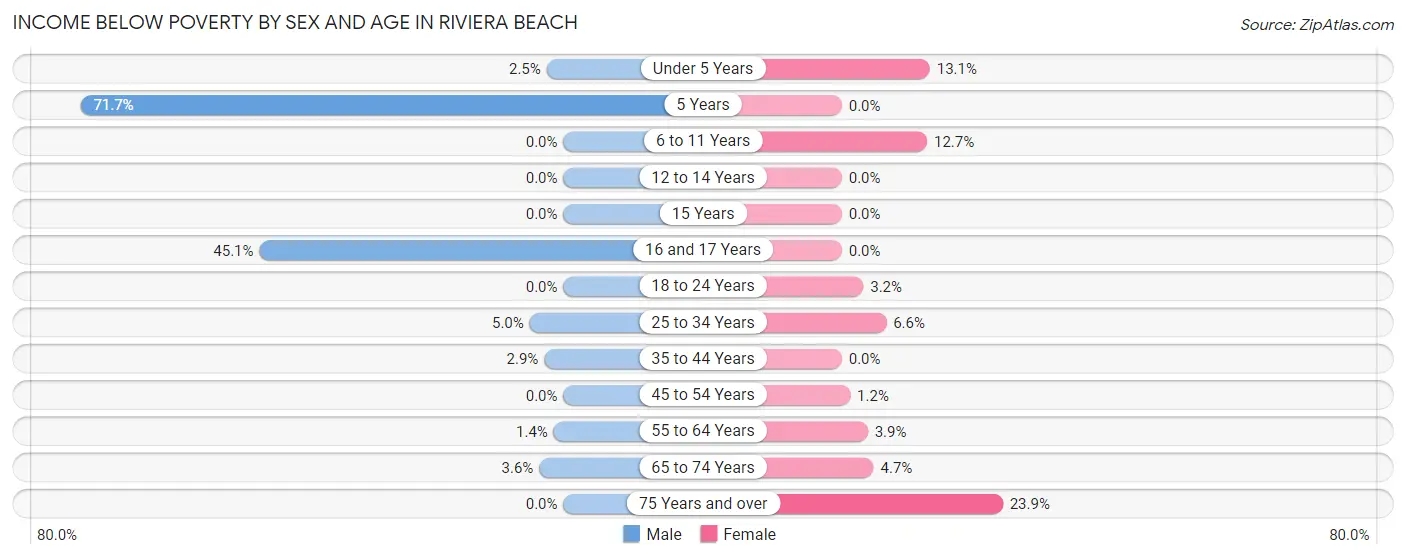
| Age Bracket | Male | Female |
| Under 5 Years | 8 (2.5%) | 46 (13.1%) |
| 5 Years | 38 (71.7%) | 0 (0.0%) |
| 6 to 11 Years | 0 (0.0%) | 116 (12.7%) |
| 12 to 14 Years | 0 (0.0%) | 0 (0.0%) |
| 15 Years | 0 (0.0%) | 0 (0.0%) |
| 16 and 17 Years | 65 (45.1%) | 0 (0.0%) |
| 18 to 24 Years | 0 (0.0%) | 20 (3.2%) |
| 25 to 34 Years | 47 (5.0%) | 71 (6.6%) |
| 35 to 44 Years | 21 (2.9%) | 0 (0.0%) |
| 45 to 54 Years | 0 (0.0%) | 12 (1.2%) |
| 55 to 64 Years | 14 (1.4%) | 39 (3.8%) |
| 65 to 74 Years | 12 (3.6%) | 21 (4.7%) |
| 75 Years and over | 0 (0.0%) | 109 (23.9%) |
| Total | 205 (3.9%) | 434 (6.3%) |
Income Above Poverty by Sex and Age in Riviera Beach
According to the poverty statistics in Riviera Beach, males aged 6 to 11 years and females aged 5 years are the age groups that are most secure financially, with 100.0% of males and 100.0% of females in these age groups living above the poverty line.
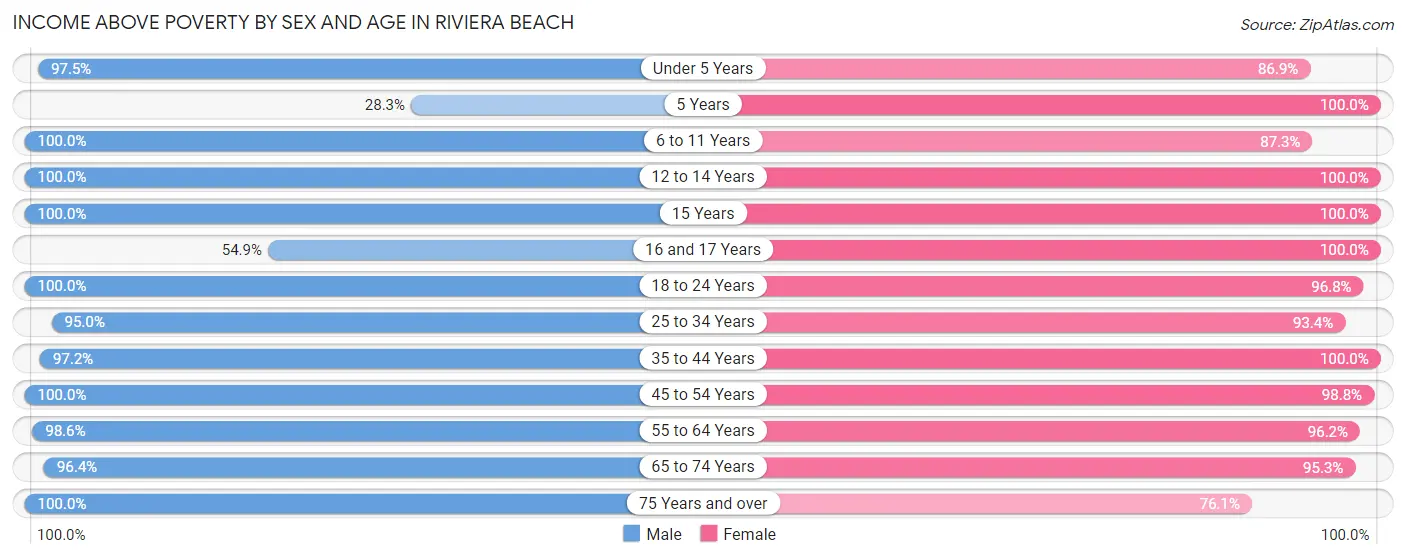
| Age Bracket | Male | Female |
| Under 5 Years | 314 (97.5%) | 306 (86.9%) |
| 5 Years | 15 (28.3%) | 26 (100.0%) |
| 6 to 11 Years | 272 (100.0%) | 800 (87.3%) |
| 12 to 14 Years | 76 (100.0%) | 328 (100.0%) |
| 15 Years | 29 (100.0%) | 80 (100.0%) |
| 16 and 17 Years | 79 (54.9%) | 35 (100.0%) |
| 18 to 24 Years | 195 (100.0%) | 607 (96.8%) |
| 25 to 34 Years | 892 (95.0%) | 1,007 (93.4%) |
| 35 to 44 Years | 715 (97.2%) | 517 (100.0%) |
| 45 to 54 Years | 954 (100.0%) | 955 (98.8%) |
| 55 to 64 Years | 965 (98.6%) | 975 (96.2%) |
| 65 to 74 Years | 322 (96.4%) | 424 (95.3%) |
| 75 Years and over | 242 (100.0%) | 347 (76.1%) |
| Total | 5,070 (96.1%) | 6,407 (93.7%) |
Income Below Poverty Among Married-Couple Families in Riviera Beach
The poverty statistics for married-couple families in Riviera Beach show that 1.4% or 33 of the total 2,326 families live below the poverty line. Families with no children have the highest poverty rate of 2.4%, comprising of 33 families. On the other hand, families with 1 or 2 children have the lowest poverty rate of 0.0%, which includes 0 families.
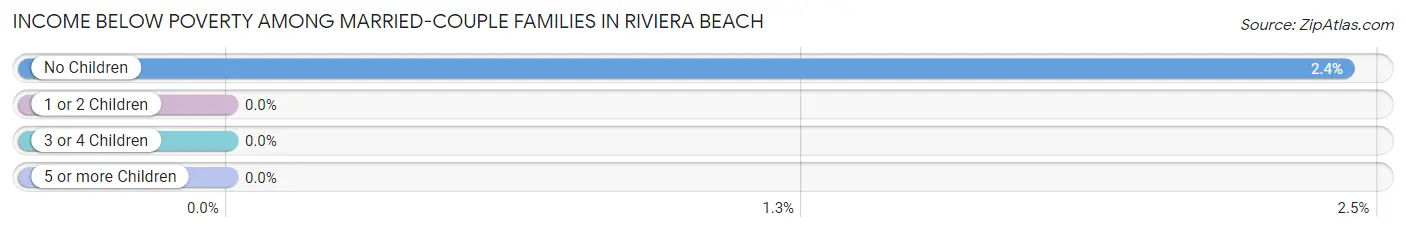
| Children | Above Poverty | Below Poverty |
| No Children | 1,327 (97.6%) | 33 (2.4%) |
| 1 or 2 Children | 821 (100.0%) | 0 (0.0%) |
| 3 or 4 Children | 145 (100.0%) | 0 (0.0%) |
| 5 or more Children | 0 (0.0%) | 0 (0.0%) |
| Total | 2,293 (98.6%) | 33 (1.4%) |
Income Below Poverty Among Single-Parent Households in Riviera Beach
According to the poverty data in Riviera Beach, 41.0% or 75 single-father households and 8.4% or 45 single-mother households are living below the poverty line. Among single-father households, those with 1 or 2 children have the highest poverty rate, with 75 households (56.4%) experiencing poverty. Likewise, among single-mother households, those with 3 or 4 children have the highest poverty rate, with 37 households (35.2%) falling below the poverty line.
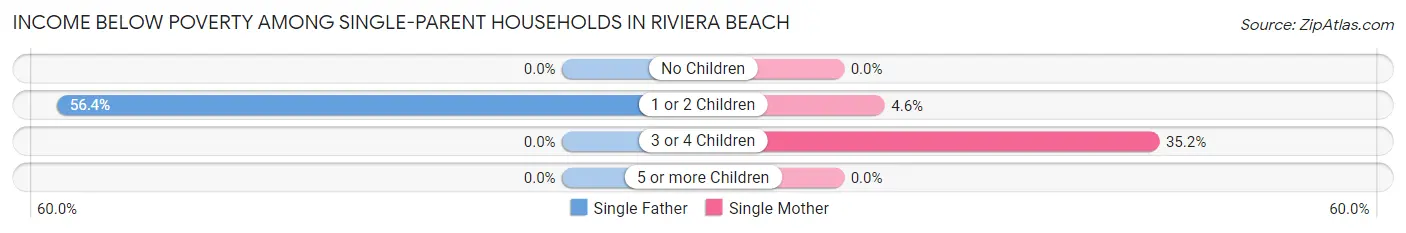
| Children | Single Father | Single Mother |
| No Children | 0 (0.0%) | 0 (0.0%) |
| 1 or 2 Children | 75 (56.4%) | 8 (4.5%) |
| 3 or 4 Children | 0 (0.0%) | 37 (35.2%) |
| 5 or more Children | 0 (0.0%) | 0 (0.0%) |
| Total | 75 (41.0%) | 45 (8.4%) |
Income Below Poverty Among Married-Couple vs Single-Parent Households in Riviera Beach
The poverty data for Riviera Beach shows that 33 of the married-couple family households (1.4%) and 120 of the single-parent households (16.7%) are living below the poverty level. Within the married-couple family households, those with no children have the highest poverty rate, with 33 households (2.4%) falling below the poverty line. Among the single-parent households, those with 3 or 4 children have the highest poverty rate, with 37 household (35.2%) living below poverty.
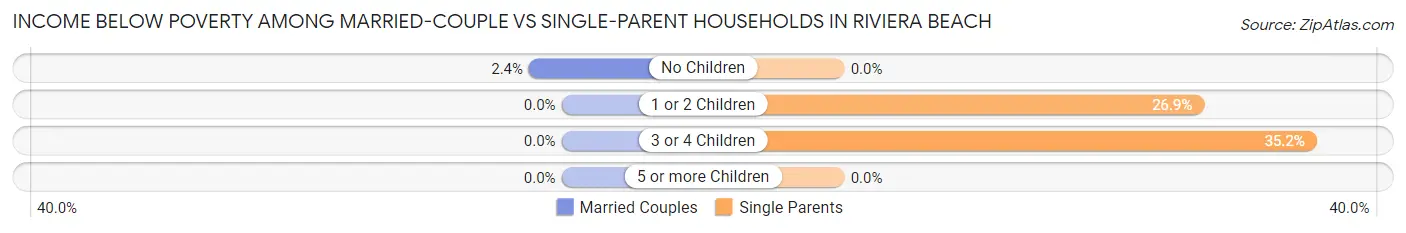
| Children | Married-Couple Families | Single-Parent Households |
| No Children | 33 (2.4%) | 0 (0.0%) |
| 1 or 2 Children | 0 (0.0%) | 83 (26.9%) |
| 3 or 4 Children | 0 (0.0%) | 37 (35.2%) |
| 5 or more Children | 0 (0.0%) | 0 (0.0%) |
| Total | 33 (1.4%) | 120 (16.7%) |
Race in Riviera Beach
The most populous races in Riviera Beach are White / Caucasian (9,868 | 81.4%), Two or more Races (858 | 7.1%), and Black / African American (587 | 4.8%).
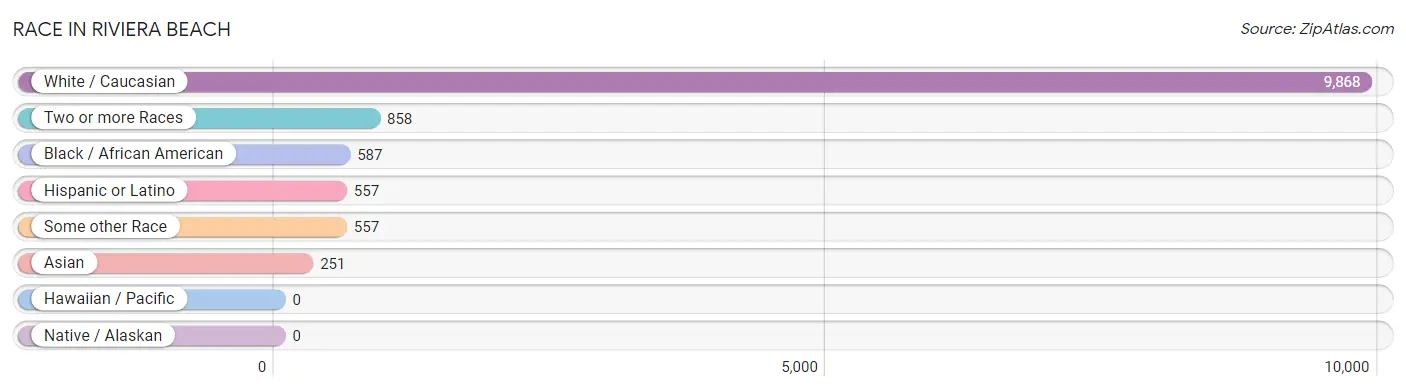
| Race | # Population | % Population |
| Asian | 251 | 2.1% |
| Black / African American | 587 | 4.8% |
| Hawaiian / Pacific | 0 | 0.0% |
| Hispanic or Latino | 557 | 4.6% |
| Native / Alaskan | 0 | 0.0% |
| White / Caucasian | 9,868 | 81.4% |
| Two or more Races | 858 | 7.1% |
| Some other Race | 557 | 4.6% |
| Total | 12,121 | 100.0% |
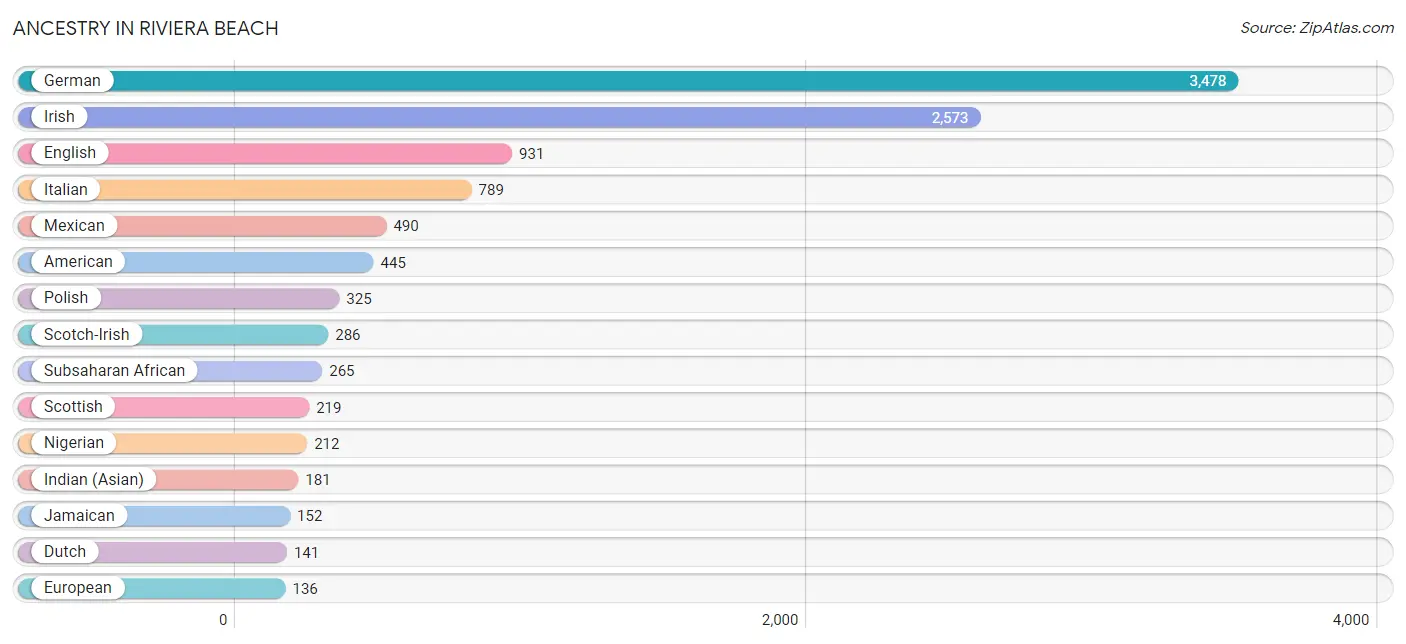
Ancestry in Riviera Beach
The most populous ancestries reported in Riviera Beach are German (3,478 | 28.7%), Irish (2,573 | 21.2%), English (931 | 7.7%), Italian (789 | 6.5%), and Mexican (490 | 4.0%), together accounting for 68.1% of all Riviera Beach residents.
| Ancestry | # Population | % Population |
| African | 37 | 0.3% |
| American | 445 | 3.7% |
| Apache | 3 | 0.0% |
| Arab | 40 | 0.3% |
| Argentinean | 1 | 0.0% |
| Austrian | 38 | 0.3% |
| Bhutanese | 23 | 0.2% |
| British | 42 | 0.4% |
| Burmese | 118 | 1.0% |
| Central American | 19 | 0.2% |
| Cherokee | 2 | 0.0% |
| Czech | 99 | 0.8% |
| Dutch | 141 | 1.2% |
| Eastern European | 13 | 0.1% |
| Egyptian | 6 | 0.1% |
| English | 931 | 7.7% |
| European | 136 | 1.1% |
| Filipino | 7 | 0.1% |
| French | 104 | 0.9% |
| French Canadian | 44 | 0.4% |
| German | 3,478 | 28.7% |
| Ghanaian | 16 | 0.1% |
| Greek | 16 | 0.1% |
| Guyanese | 10 | 0.1% |
| Hungarian | 38 | 0.3% |
| Indian (Asian) | 181 | 1.5% |
| Irish | 2,573 | 21.2% |
| Italian | 789 | 6.5% |
| Jamaican | 152 | 1.3% |
| Korean | 15 | 0.1% |
| Lebanese | 21 | 0.2% |
| Lithuanian | 43 | 0.4% |
| Mexican | 490 | 4.0% |
| Mexican American Indian | 10 | 0.1% |
| Moroccan | 13 | 0.1% |
| Nigerian | 212 | 1.8% |
| Northern European | 31 | 0.3% |
| Norwegian | 60 | 0.5% |
| Polish | 325 | 2.7% |
| Portuguese | 102 | 0.8% |
| Puerto Rican | 47 | 0.4% |
| Russian | 49 | 0.4% |
| Salvadoran | 19 | 0.2% |
| Scotch-Irish | 286 | 2.4% |
| Scottish | 219 | 1.8% |
| South American | 1 | 0.0% |
| Subsaharan African | 265 | 2.2% |
| Swedish | 100 | 0.8% |
| Ukrainian | 57 | 0.5% |
| Welsh | 46 | 0.4% | View All 50 Rows |
Immigrants in Riviera Beach
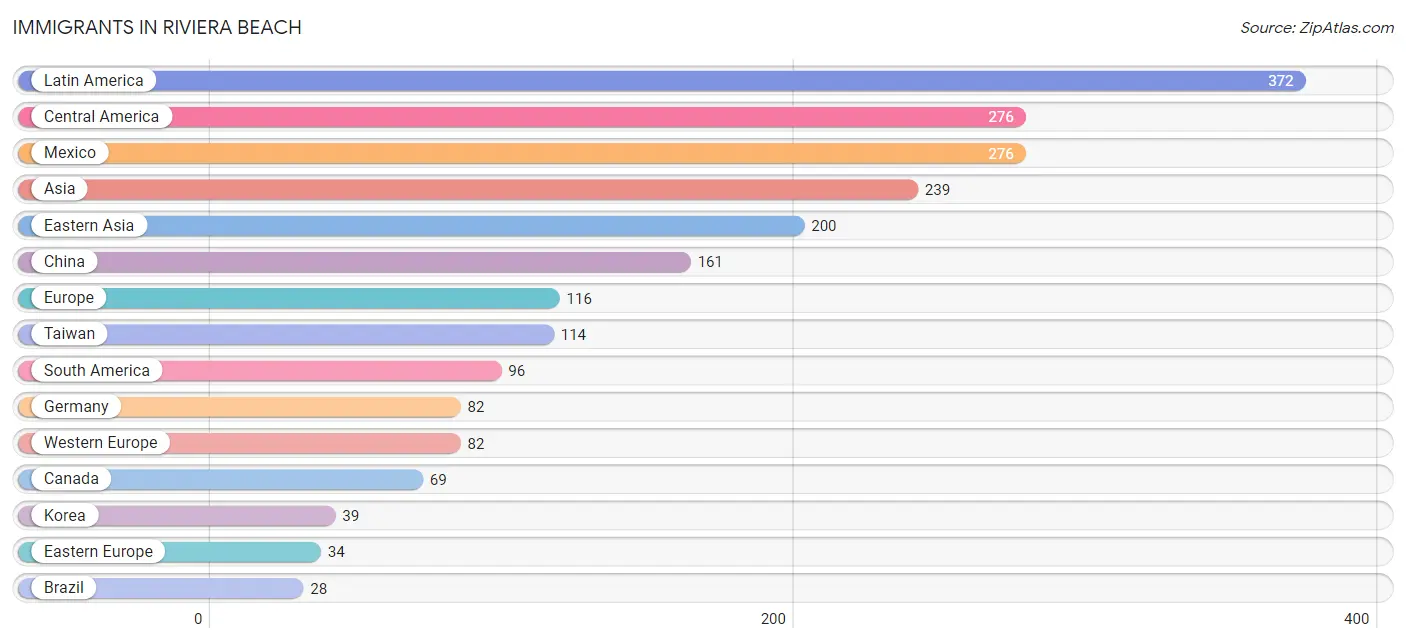
The most numerous immigrant groups reported in Riviera Beach came from Latin America (372 | 3.1%), Central America (276 | 2.3%), Mexico (276 | 2.3%), Asia (239 | 2.0%), and Eastern Asia (200 | 1.7%), together accounting for 11.3% of all Riviera Beach residents.
| Immigration Origin | # Population | % Population |
| Africa | 22 | 0.2% |
| Asia | 239 | 2.0% |
| Brazil | 28 | 0.2% |
| Canada | 69 | 0.6% |
| Central America | 276 | 2.3% |
| China | 161 | 1.3% |
| Colombia | 28 | 0.2% |
| Czechoslovakia | 27 | 0.2% |
| Eastern Asia | 200 | 1.7% |
| Eastern Europe | 34 | 0.3% |
| Egypt | 6 | 0.1% |
| Europe | 116 | 1.0% |
| Germany | 82 | 0.7% |
| Ghana | 16 | 0.1% |
| Guyana | 12 | 0.1% |
| Korea | 39 | 0.3% |
| Latin America | 372 | 3.1% |
| Mexico | 276 | 2.3% |
| Northern Africa | 6 | 0.1% |
| Pakistan | 26 | 0.2% |
| Peru | 28 | 0.2% |
| South America | 96 | 0.8% |
| South Central Asia | 26 | 0.2% |
| Taiwan | 114 | 0.9% |
| Ukraine | 7 | 0.1% |
| Western Africa | 16 | 0.1% |
| Western Asia | 13 | 0.1% |
| Western Europe | 82 | 0.7% | View All 28 Rows |
Sex and Age in Riviera Beach
Sex and Age in Riviera Beach
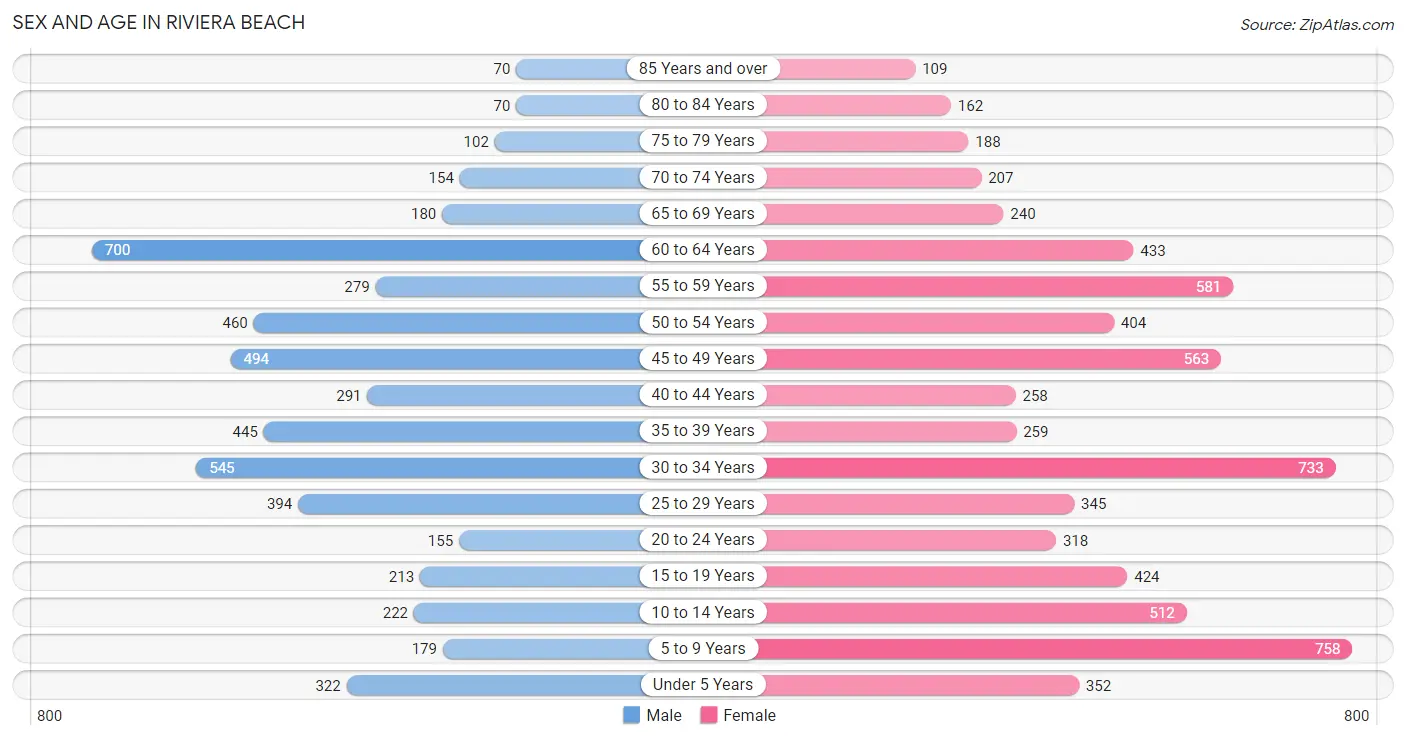
The most populous age groups in Riviera Beach are 60 to 64 Years (700 | 13.3%) for men and 5 to 9 Years (758 | 11.1%) for women.
| Age Bracket | Male | Female |
| Under 5 Years | 322 (6.1%) | 352 (5.1%) |
| 5 to 9 Years | 179 (3.4%) | 758 (11.1%) |
| 10 to 14 Years | 222 (4.2%) | 512 (7.5%) |
| 15 to 19 Years | 213 (4.0%) | 424 (6.2%) |
| 20 to 24 Years | 155 (2.9%) | 318 (4.6%) |
| 25 to 29 Years | 394 (7.5%) | 345 (5.0%) |
| 30 to 34 Years | 545 (10.3%) | 733 (10.7%) |
| 35 to 39 Years | 445 (8.4%) | 259 (3.8%) |
| 40 to 44 Years | 291 (5.5%) | 258 (3.8%) |
| 45 to 49 Years | 494 (9.4%) | 563 (8.2%) |
| 50 to 54 Years | 460 (8.7%) | 404 (5.9%) |
| 55 to 59 Years | 279 (5.3%) | 581 (8.5%) |
| 60 to 64 Years | 700 (13.3%) | 433 (6.3%) |
| 65 to 69 Years | 180 (3.4%) | 240 (3.5%) |
| 70 to 74 Years | 154 (2.9%) | 207 (3.0%) |
| 75 to 79 Years | 102 (1.9%) | 188 (2.8%) |
| 80 to 84 Years | 70 (1.3%) | 162 (2.4%) |
| 85 Years and over | 70 (1.3%) | 109 (1.6%) |
| Total | 5,275 (100.0%) | 6,846 (100.0%) |
Families and Households in Riviera Beach
Median Family Size in Riviera Beach
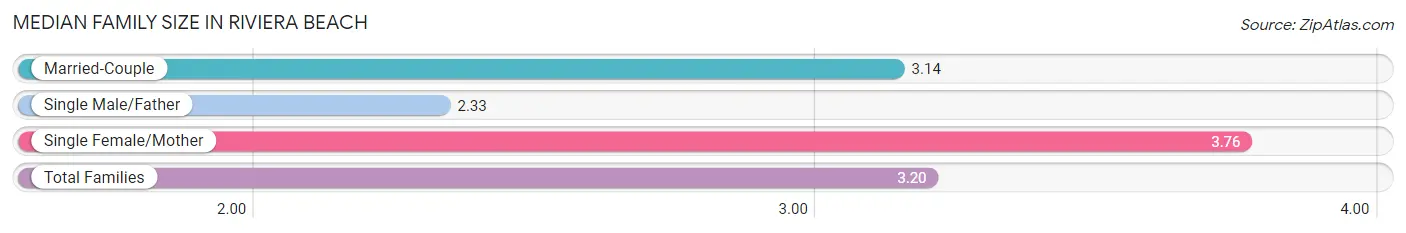
The median family size in Riviera Beach is 3.20 persons per family, with single female/mother families (535 | 17.6%) accounting for the largest median family size of 3.76 persons per family. On the other hand, single male/father families (183 | 6.0%) represent the smallest median family size with 2.33 persons per family.
| Family Type | # Families | Family Size |
| Married-Couple | 2,326 (76.4%) | 3.14 |
| Single Male/Father | 183 (6.0%) | 2.33 |
| Single Female/Mother | 535 (17.6%) | 3.76 |
| Total Families | 3,044 (100.0%) | 3.20 |
Median Household Size in Riviera Beach
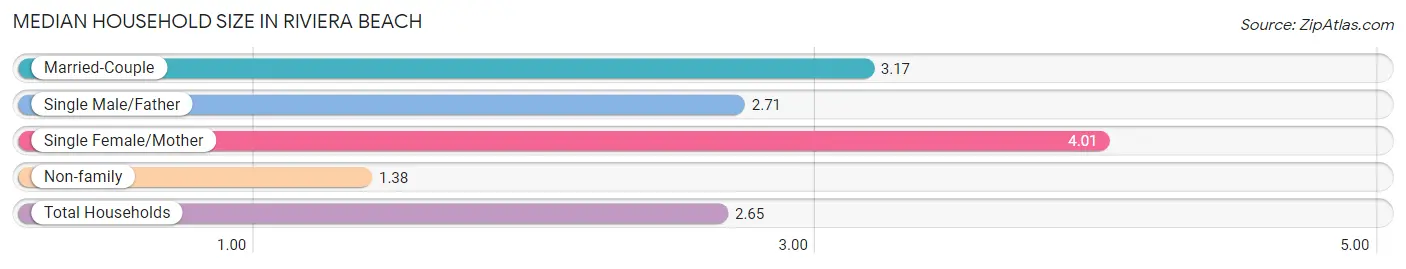
The median household size in Riviera Beach is 2.65 persons per household, with single female/mother households (535 | 11.7%) accounting for the largest median household size of 4.01 persons per household. non-family households (1,525 | 33.4%) represent the smallest median household size with 1.38 persons per household.
| Household Type | # Households | Household Size |
| Married-Couple | 2,326 (50.9%) | 3.17 |
| Single Male/Father | 183 (4.0%) | 2.71 |
| Single Female/Mother | 535 (11.7%) | 4.01 |
| Non-family | 1,525 (33.4%) | 1.38 |
| Total Households | 4,569 (100.0%) | 2.65 |
Household Size by Marriage Status in Riviera Beach
Out of a total of 4,569 households in Riviera Beach, 3,044 (66.6%) are family households, while 1,525 (33.4%) are nonfamily households. The most numerous type of family households are 2-person households, comprising 1,095, and the most common type of nonfamily households are 1-person households, comprising 1,088.
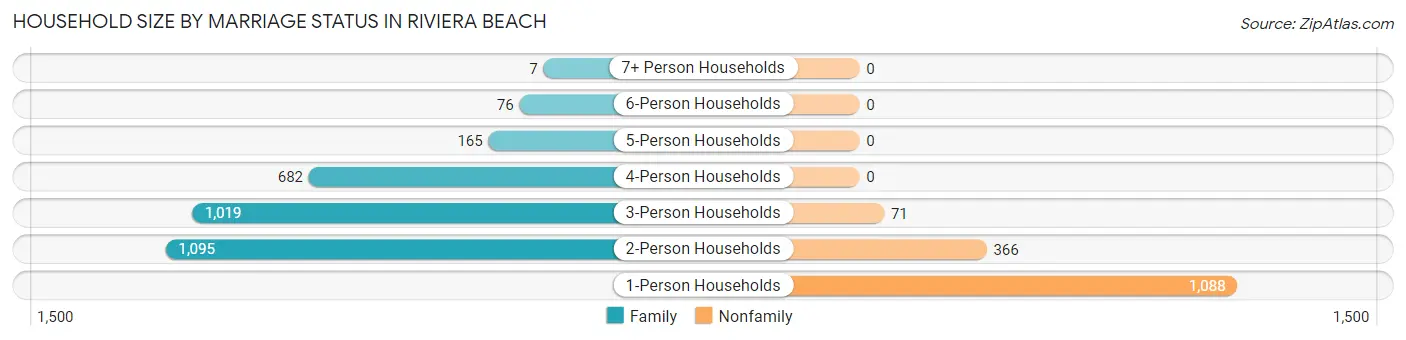
| Household Size | Family Households | Nonfamily Households |
| 1-Person Households | - | 1,088 (23.8%) |
| 2-Person Households | 1,095 (24.0%) | 366 (8.0%) |
| 3-Person Households | 1,019 (22.3%) | 71 (1.5%) |
| 4-Person Households | 682 (14.9%) | 0 (0.0%) |
| 5-Person Households | 165 (3.6%) | 0 (0.0%) |
| 6-Person Households | 76 (1.7%) | 0 (0.0%) |
| 7+ Person Households | 7 (0.2%) | 0 (0.0%) |
| Total | 3,044 (66.6%) | 1,525 (33.4%) |
Female Fertility in Riviera Beach
Fertility by Age in Riviera Beach
Average fertility rate in Riviera Beach is 65.0 births per 1,000 women. Women in the age bracket of 20 to 34 years have the highest fertility rate with 82.0 births per 1,000 women. Women in the age bracket of 20 to 34 years acount for 59.0% of all women with births.
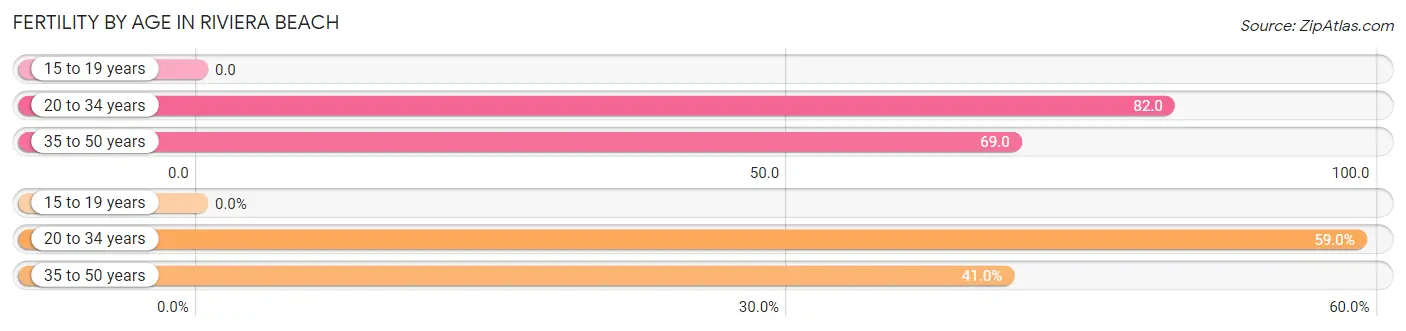
| Age Bracket | Women with Births | Births / 1,000 Women |
| 15 to 19 years | 0 (0.0%) | 0.0 |
| 20 to 34 years | 115 (59.0%) | 82.0 |
| 35 to 50 years | 80 (41.0%) | 69.0 |
| Total | 195 (100.0%) | 65.0 |
Fertility by Age by Marriage Status in Riviera Beach
87.2% of women with births (195) in Riviera Beach are married. The highest percentage of unmarried women with births falls into 20 to 34 years age bracket with 21.7% of them unmarried at the time of birth, while the lowest percentage of unmarried women with births belong to 35 to 50 years age bracket with 0.0% of them unmarried.
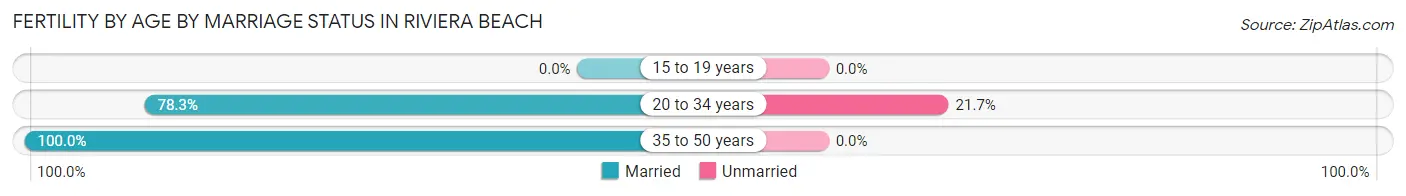
| Age Bracket | Married | Unmarried |
| 15 to 19 years | 0 (0.0%) | 0 (0.0%) |
| 20 to 34 years | 90 (78.3%) | 25 (21.7%) |
| 35 to 50 years | 80 (100.0%) | 0 (0.0%) |
| Total | 170 (87.2%) | 25 (12.8%) |
Fertility by Education in Riviera Beach
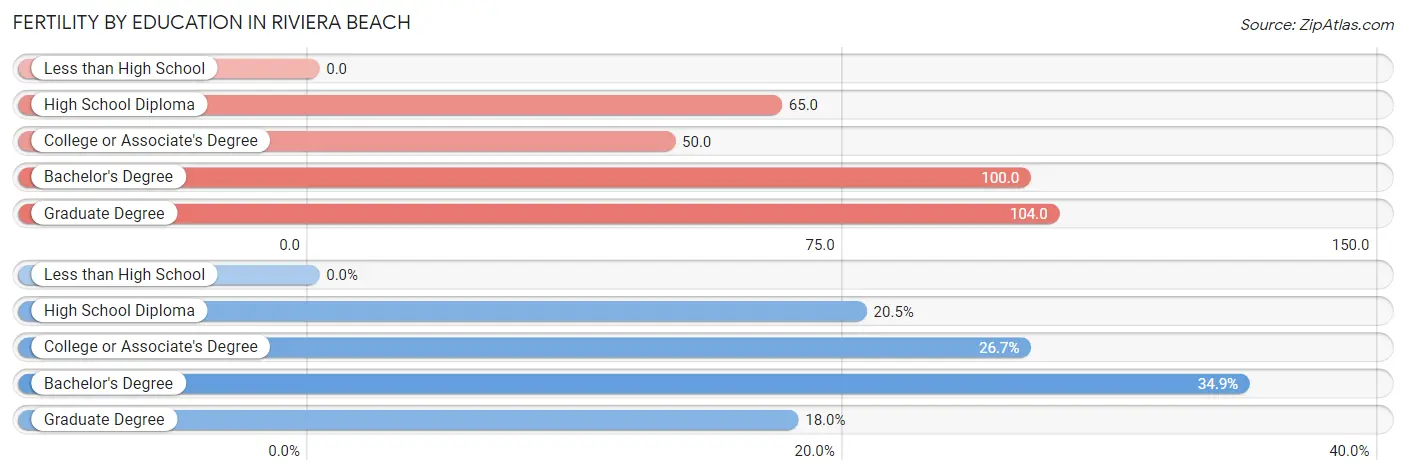
| Educational Attainment | Women with Births | Births / 1,000 Women |
| Less than High School | 0 (0.0%) | 0.0 |
| High School Diploma | 40 (20.5%) | 65.0 |
| College or Associate's Degree | 52 (26.7%) | 50.0 |
| Bachelor's Degree | 68 (34.9%) | 100.0 |
| Graduate Degree | 35 (17.9%) | 104.0 |
| Total | 195 (100.0%) | 65.0 |
Fertility by Education by Marriage Status in Riviera Beach
12.8% of women with births in Riviera Beach are unmarried. Women with the educational attainment of high school diploma are most likely to be married with 100.0% of them married at childbirth, while women with the educational attainment of graduate degree are least likely to be married with 71.4% of them unmarried at childbirth.
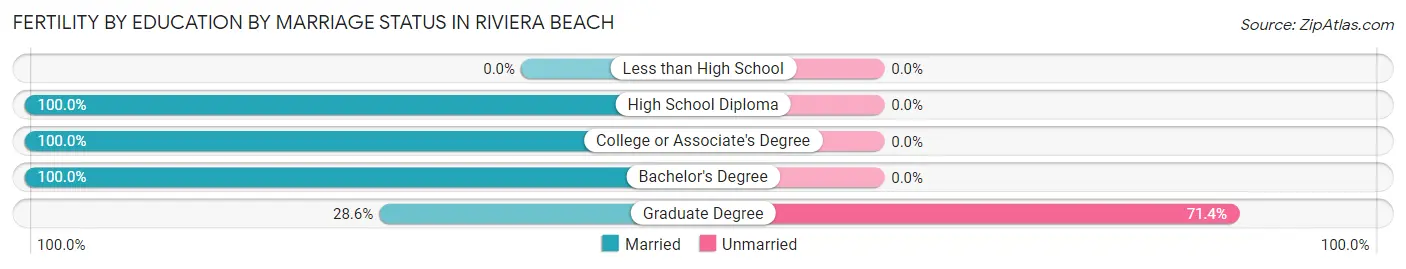
| Educational Attainment | Married | Unmarried |
| Less than High School | 0 (0.0%) | 0 (0.0%) |
| High School Diploma | 40 (100.0%) | 0 (0.0%) |
| College or Associate's Degree | 52 (100.0%) | 0 (0.0%) |
| Bachelor's Degree | 68 (100.0%) | 0 (0.0%) |
| Graduate Degree | 10 (28.6%) | 25 (71.4%) |
| Total | 170 (87.2%) | 25 (12.8%) |
Employment Characteristics in Riviera Beach
Employment by Class of Employer in Riviera Beach
Among the 6,474 employed individuals in Riviera Beach, private company employees (4,440 | 68.6%), not-for-profit organizations (484 | 7.5%), and federal government employees (482 | 7.4%) make up the most common classes of employment.
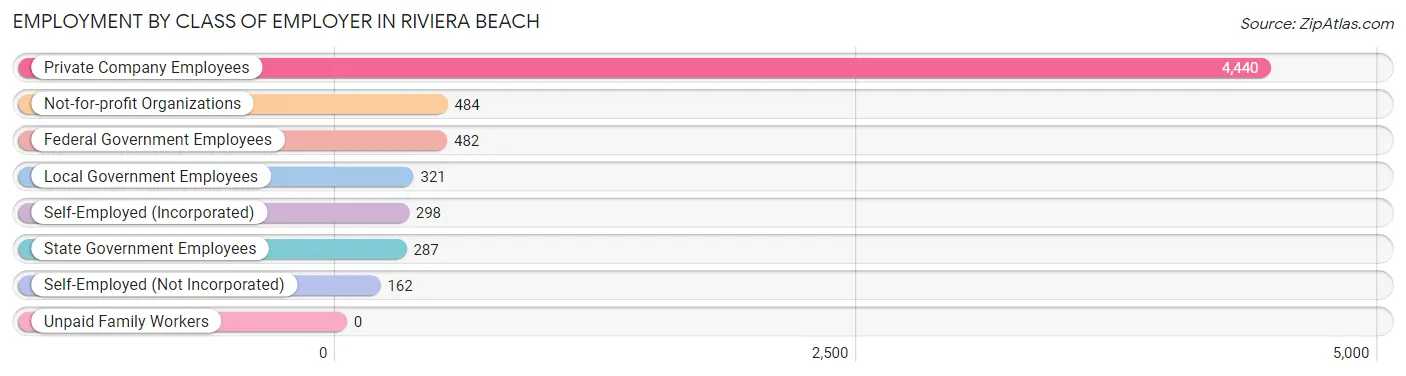
| Employer Class | # Employees | % Employees |
| Private Company Employees | 4,440 | 68.6% |
| Self-Employed (Incorporated) | 298 | 4.6% |
| Self-Employed (Not Incorporated) | 162 | 2.5% |
| Not-for-profit Organizations | 484 | 7.5% |
| Local Government Employees | 321 | 5.0% |
| State Government Employees | 287 | 4.4% |
| Federal Government Employees | 482 | 7.4% |
| Unpaid Family Workers | 0 | 0.0% |
| Total | 6,474 | 100.0% |
Employment Status by Age in Riviera Beach
According to the labor force statistics for Riviera Beach, out of the total population over 16 years of age (9,667), 70.7% or 6,835 individuals are in the labor force, with 5.2% or 355 of them unemployed. The age group with the highest labor force participation rate is 25 to 29 years, with 95.1% or 703 individuals in the labor force. Within the labor force, the 30 to 34 years age range has the highest percentage of unemployed individuals, with 12.3% or 142 of them being unemployed.
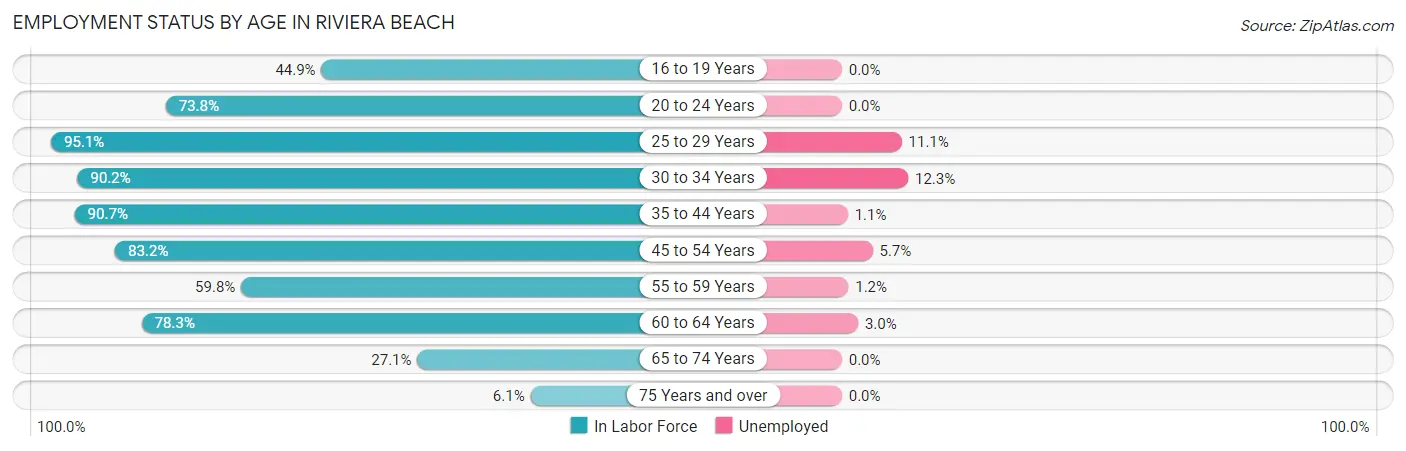
| Age Bracket | In Labor Force | Unemployed |
| 16 to 19 Years | 237 (44.9%) | 0 (0.0%) |
| 20 to 24 Years | 349 (73.8%) | 0 (0.0%) |
| 25 to 29 Years | 703 (95.1%) | 78 (11.1%) |
| 30 to 34 Years | 1,153 (90.2%) | 142 (12.3%) |
| 35 to 44 Years | 1,136 (90.7%) | 12 (1.1%) |
| 45 to 54 Years | 1,598 (83.2%) | 91 (5.7%) |
| 55 to 59 Years | 514 (59.8%) | 6 (1.2%) |
| 60 to 64 Years | 887 (78.3%) | 27 (3.0%) |
| 65 to 74 Years | 212 (27.1%) | 0 (0.0%) |
| 75 Years and over | 43 (6.1%) | 0 (0.0%) |
| Total | 6,835 (70.7%) | 355 (5.2%) |
Employment Status by Educational Attainment in Riviera Beach
According to labor force statistics for Riviera Beach, 83.4% of individuals (5,991) out of the total population between 25 and 64 years of age (7,184) are in the labor force, with 5.9% or 353 of them being unemployed. The group with the highest labor force participation rate are those with the educational attainment of bachelor's degree or higher, with 89.5% or 2,075 individuals in the labor force. Within the labor force, individuals with less than high school education have the highest percentage of unemployment, with 17.8% or 42 of them being unemployed.
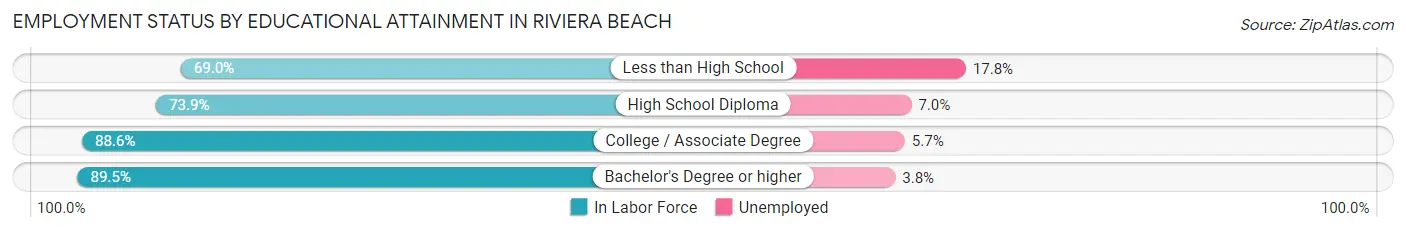
| Educational Attainment | In Labor Force | Unemployed |
| Less than High School | 236 (69.0%) | 61 (17.8%) |
| High School Diploma | 1,640 (73.9%) | 155 (7.0%) |
| College / Associate Degree | 2,042 (88.6%) | 131 (5.7%) |
| Bachelor's Degree or higher | 2,075 (89.5%) | 88 (3.8%) |
| Total | 5,991 (83.4%) | 424 (5.9%) |
Employment Occupations by Sex in Riviera Beach
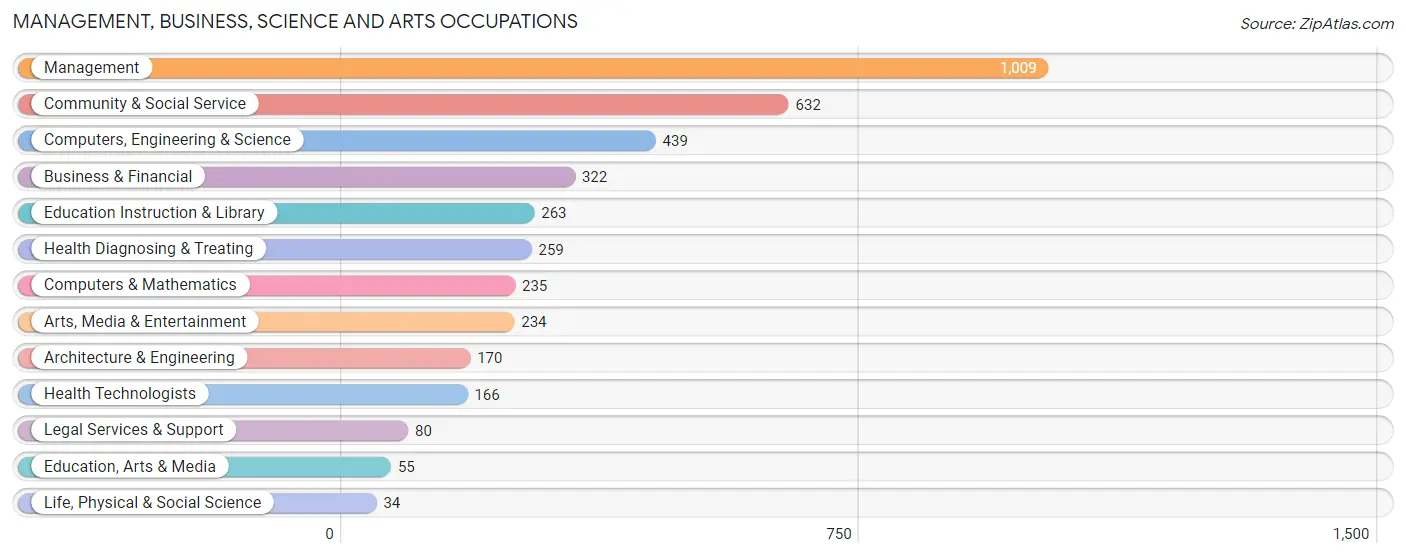
Management, Business, Science and Arts Occupations
The most common Management, Business, Science and Arts occupations in Riviera Beach are Management (1,009 | 15.8%), Community & Social Service (632 | 9.9%), Computers, Engineering & Science (439 | 6.9%), Business & Financial (322 | 5.0%), and Education Instruction & Library (263 | 4.1%).
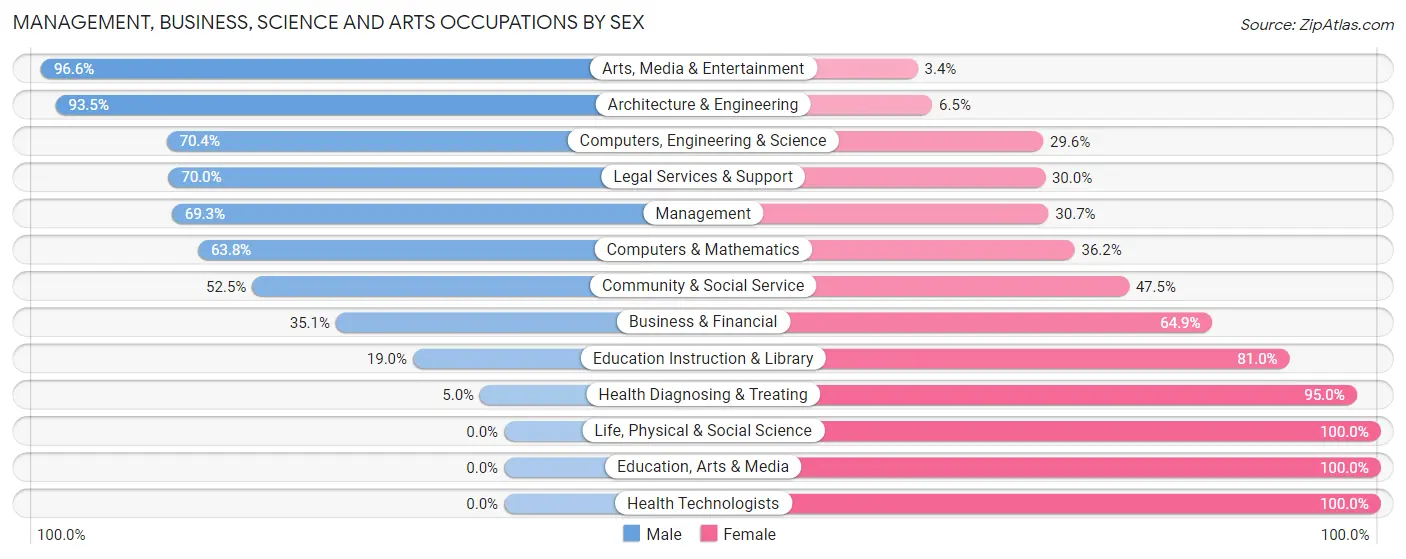
Management, Business, Science and Arts Occupations by Sex
Within the Management, Business, Science and Arts occupations in Riviera Beach, the most male-oriented occupations are Arts, Media & Entertainment (96.6%), Architecture & Engineering (93.5%), and Computers, Engineering & Science (70.4%), while the most female-oriented occupations are Life, Physical & Social Science (100.0%), Education, Arts & Media (100.0%), and Health Technologists (100.0%).
| Occupation | Male | Female |
| Management | 699 (69.3%) | 310 (30.7%) |
| Business & Financial | 113 (35.1%) | 209 (64.9%) |
| Computers, Engineering & Science | 309 (70.4%) | 130 (29.6%) |
| Computers & Mathematics | 150 (63.8%) | 85 (36.2%) |
| Architecture & Engineering | 159 (93.5%) | 11 (6.5%) |
| Life, Physical & Social Science | 0 (0.0%) | 34 (100.0%) |
| Community & Social Service | 332 (52.5%) | 300 (47.5%) |
| Education, Arts & Media | 0 (0.0%) | 55 (100.0%) |
| Legal Services & Support | 56 (70.0%) | 24 (30.0%) |
| Education Instruction & Library | 50 (19.0%) | 213 (81.0%) |
| Arts, Media & Entertainment | 226 (96.6%) | 8 (3.4%) |
| Health Diagnosing & Treating | 13 (5.0%) | 246 (95.0%) |
| Health Technologists | 0 (0.0%) | 166 (100.0%) |
| Total (Category) | 1,466 (55.1%) | 1,195 (44.9%) |
| Total (Overall) | 3,508 (54.8%) | 2,888 (45.2%) |
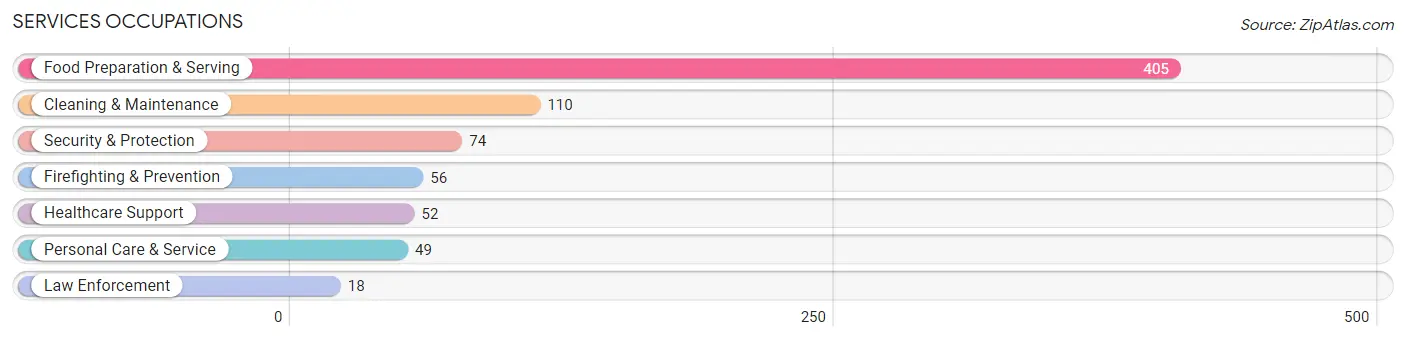
Services Occupations
The most common Services occupations in Riviera Beach are Food Preparation & Serving (405 | 6.3%), Cleaning & Maintenance (110 | 1.7%), Security & Protection (74 | 1.2%), Firefighting & Prevention (56 | 0.9%), and Healthcare Support (52 | 0.8%).
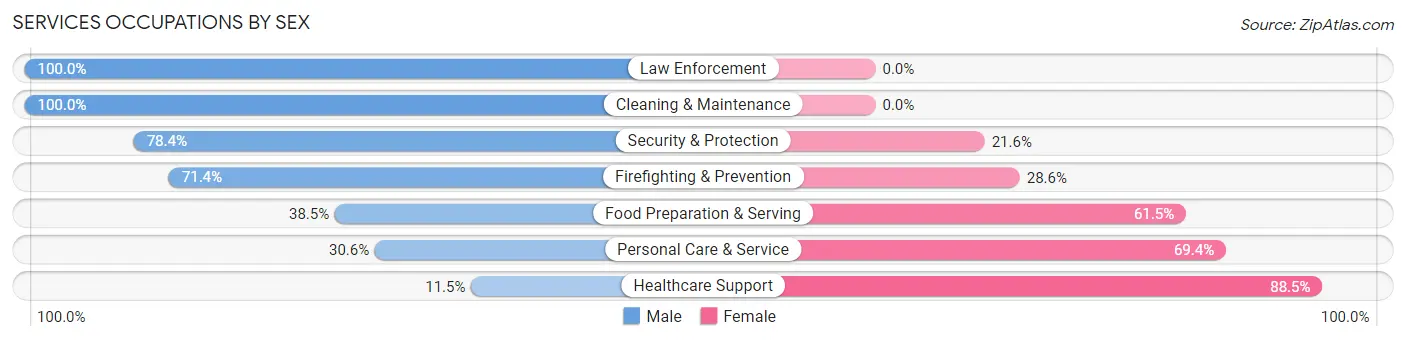
Services Occupations by Sex
Within the Services occupations in Riviera Beach, the most male-oriented occupations are Law Enforcement (100.0%), Cleaning & Maintenance (100.0%), and Security & Protection (78.4%), while the most female-oriented occupations are Healthcare Support (88.5%), Personal Care & Service (69.4%), and Food Preparation & Serving (61.5%).
| Occupation | Male | Female |
| Healthcare Support | 6 (11.5%) | 46 (88.5%) |
| Security & Protection | 58 (78.4%) | 16 (21.6%) |
| Firefighting & Prevention | 40 (71.4%) | 16 (28.6%) |
| Law Enforcement | 18 (100.0%) | 0 (0.0%) |
| Food Preparation & Serving | 156 (38.5%) | 249 (61.5%) |
| Cleaning & Maintenance | 110 (100.0%) | 0 (0.0%) |
| Personal Care & Service | 15 (30.6%) | 34 (69.4%) |
| Total (Category) | 345 (50.0%) | 345 (50.0%) |
| Total (Overall) | 3,508 (54.8%) | 2,888 (45.2%) |
Sales and Office Occupations
The most common Sales and Office occupations in Riviera Beach are Office & Administration (963 | 15.1%), and Sales & Related (567 | 8.9%).
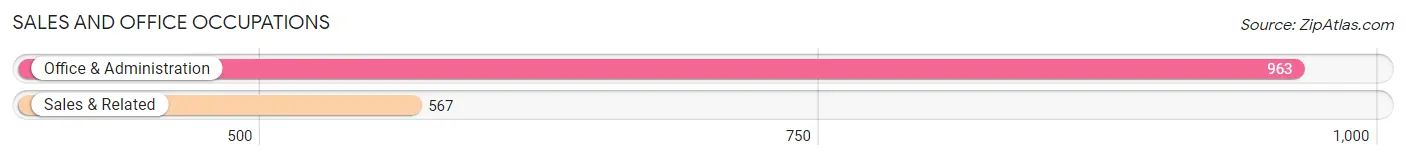
Sales and Office Occupations by Sex
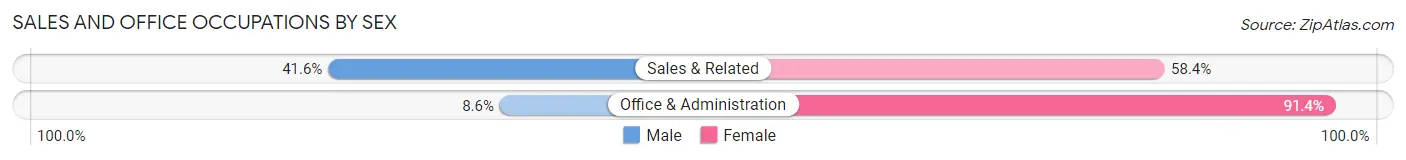
| Occupation | Male | Female |
| Sales & Related | 236 (41.6%) | 331 (58.4%) |
| Office & Administration | 83 (8.6%) | 880 (91.4%) |
| Total (Category) | 319 (20.8%) | 1,211 (79.1%) |
| Total (Overall) | 3,508 (54.8%) | 2,888 (45.2%) |
Natural Resources, Construction and Maintenance Occupations
The most common Natural Resources, Construction and Maintenance occupations in Riviera Beach are Construction & Extraction (468 | 7.3%), and Installation, Maintenance & Repair (389 | 6.1%).
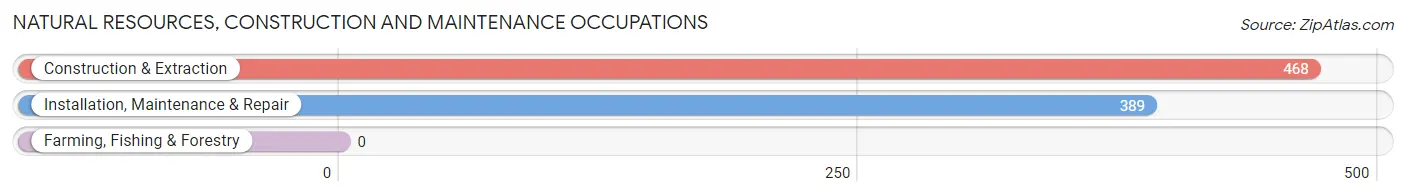
Natural Resources, Construction and Maintenance Occupations by Sex
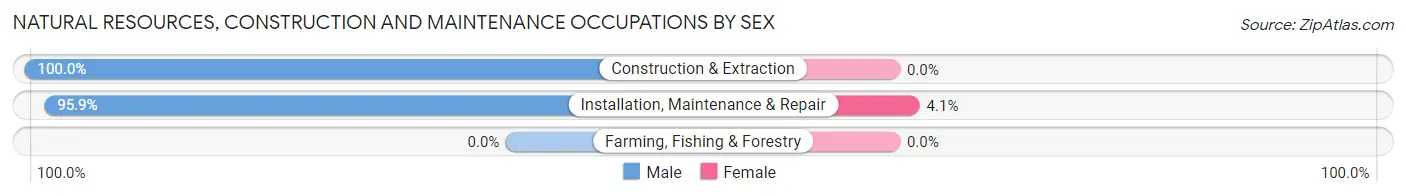
| Occupation | Male | Female |
| Farming, Fishing & Forestry | 0 (0.0%) | 0 (0.0%) |
| Construction & Extraction | 468 (100.0%) | 0 (0.0%) |
| Installation, Maintenance & Repair | 373 (95.9%) | 16 (4.1%) |
| Total (Category) | 841 (98.1%) | 16 (1.9%) |
| Total (Overall) | 3,508 (54.8%) | 2,888 (45.2%) |
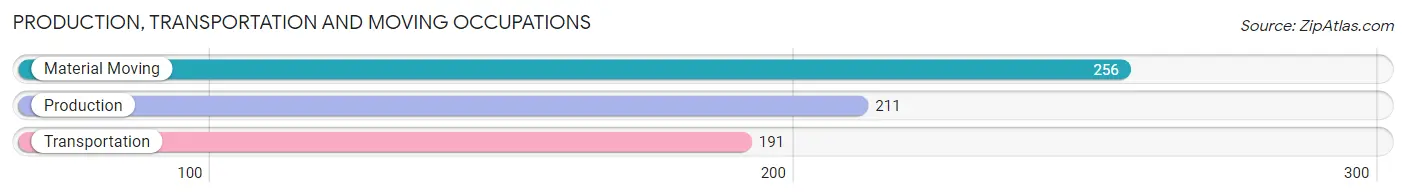
Production, Transportation and Moving Occupations
The most common Production, Transportation and Moving occupations in Riviera Beach are Material Moving (256 | 4.0%), Production (211 | 3.3%), and Transportation (191 | 3.0%).
Production, Transportation and Moving Occupations by Sex
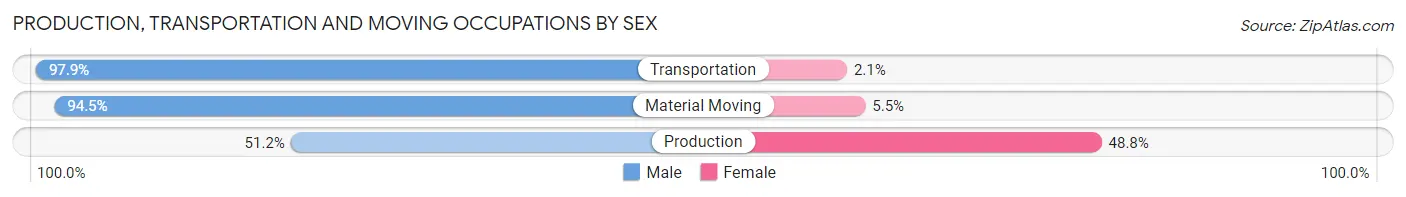
| Occupation | Male | Female |
| Production | 108 (51.2%) | 103 (48.8%) |
| Transportation | 187 (97.9%) | 4 (2.1%) |
| Material Moving | 242 (94.5%) | 14 (5.5%) |
| Total (Category) | 537 (81.6%) | 121 (18.4%) |
| Total (Overall) | 3,508 (54.8%) | 2,888 (45.2%) |
Employment Industries by Sex in Riviera Beach
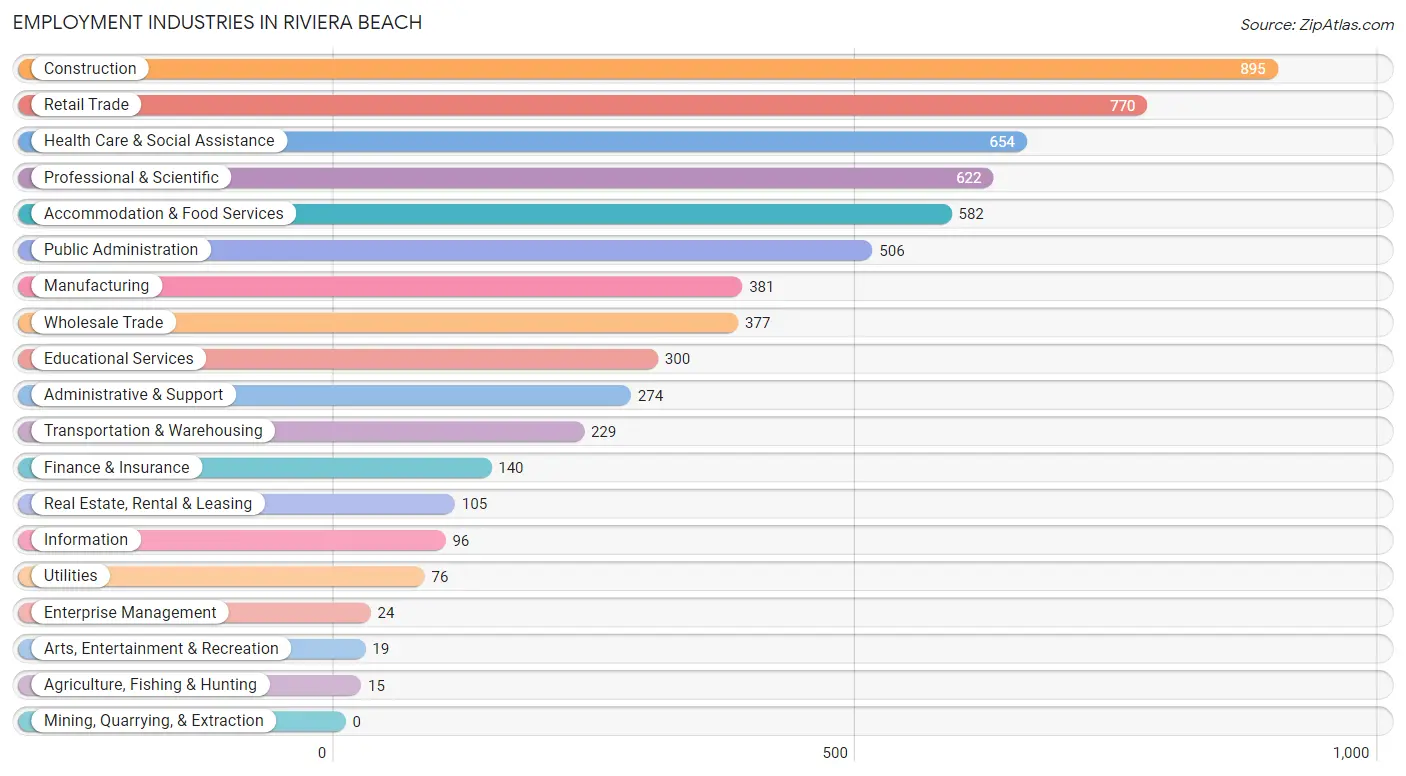
Employment Industries in Riviera Beach
The major employment industries in Riviera Beach include Construction (895 | 14.0%), Retail Trade (770 | 12.0%), Health Care & Social Assistance (654 | 10.2%), Professional & Scientific (622 | 9.7%), and Accommodation & Food Services (582 | 9.1%).
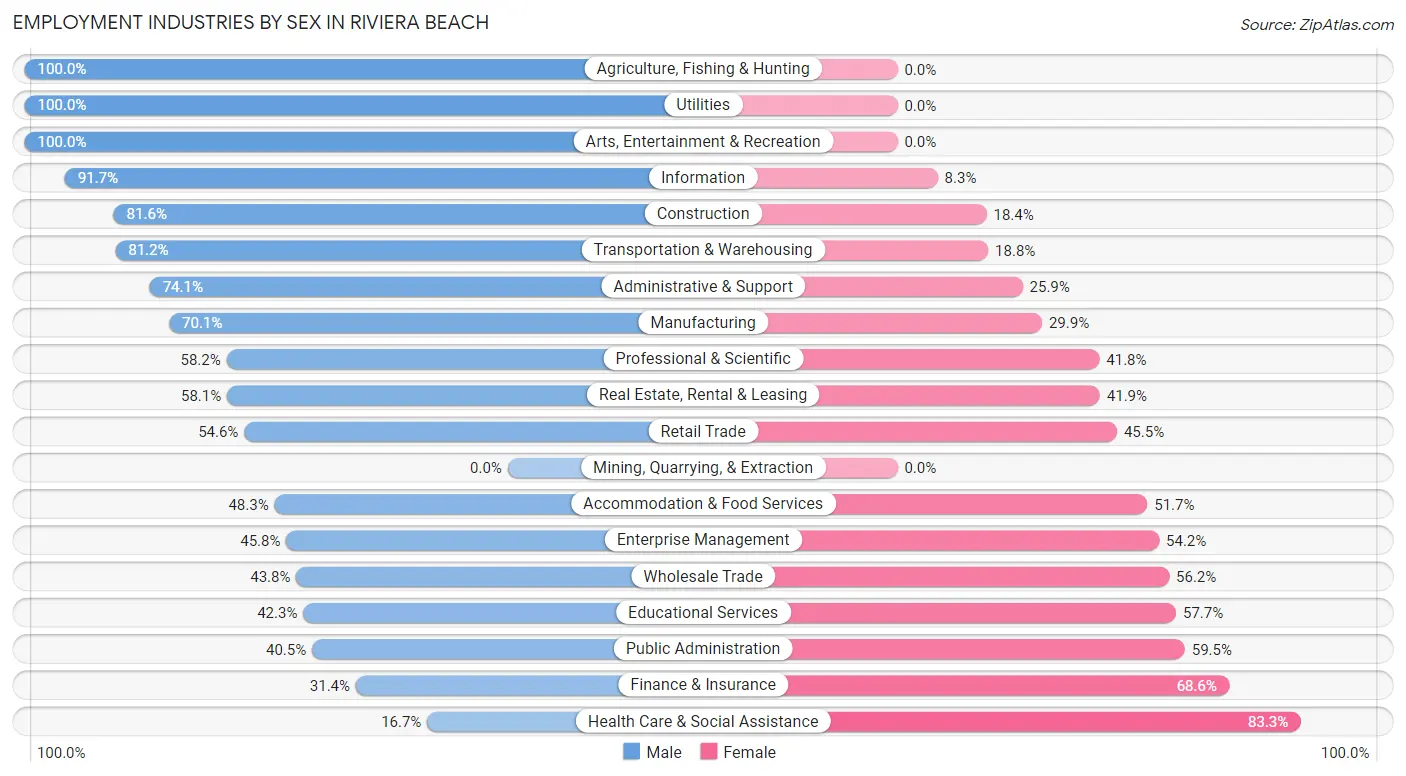
Employment Industries by Sex in Riviera Beach
The Riviera Beach industries that see more men than women are Agriculture, Fishing & Hunting (100.0%), Utilities (100.0%), and Arts, Entertainment & Recreation (100.0%), whereas the industries that tend to have a higher number of women are Health Care & Social Assistance (83.3%), Finance & Insurance (68.6%), and Public Administration (59.5%).
| Industry | Male | Female |
| Agriculture, Fishing & Hunting | 15 (100.0%) | 0 (0.0%) |
| Mining, Quarrying, & Extraction | 0 (0.0%) | 0 (0.0%) |
| Construction | 730 (81.6%) | 165 (18.4%) |
| Manufacturing | 267 (70.1%) | 114 (29.9%) |
| Wholesale Trade | 165 (43.8%) | 212 (56.2%) |
| Retail Trade | 420 (54.5%) | 350 (45.5%) |
| Transportation & Warehousing | 186 (81.2%) | 43 (18.8%) |
| Utilities | 76 (100.0%) | 0 (0.0%) |
| Information | 88 (91.7%) | 8 (8.3%) |
| Finance & Insurance | 44 (31.4%) | 96 (68.6%) |
| Real Estate, Rental & Leasing | 61 (58.1%) | 44 (41.9%) |
| Professional & Scientific | 362 (58.2%) | 260 (41.8%) |
| Enterprise Management | 11 (45.8%) | 13 (54.2%) |
| Administrative & Support | 203 (74.1%) | 71 (25.9%) |
| Educational Services | 127 (42.3%) | 173 (57.7%) |
| Health Care & Social Assistance | 109 (16.7%) | 545 (83.3%) |
| Arts, Entertainment & Recreation | 19 (100.0%) | 0 (0.0%) |
| Accommodation & Food Services | 281 (48.3%) | 301 (51.7%) |
| Public Administration | 205 (40.5%) | 301 (59.5%) |
| Total | 3,508 (54.8%) | 2,888 (45.2%) |
Education in Riviera Beach
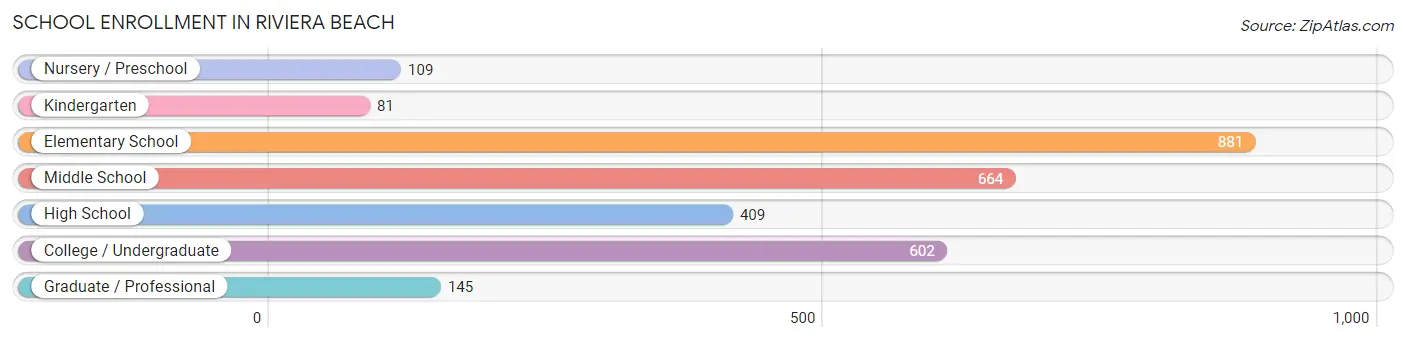
School Enrollment in Riviera Beach
The most common levels of schooling among the 2,891 students in Riviera Beach are elementary school (881 | 30.5%), middle school (664 | 23.0%), and college / undergraduate (602 | 20.8%).
| School Level | # Students | % Students |
| Nursery / Preschool | 109 | 3.8% |
| Kindergarten | 81 | 2.8% |
| Elementary School | 881 | 30.5% |
| Middle School | 664 | 23.0% |
| High School | 409 | 14.1% |
| College / Undergraduate | 602 | 20.8% |
| Graduate / Professional | 145 | 5.0% |
| Total | 2,891 | 100.0% |
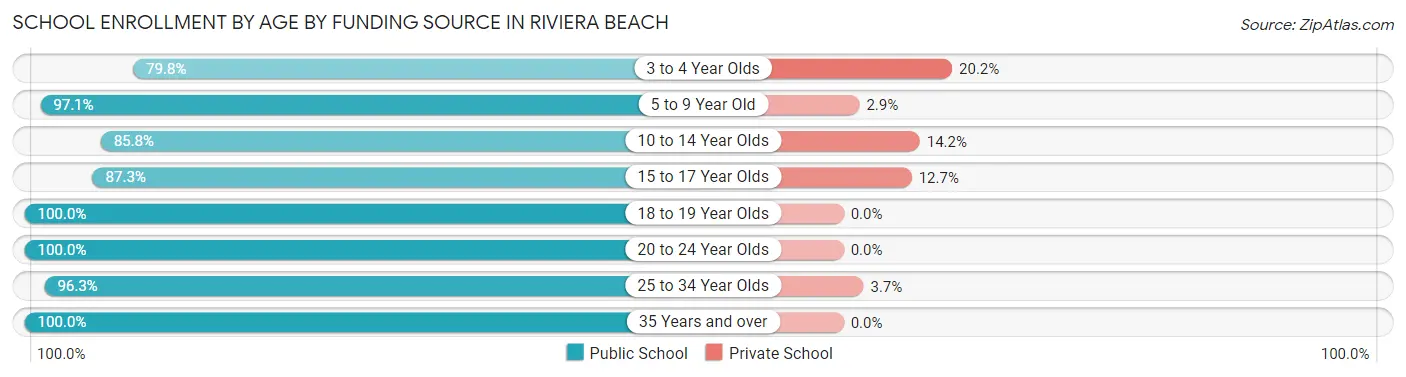
School Enrollment by Age by Funding Source in Riviera Beach
Out of a total of 2,891 students who are enrolled in schools in Riviera Beach, 191 (6.6%) attend a private institution, while the remaining 2,700 (93.4%) are enrolled in public schools. The age group of 3 to 4 year olds has the highest likelihood of being enrolled in private schools, with 20 (20.2% in the age bracket) enrolled. Conversely, the age group of 18 to 19 year olds has the lowest likelihood of being enrolled in a private school, with 327 (100.0% in the age bracket) attending a public institution.
| Age Bracket | Public School | Private School |
| 3 to 4 Year Olds | 79 (79.8%) | 20 (20.2%) |
| 5 to 9 Year Old | 890 (97.1%) | 27 (2.9%) |
| 10 to 14 Year Olds | 593 (85.8%) | 98 (14.2%) |
| 15 to 17 Year Olds | 241 (87.3%) | 35 (12.7%) |
| 18 to 19 Year Olds | 327 (100.0%) | 0 (0.0%) |
| 20 to 24 Year Olds | 209 (100.0%) | 0 (0.0%) |
| 25 to 34 Year Olds | 312 (96.3%) | 12 (3.7%) |
| 35 Years and over | 48 (100.0%) | 0 (0.0%) |
| Total | 2,700 (93.4%) | 191 (6.6%) |
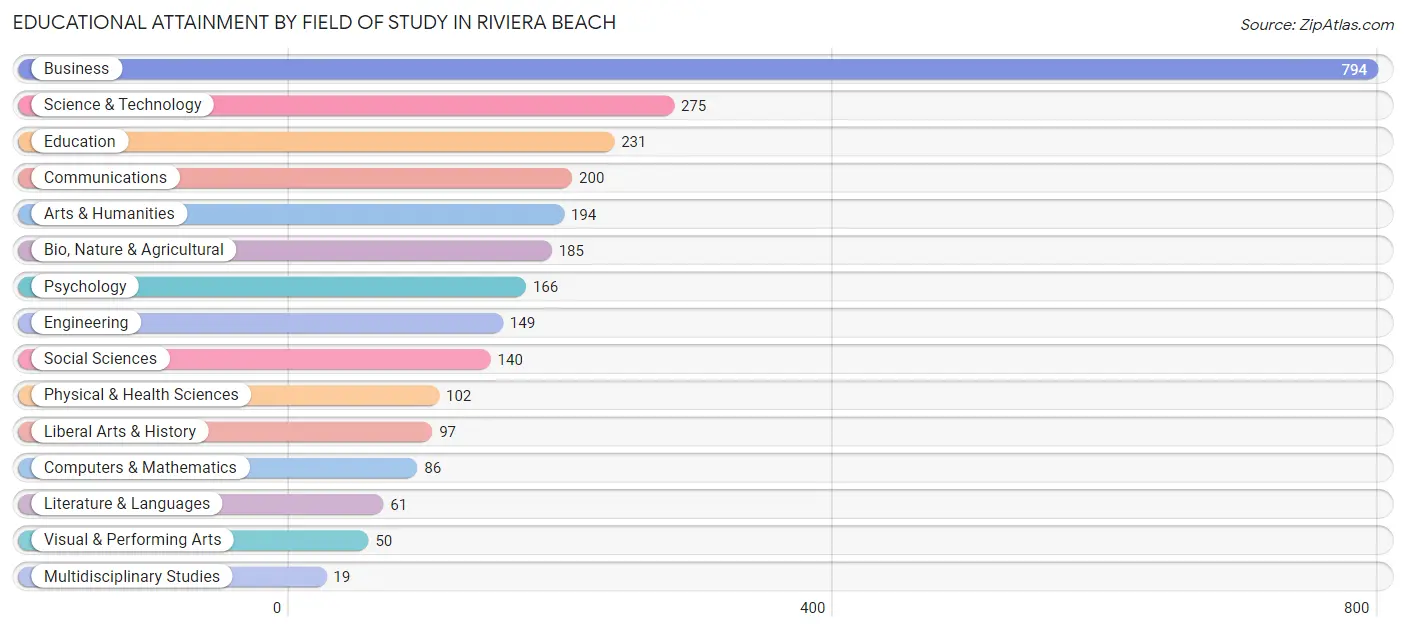
Educational Attainment by Field of Study in Riviera Beach
Business (794 | 28.9%), science & technology (275 | 10.0%), education (231 | 8.4%), communications (200 | 7.3%), and arts & humanities (194 | 7.1%) are the most common fields of study among 2,749 individuals in Riviera Beach who have obtained a bachelor's degree or higher.
| Field of Study | # Graduates | % Graduates |
| Computers & Mathematics | 86 | 3.1% |
| Bio, Nature & Agricultural | 185 | 6.7% |
| Physical & Health Sciences | 102 | 3.7% |
| Psychology | 166 | 6.0% |
| Social Sciences | 140 | 5.1% |
| Engineering | 149 | 5.4% |
| Multidisciplinary Studies | 19 | 0.7% |
| Science & Technology | 275 | 10.0% |
| Business | 794 | 28.9% |
| Education | 231 | 8.4% |
| Literature & Languages | 61 | 2.2% |
| Liberal Arts & History | 97 | 3.5% |
| Visual & Performing Arts | 50 | 1.8% |
| Communications | 200 | 7.3% |
| Arts & Humanities | 194 | 7.1% |
| Total | 2,749 | 100.0% |
Transportation & Commute in Riviera Beach
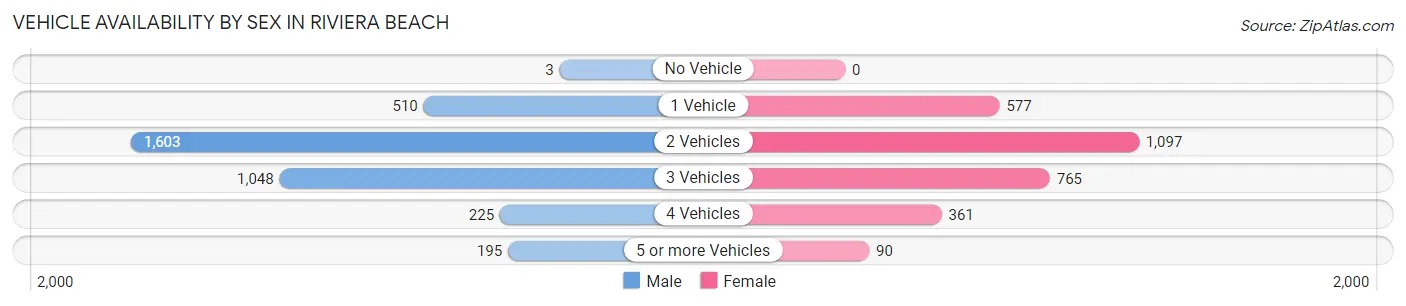
Vehicle Availability by Sex in Riviera Beach
The most prevalent vehicle ownership categories in Riviera Beach are males with 2 vehicles (1,603, accounting for 44.7%) and females with 2 vehicles (1,097, making up 55.5%).
| Vehicles Available | Male | Female |
| No Vehicle | 3 (0.1%) | 0 (0.0%) |
| 1 Vehicle | 510 (14.2%) | 577 (20.0%) |
| 2 Vehicles | 1,603 (44.7%) | 1,097 (38.0%) |
| 3 Vehicles | 1,048 (29.2%) | 765 (26.5%) |
| 4 Vehicles | 225 (6.3%) | 361 (12.5%) |
| 5 or more Vehicles | 195 (5.4%) | 90 (3.1%) |
| Total | 3,584 (100.0%) | 2,890 (100.0%) |
Commute Time in Riviera Beach
The most frequently occuring commute durations in Riviera Beach are 30 to 34 minutes (991 commuters, 16.5%), 20 to 24 minutes (818 commuters, 13.7%), and 45 to 59 minutes (687 commuters, 11.5%).
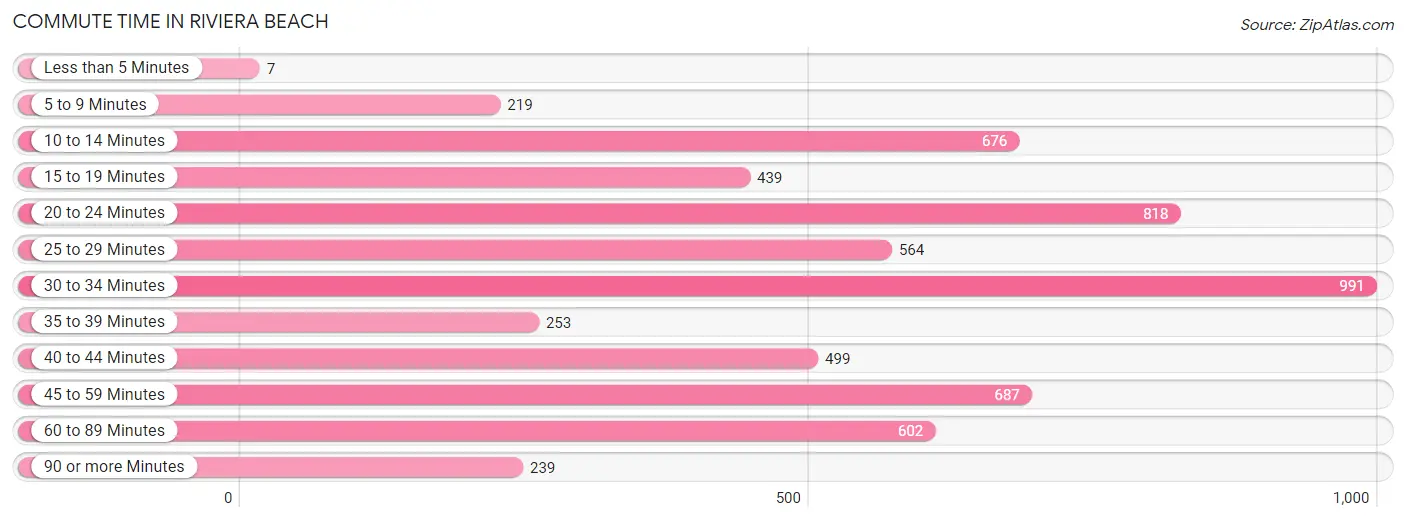
| Commute Time | # Commuters | % Commuters |
| Less than 5 Minutes | 7 | 0.1% |
| 5 to 9 Minutes | 219 | 3.6% |
| 10 to 14 Minutes | 676 | 11.3% |
| 15 to 19 Minutes | 439 | 7.3% |
| 20 to 24 Minutes | 818 | 13.7% |
| 25 to 29 Minutes | 564 | 9.4% |
| 30 to 34 Minutes | 991 | 16.5% |
| 35 to 39 Minutes | 253 | 4.2% |
| 40 to 44 Minutes | 499 | 8.3% |
| 45 to 59 Minutes | 687 | 11.5% |
| 60 to 89 Minutes | 602 | 10.0% |
| 90 or more Minutes | 239 | 4.0% |
Commute Time by Sex in Riviera Beach
The most common commute times in Riviera Beach are 10 to 14 minutes (472 commuters, 14.0%) for males and 30 to 34 minutes (539 commuters, 20.6%) for females.
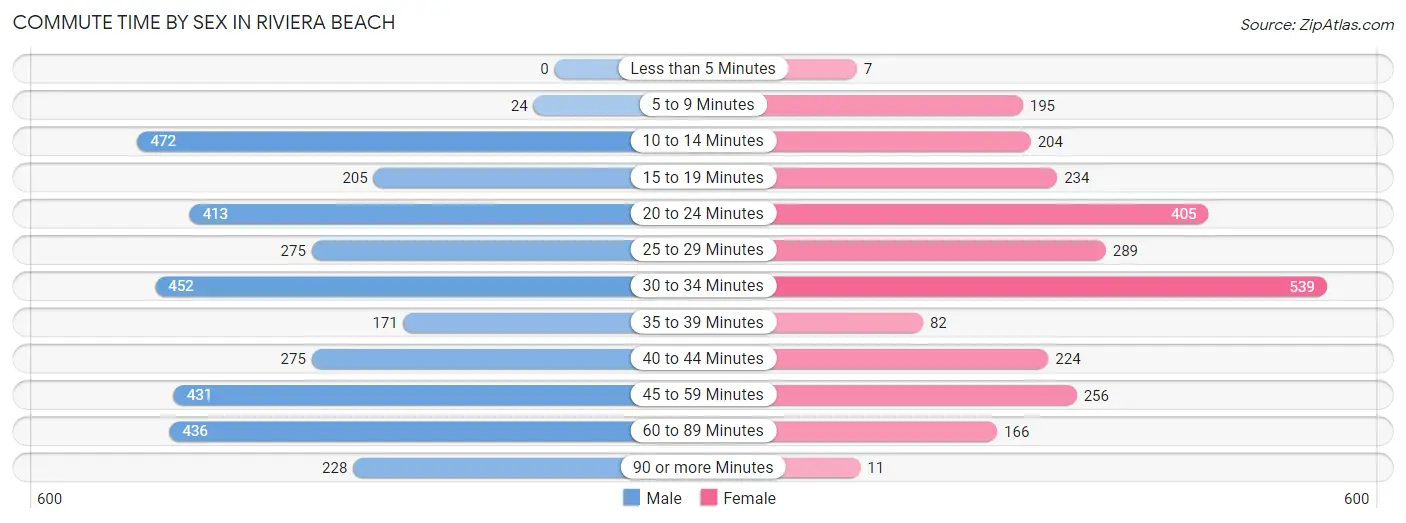
| Commute Time | Male | Female |
| Less than 5 Minutes | 0 (0.0%) | 7 (0.3%) |
| 5 to 9 Minutes | 24 (0.7%) | 195 (7.5%) |
| 10 to 14 Minutes | 472 (14.0%) | 204 (7.8%) |
| 15 to 19 Minutes | 205 (6.1%) | 234 (9.0%) |
| 20 to 24 Minutes | 413 (12.2%) | 405 (15.5%) |
| 25 to 29 Minutes | 275 (8.1%) | 289 (11.1%) |
| 30 to 34 Minutes | 452 (13.4%) | 539 (20.6%) |
| 35 to 39 Minutes | 171 (5.1%) | 82 (3.1%) |
| 40 to 44 Minutes | 275 (8.1%) | 224 (8.6%) |
| 45 to 59 Minutes | 431 (12.7%) | 256 (9.8%) |
| 60 to 89 Minutes | 436 (12.9%) | 166 (6.4%) |
| 90 or more Minutes | 228 (6.7%) | 11 (0.4%) |
Time of Departure to Work by Sex in Riviera Beach
The most frequent times of departure to work in Riviera Beach are 12:00 AM to 4:59 AM (600, 17.7%) for males and 7:30 AM to 7:59 AM (422, 16.2%) for females.
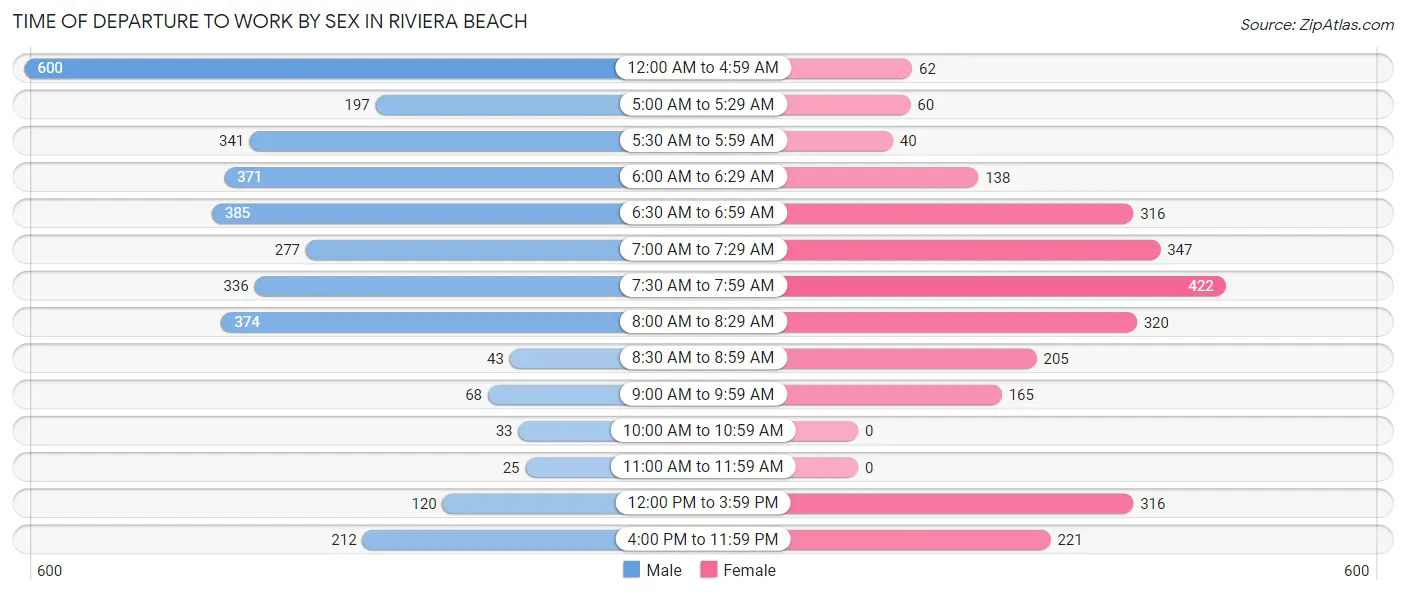
| Time of Departure | Male | Female |
| 12:00 AM to 4:59 AM | 600 (17.7%) | 62 (2.4%) |
| 5:00 AM to 5:29 AM | 197 (5.8%) | 60 (2.3%) |
| 5:30 AM to 5:59 AM | 341 (10.1%) | 40 (1.5%) |
| 6:00 AM to 6:29 AM | 371 (11.0%) | 138 (5.3%) |
| 6:30 AM to 6:59 AM | 385 (11.4%) | 316 (12.1%) |
| 7:00 AM to 7:29 AM | 277 (8.2%) | 347 (13.3%) |
| 7:30 AM to 7:59 AM | 336 (9.9%) | 422 (16.2%) |
| 8:00 AM to 8:29 AM | 374 (11.1%) | 320 (12.2%) |
| 8:30 AM to 8:59 AM | 43 (1.3%) | 205 (7.9%) |
| 9:00 AM to 9:59 AM | 68 (2.0%) | 165 (6.3%) |
| 10:00 AM to 10:59 AM | 33 (1.0%) | 0 (0.0%) |
| 11:00 AM to 11:59 AM | 25 (0.7%) | 0 (0.0%) |
| 12:00 PM to 3:59 PM | 120 (3.5%) | 316 (12.1%) |
| 4:00 PM to 11:59 PM | 212 (6.3%) | 221 (8.5%) |
| Total | 3,382 (100.0%) | 2,612 (100.0%) |
Housing Occupancy in Riviera Beach
Occupancy by Ownership in Riviera Beach
Of the total 4,569 dwellings in Riviera Beach, owner-occupied units account for 3,688 (80.7%), while renter-occupied units make up 881 (19.3%).
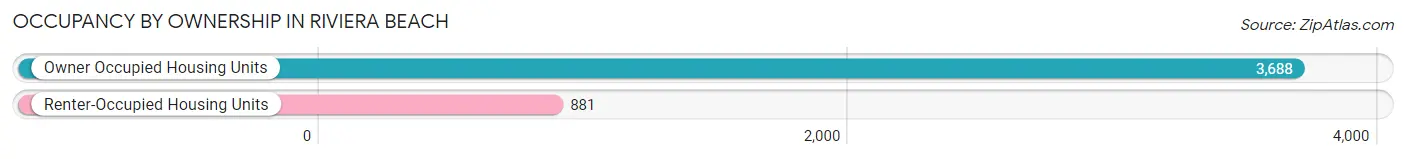
| Occupancy | # Housing Units | % Housing Units |
| Owner Occupied Housing Units | 3,688 | 80.7% |
| Renter-Occupied Housing Units | 881 | 19.3% |
| Total Occupied Housing Units | 4,569 | 100.0% |
Occupancy by Household Size in Riviera Beach
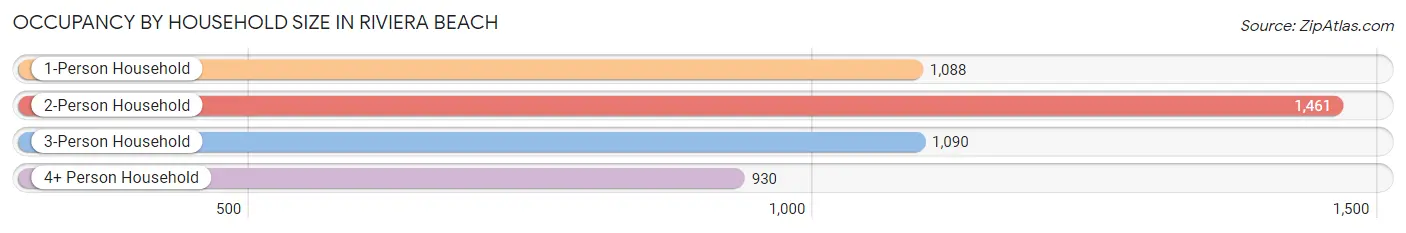
| Household Size | # Housing Units | % Housing Units |
| 1-Person Household | 1,088 | 23.8% |
| 2-Person Household | 1,461 | 32.0% |
| 3-Person Household | 1,090 | 23.9% |
| 4+ Person Household | 930 | 20.3% |
| Total Housing Units | 4,569 | 100.0% |
Occupancy by Ownership by Household Size in Riviera Beach
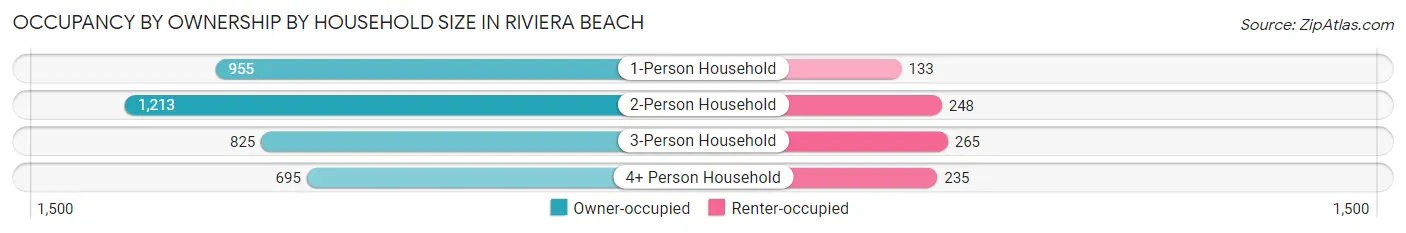
| Household Size | Owner-occupied | Renter-occupied |
| 1-Person Household | 955 (87.8%) | 133 (12.2%) |
| 2-Person Household | 1,213 (83.0%) | 248 (17.0%) |
| 3-Person Household | 825 (75.7%) | 265 (24.3%) |
| 4+ Person Household | 695 (74.7%) | 235 (25.3%) |
| Total Housing Units | 3,688 (80.7%) | 881 (19.3%) |
Occupancy by Educational Attainment in Riviera Beach
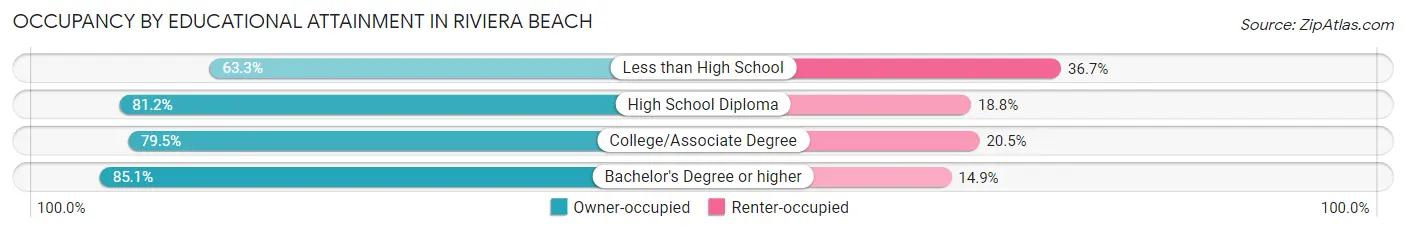
| Household Size | Owner-occupied | Renter-occupied |
| Less than High School | 209 (63.3%) | 121 (36.7%) |
| High School Diploma | 1,019 (81.2%) | 236 (18.8%) |
| College/Associate Degree | 1,126 (79.5%) | 290 (20.5%) |
| Bachelor's Degree or higher | 1,334 (85.1%) | 234 (14.9%) |
Occupancy by Age of Householder in Riviera Beach
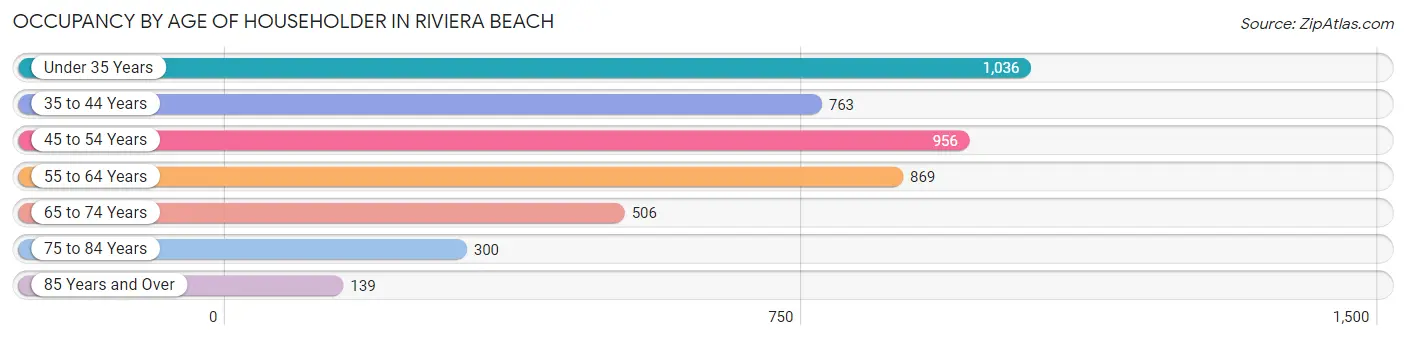
| Age Bracket | # Households | % Households |
| Under 35 Years | 1,036 | 22.7% |
| 35 to 44 Years | 763 | 16.7% |
| 45 to 54 Years | 956 | 20.9% |
| 55 to 64 Years | 869 | 19.0% |
| 65 to 74 Years | 506 | 11.1% |
| 75 to 84 Years | 300 | 6.6% |
| 85 Years and Over | 139 | 3.0% |
| Total | 4,569 | 100.0% |
Housing Finances in Riviera Beach
Median Income by Occupancy in Riviera Beach
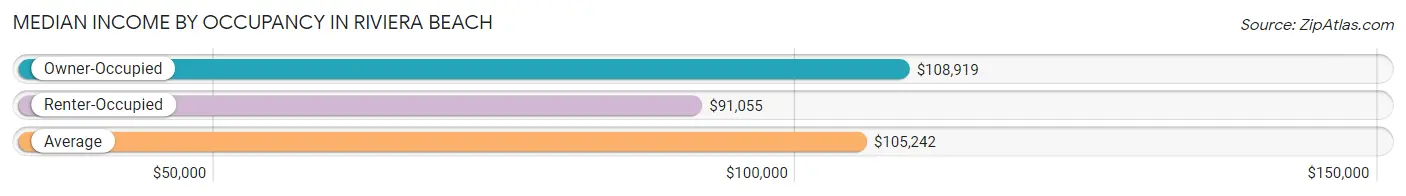
| Occupancy Type | # Households | Median Income |
| Owner-Occupied | 3,688 (80.7%) | $108,919 |
| Renter-Occupied | 881 (19.3%) | $91,055 |
| Average | 4,569 (100.0%) | $105,242 |
Occupancy by Householder Income Bracket in Riviera Beach
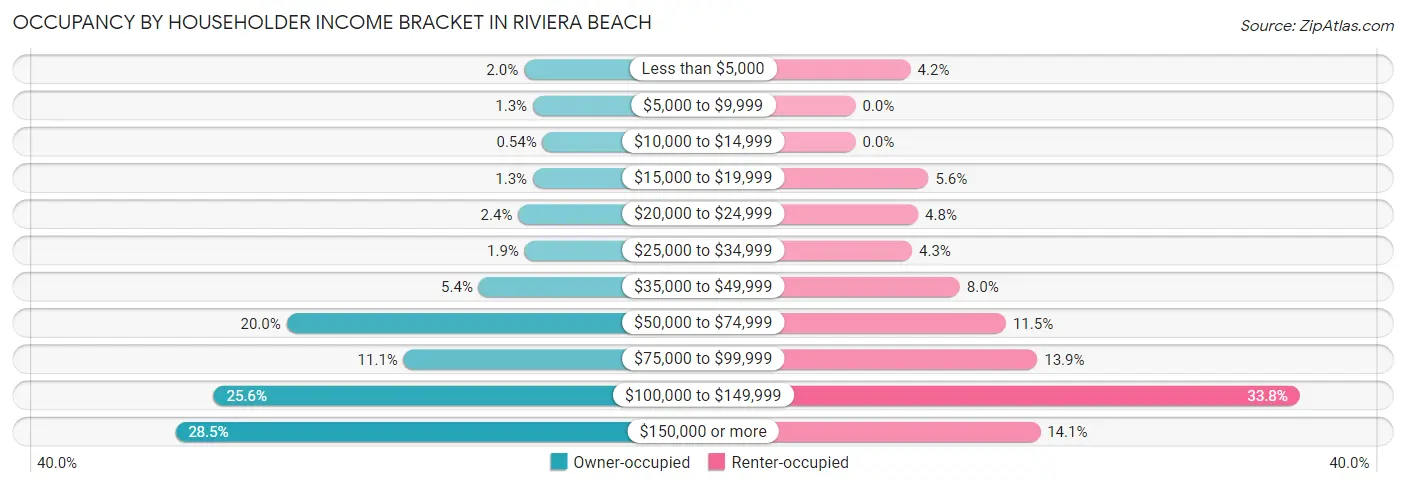
| Income Bracket | Owner-occupied | Renter-occupied |
| Less than $5,000 | 72 (1.9%) | 37 (4.2%) |
| $5,000 to $9,999 | 47 (1.3%) | 0 (0.0%) |
| $10,000 to $14,999 | 20 (0.5%) | 0 (0.0%) |
| $15,000 to $19,999 | 47 (1.3%) | 49 (5.6%) |
| $20,000 to $24,999 | 88 (2.4%) | 42 (4.8%) |
| $25,000 to $34,999 | 70 (1.9%) | 38 (4.3%) |
| $35,000 to $49,999 | 199 (5.4%) | 70 (8.0%) |
| $50,000 to $74,999 | 739 (20.0%) | 101 (11.5%) |
| $75,000 to $99,999 | 410 (11.1%) | 122 (13.9%) |
| $100,000 to $149,999 | 944 (25.6%) | 298 (33.8%) |
| $150,000 or more | 1,052 (28.5%) | 124 (14.1%) |
| Total | 3,688 (100.0%) | 881 (100.0%) |
Monthly Housing Cost Tiers in Riviera Beach
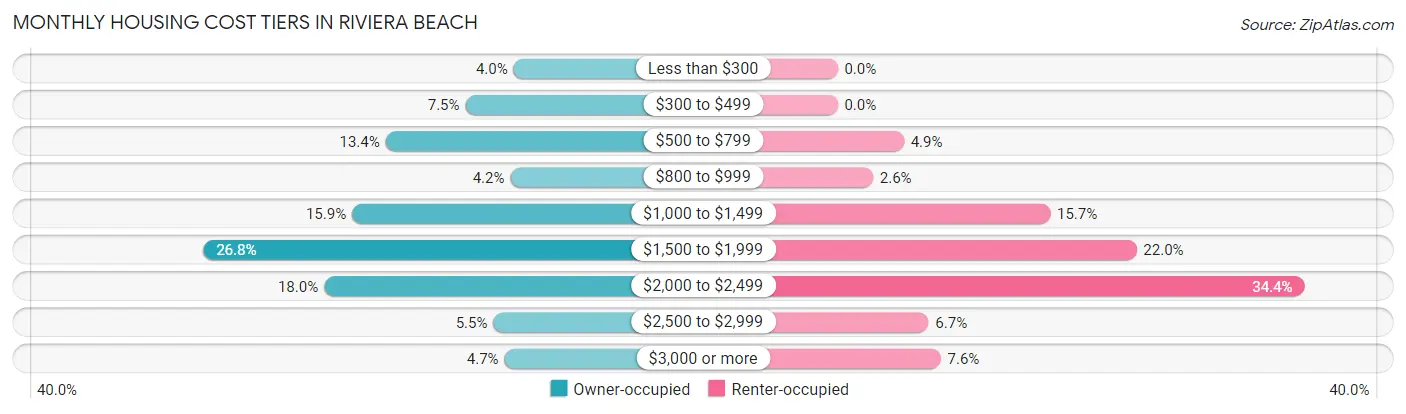
| Monthly Cost | Owner-occupied | Renter-occupied |
| Less than $300 | 147 (4.0%) | 0 (0.0%) |
| $300 to $499 | 278 (7.5%) | 0 (0.0%) |
| $500 to $799 | 495 (13.4%) | 43 (4.9%) |
| $800 to $999 | 156 (4.2%) | 23 (2.6%) |
| $1,000 to $1,499 | 586 (15.9%) | 138 (15.7%) |
| $1,500 to $1,999 | 990 (26.8%) | 194 (22.0%) |
| $2,000 to $2,499 | 662 (17.9%) | 303 (34.4%) |
| $2,500 to $2,999 | 202 (5.5%) | 59 (6.7%) |
| $3,000 or more | 172 (4.7%) | 67 (7.6%) |
| Total | 3,688 (100.0%) | 881 (100.0%) |
Physical Housing Characteristics in Riviera Beach
Housing Structures in Riviera Beach
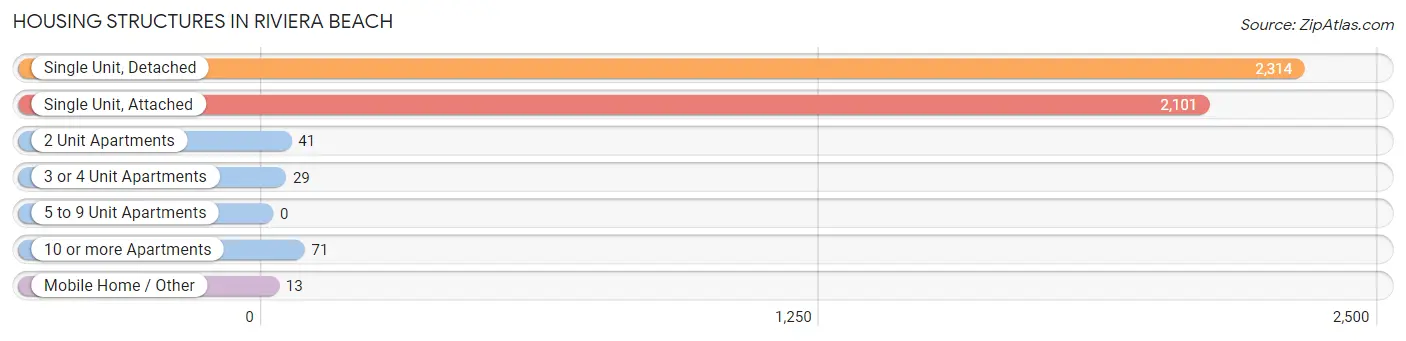
| Structure Type | # Housing Units | % Housing Units |
| Single Unit, Detached | 2,314 | 50.6% |
| Single Unit, Attached | 2,101 | 46.0% |
| 2 Unit Apartments | 41 | 0.9% |
| 3 or 4 Unit Apartments | 29 | 0.6% |
| 5 to 9 Unit Apartments | 0 | 0.0% |
| 10 or more Apartments | 71 | 1.5% |
| Mobile Home / Other | 13 | 0.3% |
| Total | 4,569 | 100.0% |
Housing Structures by Occupancy in Riviera Beach
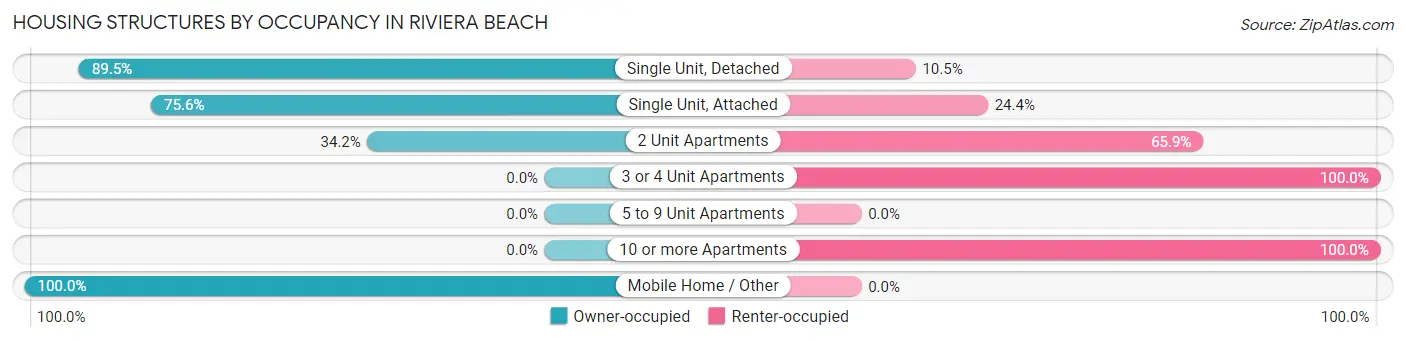
| Structure Type | Owner-occupied | Renter-occupied |
| Single Unit, Detached | 2,072 (89.5%) | 242 (10.5%) |
| Single Unit, Attached | 1,589 (75.6%) | 512 (24.4%) |
| 2 Unit Apartments | 14 (34.2%) | 27 (65.8%) |
| 3 or 4 Unit Apartments | 0 (0.0%) | 29 (100.0%) |
| 5 to 9 Unit Apartments | 0 (0.0%) | 0 (0.0%) |
| 10 or more Apartments | 0 (0.0%) | 71 (100.0%) |
| Mobile Home / Other | 13 (100.0%) | 0 (0.0%) |
| Total | 3,688 (80.7%) | 881 (19.3%) |
Housing Structures by Number of Rooms in Riviera Beach
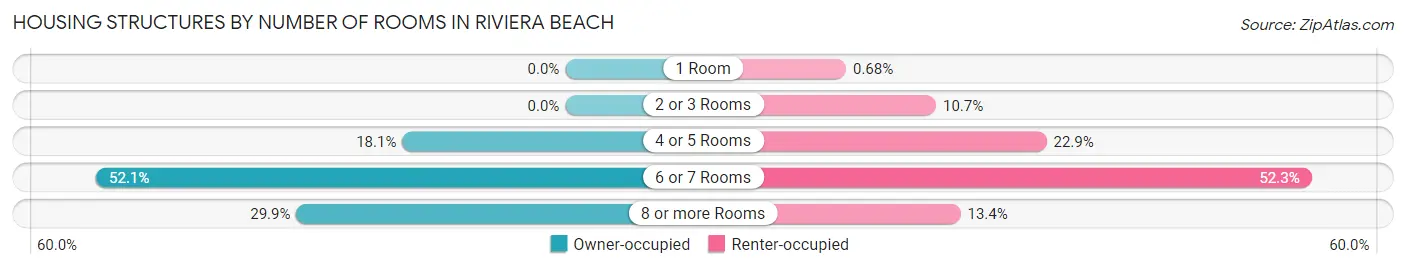
| Number of Rooms | Owner-occupied | Renter-occupied |
| 1 Room | 0 (0.0%) | 6 (0.7%) |
| 2 or 3 Rooms | 0 (0.0%) | 94 (10.7%) |
| 4 or 5 Rooms | 667 (18.1%) | 202 (22.9%) |
| 6 or 7 Rooms | 1,920 (52.1%) | 461 (52.3%) |
| 8 or more Rooms | 1,101 (29.8%) | 118 (13.4%) |
| Total | 3,688 (100.0%) | 881 (100.0%) |
Housing Structure by Heating Type in Riviera Beach
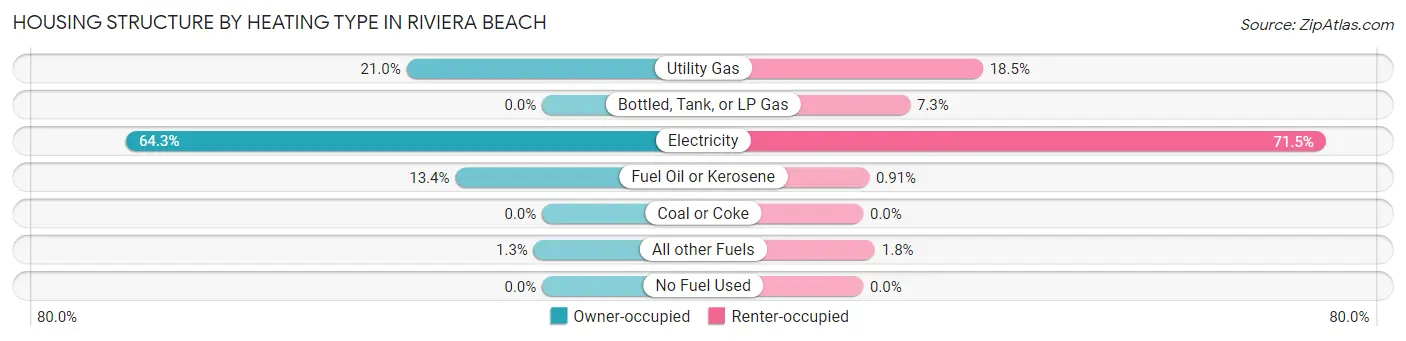
| Heating Type | Owner-occupied | Renter-occupied |
| Utility Gas | 773 (21.0%) | 163 (18.5%) |
| Bottled, Tank, or LP Gas | 0 (0.0%) | 64 (7.3%) |
| Electricity | 2,372 (64.3%) | 630 (71.5%) |
| Fuel Oil or Kerosene | 495 (13.4%) | 8 (0.9%) |
| Coal or Coke | 0 (0.0%) | 0 (0.0%) |
| All other Fuels | 48 (1.3%) | 16 (1.8%) |
| No Fuel Used | 0 (0.0%) | 0 (0.0%) |
| Total | 3,688 (100.0%) | 881 (100.0%) |
Household Vehicle Usage in Riviera Beach
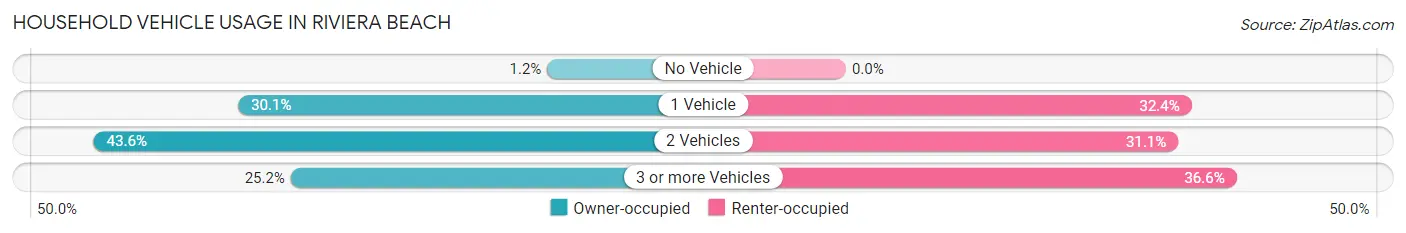
| Vehicles per Household | Owner-occupied | Renter-occupied |
| No Vehicle | 45 (1.2%) | 0 (0.0%) |
| 1 Vehicle | 1,109 (30.1%) | 285 (32.4%) |
| 2 Vehicles | 1,606 (43.5%) | 274 (31.1%) |
| 3 or more Vehicles | 928 (25.2%) | 322 (36.5%) |
| Total | 3,688 (100.0%) | 881 (100.0%) |
Real Estate & Mortgages in Riviera Beach
Real Estate and Mortgage Overview in Riviera Beach
| Characteristic | Without Mortgage | With Mortgage |
| Housing Units | 862 | 2,826 |
| Median Property Value | $307,400 | $325,000 |
| Median Household Income | $69,571 | $934 |
| Monthly Housing Costs | $544 | $172 |
| Real Estate Taxes | $2,796 | $23 |
Property Value by Mortgage Status in Riviera Beach
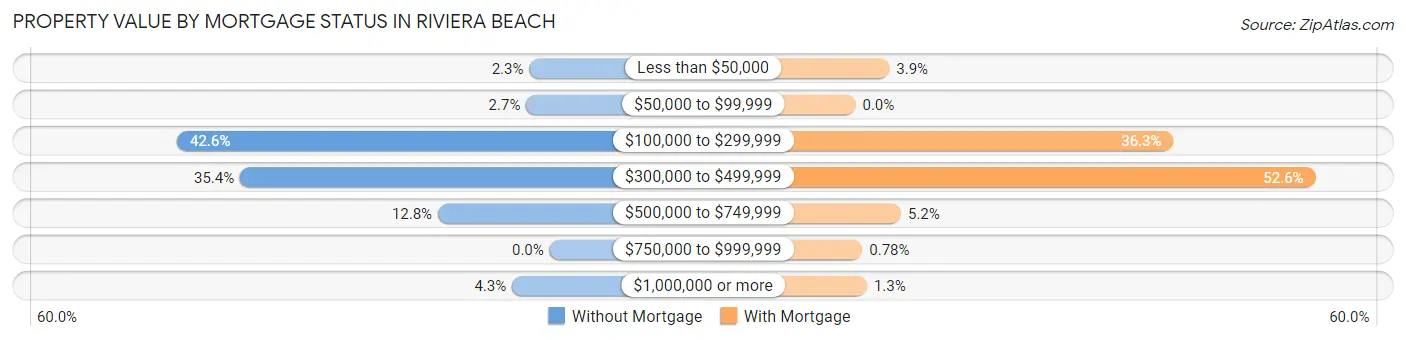
| Property Value | Without Mortgage | With Mortgage |
| Less than $50,000 | 20 (2.3%) | 109 (3.9%) |
| $50,000 to $99,999 | 23 (2.7%) | 0 (0.0%) |
| $100,000 to $299,999 | 367 (42.6%) | 1,026 (36.3%) |
| $300,000 to $499,999 | 305 (35.4%) | 1,485 (52.5%) |
| $500,000 to $749,999 | 110 (12.8%) | 147 (5.2%) |
| $750,000 to $999,999 | 0 (0.0%) | 22 (0.8%) |
| $1,000,000 or more | 37 (4.3%) | 37 (1.3%) |
| Total | 862 (100.0%) | 2,826 (100.0%) |
Household Income by Mortgage Status in Riviera Beach
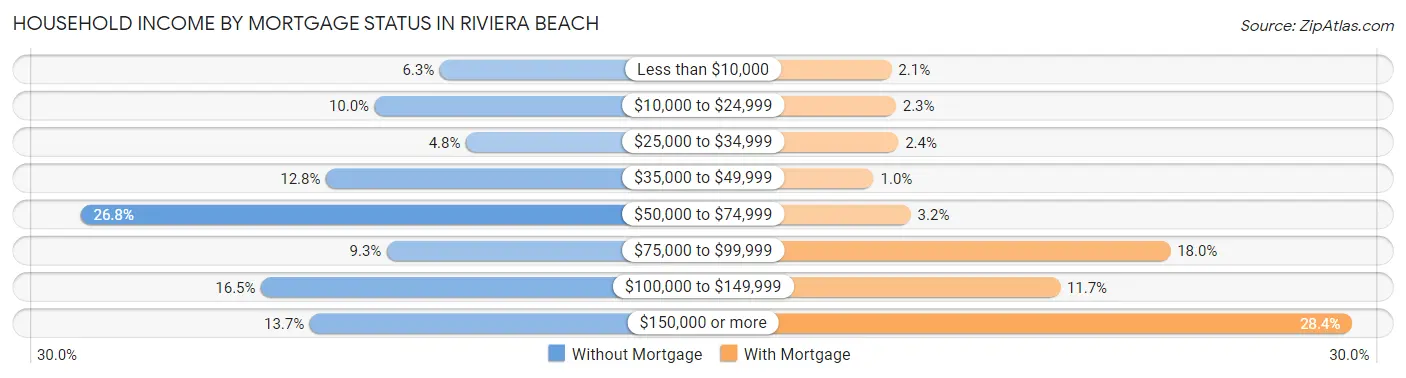
| Household Income | Without Mortgage | With Mortgage |
| Less than $10,000 | 54 (6.3%) | 58 (2.1%) |
| $10,000 to $24,999 | 86 (10.0%) | 65 (2.3%) |
| $25,000 to $34,999 | 41 (4.8%) | 69 (2.4%) |
| $35,000 to $49,999 | 110 (12.8%) | 29 (1.0%) |
| $50,000 to $74,999 | 231 (26.8%) | 89 (3.2%) |
| $75,000 to $99,999 | 80 (9.3%) | 508 (18.0%) |
| $100,000 to $149,999 | 142 (16.5%) | 330 (11.7%) |
| $150,000 or more | 118 (13.7%) | 802 (28.4%) |
| Total | 862 (100.0%) | 2,826 (100.0%) |
Property Value to Household Income Ratio in Riviera Beach
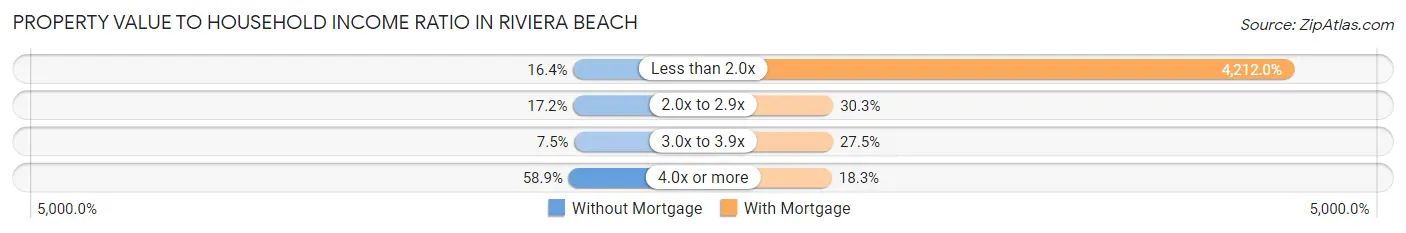
| Value-to-Income Ratio | Without Mortgage | With Mortgage |
| Less than 2.0x | 141 (16.4%) | 119,032 (4,212.0%) |
| 2.0x to 2.9x | 148 (17.2%) | 856 (30.3%) |
| 3.0x to 3.9x | 65 (7.5%) | 778 (27.5%) |
| 4.0x or more | 508 (58.9%) | 516 (18.3%) |
| Total | 862 (100.0%) | 2,826 (100.0%) |
Real Estate Taxes by Mortgage Status in Riviera Beach
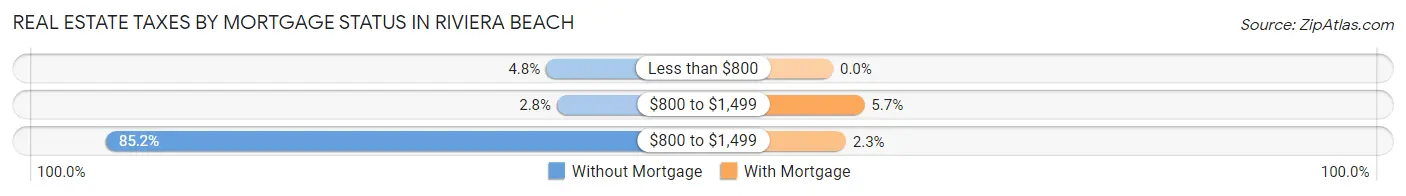
| Property Taxes | Without Mortgage | With Mortgage |
| Less than $800 | 41 (4.8%) | 0 (0.0%) |
| $800 to $1,499 | 24 (2.8%) | 162 (5.7%) |
| $800 to $1,499 | 734 (85.2%) | 66 (2.3%) |
| Total | 862 (100.0%) | 2,826 (100.0%) |
Health & Disability in Riviera Beach
Health Insurance Coverage by Age in Riviera Beach
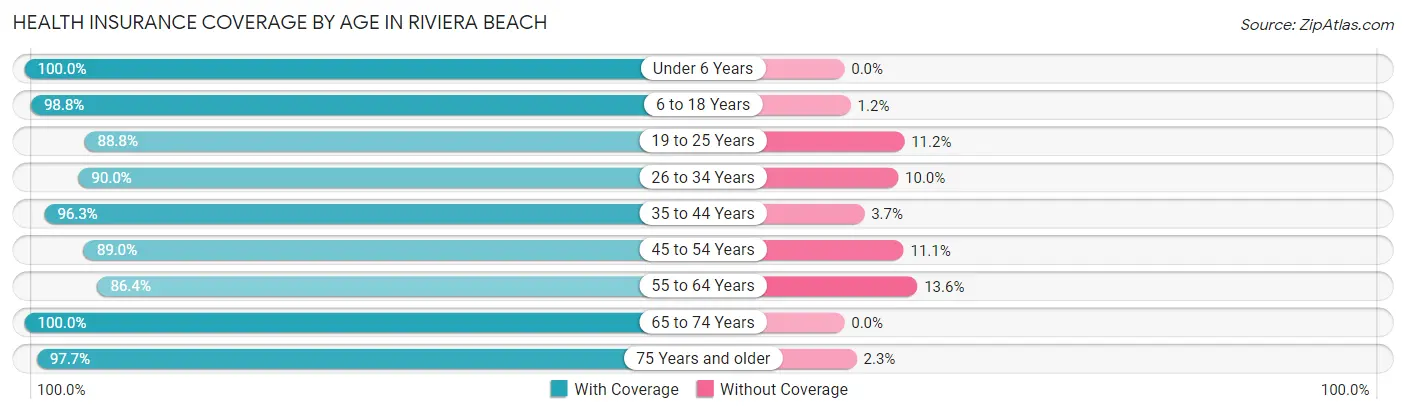
| Age Bracket | With Coverage | Without Coverage |
| Under 6 Years | 753 (100.0%) | 0 (0.0%) |
| 6 to 18 Years | 2,074 (98.8%) | 25 (1.2%) |
| 19 to 25 Years | 588 (88.8%) | 74 (11.2%) |
| 26 to 34 Years | 1,720 (90.0%) | 192 (10.0%) |
| 35 to 44 Years | 1,194 (96.3%) | 46 (3.7%) |
| 45 to 54 Years | 1,682 (88.9%) | 209 (11.1%) |
| 55 to 64 Years | 1,722 (86.4%) | 271 (13.6%) |
| 65 to 74 Years | 779 (100.0%) | 0 (0.0%) |
| 75 Years and older | 682 (97.7%) | 16 (2.3%) |
| Total | 11,194 (93.1%) | 833 (6.9%) |
Health Insurance Coverage by Citizenship Status in Riviera Beach
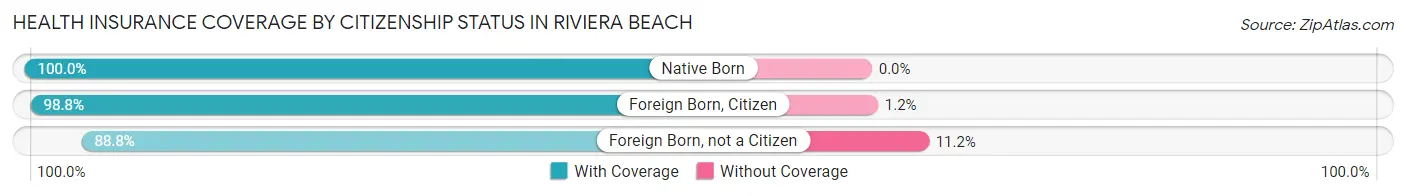
| Citizenship Status | With Coverage | Without Coverage |
| Native Born | 753 (100.0%) | 0 (0.0%) |
| Foreign Born, Citizen | 2,074 (98.8%) | 25 (1.2%) |
| Foreign Born, not a Citizen | 588 (88.8%) | 74 (11.2%) |
Health Insurance Coverage by Household Income in Riviera Beach
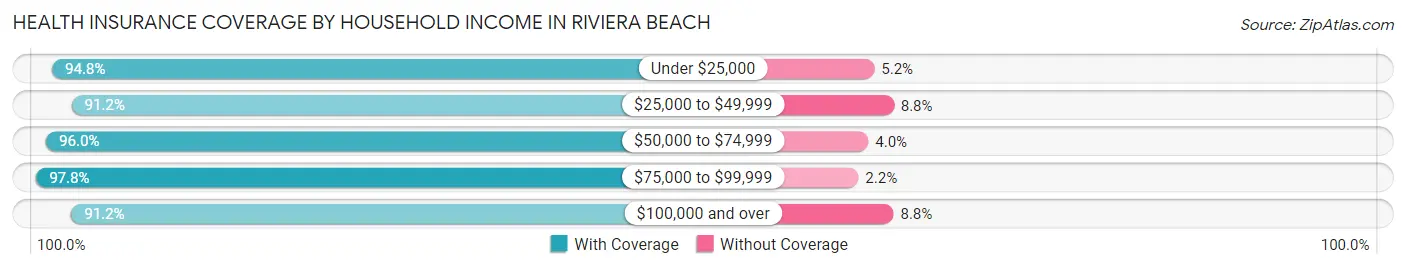
| Household Income | With Coverage | Without Coverage |
| Under $25,000 | 680 (94.8%) | 37 (5.2%) |
| $25,000 to $49,999 | 601 (91.2%) | 58 (8.8%) |
| $50,000 to $74,999 | 1,567 (96.0%) | 66 (4.0%) |
| $75,000 to $99,999 | 1,753 (97.8%) | 39 (2.2%) |
| $100,000 and over | 6,589 (91.2%) | 633 (8.8%) |
Public vs Private Health Insurance Coverage by Age in Riviera Beach
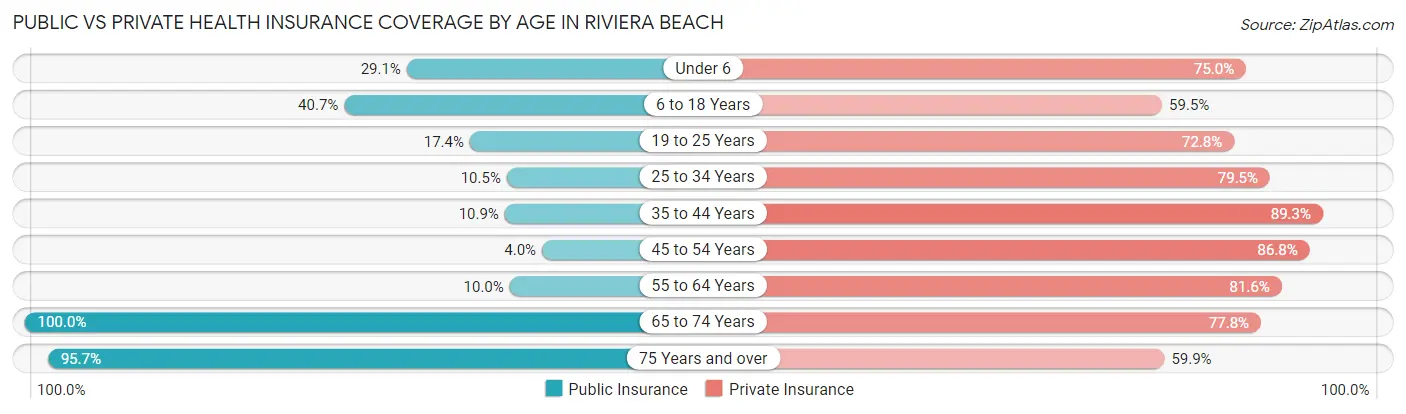
| Age Bracket | Public Insurance | Private Insurance |
| Under 6 | 219 (29.1%) | 565 (75.0%) |
| 6 to 18 Years | 854 (40.7%) | 1,248 (59.5%) |
| 19 to 25 Years | 115 (17.4%) | 482 (72.8%) |
| 25 to 34 Years | 201 (10.5%) | 1,519 (79.4%) |
| 35 to 44 Years | 135 (10.9%) | 1,107 (89.3%) |
| 45 to 54 Years | 75 (4.0%) | 1,642 (86.8%) |
| 55 to 64 Years | 199 (10.0%) | 1,627 (81.6%) |
| 65 to 74 Years | 779 (100.0%) | 606 (77.8%) |
| 75 Years and over | 668 (95.7%) | 418 (59.9%) |
| Total | 3,245 (27.0%) | 9,214 (76.6%) |
Disability Status by Sex by Age in Riviera Beach
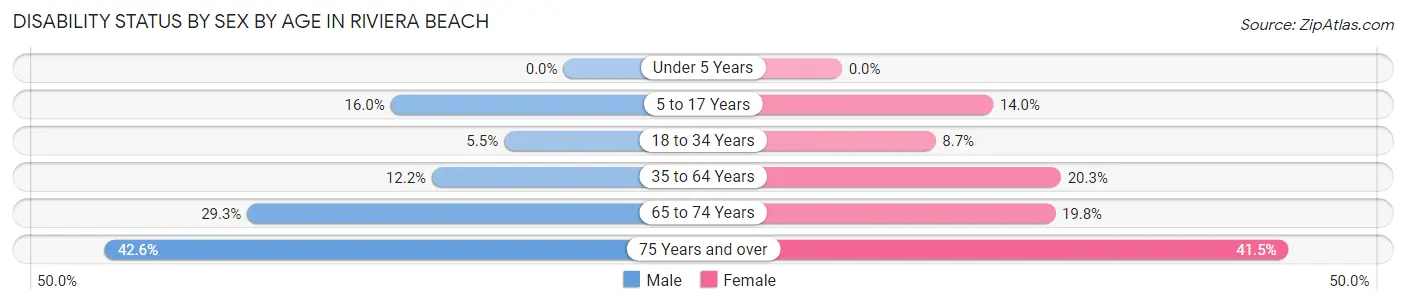
| Age Bracket | Male | Female |
| Under 5 Years | 0 (0.0%) | 0 (0.0%) |
| 5 to 17 Years | 92 (16.0%) | 194 (14.0%) |
| 18 to 34 Years | 60 (5.5%) | 148 (8.7%) |
| 35 to 64 Years | 322 (12.2%) | 505 (20.3%) |
| 65 to 74 Years | 98 (29.3%) | 88 (19.8%) |
| 75 Years and over | 103 (42.6%) | 189 (41.4%) |
Disability Class by Sex by Age in Riviera Beach
Disability Class: Hearing Difficulty
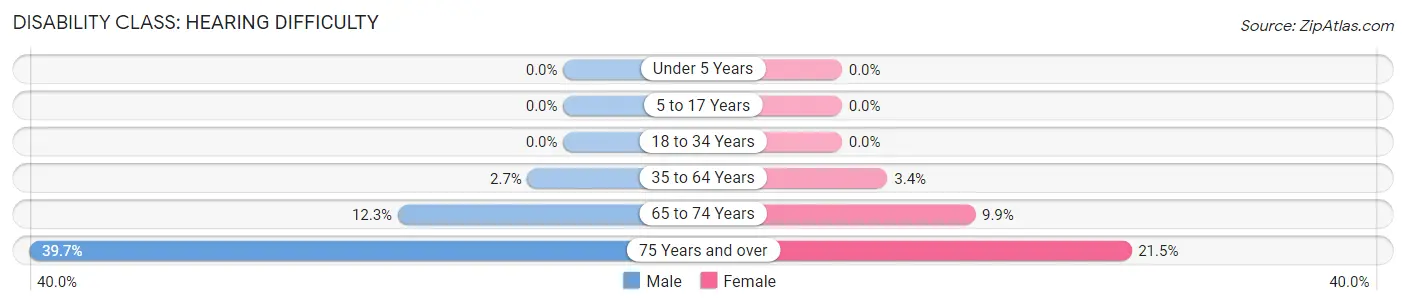
| Age Bracket | Male | Female |
| Under 5 Years | 0 (0.0%) | 0 (0.0%) |
| 5 to 17 Years | 0 (0.0%) | 0 (0.0%) |
| 18 to 34 Years | 0 (0.0%) | 0 (0.0%) |
| 35 to 64 Years | 70 (2.6%) | 84 (3.4%) |
| 65 to 74 Years | 41 (12.3%) | 44 (9.9%) |
| 75 Years and over | 96 (39.7%) | 98 (21.5%) |
Disability Class: Vision Difficulty
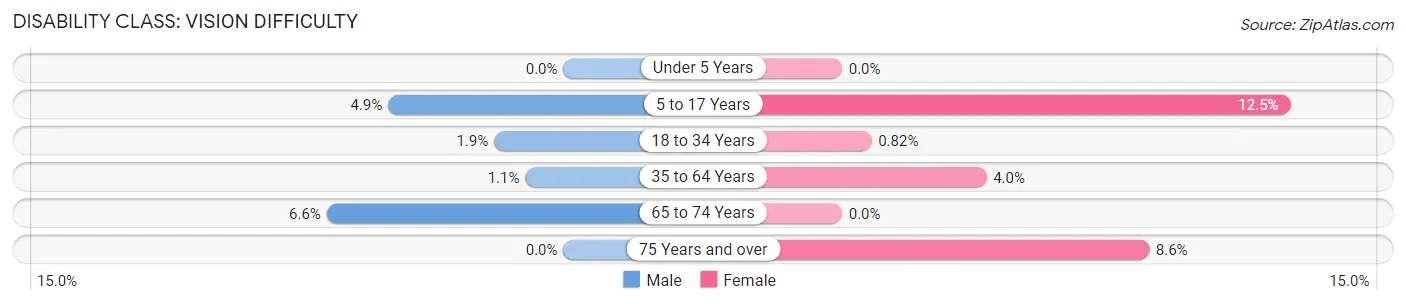
| Age Bracket | Male | Female |
| Under 5 Years | 0 (0.0%) | 0 (0.0%) |
| 5 to 17 Years | 28 (4.9%) | 173 (12.5%) |
| 18 to 34 Years | 21 (1.9%) | 14 (0.8%) |
| 35 to 64 Years | 28 (1.1%) | 100 (4.0%) |
| 65 to 74 Years | 22 (6.6%) | 0 (0.0%) |
| 75 Years and over | 0 (0.0%) | 39 (8.6%) |
Disability Class: Cognitive Difficulty
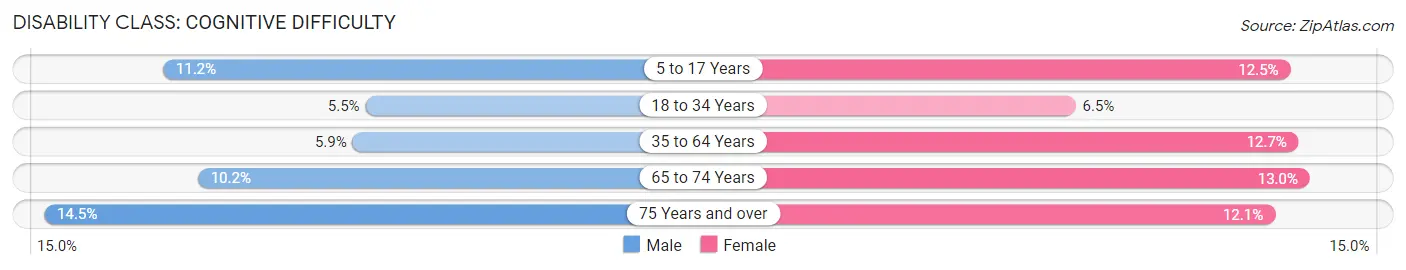
| Age Bracket | Male | Female |
| 5 to 17 Years | 64 (11.2%) | 173 (12.5%) |
| 18 to 34 Years | 60 (5.5%) | 111 (6.5%) |
| 35 to 64 Years | 155 (5.9%) | 316 (12.7%) |
| 65 to 74 Years | 34 (10.2%) | 58 (13.0%) |
| 75 Years and over | 35 (14.5%) | 55 (12.1%) |
Disability Class: Ambulatory Difficulty
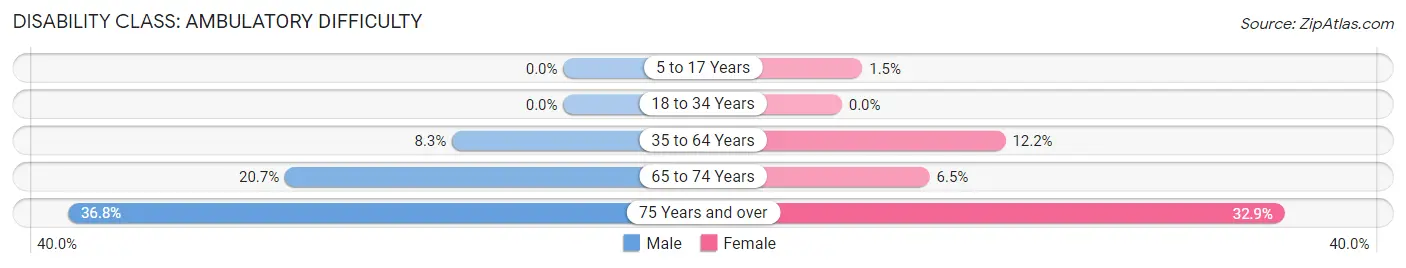
| Age Bracket | Male | Female |
| 5 to 17 Years | 0 (0.0%) | 21 (1.5%) |
| 18 to 34 Years | 0 (0.0%) | 0 (0.0%) |
| 35 to 64 Years | 218 (8.3%) | 302 (12.1%) |
| 65 to 74 Years | 69 (20.7%) | 29 (6.5%) |
| 75 Years and over | 89 (36.8%) | 150 (32.9%) |
Disability Class: Self-Care Difficulty
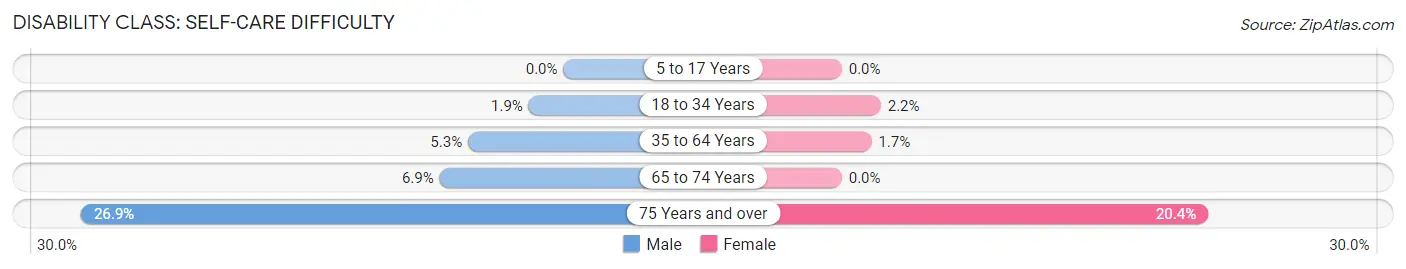
| Age Bracket | Male | Female |
| 5 to 17 Years | 0 (0.0%) | 0 (0.0%) |
| 18 to 34 Years | 21 (1.9%) | 37 (2.2%) |
| 35 to 64 Years | 140 (5.3%) | 41 (1.7%) |
| 65 to 74 Years | 23 (6.9%) | 0 (0.0%) |
| 75 Years and over | 65 (26.9%) | 93 (20.4%) |
Technology Access in Riviera Beach
Computing Device Access in Riviera Beach
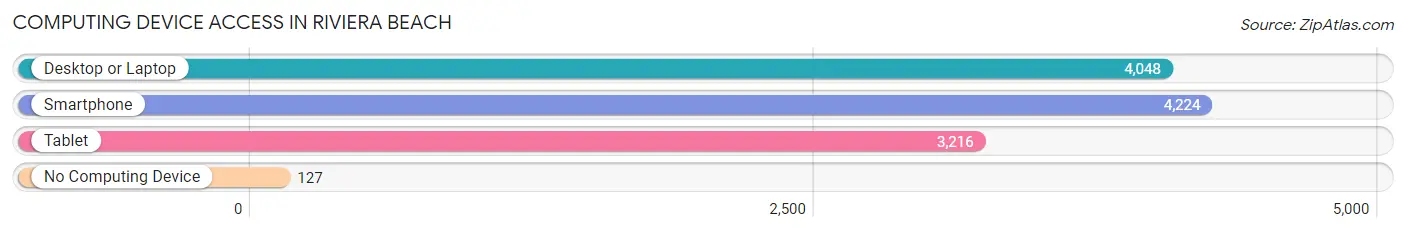
| Device Type | # Households | % Households |
| Desktop or Laptop | 4,048 | 88.6% |
| Smartphone | 4,224 | 92.4% |
| Tablet | 3,216 | 70.4% |
| No Computing Device | 127 | 2.8% |
| Total | 4,569 | 100.0% |
Internet Access in Riviera Beach
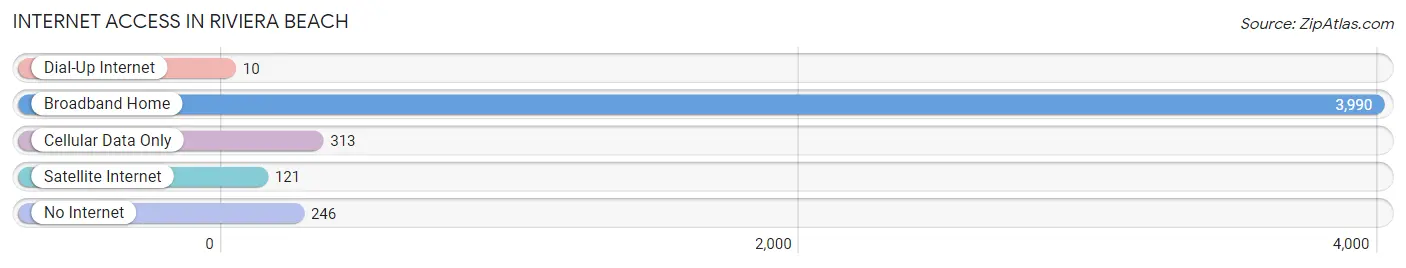
| Internet Type | # Households | % Households |
| Dial-Up Internet | 10 | 0.2% |
| Broadband Home | 3,990 | 87.3% |
| Cellular Data Only | 313 | 6.9% |
| Satellite Internet | 121 | 2.6% |
| No Internet | 246 | 5.4% |
| Total | 4,569 | 100.0% |
Riviera Beach Summary
Riviera Beach is a small town located in Anne Arundel County, Maryland. It is situated on the western shore of the Chesapeake Bay, approximately 25 miles south of Baltimore and 40 miles east of Washington, D.C. The town has a population of approximately 2,500 people and covers an area of 1.2 square miles.
History
Riviera Beach was first settled in the early 1700s by English settlers. The town was originally known as “Riviera” and was part of the larger area known as “Riviera Beach”. The town was officially incorporated in 1887 and was named after the nearby Riviera Creek.
In the late 1800s, the town was a popular summer resort destination for wealthy Baltimoreans. The town was home to several large hotels, including the Riviera Hotel, which was built in 1891. The hotel was destroyed by a fire in the early 1900s and was never rebuilt.
In the early 1900s, the town began to develop as a residential community. The town was home to several large estates, including the Riviera Beach Estate, which was owned by the prominent Baltimore banker, William T. Walters. The estate was later purchased by the United States Navy and is now the site of the Naval Support Activity Annapolis.
Geography
Riviera Beach is located on the western shore of the Chesapeake Bay. The town is bordered by the Magothy River to the north, the Severn River to the east, and the Patuxent River to the south. The town is located approximately 25 miles south of Baltimore and 40 miles east of Washington, D.C.
The town is situated on a peninsula, which is surrounded by the Chesapeake Bay on three sides. The town is home to several small islands, including the Riviera Beach Island, which is located just off the coast of the town.
Economy
Riviera Beach is primarily a residential community, with most of its residents employed in the nearby cities of Baltimore and Washington, D.C. The town is home to several small businesses, including a marina, a seafood market, and a few restaurants.
The town is also home to the Naval Support Activity Annapolis, which is a major employer in the area. The base is home to several thousand military personnel and their families.
Demographics
As of the 2010 census, the population of Riviera Beach was 2,500 people. The town is predominantly white, with approximately 85% of the population identifying as white. The remaining 15% of the population is made up of African Americans, Hispanics, and other ethnicities.
The median household income in Riviera Beach is $60,000, which is slightly higher than the national average. The town has a low unemployment rate, with only 4.5% of the population unemployed.
Conclusion
Riviera Beach is a small town located on the western shore of the Chesapeake Bay in Anne Arundel County, Maryland. The town has a population of approximately 2,500 people and covers an area of 1.2 square miles. The town was first settled in the early 1700s and was originally known as “Riviera”. In the late 1800s, the town was a popular summer resort destination for wealthy Baltimoreans. Today, the town is primarily a residential community, with most of its residents employed in the nearby cities of Baltimore and Washington, D.C. The town is predominantly white, with approximately 85% of the population identifying as white. The median household income in Riviera Beach is $60,000, which is slightly higher than the national average.
Common Questions
What is Per Capita Income in Riviera Beach?
Per Capita income in Riviera Beach is $45,069.
What is the Median Family Income in Riviera Beach?
Median Family Income in Riviera Beach is $114,773.
What is the Median Household income in Riviera Beach?
Median Household Income in Riviera Beach is $105,242.
What is Income or Wage Gap in Riviera Beach?
Income or Wage Gap in Riviera Beach is 14.9%.
Women in Riviera Beach earn 85.1 cents for every dollar earned by a man.
What is Inequality or Gini Index in Riviera Beach?
Inequality or Gini Index in Riviera Beach is 0.35.
What is the Total Population of Riviera Beach?
Total Population of Riviera Beach is 12,121.
What is the Total Male Population of Riviera Beach?
Total Male Population of Riviera Beach is 5,275.
What is the Total Female Population of Riviera Beach?
Total Female Population of Riviera Beach is 6,846.
What is the Ratio of Males per 100 Females in Riviera Beach?
There are 77.05 Males per 100 Females in Riviera Beach.
What is the Ratio of Females per 100 Males in Riviera Beach?
There are 129.78 Females per 100 Males in Riviera Beach.
What is the Median Population Age in Riviera Beach?
Median Population Age in Riviera Beach is 38.8 Years.
What is the Average Family Size in Riviera Beach
Average Family Size in Riviera Beach is 3.2 People.
What is the Average Household Size in Riviera Beach
Average Household Size in Riviera Beach is 2.6 People.
How Large is the Labor Force in Riviera Beach?
There are 6,835 People in the Labor Forcein in Riviera Beach.
What is the Percentage of People in the Labor Force in Riviera Beach?
70.7% of People are in the Labor Force in Riviera Beach.
What is the Unemployment Rate in Riviera Beach?
Unemployment Rate in Riviera Beach is 5.2%.