Algonquin, MD Map & Demographics
Algonquin Map
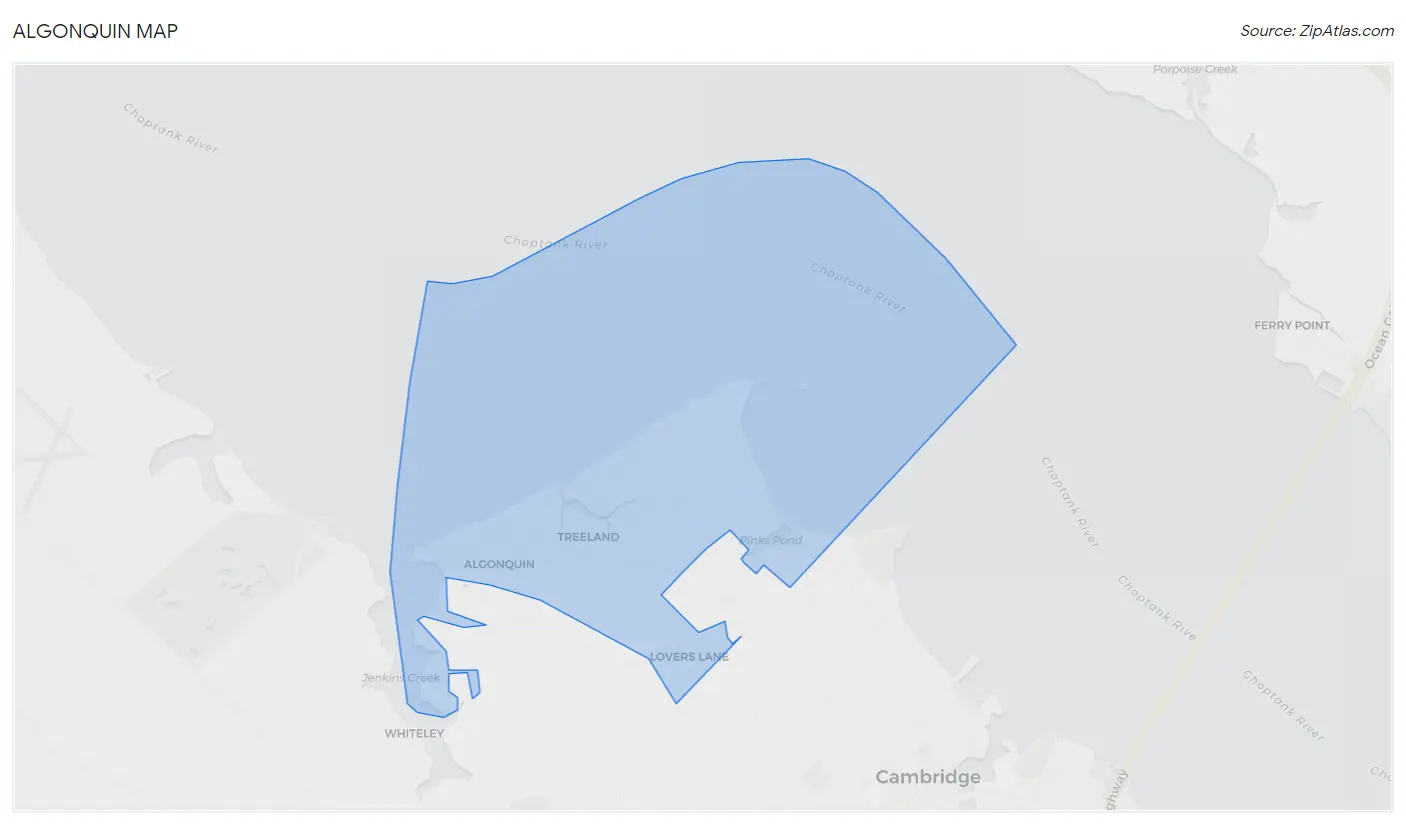
Algonquin Overview
$40,798
PER CAPITA INCOME
$66,008
AVG FAMILY INCOME
$64,185
AVG HOUSEHOLD INCOME
19.0%
WAGE / INCOME GAP [ % ]
81.0¢/ $1
WAGE / INCOME GAP [ $ ]
0.39
INEQUALITY / GINI INDEX
1,055
TOTAL POPULATION
517
MALE POPULATION
538
FEMALE POPULATION
96.10
MALES / 100 FEMALES
104.06
FEMALES / 100 MALES
60.4
MEDIAN AGE
2.5
AVG FAMILY SIZE
2.1
AVG HOUSEHOLD SIZE
510
LABOR FORCE [ PEOPLE ]
55.6%
PERCENT IN LABOR FORCE
8.0%
UNEMPLOYMENT RATE
Income in Algonquin
Income Overview in Algonquin
Per Capita Income in Algonquin is $40,798, while median incomes of families and households are $66,008 and $64,185 respectively.
| Characteristic | Number | Measure |
| Per Capita Income | 1,055 | $40,798 |
| Median Family Income | 363 | $66,008 |
| Mean Family Income | 363 | $89,413 |
| Median Household Income | 509 | $64,185 |
| Mean Household Income | 509 | $83,108 |
| Income Deficit | 363 | $0 |
| Wage / Income Gap (%) | 1,055 | 19.01% |
| Wage / Income Gap ($) | 1,055 | 80.99¢ per $1 |
| Gini / Inequality Index | 1,055 | 0.39 |
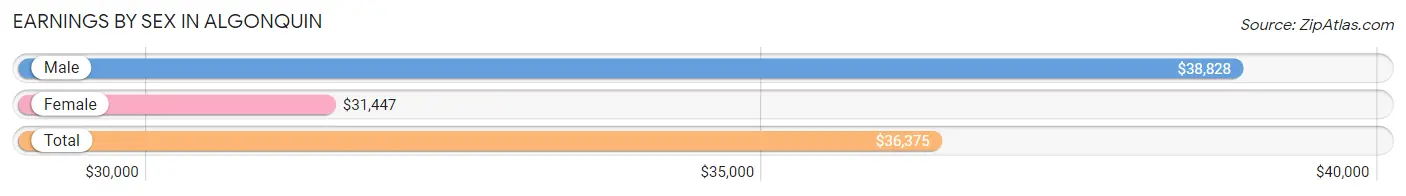
Earnings by Sex in Algonquin
Average Earnings in Algonquin are $36,375, $38,828 for men and $31,447 for women, a difference of 19.0%.
| Sex | Number | Average Earnings |
| Male | 307 (57.2%) | $38,828 |
| Female | 230 (42.8%) | $31,447 |
| Total | 537 (100.0%) | $36,375 |
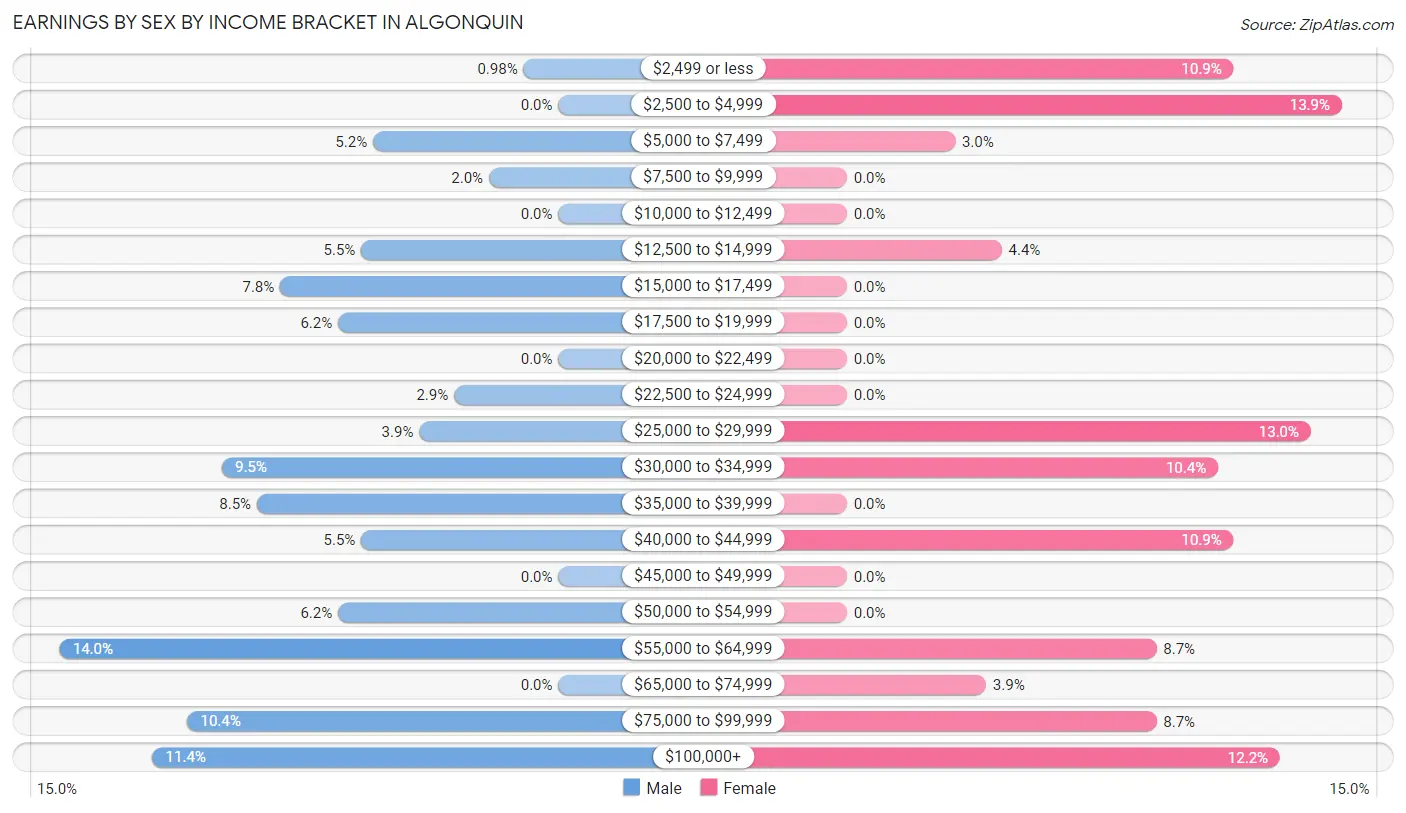
Earnings by Sex by Income Bracket in Algonquin
The most common earnings brackets in Algonquin are $55,000 to $64,999 for men (43 | 14.0%) and $2,500 to $4,999 for women (32 | 13.9%).
| Income | Male | Female |
| $2,499 or less | 3 (1.0%) | 25 (10.9%) |
| $2,500 to $4,999 | 0 (0.0%) | 32 (13.9%) |
| $5,000 to $7,499 | 16 (5.2%) | 7 (3.0%) |
| $7,500 to $9,999 | 6 (1.9%) | 0 (0.0%) |
| $10,000 to $12,499 | 0 (0.0%) | 0 (0.0%) |
| $12,500 to $14,999 | 17 (5.5%) | 10 (4.3%) |
| $15,000 to $17,499 | 24 (7.8%) | 0 (0.0%) |
| $17,500 to $19,999 | 19 (6.2%) | 0 (0.0%) |
| $20,000 to $22,499 | 0 (0.0%) | 0 (0.0%) |
| $22,500 to $24,999 | 9 (2.9%) | 0 (0.0%) |
| $25,000 to $29,999 | 12 (3.9%) | 30 (13.0%) |
| $30,000 to $34,999 | 29 (9.5%) | 24 (10.4%) |
| $35,000 to $39,999 | 26 (8.5%) | 0 (0.0%) |
| $40,000 to $44,999 | 17 (5.5%) | 25 (10.9%) |
| $45,000 to $49,999 | 0 (0.0%) | 0 (0.0%) |
| $50,000 to $54,999 | 19 (6.2%) | 0 (0.0%) |
| $55,000 to $64,999 | 43 (14.0%) | 20 (8.7%) |
| $65,000 to $74,999 | 0 (0.0%) | 9 (3.9%) |
| $75,000 to $99,999 | 32 (10.4%) | 20 (8.7%) |
| $100,000+ | 35 (11.4%) | 28 (12.2%) |
| Total | 307 (100.0%) | 230 (100.0%) |
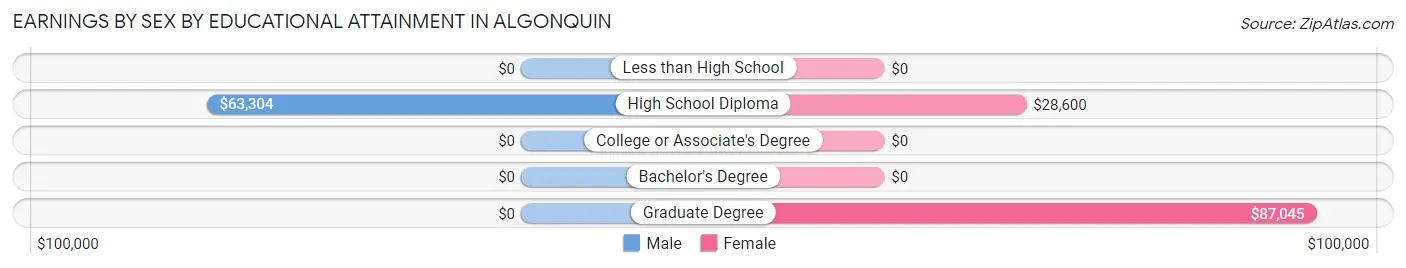
Earnings by Sex by Educational Attainment in Algonquin
Average earnings in Algonquin are $39,844 for men and $31,382 for women, a difference of 21.2%. Men with an educational attainment of high school diploma enjoy the highest average annual earnings of $63,304, while those with high school diploma education earn the least with $63,304. Women with an educational attainment of graduate degree earn the most with the average annual earnings of $87,045, while those with high school diploma education have the smallest earnings of $28,600.
| Educational Attainment | Male Income | Female Income |
| Less than High School | - | - |
| High School Diploma | $63,304 | $28,600 |
| College or Associate's Degree | - | - |
| Bachelor's Degree | - | - |
| Graduate Degree | - | - |
| Total | $39,844 | $31,382 |
Family Income in Algonquin
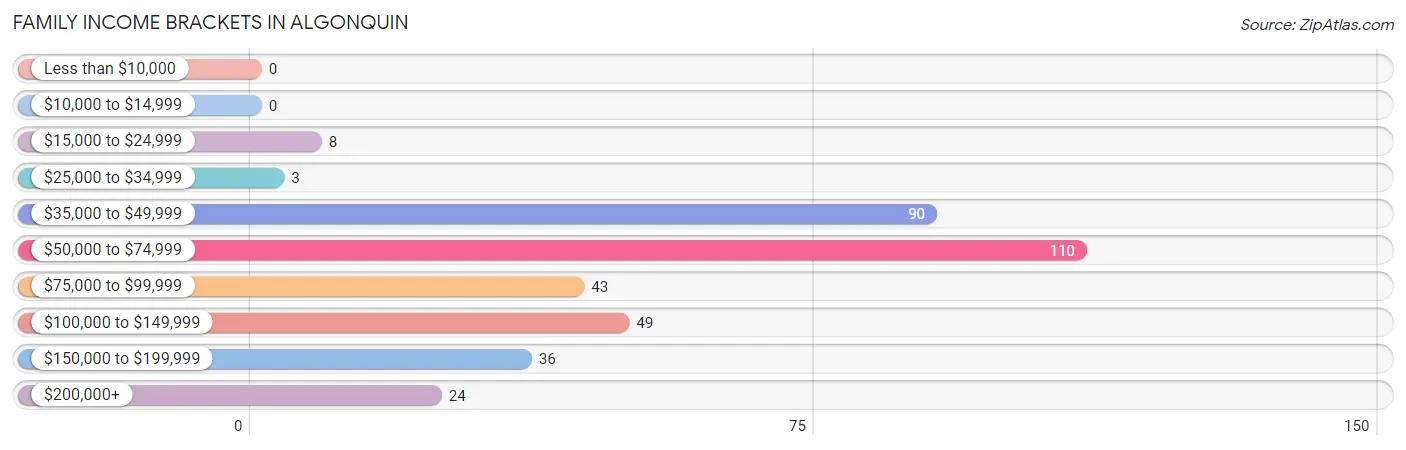
Family Income Brackets in Algonquin
According to the Algonquin family income data, there are 110 families falling into the $50,000 to $74,999 income range, which is the most common income bracket and makes up 30.3% of all families.
| Income Bracket | # Families | % Families |
| Less than $10,000 | 0 | 0.0% |
| $10,000 to $14,999 | 0 | 0.0% |
| $15,000 to $24,999 | 8 | 2.2% |
| $25,000 to $34,999 | 3 | 0.8% |
| $35,000 to $49,999 | 90 | 24.8% |
| $50,000 to $74,999 | 110 | 30.3% |
| $75,000 to $99,999 | 43 | 11.8% |
| $100,000 to $149,999 | 49 | 13.5% |
| $150,000 to $199,999 | 36 | 9.9% |
| $200,000+ | 24 | 6.6% |
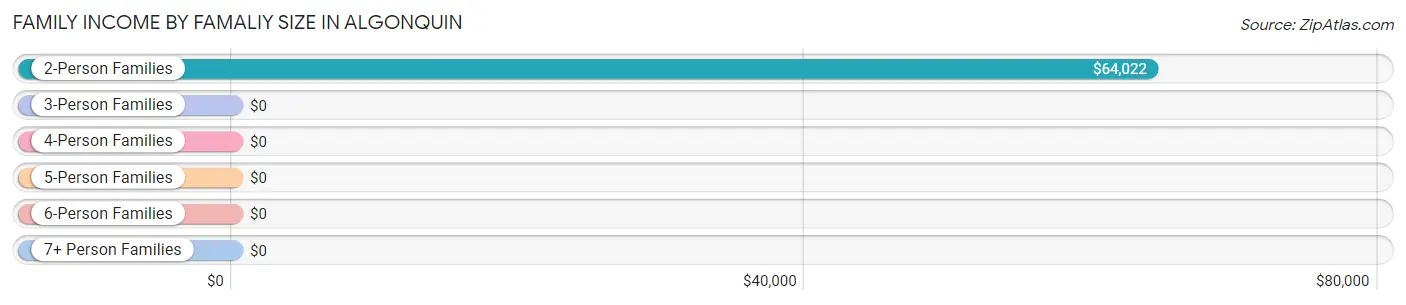
Family Income by Famaliy Size in Algonquin
2-person families (276 | 76.0%) account for the highest median family income in Algonquin with $64,022 per family, while 2-person families (276 | 76.0%) have the highest median income of $32,011 per family member.
| Income Bracket | # Families | Median Income |
| 2-Person Families | 276 (76.0%) | $64,022 |
| 3-Person Families | 9 (2.5%) | $0 |
| 4-Person Families | 66 (18.2%) | $0 |
| 5-Person Families | 12 (3.3%) | $0 |
| 6-Person Families | 0 (0.0%) | $0 |
| 7+ Person Families | 0 (0.0%) | $0 |
| Total | 363 (100.0%) | $66,008 |
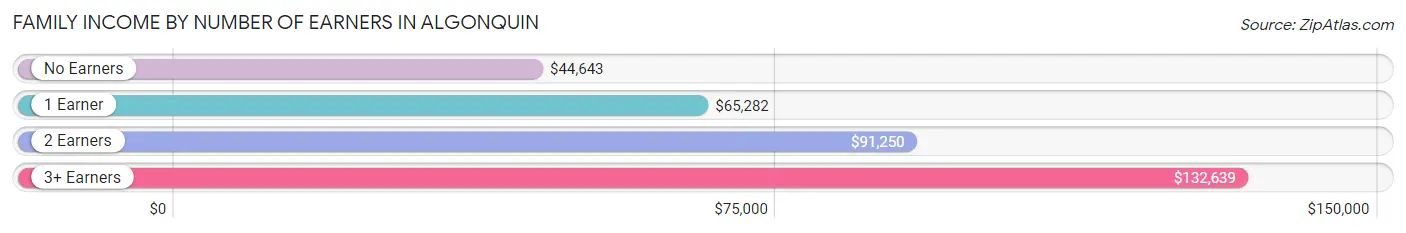
Family Income by Number of Earners in Algonquin
The median family income in Algonquin is $66,008, with families comprising 3+ earners (45) having the highest median family income of $132,639, while families with no earners (118) have the lowest median family income of $44,643, accounting for 12.4% and 32.5% of families, respectively.
| Number of Earners | # Families | Median Income |
| No Earners | 118 (32.5%) | $44,643 |
| 1 Earner | 111 (30.6%) | $65,282 |
| 2 Earners | 89 (24.5%) | $91,250 |
| 3+ Earners | 45 (12.4%) | $132,639 |
| Total | 363 (100.0%) | $66,008 |
Household Income in Algonquin
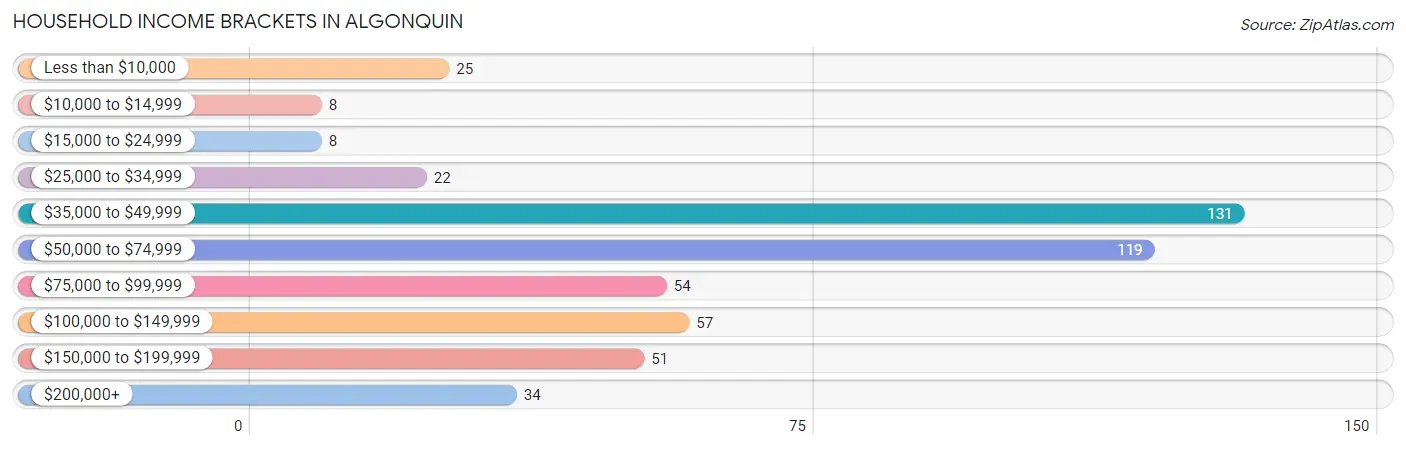
Household Income Brackets in Algonquin
With 131 households falling in the category, the $35,000 to $49,999 income range is the most frequent in Algonquin, accounting for 25.7% of all households. In contrast, only 8 households (1.6%) fall into the $10,000 to $14,999 income bracket, making it the least populous group.
| Income Bracket | # Households | % Households |
| Less than $10,000 | 25 | 4.9% |
| $10,000 to $14,999 | 8 | 1.6% |
| $15,000 to $24,999 | 8 | 1.6% |
| $25,000 to $34,999 | 22 | 4.3% |
| $35,000 to $49,999 | 131 | 25.7% |
| $50,000 to $74,999 | 119 | 23.4% |
| $75,000 to $99,999 | 54 | 10.6% |
| $100,000 to $149,999 | 57 | 11.2% |
| $150,000 to $199,999 | 51 | 10.0% |
| $200,000+ | 34 | 6.7% |
Household Income by Householder Age in Algonquin
The median household income in Algonquin is $64,185, with the highest median household income of $86,125 found in the 45 to 64 years age bracket for the primary householder. A total of 149 households (29.3%) fall into this category.
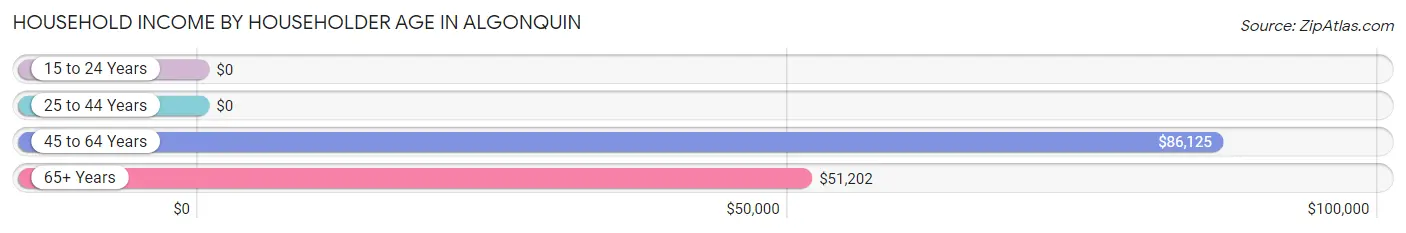
| Income Bracket | # Households | Median Income |
| 15 to 24 Years | 0 (0.0%) | $0 |
| 25 to 44 Years | 87 (17.1%) | $0 |
| 45 to 64 Years | 149 (29.3%) | $86,125 |
| 65+ Years | 273 (53.6%) | $51,202 |
| Total | 509 (100.0%) | $64,185 |
Poverty in Algonquin
Income Below Poverty by Sex and Age in Algonquin
With 4.6% poverty level for males and 7.8% for females among the residents of Algonquin, 16 and 17 year old males and 25 to 34 year old females are the most vulnerable to poverty, with 3 males (100.0%) and 28 females (60.9%) in their respective age groups living below the poverty level.
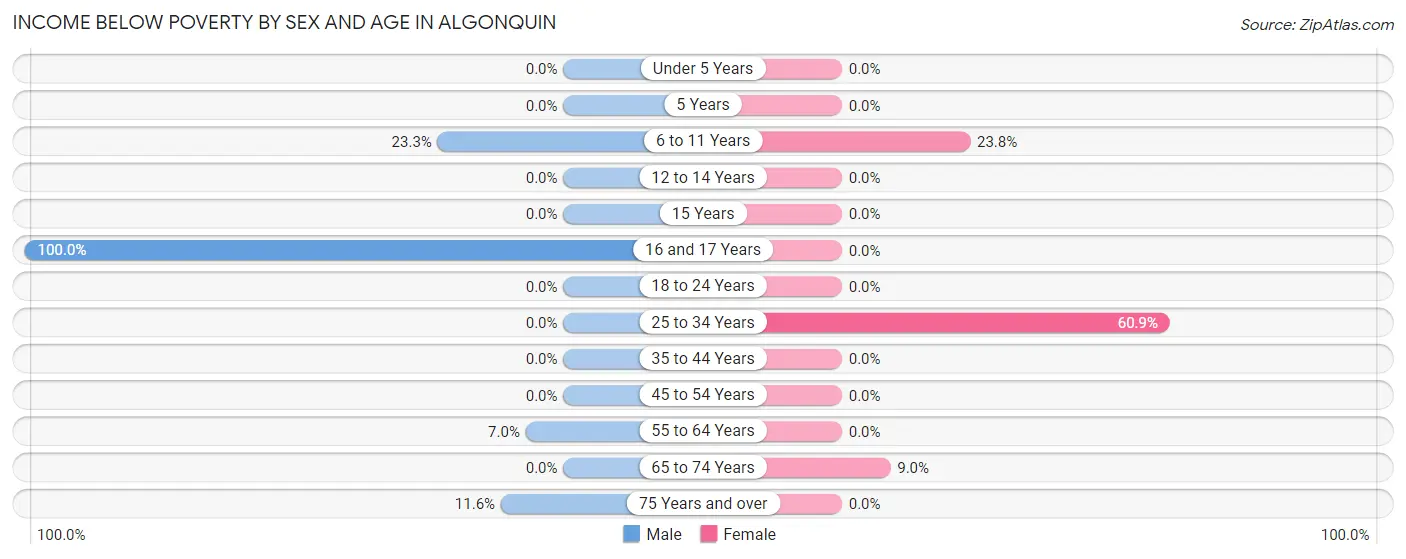
| Age Bracket | Male | Female |
| Under 5 Years | 0 (0.0%) | 0 (0.0%) |
| 5 Years | 0 (0.0%) | 0 (0.0%) |
| 6 to 11 Years | 7 (23.3%) | 5 (23.8%) |
| 12 to 14 Years | 0 (0.0%) | 0 (0.0%) |
| 15 Years | 0 (0.0%) | 0 (0.0%) |
| 16 and 17 Years | 3 (100.0%) | 0 (0.0%) |
| 18 to 24 Years | 0 (0.0%) | 0 (0.0%) |
| 25 to 34 Years | 0 (0.0%) | 28 (60.9%) |
| 35 to 44 Years | 0 (0.0%) | 0 (0.0%) |
| 45 to 54 Years | 0 (0.0%) | 0 (0.0%) |
| 55 to 64 Years | 6 (7.0%) | 0 (0.0%) |
| 65 to 74 Years | 0 (0.0%) | 9 (9.0%) |
| 75 Years and over | 8 (11.6%) | 0 (0.0%) |
| Total | 24 (4.6%) | 42 (7.8%) |
Income Above Poverty by Sex and Age in Algonquin
According to the poverty statistics in Algonquin, males aged under 5 years and females aged 5 years are the age groups that are most secure financially, with 100.0% of males and 100.0% of females in these age groups living above the poverty line.
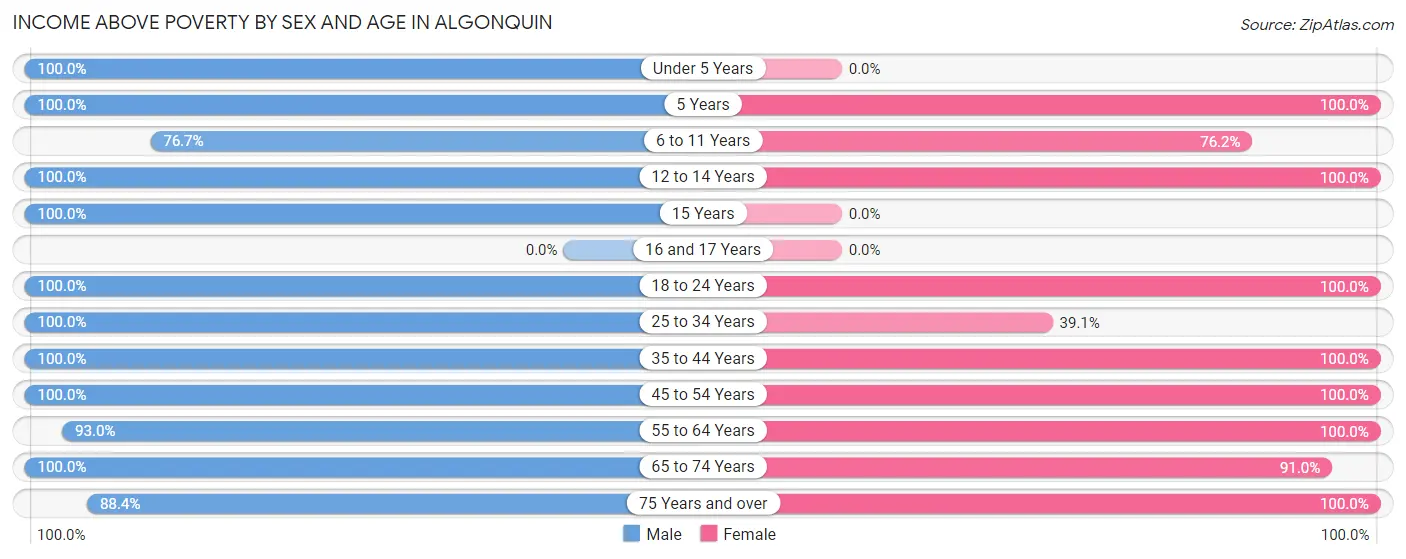
| Age Bracket | Male | Female |
| Under 5 Years | 13 (100.0%) | 0 (0.0%) |
| 5 Years | 10 (100.0%) | 16 (100.0%) |
| 6 to 11 Years | 23 (76.7%) | 16 (76.2%) |
| 12 to 14 Years | 25 (100.0%) | 10 (100.0%) |
| 15 Years | 12 (100.0%) | 0 (0.0%) |
| 16 and 17 Years | 0 (0.0%) | 0 (0.0%) |
| 18 to 24 Years | 44 (100.0%) | 25 (100.0%) |
| 25 to 34 Years | 20 (100.0%) | 18 (39.1%) |
| 35 to 44 Years | 48 (100.0%) | 49 (100.0%) |
| 45 to 54 Years | 52 (100.0%) | 29 (100.0%) |
| 55 to 64 Years | 80 (93.0%) | 68 (100.0%) |
| 65 to 74 Years | 105 (100.0%) | 91 (91.0%) |
| 75 Years and over | 61 (88.4%) | 174 (100.0%) |
| Total | 493 (95.4%) | 496 (92.2%) |
Income Below Poverty Among Married-Couple Families in Algonquin
The poverty statistics for married-couple families in Algonquin show that 2.4% or 8 of the total 337 families live below the poverty line. Families with no children have the highest poverty rate of 3.0%, comprising of 8 families. On the other hand, families with 1 or 2 children have the lowest poverty rate of 0.0%, which includes 0 families.
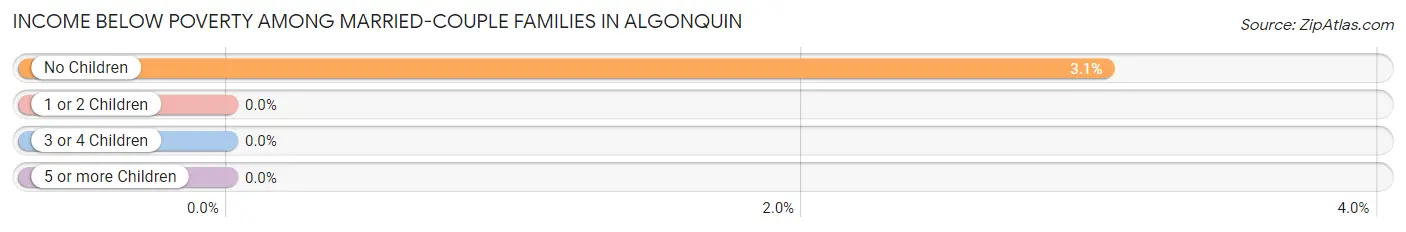
| Children | Above Poverty | Below Poverty |
| No Children | 254 (97.0%) | 8 (3.0%) |
| 1 or 2 Children | 75 (100.0%) | 0 (0.0%) |
| 3 or 4 Children | 0 (0.0%) | 0 (0.0%) |
| 5 or more Children | 0 (0.0%) | 0 (0.0%) |
| Total | 329 (97.6%) | 8 (2.4%) |
Income Below Poverty Among Single-Parent Households in Algonquin
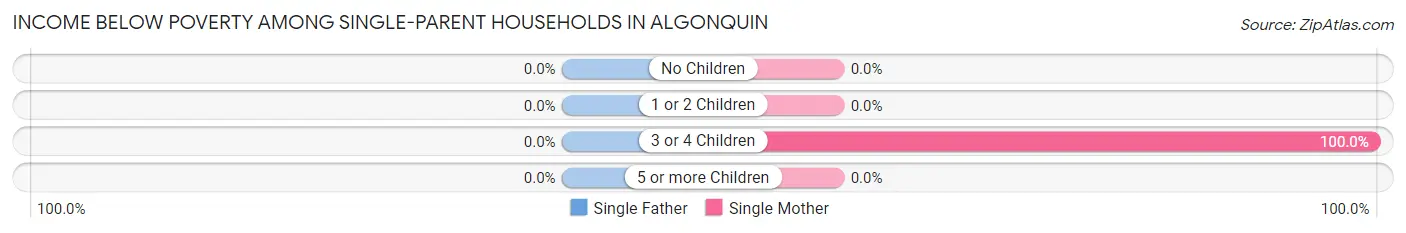
| Children | Single Father | Single Mother |
| No Children | 0 (0.0%) | 0 (0.0%) |
| 1 or 2 Children | 0 (0.0%) | 0 (0.0%) |
| 3 or 4 Children | 0 (0.0%) | 3 (100.0%) |
| 5 or more Children | 0 (0.0%) | 0 (0.0%) |
| Total | 0 (0.0%) | 3 (100.0%) |
Income Below Poverty Among Married-Couple vs Single-Parent Households in Algonquin
The poverty data for Algonquin shows that 8 of the married-couple family households (2.4%) and 3 of the single-parent households (11.5%) are living below the poverty level. Within the married-couple family households, those with no children have the highest poverty rate, with 8 households (3.0%) falling below the poverty line. Among the single-parent households, those with 3 or 4 children have the highest poverty rate, with 3 household (100.0%) living below poverty.
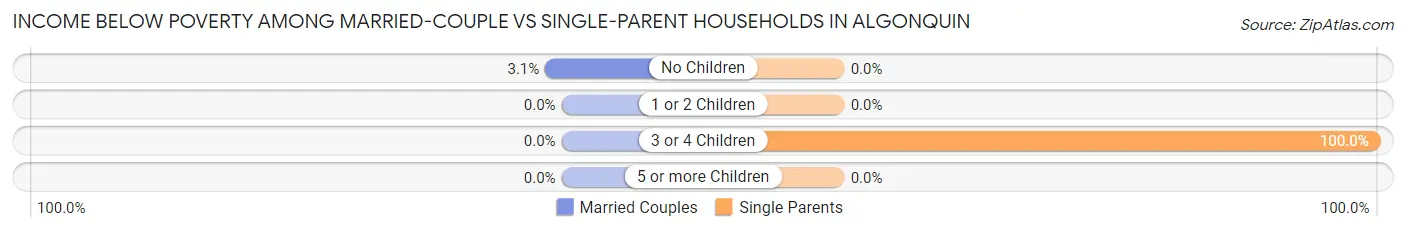
| Children | Married-Couple Families | Single-Parent Households |
| No Children | 8 (3.0%) | 0 (0.0%) |
| 1 or 2 Children | 0 (0.0%) | 0 (0.0%) |
| 3 or 4 Children | 0 (0.0%) | 3 (100.0%) |
| 5 or more Children | 0 (0.0%) | 0 (0.0%) |
| Total | 8 (2.4%) | 3 (11.5%) |
Race in Algonquin
The most populous races in Algonquin are White / Caucasian (918 | 87.0%), Hispanic or Latino (129 | 12.2%), and Some other Race (116 | 11.0%).
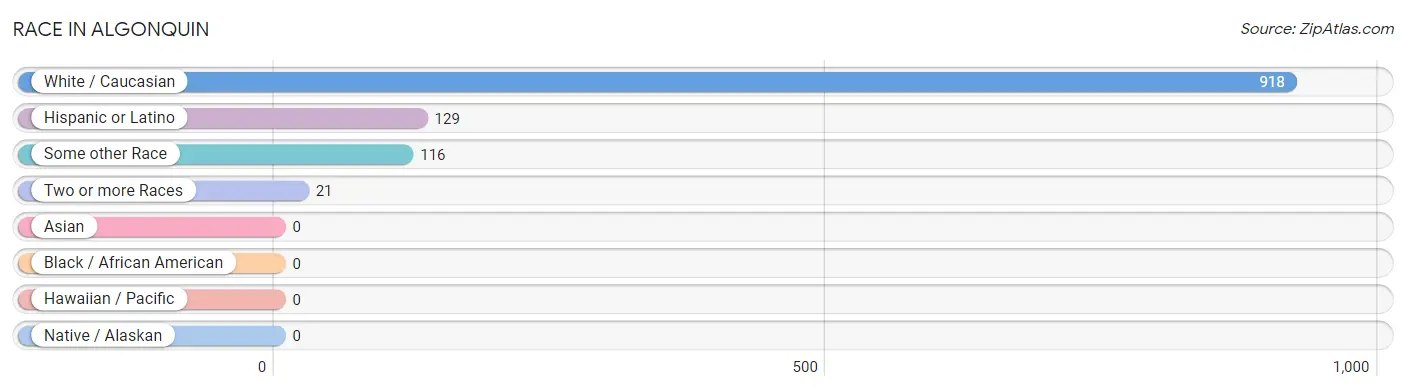
| Race | # Population | % Population |
| Asian | 0 | 0.0% |
| Black / African American | 0 | 0.0% |
| Hawaiian / Pacific | 0 | 0.0% |
| Hispanic or Latino | 129 | 12.2% |
| Native / Alaskan | 0 | 0.0% |
| White / Caucasian | 918 | 87.0% |
| Two or more Races | 21 | 2.0% |
| Some other Race | 116 | 11.0% |
| Total | 1,055 | 100.0% |
Ancestry in Algonquin
The most populous ancestries reported in Algonquin are English (278 | 26.4%), Irish (86 | 8.2%), Mexican (77 | 7.3%), German (72 | 6.8%), and American (58 | 5.5%), together accounting for 54.1% of all Algonquin residents.
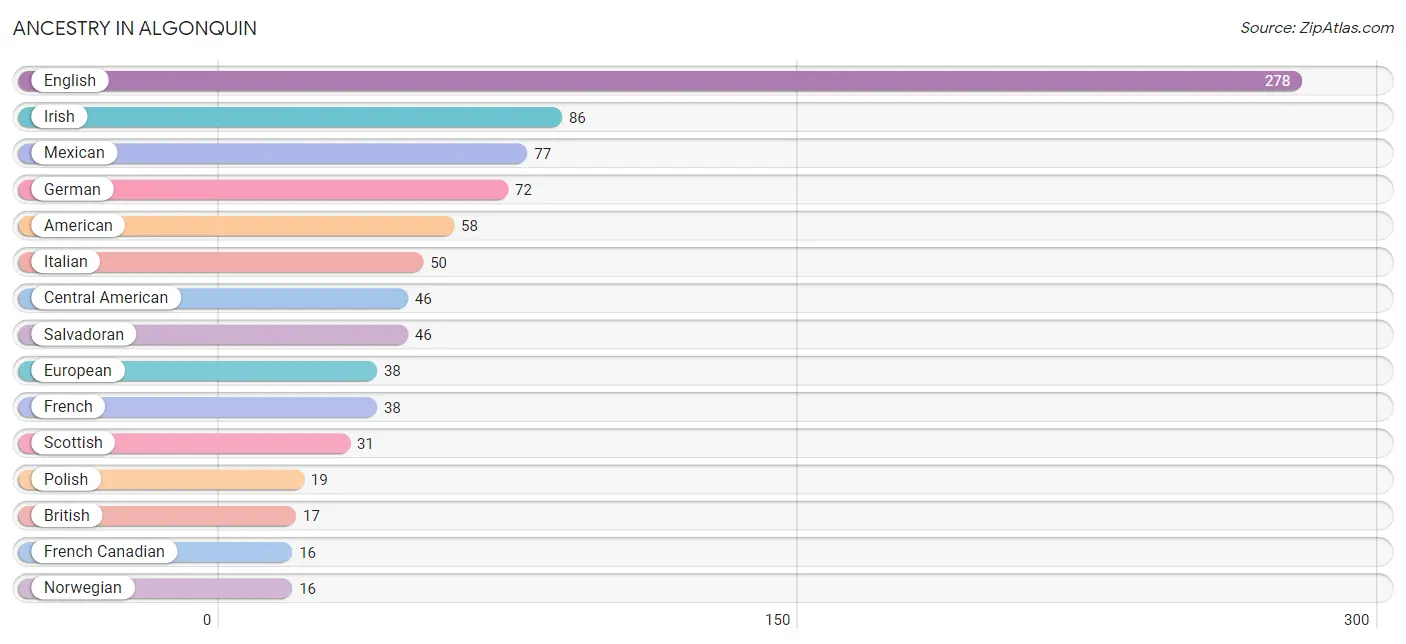
| Ancestry | # Population | % Population |
| American | 58 | 5.5% |
| British | 17 | 1.6% |
| Central American | 46 | 4.4% |
| Croatian | 5 | 0.5% |
| Cuban | 6 | 0.6% |
| Czech | 9 | 0.9% |
| Danish | 3 | 0.3% |
| English | 278 | 26.4% |
| European | 38 | 3.6% |
| French | 38 | 3.6% |
| French Canadian | 16 | 1.5% |
| German | 72 | 6.8% |
| Irish | 86 | 8.2% |
| Italian | 50 | 4.7% |
| Mexican | 77 | 7.3% |
| Norwegian | 16 | 1.5% |
| Polish | 19 | 1.8% |
| Salvadoran | 46 | 4.4% |
| Scottish | 31 | 2.9% | View All 19 Rows |
Immigrants in Algonquin
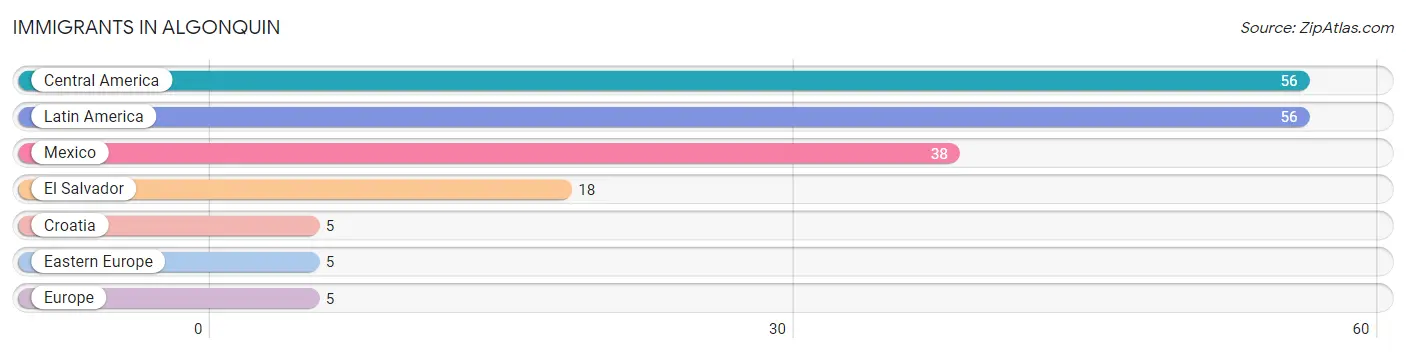
The most numerous immigrant groups reported in Algonquin came from Central America (56 | 5.3%), Latin America (56 | 5.3%), Mexico (38 | 3.6%), El Salvador (18 | 1.7%), and Croatia (5 | 0.5%), together accounting for 16.4% of all Algonquin residents.
| Immigration Origin | # Population | % Population |
| Central America | 56 | 5.3% |
| Croatia | 5 | 0.5% |
| Eastern Europe | 5 | 0.5% |
| El Salvador | 18 | 1.7% |
| Europe | 5 | 0.5% |
| Latin America | 56 | 5.3% |
| Mexico | 38 | 3.6% | View All 7 Rows |
Sex and Age in Algonquin
Sex and Age in Algonquin
The most populous age groups in Algonquin are 70 to 74 Years (86 | 16.6%) for men and 80 to 84 Years (108 | 20.1%) for women.
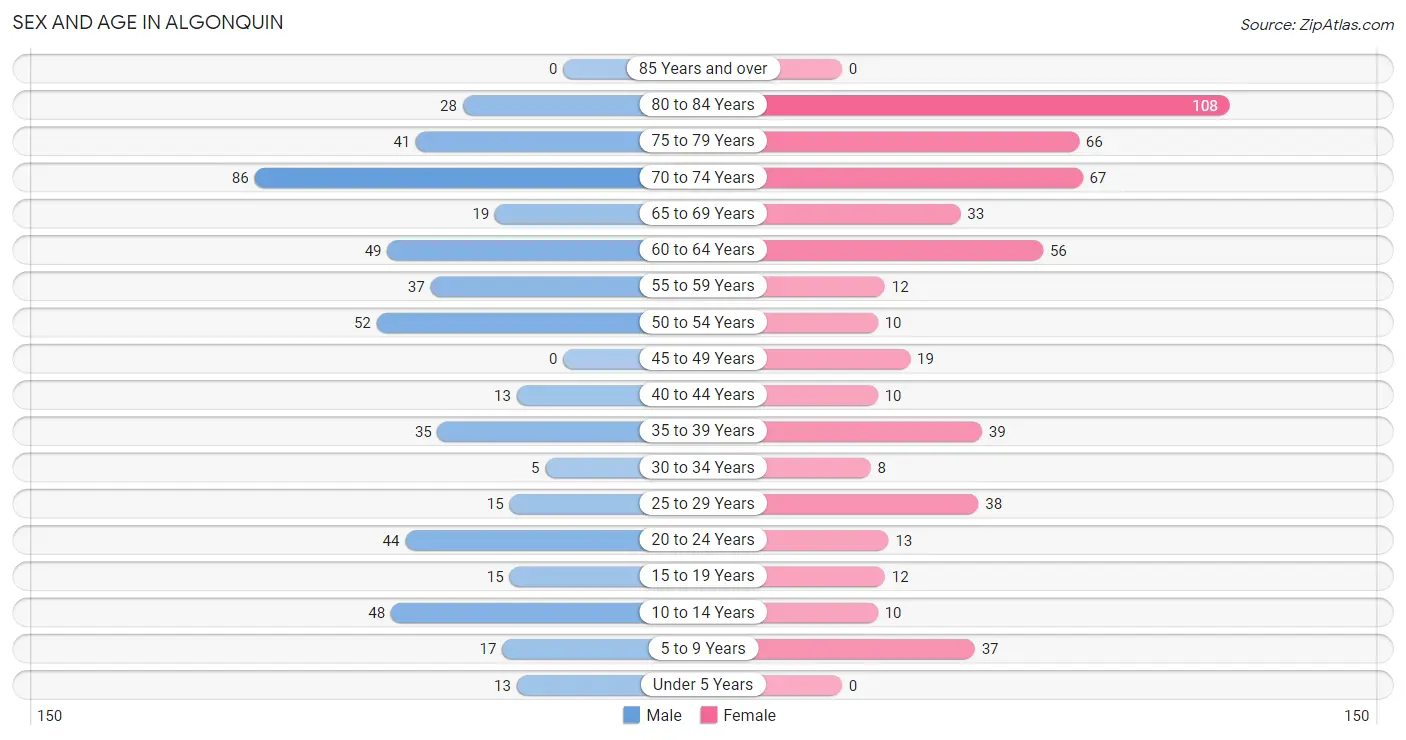
| Age Bracket | Male | Female |
| Under 5 Years | 13 (2.5%) | 0 (0.0%) |
| 5 to 9 Years | 17 (3.3%) | 37 (6.9%) |
| 10 to 14 Years | 48 (9.3%) | 10 (1.9%) |
| 15 to 19 Years | 15 (2.9%) | 12 (2.2%) |
| 20 to 24 Years | 44 (8.5%) | 13 (2.4%) |
| 25 to 29 Years | 15 (2.9%) | 38 (7.1%) |
| 30 to 34 Years | 5 (1.0%) | 8 (1.5%) |
| 35 to 39 Years | 35 (6.8%) | 39 (7.2%) |
| 40 to 44 Years | 13 (2.5%) | 10 (1.9%) |
| 45 to 49 Years | 0 (0.0%) | 19 (3.5%) |
| 50 to 54 Years | 52 (10.1%) | 10 (1.9%) |
| 55 to 59 Years | 37 (7.2%) | 12 (2.2%) |
| 60 to 64 Years | 49 (9.5%) | 56 (10.4%) |
| 65 to 69 Years | 19 (3.7%) | 33 (6.1%) |
| 70 to 74 Years | 86 (16.6%) | 67 (12.4%) |
| 75 to 79 Years | 41 (7.9%) | 66 (12.3%) |
| 80 to 84 Years | 28 (5.4%) | 108 (20.1%) |
| 85 Years and over | 0 (0.0%) | 0 (0.0%) |
| Total | 517 (100.0%) | 538 (100.0%) |
Families and Households in Algonquin
Median Family Size in Algonquin
The median family size in Algonquin is 2.45 persons per family, with single female/mother families (3 | 0.8%) accounting for the largest median family size of 6 persons per family. On the other hand, single male/father families (23 | 6.3%) represent the smallest median family size with 1.70 persons per family.
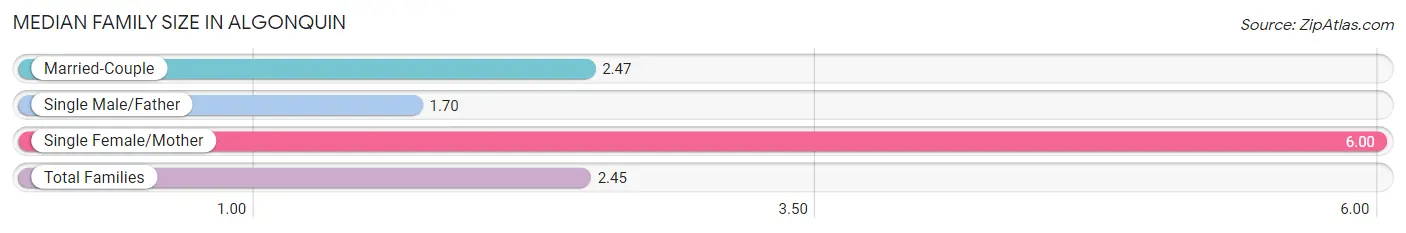
| Family Type | # Families | Family Size |
| Married-Couple | 337 (92.8%) | 2.47 |
| Single Male/Father | 23 (6.3%) | 1.70 |
| Single Female/Mother | 3 (0.8%) | 6.00 |
| Total Families | 363 (100.0%) | 2.45 |
Median Household Size in Algonquin
The median household size in Algonquin is 2.06 persons per household, with single female/mother households (3 | 0.6%) accounting for the largest median household size of 6 persons per household. non-family households (146 | 28.7%) represent the smallest median household size with 1.09 persons per household.
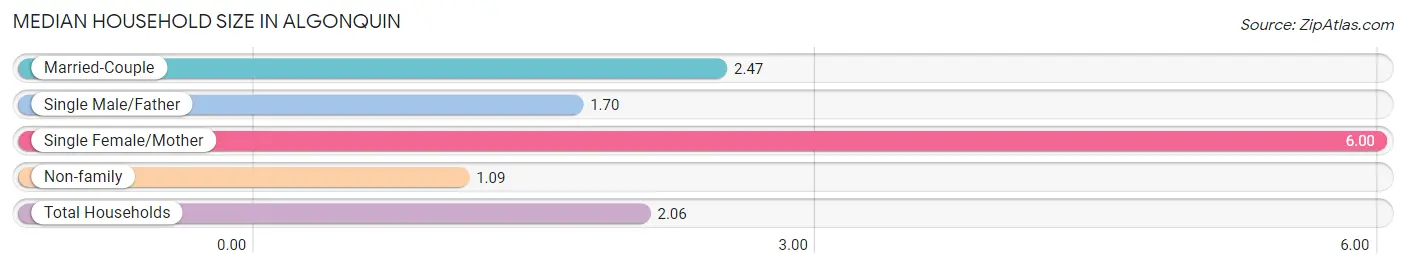
| Household Type | # Households | Household Size |
| Married-Couple | 337 (66.2%) | 2.47 |
| Single Male/Father | 23 (4.5%) | 1.70 |
| Single Female/Mother | 3 (0.6%) | 6.00 |
| Non-family | 146 (28.7%) | 1.09 |
| Total Households | 509 (100.0%) | 2.06 |
Household Size by Marriage Status in Algonquin
Out of a total of 509 households in Algonquin, 363 (71.3%) are family households, while 146 (28.7%) are nonfamily households. The most numerous type of family households are 2-person households, comprising 276, and the most common type of nonfamily households are 1-person households, comprising 131.
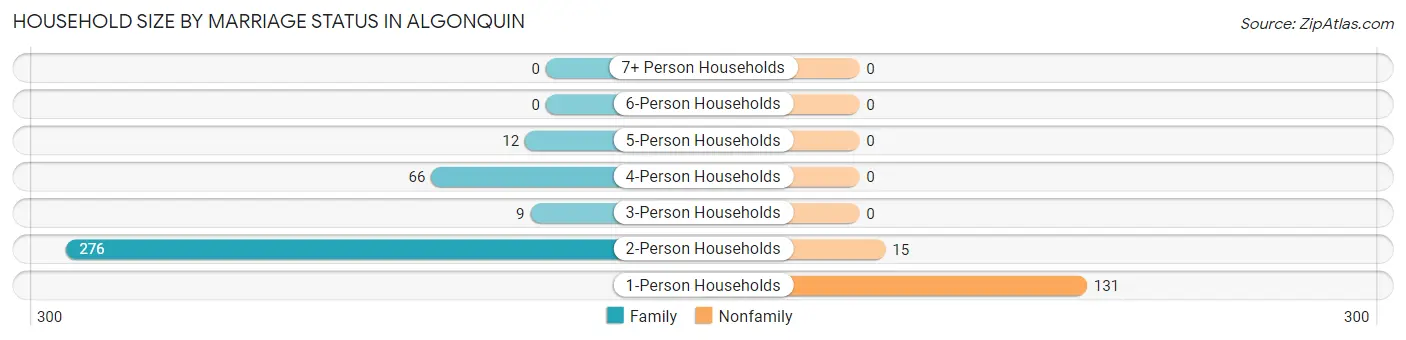
| Household Size | Family Households | Nonfamily Households |
| 1-Person Households | - | 131 (25.7%) |
| 2-Person Households | 276 (54.2%) | 15 (2.9%) |
| 3-Person Households | 9 (1.8%) | 0 (0.0%) |
| 4-Person Households | 66 (13.0%) | 0 (0.0%) |
| 5-Person Households | 12 (2.4%) | 0 (0.0%) |
| 6-Person Households | 0 (0.0%) | 0 (0.0%) |
| 7+ Person Households | 0 (0.0%) | 0 (0.0%) |
| Total | 363 (71.3%) | 146 (28.7%) |
Female Fertility in Algonquin
Fertility by Age in Algonquin
| Age Bracket | Women with Births | Births / 1,000 Women |
| 15 to 19 years | 0 (0.0%) | 0.0 |
| 20 to 34 years | 0 (0.0%) | 0.0 |
| 35 to 50 years | 0 (0.0%) | 0.0 |
| Total | 0 (0.0%) | 0.0 |
Fertility by Age by Marriage Status in Algonquin
| Age Bracket | Married | Unmarried |
| 15 to 19 years | 0 (0.0%) | 0 (0.0%) |
| 20 to 34 years | 0 (0.0%) | 0 (0.0%) |
| 35 to 50 years | 0 (0.0%) | 0 (0.0%) |
| Total | 0 (0.0%) | 0 (0.0%) |
Fertility by Education in Algonquin
| Educational Attainment | Women with Births | Births / 1,000 Women |
| Less than High School | 0 (0.0%) | 0.0 |
| High School Diploma | 0 (0.0%) | 0.0 |
| College or Associate's Degree | 0 (0.0%) | 0.0 |
| Bachelor's Degree | 0 (0.0%) | 0.0 |
| Graduate Degree | 0 (0.0%) | 0.0 |
| Total | 0 (0.0%) | 0.0 |
Fertility by Education by Marriage Status in Algonquin
| Educational Attainment | Married | Unmarried |
| Less than High School | 0 (0.0%) | 0 (0.0%) |
| High School Diploma | 0 (0.0%) | 0 (0.0%) |
| College or Associate's Degree | 0 (0.0%) | 0 (0.0%) |
| Bachelor's Degree | 0 (0.0%) | 0 (0.0%) |
| Graduate Degree | 0 (0.0%) | 0 (0.0%) |
| Total | 0 (0.0%) | 0 (0.0%) |
Employment Characteristics in Algonquin
Employment by Class of Employer in Algonquin
Among the 469 employed individuals in Algonquin, private company employees (218 | 46.5%), self-employed (not incorporated) (77 | 16.4%), and self-employed (incorporated) (72 | 15.3%) make up the most common classes of employment.
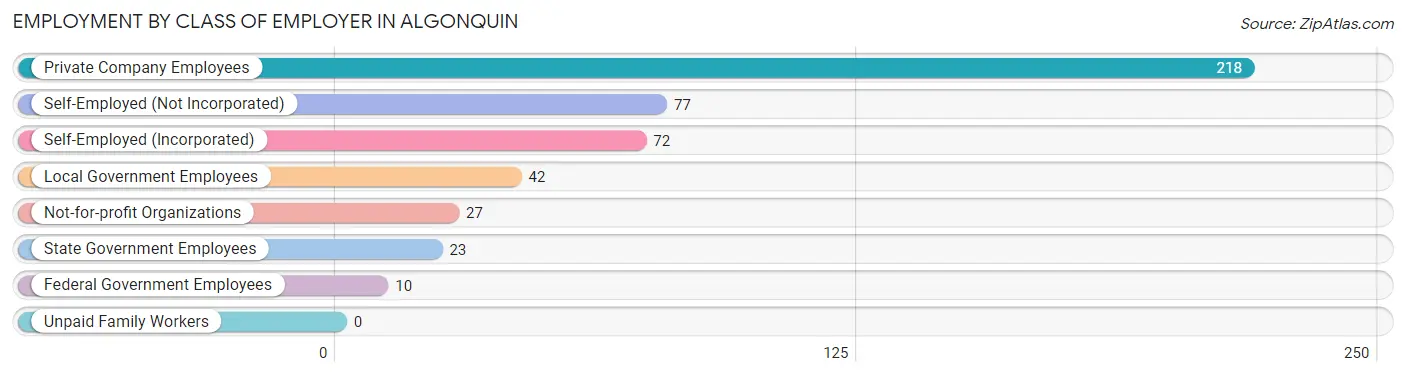
| Employer Class | # Employees | % Employees |
| Private Company Employees | 218 | 46.5% |
| Self-Employed (Incorporated) | 72 | 15.3% |
| Self-Employed (Not Incorporated) | 77 | 16.4% |
| Not-for-profit Organizations | 27 | 5.8% |
| Local Government Employees | 42 | 9.0% |
| State Government Employees | 23 | 4.9% |
| Federal Government Employees | 10 | 2.1% |
| Unpaid Family Workers | 0 | 0.0% |
| Total | 469 | 100.0% |
Employment Status by Age in Algonquin
According to the labor force statistics for Algonquin, out of the total population over 16 years of age (918), 55.6% or 510 individuals are in the labor force, with 8.0% or 41 of them unemployed. The age group with the highest labor force participation rate is 16 to 19 years, with 100.0% or 15 individuals in the labor force. Within the labor force, the 65 to 74 years age range has the highest percentage of unemployed individuals, with 21.0% or 22 of them being unemployed.
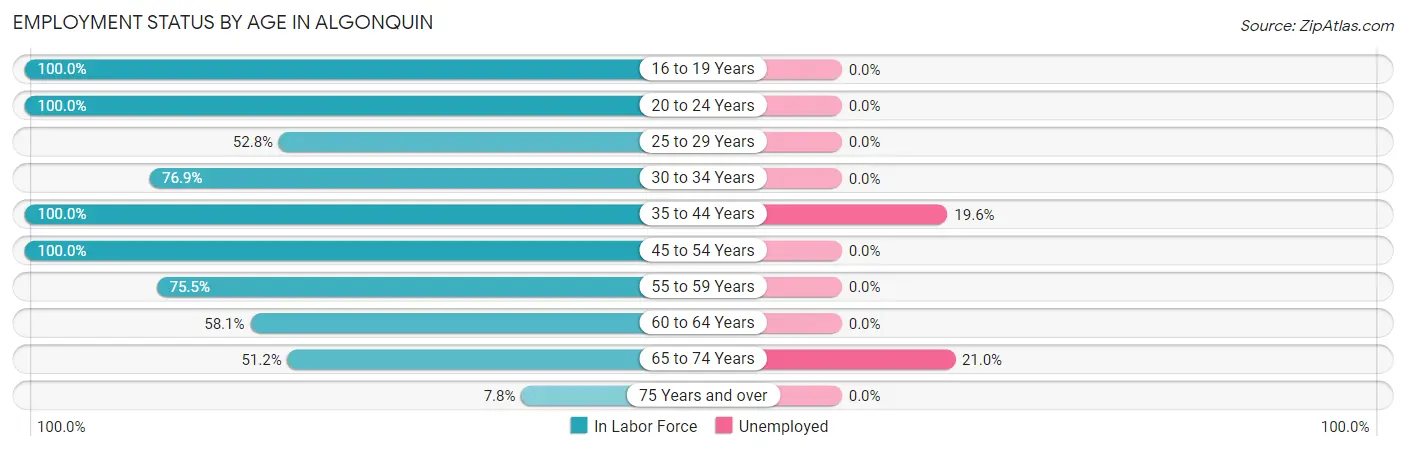
| Age Bracket | In Labor Force | Unemployed |
| 16 to 19 Years | 15 (100.0%) | 0 (0.0%) |
| 20 to 24 Years | 57 (100.0%) | 0 (0.0%) |
| 25 to 29 Years | 28 (52.8%) | 0 (0.0%) |
| 30 to 34 Years | 10 (76.9%) | 0 (0.0%) |
| 35 to 44 Years | 97 (100.0%) | 19 (19.6%) |
| 45 to 54 Years | 81 (100.0%) | 0 (0.0%) |
| 55 to 59 Years | 37 (75.5%) | 0 (0.0%) |
| 60 to 64 Years | 61 (58.1%) | 0 (0.0%) |
| 65 to 74 Years | 105 (51.2%) | 22 (21.0%) |
| 75 Years and over | 19 (7.8%) | 0 (0.0%) |
| Total | 510 (55.6%) | 41 (8.0%) |
Employment Status by Educational Attainment in Algonquin
According to labor force statistics for Algonquin, 78.9% of individuals (314) out of the total population between 25 and 64 years of age (398) are in the labor force, with 6.1% or 19 of them being unemployed. The group with the highest labor force participation rate are those with the educational attainment of less than high school, with 100.0% or 48 individuals in the labor force. Within the labor force, individuals with less than high school education have the highest percentage of unemployment, with 39.6% or 19 of them being unemployed.
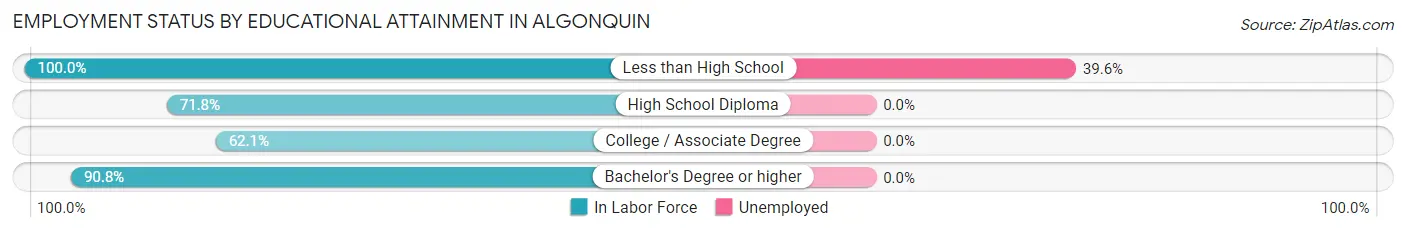
| Educational Attainment | In Labor Force | Unemployed |
| Less than High School | 48 (100.0%) | 19 (39.6%) |
| High School Diploma | 84 (71.8%) | 0 (0.0%) |
| College / Associate Degree | 64 (62.1%) | 0 (0.0%) |
| Bachelor's Degree or higher | 118 (90.8%) | 0 (0.0%) |
| Total | 314 (78.9%) | 24 (6.1%) |
Employment Occupations by Sex in Algonquin
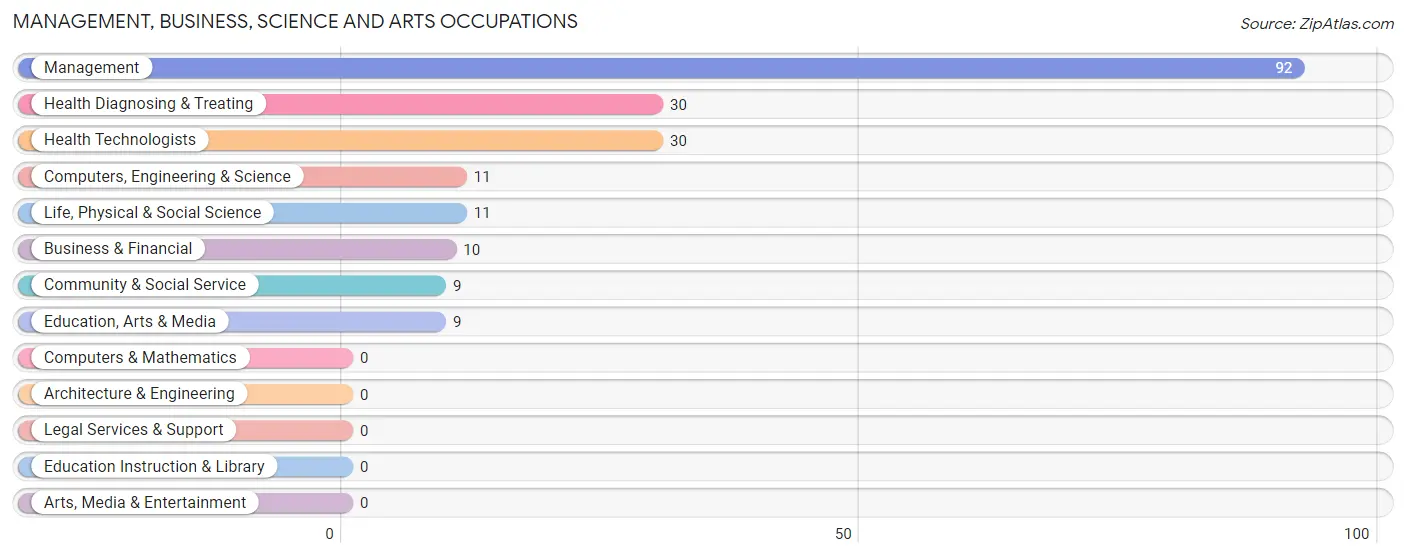
Management, Business, Science and Arts Occupations
The most common Management, Business, Science and Arts occupations in Algonquin are Management (92 | 19.6%), Health Diagnosing & Treating (30 | 6.4%), Health Technologists (30 | 6.4%), Computers, Engineering & Science (11 | 2.4%), and Life, Physical & Social Science (11 | 2.4%).
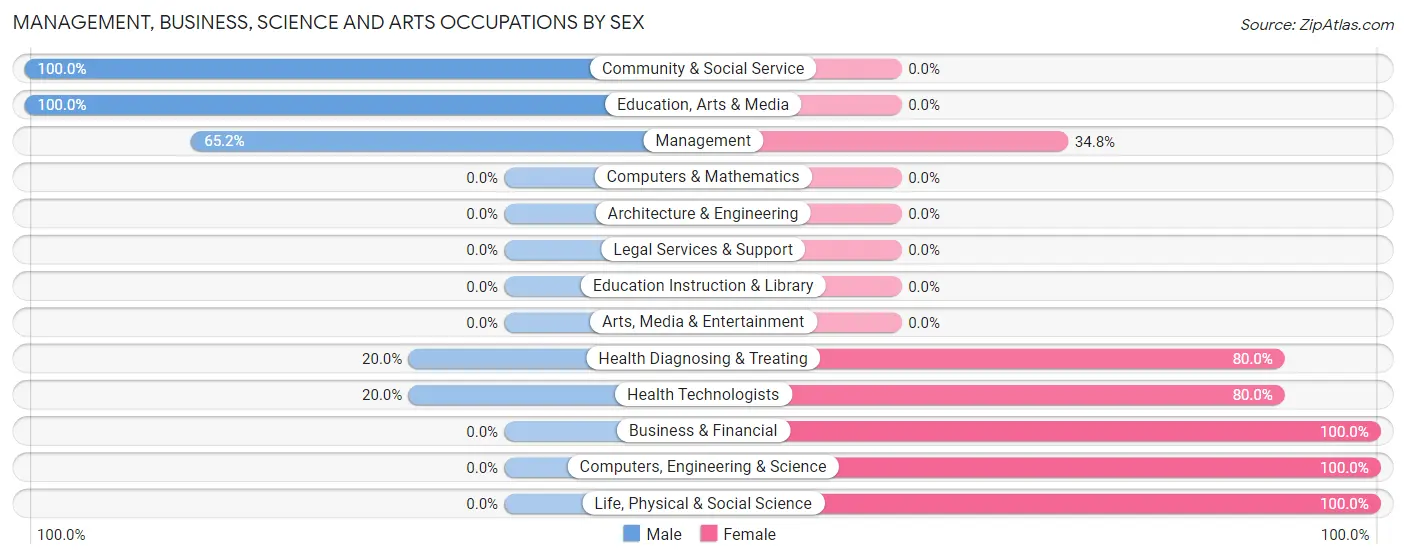
Management, Business, Science and Arts Occupations by Sex
Within the Management, Business, Science and Arts occupations in Algonquin, the most male-oriented occupations are Community & Social Service (100.0%), Education, Arts & Media (100.0%), and Management (65.2%), while the most female-oriented occupations are Business & Financial (100.0%), Computers, Engineering & Science (100.0%), and Life, Physical & Social Science (100.0%).
| Occupation | Male | Female |
| Management | 60 (65.2%) | 32 (34.8%) |
| Business & Financial | 0 (0.0%) | 10 (100.0%) |
| Computers, Engineering & Science | 0 (0.0%) | 11 (100.0%) |
| Computers & Mathematics | 0 (0.0%) | 0 (0.0%) |
| Architecture & Engineering | 0 (0.0%) | 0 (0.0%) |
| Life, Physical & Social Science | 0 (0.0%) | 11 (100.0%) |
| Community & Social Service | 9 (100.0%) | 0 (0.0%) |
| Education, Arts & Media | 9 (100.0%) | 0 (0.0%) |
| Legal Services & Support | 0 (0.0%) | 0 (0.0%) |
| Education Instruction & Library | 0 (0.0%) | 0 (0.0%) |
| Arts, Media & Entertainment | 0 (0.0%) | 0 (0.0%) |
| Health Diagnosing & Treating | 6 (20.0%) | 24 (80.0%) |
| Health Technologists | 6 (20.0%) | 24 (80.0%) |
| Total (Category) | 75 (49.3%) | 77 (50.7%) |
| Total (Overall) | 295 (62.9%) | 174 (37.1%) |
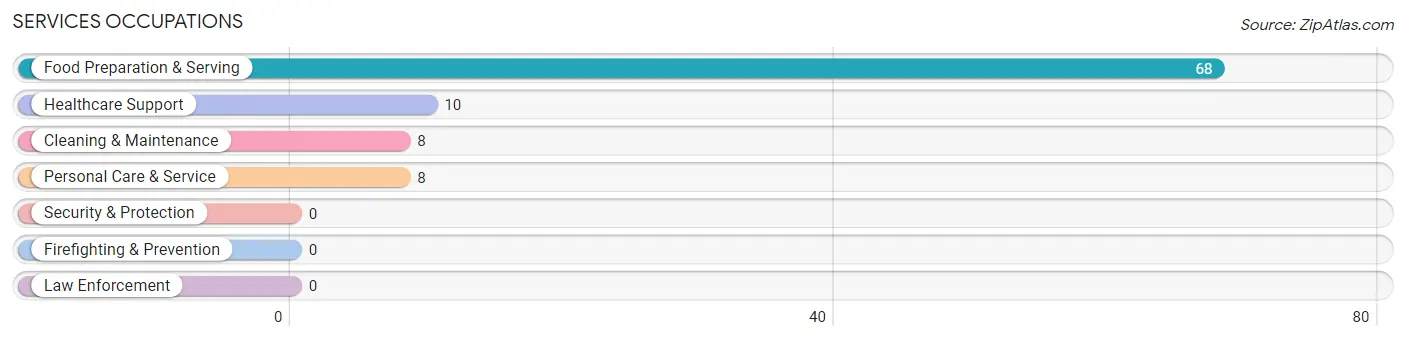
Services Occupations
The most common Services occupations in Algonquin are Food Preparation & Serving (68 | 14.5%), Healthcare Support (10 | 2.1%), Cleaning & Maintenance (8 | 1.7%), and Personal Care & Service (8 | 1.7%).
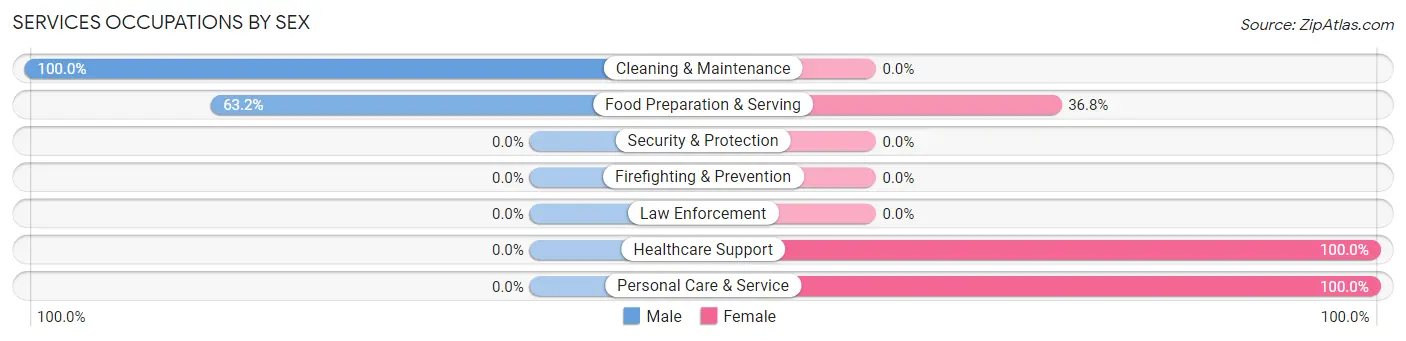
Services Occupations by Sex
Within the Services occupations in Algonquin, the most male-oriented occupations are Cleaning & Maintenance (100.0%), and Food Preparation & Serving (63.2%), while the most female-oriented occupations are Healthcare Support (100.0%), Personal Care & Service (100.0%), and Food Preparation & Serving (36.8%).
| Occupation | Male | Female |
| Healthcare Support | 0 (0.0%) | 10 (100.0%) |
| Security & Protection | 0 (0.0%) | 0 (0.0%) |
| Firefighting & Prevention | 0 (0.0%) | 0 (0.0%) |
| Law Enforcement | 0 (0.0%) | 0 (0.0%) |
| Food Preparation & Serving | 43 (63.2%) | 25 (36.8%) |
| Cleaning & Maintenance | 8 (100.0%) | 0 (0.0%) |
| Personal Care & Service | 0 (0.0%) | 8 (100.0%) |
| Total (Category) | 51 (54.3%) | 43 (45.7%) |
| Total (Overall) | 295 (62.9%) | 174 (37.1%) |
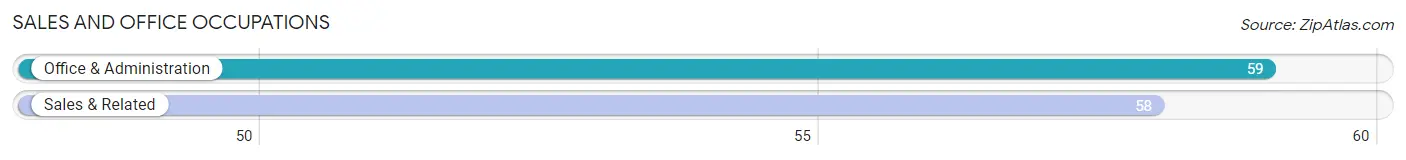
Sales and Office Occupations
The most common Sales and Office occupations in Algonquin are Office & Administration (59 | 12.6%), and Sales & Related (58 | 12.4%).
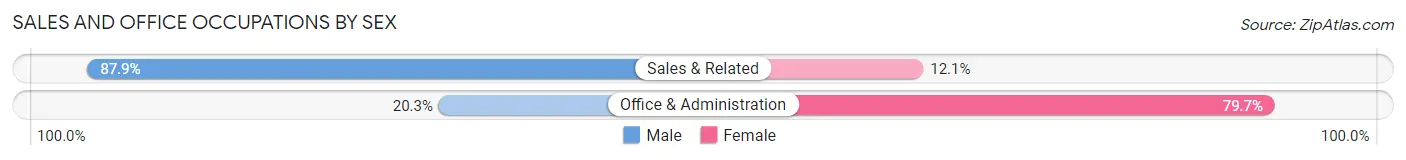
Sales and Office Occupations by Sex
| Occupation | Male | Female |
| Sales & Related | 51 (87.9%) | 7 (12.1%) |
| Office & Administration | 12 (20.3%) | 47 (79.7%) |
| Total (Category) | 63 (53.8%) | 54 (46.2%) |
| Total (Overall) | 295 (62.9%) | 174 (37.1%) |
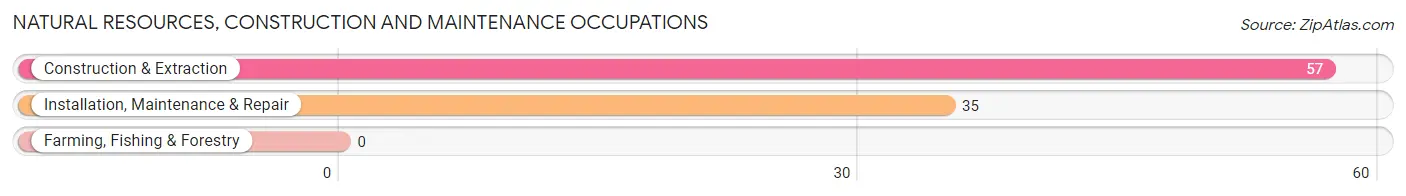
Natural Resources, Construction and Maintenance Occupations
The most common Natural Resources, Construction and Maintenance occupations in Algonquin are Construction & Extraction (57 | 12.1%), and Installation, Maintenance & Repair (35 | 7.5%).
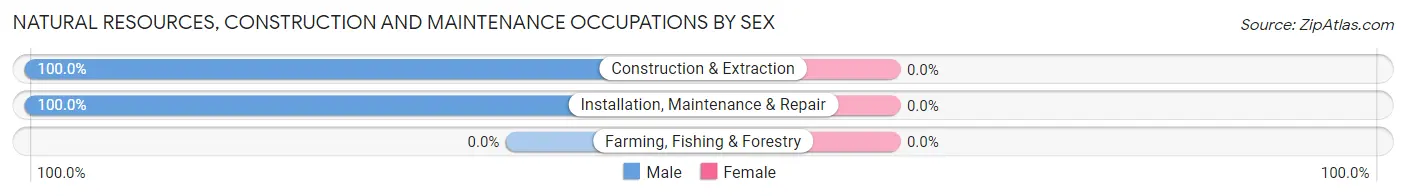
Natural Resources, Construction and Maintenance Occupations by Sex
| Occupation | Male | Female |
| Farming, Fishing & Forestry | 0 (0.0%) | 0 (0.0%) |
| Construction & Extraction | 57 (100.0%) | 0 (0.0%) |
| Installation, Maintenance & Repair | 35 (100.0%) | 0 (0.0%) |
| Total (Category) | 92 (100.0%) | 0 (0.0%) |
| Total (Overall) | 295 (62.9%) | 174 (37.1%) |
Production, Transportation and Moving Occupations
The most common Production, Transportation and Moving occupations in Algonquin are , and Production (14 | 3.0%).
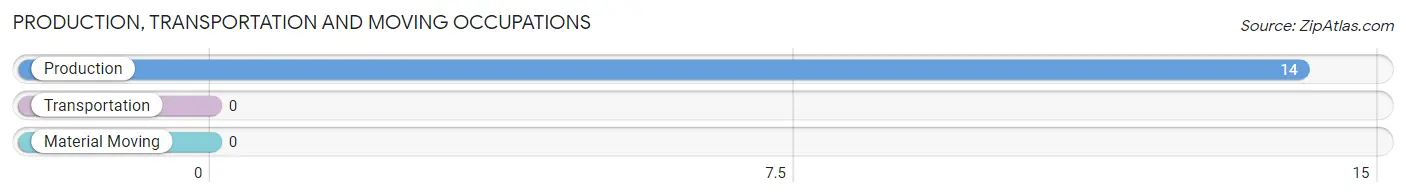
Production, Transportation and Moving Occupations by Sex
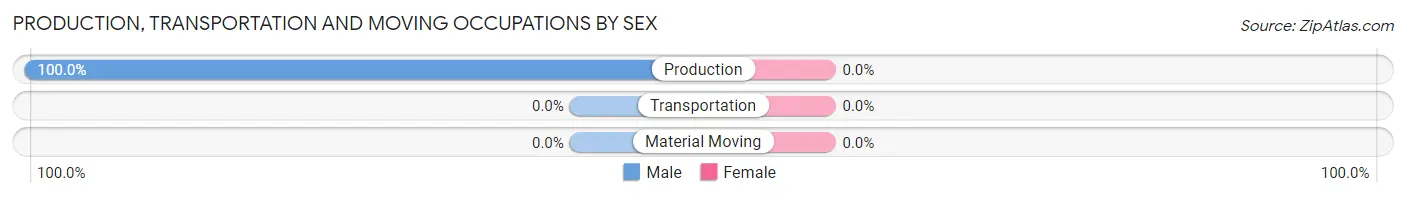
| Occupation | Male | Female |
| Production | 14 (100.0%) | 0 (0.0%) |
| Transportation | 0 (0.0%) | 0 (0.0%) |
| Material Moving | 0 (0.0%) | 0 (0.0%) |
| Total (Category) | 14 (100.0%) | 0 (0.0%) |
| Total (Overall) | 295 (62.9%) | 174 (37.1%) |
Employment Industries by Sex in Algonquin
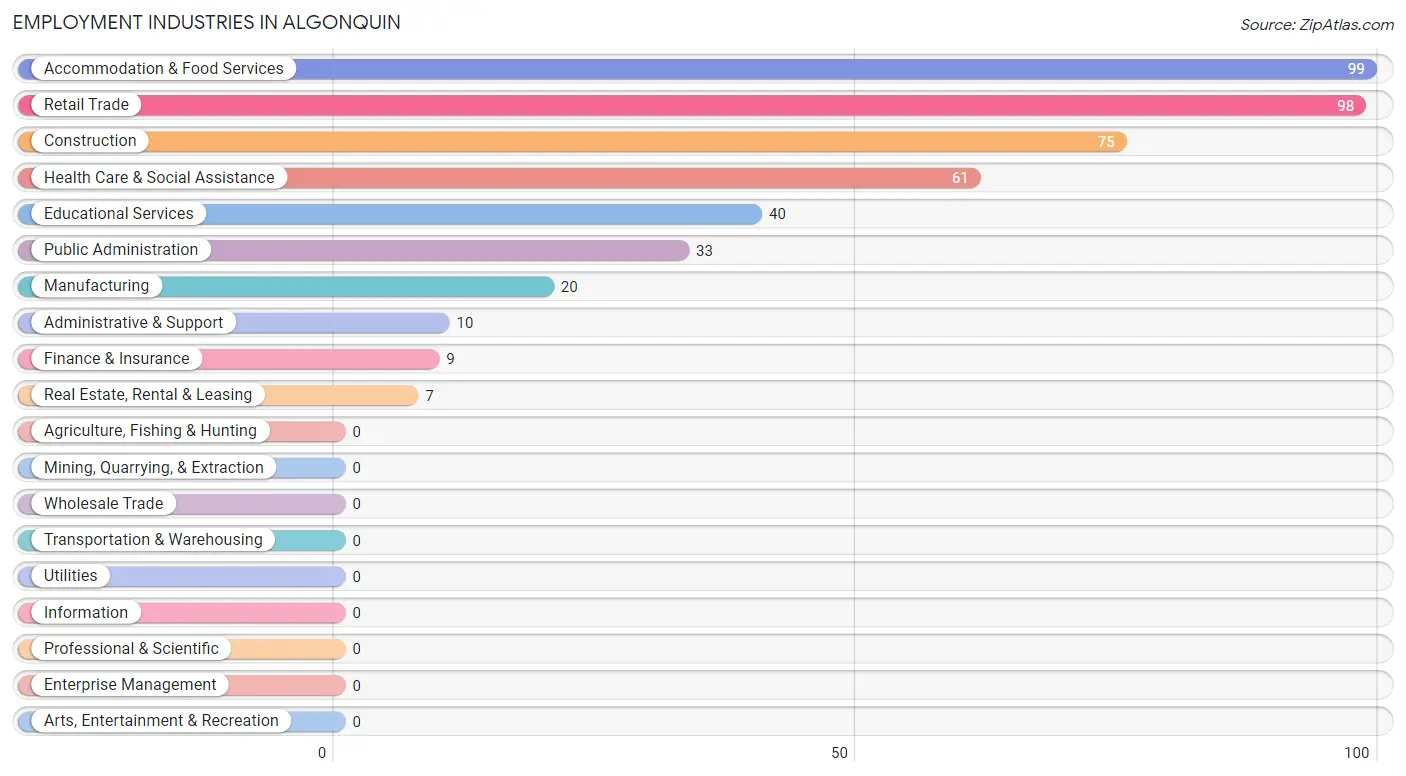
Employment Industries in Algonquin
The major employment industries in Algonquin include Accommodation & Food Services (99 | 21.1%), Retail Trade (98 | 20.9%), Construction (75 | 16.0%), Health Care & Social Assistance (61 | 13.0%), and Educational Services (40 | 8.5%).
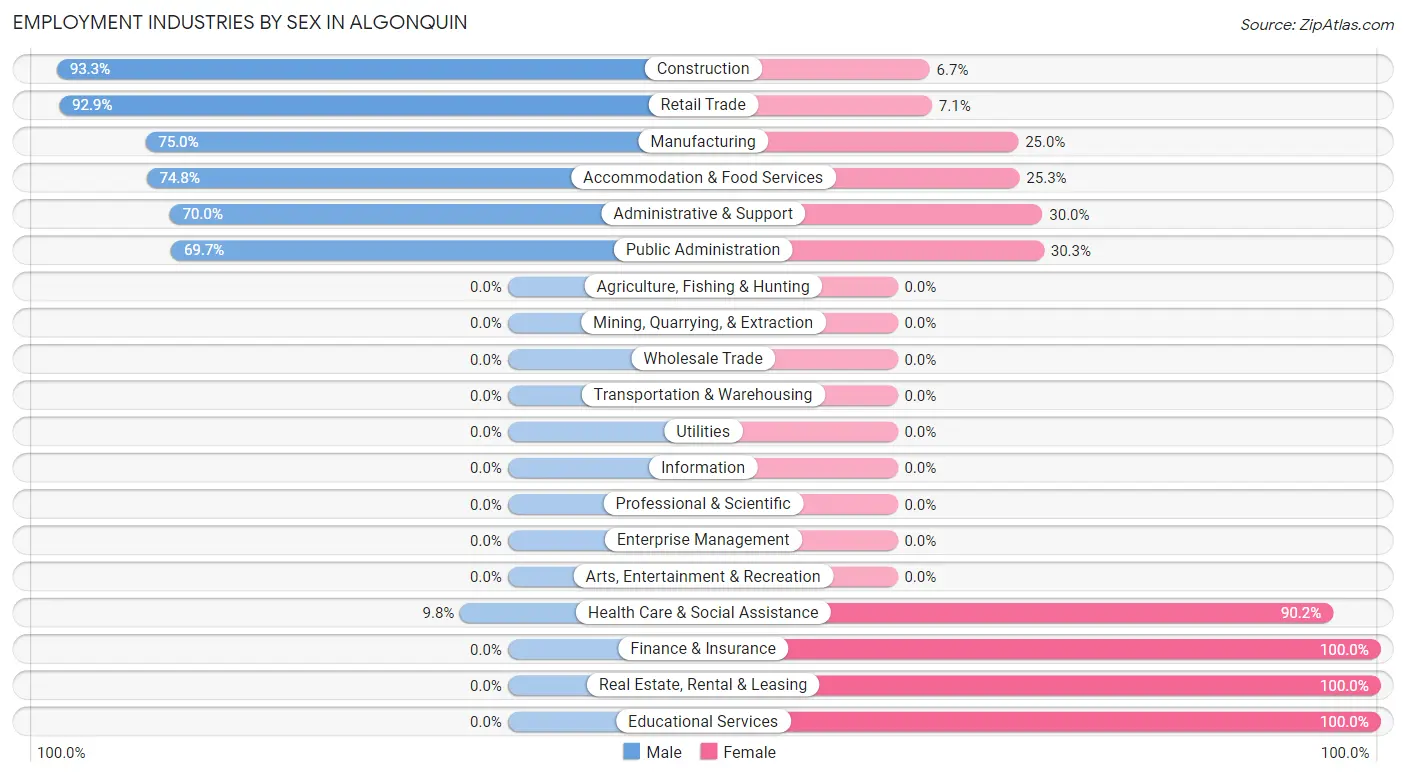
Employment Industries by Sex in Algonquin
The Algonquin industries that see more men than women are Construction (93.3%), Retail Trade (92.9%), and Manufacturing (75.0%), whereas the industries that tend to have a higher number of women are Finance & Insurance (100.0%), Real Estate, Rental & Leasing (100.0%), and Educational Services (100.0%).
| Industry | Male | Female |
| Agriculture, Fishing & Hunting | 0 (0.0%) | 0 (0.0%) |
| Mining, Quarrying, & Extraction | 0 (0.0%) | 0 (0.0%) |
| Construction | 70 (93.3%) | 5 (6.7%) |
| Manufacturing | 15 (75.0%) | 5 (25.0%) |
| Wholesale Trade | 0 (0.0%) | 0 (0.0%) |
| Retail Trade | 91 (92.9%) | 7 (7.1%) |
| Transportation & Warehousing | 0 (0.0%) | 0 (0.0%) |
| Utilities | 0 (0.0%) | 0 (0.0%) |
| Information | 0 (0.0%) | 0 (0.0%) |
| Finance & Insurance | 0 (0.0%) | 9 (100.0%) |
| Real Estate, Rental & Leasing | 0 (0.0%) | 7 (100.0%) |
| Professional & Scientific | 0 (0.0%) | 0 (0.0%) |
| Enterprise Management | 0 (0.0%) | 0 (0.0%) |
| Administrative & Support | 7 (70.0%) | 3 (30.0%) |
| Educational Services | 0 (0.0%) | 40 (100.0%) |
| Health Care & Social Assistance | 6 (9.8%) | 55 (90.2%) |
| Arts, Entertainment & Recreation | 0 (0.0%) | 0 (0.0%) |
| Accommodation & Food Services | 74 (74.8%) | 25 (25.3%) |
| Public Administration | 23 (69.7%) | 10 (30.3%) |
| Total | 295 (62.9%) | 174 (37.1%) |
Education in Algonquin
School Enrollment in Algonquin
The most common levels of schooling among the 157 students in Algonquin are high school (46 | 29.3%), elementary school (30 | 19.1%), and middle school (26 | 16.6%).
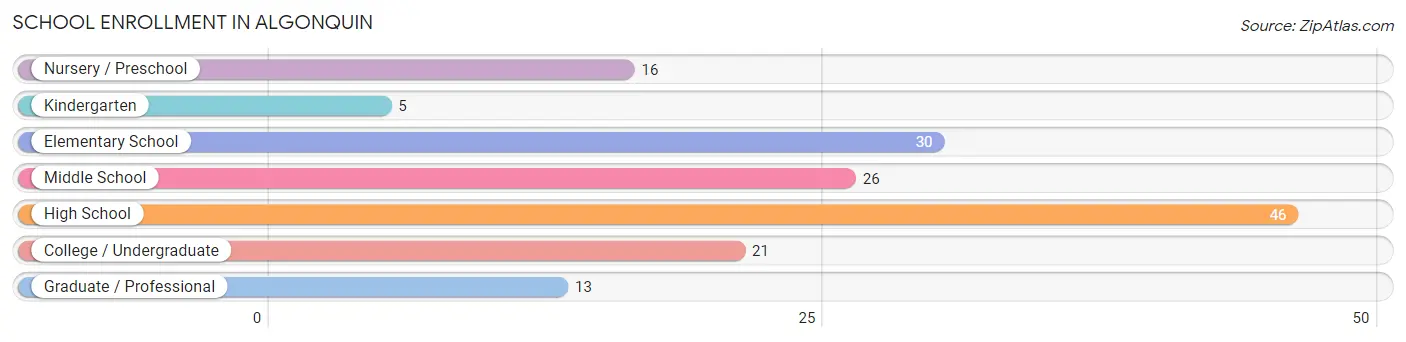
| School Level | # Students | % Students |
| Nursery / Preschool | 16 | 10.2% |
| Kindergarten | 5 | 3.2% |
| Elementary School | 30 | 19.1% |
| Middle School | 26 | 16.6% |
| High School | 46 | 29.3% |
| College / Undergraduate | 21 | 13.4% |
| Graduate / Professional | 13 | 8.3% |
| Total | 157 | 100.0% |
School Enrollment by Age by Funding Source in Algonquin
Out of a total of 157 students who are enrolled in schools in Algonquin, 56 (35.7%) attend a private institution, while the remaining 101 (64.3%) are enrolled in public schools. The age group of 20 to 24 year olds has the highest likelihood of being enrolled in private schools, with 22 (100.0% in the age bracket) enrolled. Conversely, the age group of 15 to 17 year olds has the lowest likelihood of being enrolled in a private school, with 15 (100.0% in the age bracket) attending a public institution.
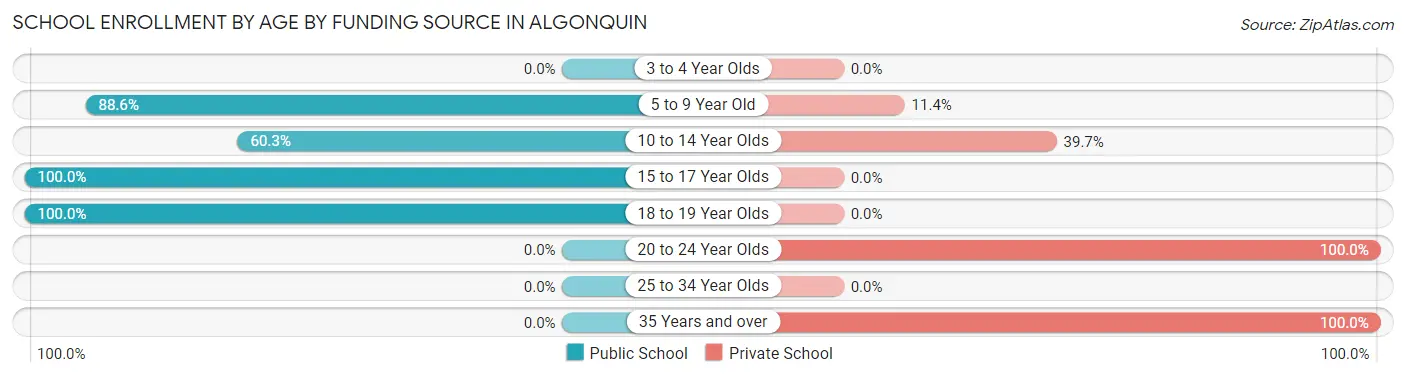
| Age Bracket | Public School | Private School |
| 3 to 4 Year Olds | 0 (0.0%) | 0 (0.0%) |
| 5 to 9 Year Old | 39 (88.6%) | 5 (11.4%) |
| 10 to 14 Year Olds | 35 (60.3%) | 23 (39.7%) |
| 15 to 17 Year Olds | 15 (100.0%) | 0 (0.0%) |
| 18 to 19 Year Olds | 12 (100.0%) | 0 (0.0%) |
| 20 to 24 Year Olds | 0 (0.0%) | 22 (100.0%) |
| 25 to 34 Year Olds | 0 (0.0%) | 0 (0.0%) |
| 35 Years and over | 0 (0.0%) | 6 (100.0%) |
| Total | 101 (64.3%) | 56 (35.7%) |
Educational Attainment by Field of Study in Algonquin
Education (127 | 38.5%), business (43 | 13.0%), social sciences (25 | 7.6%), arts & humanities (23 | 7.0%), and science & technology (22 | 6.7%) are the most common fields of study among 330 individuals in Algonquin who have obtained a bachelor's degree or higher.
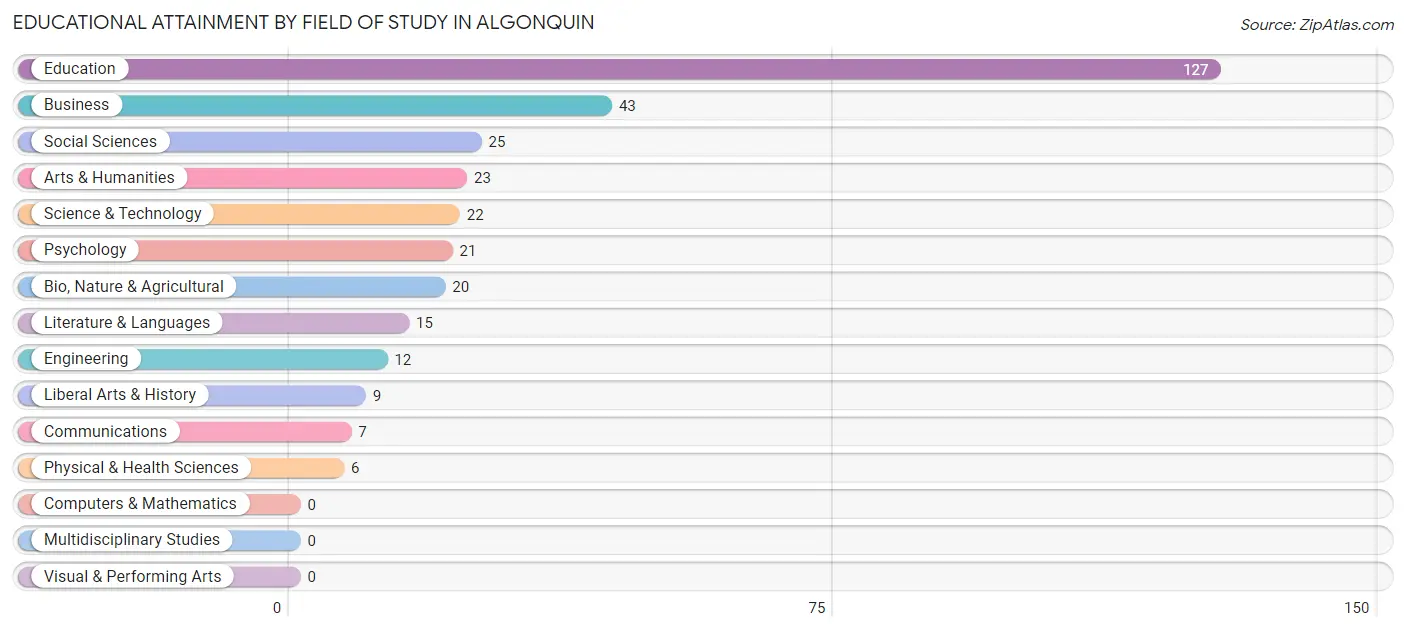
| Field of Study | # Graduates | % Graduates |
| Computers & Mathematics | 0 | 0.0% |
| Bio, Nature & Agricultural | 20 | 6.1% |
| Physical & Health Sciences | 6 | 1.8% |
| Psychology | 21 | 6.4% |
| Social Sciences | 25 | 7.6% |
| Engineering | 12 | 3.6% |
| Multidisciplinary Studies | 0 | 0.0% |
| Science & Technology | 22 | 6.7% |
| Business | 43 | 13.0% |
| Education | 127 | 38.5% |
| Literature & Languages | 15 | 4.5% |
| Liberal Arts & History | 9 | 2.7% |
| Visual & Performing Arts | 0 | 0.0% |
| Communications | 7 | 2.1% |
| Arts & Humanities | 23 | 7.0% |
| Total | 330 | 100.0% |
Transportation & Commute in Algonquin
Vehicle Availability by Sex in Algonquin
The most prevalent vehicle ownership categories in Algonquin are males with 3 vehicles (125, accounting for 42.4%) and females with 3 vehicles (66, making up 71.8%).
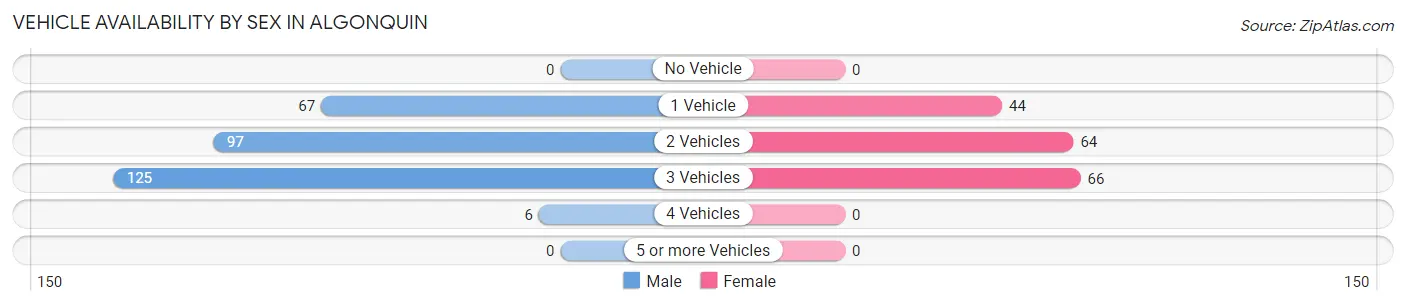
| Vehicles Available | Male | Female |
| No Vehicle | 0 (0.0%) | 0 (0.0%) |
| 1 Vehicle | 67 (22.7%) | 44 (25.3%) |
| 2 Vehicles | 97 (32.9%) | 64 (36.8%) |
| 3 Vehicles | 125 (42.4%) | 66 (37.9%) |
| 4 Vehicles | 6 (2.0%) | 0 (0.0%) |
| 5 or more Vehicles | 0 (0.0%) | 0 (0.0%) |
| Total | 295 (100.0%) | 174 (100.0%) |
Commute Time in Algonquin
The most frequently occuring commute durations in Algonquin are 10 to 14 minutes (128 commuters, 28.7%), 5 to 9 minutes (87 commuters, 19.5%), and 30 to 34 minutes (58 commuters, 13.0%).
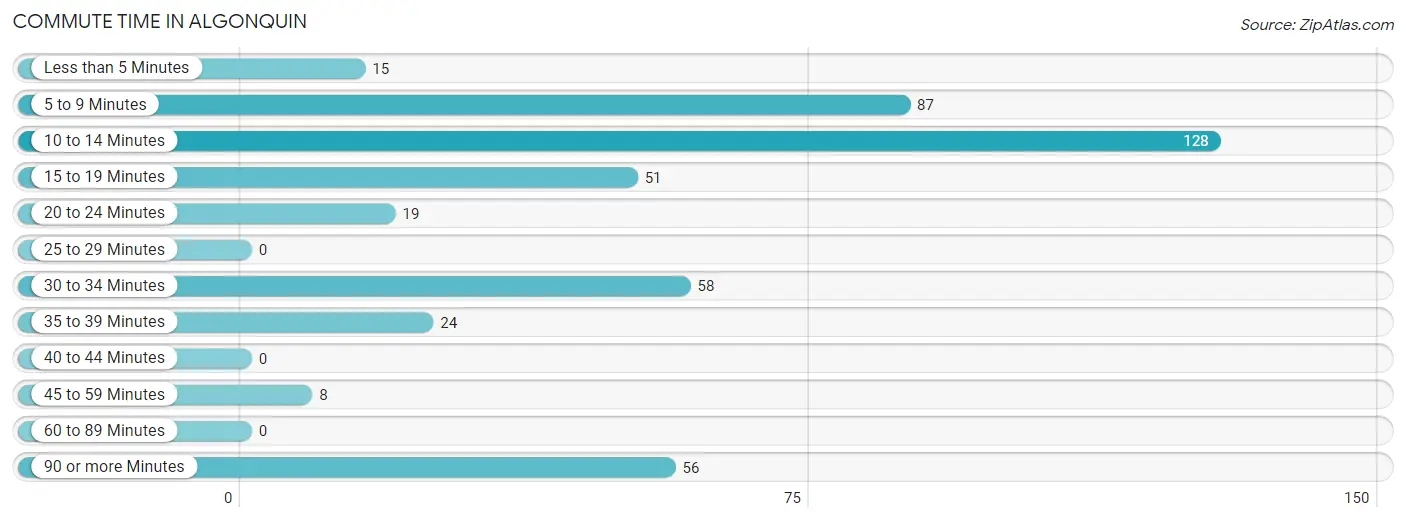
| Commute Time | # Commuters | % Commuters |
| Less than 5 Minutes | 15 | 3.4% |
| 5 to 9 Minutes | 87 | 19.5% |
| 10 to 14 Minutes | 128 | 28.7% |
| 15 to 19 Minutes | 51 | 11.4% |
| 20 to 24 Minutes | 19 | 4.3% |
| 25 to 29 Minutes | 0 | 0.0% |
| 30 to 34 Minutes | 58 | 13.0% |
| 35 to 39 Minutes | 24 | 5.4% |
| 40 to 44 Minutes | 0 | 0.0% |
| 45 to 59 Minutes | 8 | 1.8% |
| 60 to 89 Minutes | 0 | 0.0% |
| 90 or more Minutes | 56 | 12.6% |
Commute Time by Sex in Algonquin
The most common commute times in Algonquin are 10 to 14 minutes (75 commuters, 26.9%) for males and 10 to 14 minutes (53 commuters, 31.7%) for females.
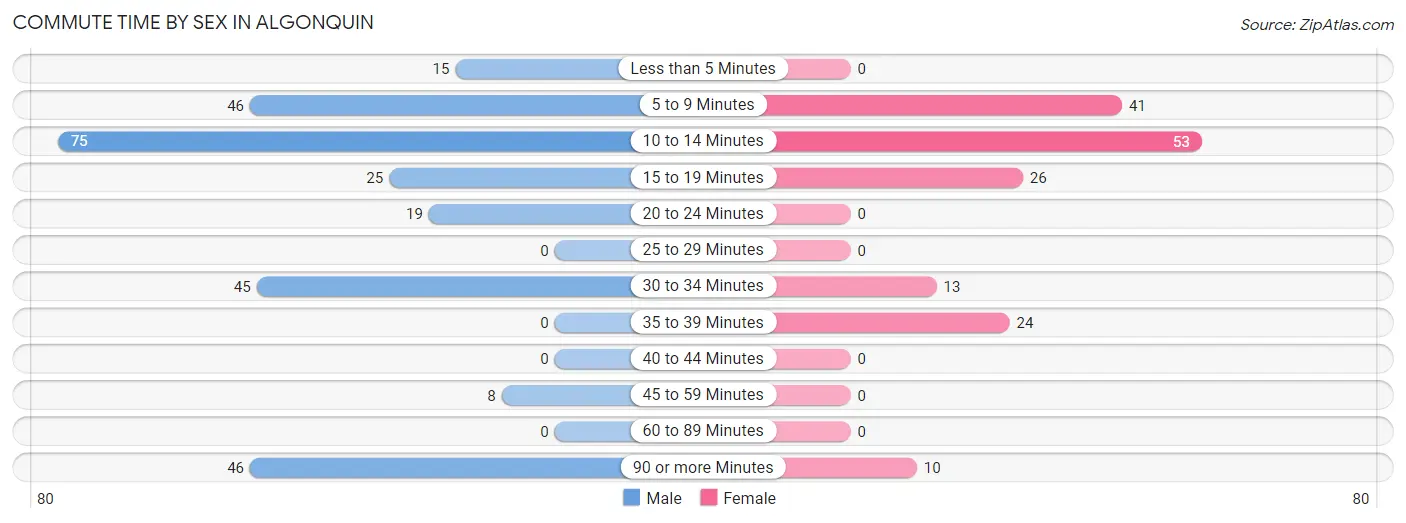
| Commute Time | Male | Female |
| Less than 5 Minutes | 15 (5.4%) | 0 (0.0%) |
| 5 to 9 Minutes | 46 (16.5%) | 41 (24.5%) |
| 10 to 14 Minutes | 75 (26.9%) | 53 (31.7%) |
| 15 to 19 Minutes | 25 (9.0%) | 26 (15.6%) |
| 20 to 24 Minutes | 19 (6.8%) | 0 (0.0%) |
| 25 to 29 Minutes | 0 (0.0%) | 0 (0.0%) |
| 30 to 34 Minutes | 45 (16.1%) | 13 (7.8%) |
| 35 to 39 Minutes | 0 (0.0%) | 24 (14.4%) |
| 40 to 44 Minutes | 0 (0.0%) | 0 (0.0%) |
| 45 to 59 Minutes | 8 (2.9%) | 0 (0.0%) |
| 60 to 89 Minutes | 0 (0.0%) | 0 (0.0%) |
| 90 or more Minutes | 46 (16.5%) | 10 (6.0%) |
Time of Departure to Work by Sex in Algonquin
The most frequent times of departure to work in Algonquin are 7:30 AM to 7:59 AM (77, 27.6%) for males and 7:30 AM to 7:59 AM (63, 37.7%) for females.
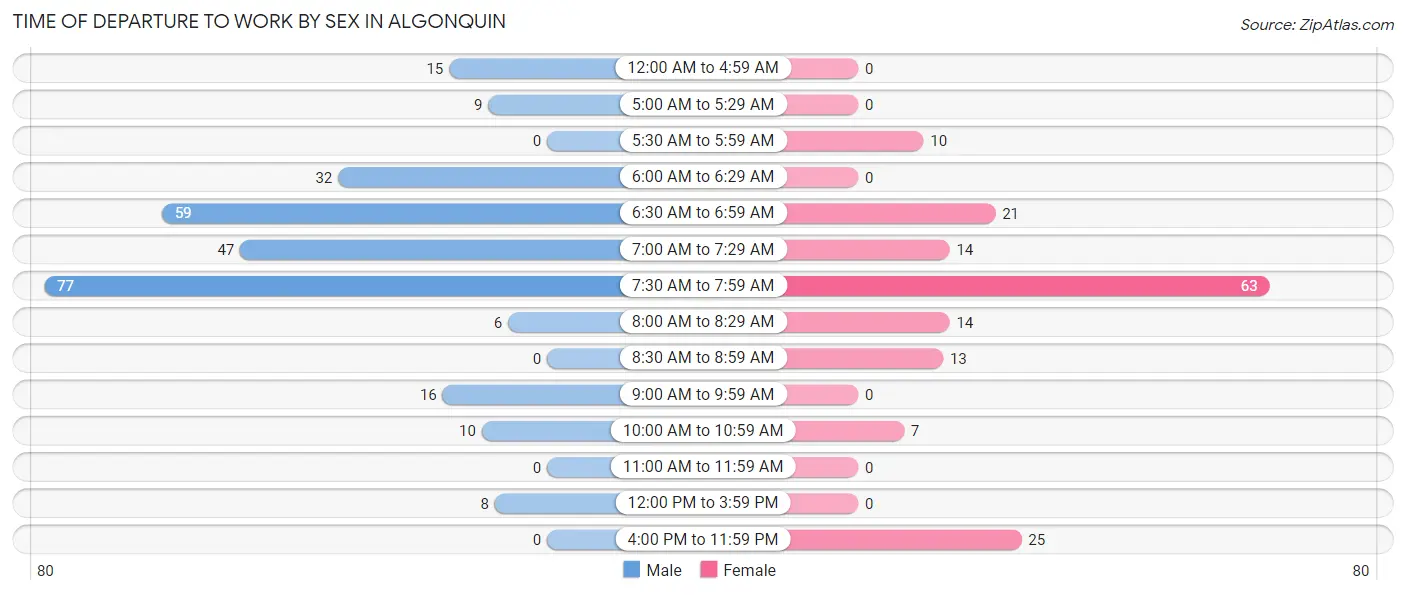
| Time of Departure | Male | Female |
| 12:00 AM to 4:59 AM | 15 (5.4%) | 0 (0.0%) |
| 5:00 AM to 5:29 AM | 9 (3.2%) | 0 (0.0%) |
| 5:30 AM to 5:59 AM | 0 (0.0%) | 10 (6.0%) |
| 6:00 AM to 6:29 AM | 32 (11.5%) | 0 (0.0%) |
| 6:30 AM to 6:59 AM | 59 (21.1%) | 21 (12.6%) |
| 7:00 AM to 7:29 AM | 47 (16.9%) | 14 (8.4%) |
| 7:30 AM to 7:59 AM | 77 (27.6%) | 63 (37.7%) |
| 8:00 AM to 8:29 AM | 6 (2.1%) | 14 (8.4%) |
| 8:30 AM to 8:59 AM | 0 (0.0%) | 13 (7.8%) |
| 9:00 AM to 9:59 AM | 16 (5.7%) | 0 (0.0%) |
| 10:00 AM to 10:59 AM | 10 (3.6%) | 7 (4.2%) |
| 11:00 AM to 11:59 AM | 0 (0.0%) | 0 (0.0%) |
| 12:00 PM to 3:59 PM | 8 (2.9%) | 0 (0.0%) |
| 4:00 PM to 11:59 PM | 0 (0.0%) | 25 (15.0%) |
| Total | 279 (100.0%) | 167 (100.0%) |
Housing Occupancy in Algonquin
Occupancy by Ownership in Algonquin
Of the total 509 dwellings in Algonquin, owner-occupied units account for 496 (97.5%), while renter-occupied units make up 13 (2.5%).
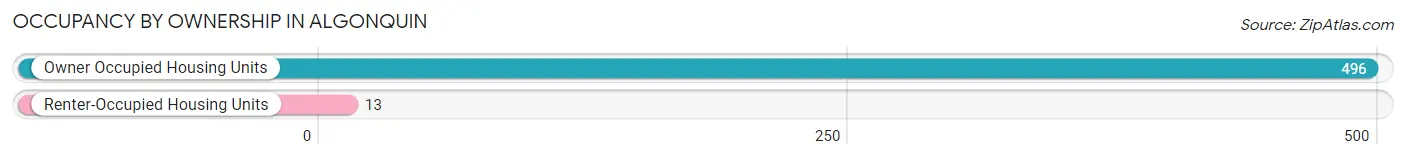
| Occupancy | # Housing Units | % Housing Units |
| Owner Occupied Housing Units | 496 | 97.5% |
| Renter-Occupied Housing Units | 13 | 2.5% |
| Total Occupied Housing Units | 509 | 100.0% |
Occupancy by Household Size in Algonquin
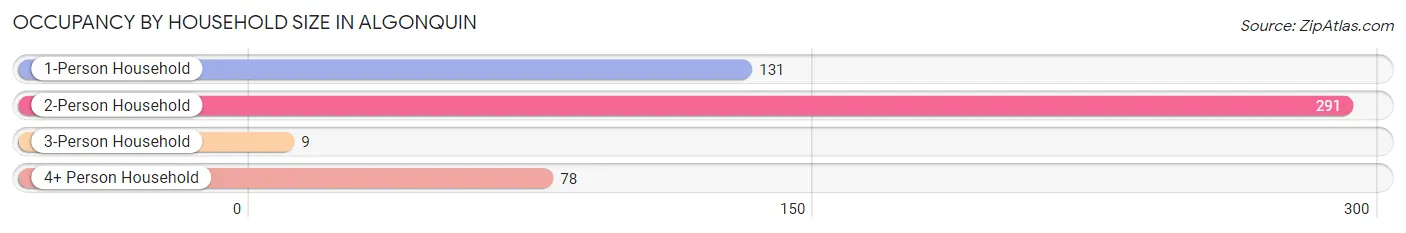
| Household Size | # Housing Units | % Housing Units |
| 1-Person Household | 131 | 25.7% |
| 2-Person Household | 291 | 57.2% |
| 3-Person Household | 9 | 1.8% |
| 4+ Person Household | 78 | 15.3% |
| Total Housing Units | 509 | 100.0% |
Occupancy by Ownership by Household Size in Algonquin
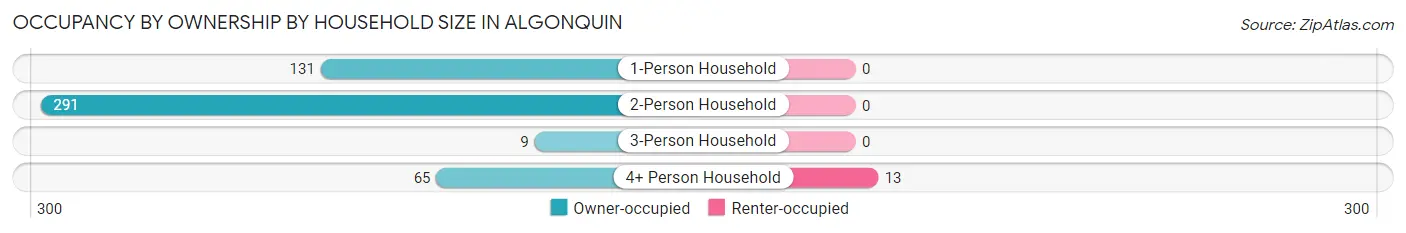
| Household Size | Owner-occupied | Renter-occupied |
| 1-Person Household | 131 (100.0%) | 0 (0.0%) |
| 2-Person Household | 291 (100.0%) | 0 (0.0%) |
| 3-Person Household | 9 (100.0%) | 0 (0.0%) |
| 4+ Person Household | 65 (83.3%) | 13 (16.7%) |
| Total Housing Units | 496 (97.5%) | 13 (2.5%) |
Occupancy by Educational Attainment in Algonquin
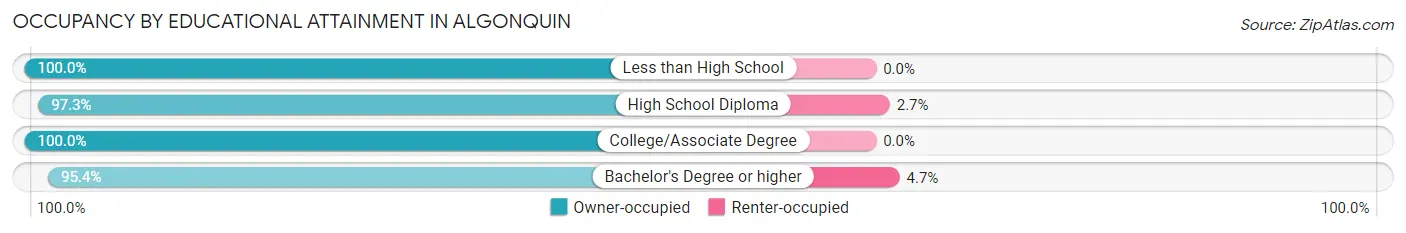
| Household Size | Owner-occupied | Renter-occupied |
| Less than High School | 27 (100.0%) | 0 (0.0%) |
| High School Diploma | 108 (97.3%) | 3 (2.7%) |
| College/Associate Degree | 156 (100.0%) | 0 (0.0%) |
| Bachelor's Degree or higher | 205 (95.4%) | 10 (4.6%) |
Occupancy by Age of Householder in Algonquin
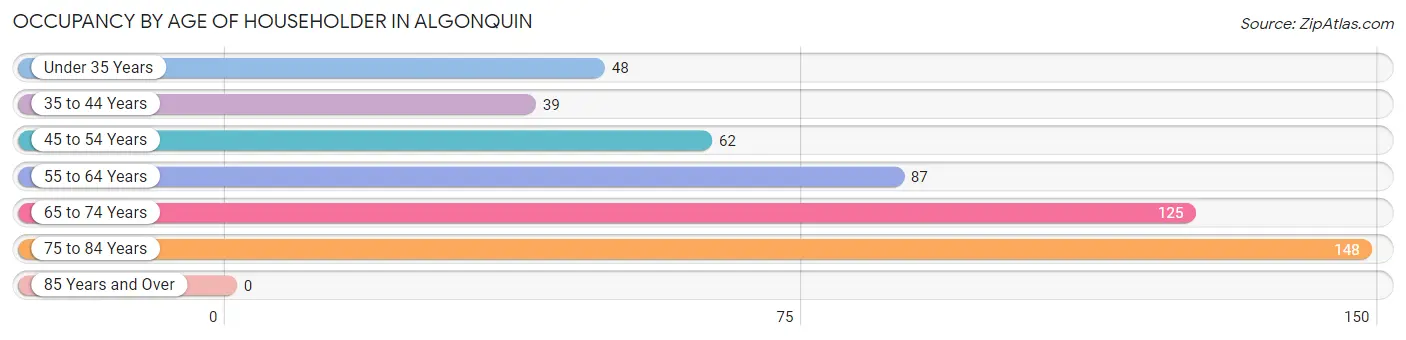
| Age Bracket | # Households | % Households |
| Under 35 Years | 48 | 9.4% |
| 35 to 44 Years | 39 | 7.7% |
| 45 to 54 Years | 62 | 12.2% |
| 55 to 64 Years | 87 | 17.1% |
| 65 to 74 Years | 125 | 24.6% |
| 75 to 84 Years | 148 | 29.1% |
| 85 Years and Over | 0 | 0.0% |
| Total | 509 | 100.0% |
Housing Finances in Algonquin
Median Income by Occupancy in Algonquin
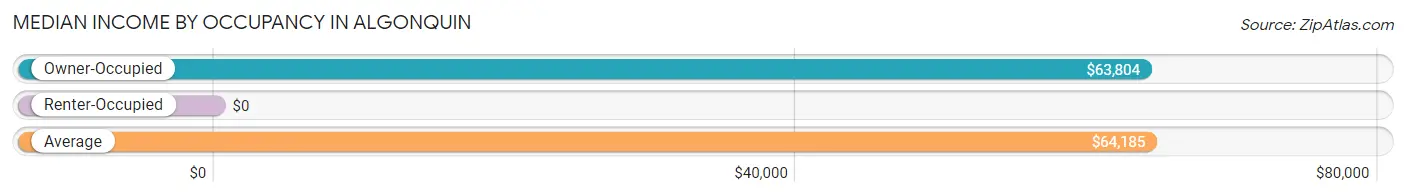
| Occupancy Type | # Households | Median Income |
| Owner-Occupied | 496 (97.5%) | $63,804 |
| Renter-Occupied | 13 (2.5%) | $0 |
| Average | 509 (100.0%) | $64,185 |
Occupancy by Householder Income Bracket in Algonquin
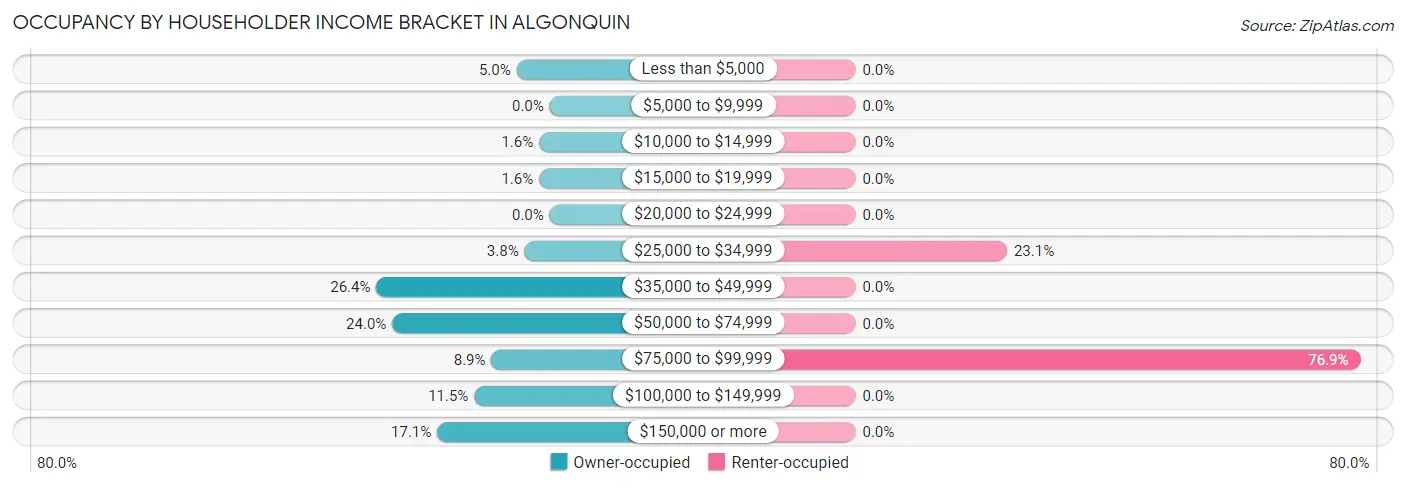
| Income Bracket | Owner-occupied | Renter-occupied |
| Less than $5,000 | 25 (5.0%) | 0 (0.0%) |
| $5,000 to $9,999 | 0 (0.0%) | 0 (0.0%) |
| $10,000 to $14,999 | 8 (1.6%) | 0 (0.0%) |
| $15,000 to $19,999 | 8 (1.6%) | 0 (0.0%) |
| $20,000 to $24,999 | 0 (0.0%) | 0 (0.0%) |
| $25,000 to $34,999 | 19 (3.8%) | 3 (23.1%) |
| $35,000 to $49,999 | 131 (26.4%) | 0 (0.0%) |
| $50,000 to $74,999 | 119 (24.0%) | 0 (0.0%) |
| $75,000 to $99,999 | 44 (8.9%) | 10 (76.9%) |
| $100,000 to $149,999 | 57 (11.5%) | 0 (0.0%) |
| $150,000 or more | 85 (17.1%) | 0 (0.0%) |
| Total | 496 (100.0%) | 13 (100.0%) |
Monthly Housing Cost Tiers in Algonquin
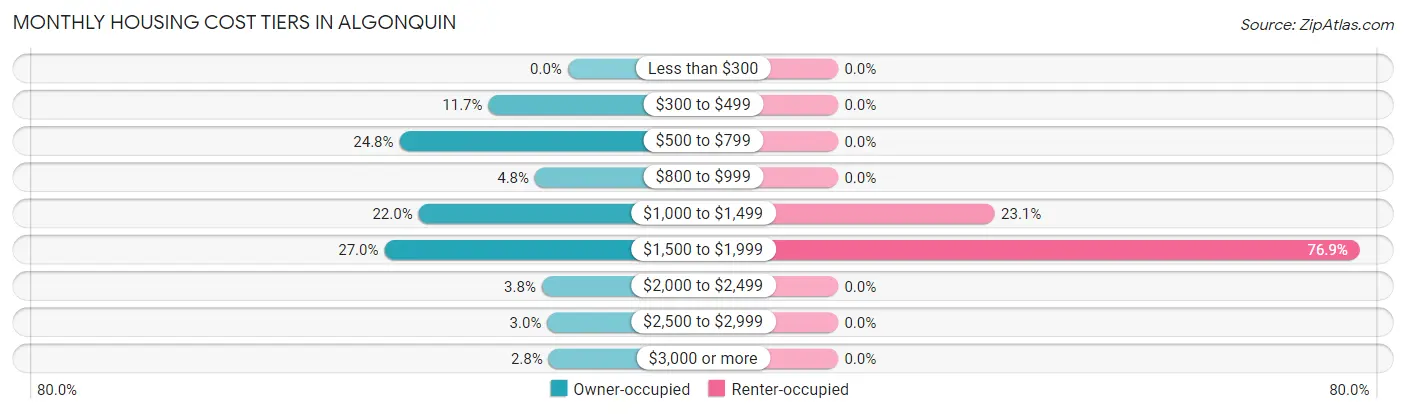
| Monthly Cost | Owner-occupied | Renter-occupied |
| Less than $300 | 0 (0.0%) | 0 (0.0%) |
| $300 to $499 | 58 (11.7%) | 0 (0.0%) |
| $500 to $799 | 123 (24.8%) | 0 (0.0%) |
| $800 to $999 | 24 (4.8%) | 0 (0.0%) |
| $1,000 to $1,499 | 109 (22.0%) | 3 (23.1%) |
| $1,500 to $1,999 | 134 (27.0%) | 10 (76.9%) |
| $2,000 to $2,499 | 19 (3.8%) | 0 (0.0%) |
| $2,500 to $2,999 | 15 (3.0%) | 0 (0.0%) |
| $3,000 or more | 14 (2.8%) | 0 (0.0%) |
| Total | 496 (100.0%) | 13 (100.0%) |
Physical Housing Characteristics in Algonquin
Housing Structures in Algonquin
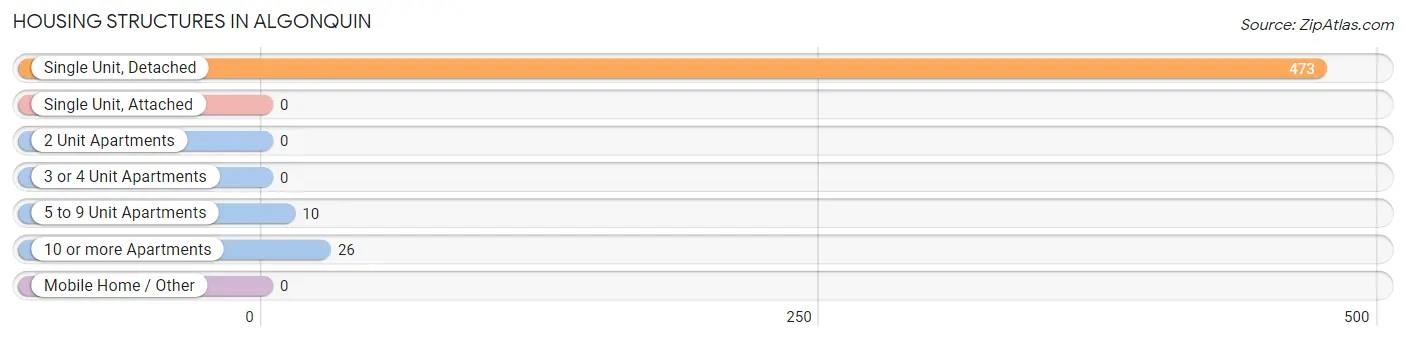
| Structure Type | # Housing Units | % Housing Units |
| Single Unit, Detached | 473 | 92.9% |
| Single Unit, Attached | 0 | 0.0% |
| 2 Unit Apartments | 0 | 0.0% |
| 3 or 4 Unit Apartments | 0 | 0.0% |
| 5 to 9 Unit Apartments | 10 | 2.0% |
| 10 or more Apartments | 26 | 5.1% |
| Mobile Home / Other | 0 | 0.0% |
| Total | 509 | 100.0% |
Housing Structures by Occupancy in Algonquin
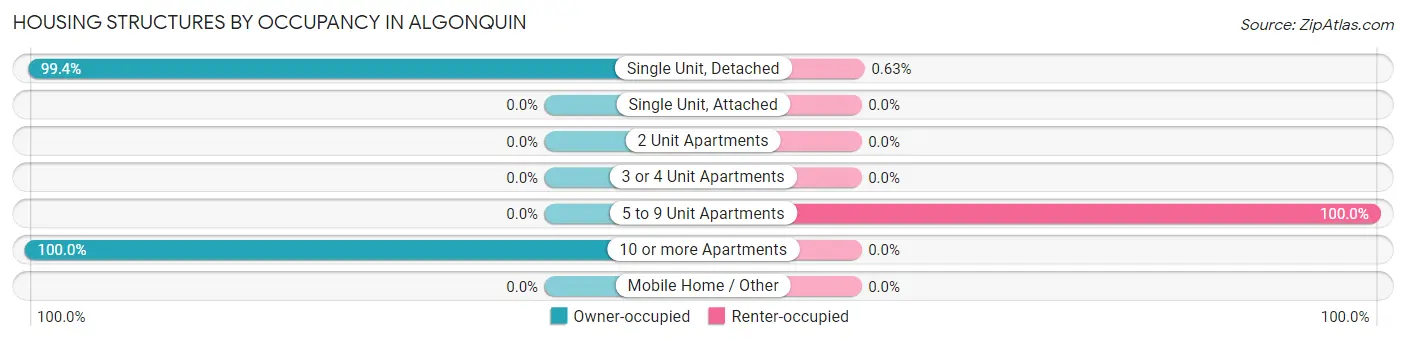
| Structure Type | Owner-occupied | Renter-occupied |
| Single Unit, Detached | 470 (99.4%) | 3 (0.6%) |
| Single Unit, Attached | 0 (0.0%) | 0 (0.0%) |
| 2 Unit Apartments | 0 (0.0%) | 0 (0.0%) |
| 3 or 4 Unit Apartments | 0 (0.0%) | 0 (0.0%) |
| 5 to 9 Unit Apartments | 0 (0.0%) | 10 (100.0%) |
| 10 or more Apartments | 26 (100.0%) | 0 (0.0%) |
| Mobile Home / Other | 0 (0.0%) | 0 (0.0%) |
| Total | 496 (97.5%) | 13 (2.5%) |
Housing Structures by Number of Rooms in Algonquin
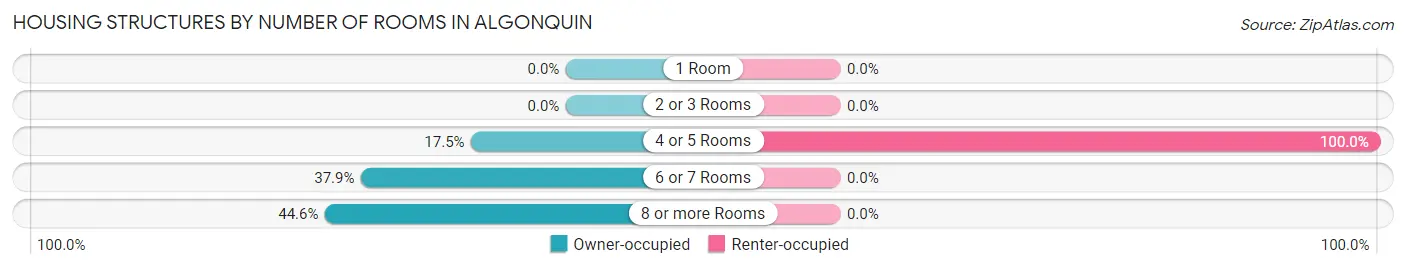
| Number of Rooms | Owner-occupied | Renter-occupied |
| 1 Room | 0 (0.0%) | 0 (0.0%) |
| 2 or 3 Rooms | 0 (0.0%) | 0 (0.0%) |
| 4 or 5 Rooms | 87 (17.5%) | 13 (100.0%) |
| 6 or 7 Rooms | 188 (37.9%) | 0 (0.0%) |
| 8 or more Rooms | 221 (44.6%) | 0 (0.0%) |
| Total | 496 (100.0%) | 13 (100.0%) |
Housing Structure by Heating Type in Algonquin
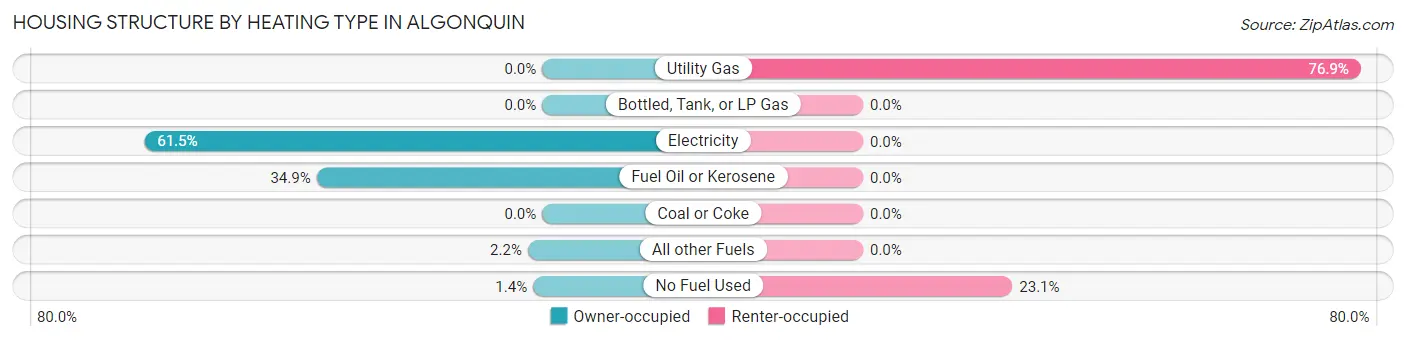
| Heating Type | Owner-occupied | Renter-occupied |
| Utility Gas | 0 (0.0%) | 10 (76.9%) |
| Bottled, Tank, or LP Gas | 0 (0.0%) | 0 (0.0%) |
| Electricity | 305 (61.5%) | 0 (0.0%) |
| Fuel Oil or Kerosene | 173 (34.9%) | 0 (0.0%) |
| Coal or Coke | 0 (0.0%) | 0 (0.0%) |
| All other Fuels | 11 (2.2%) | 0 (0.0%) |
| No Fuel Used | 7 (1.4%) | 3 (23.1%) |
| Total | 496 (100.0%) | 13 (100.0%) |
Household Vehicle Usage in Algonquin
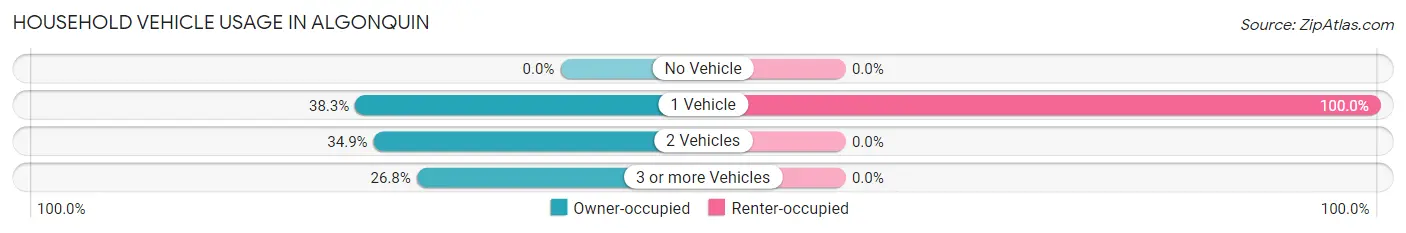
| Vehicles per Household | Owner-occupied | Renter-occupied |
| No Vehicle | 0 (0.0%) | 0 (0.0%) |
| 1 Vehicle | 190 (38.3%) | 13 (100.0%) |
| 2 Vehicles | 173 (34.9%) | 0 (0.0%) |
| 3 or more Vehicles | 133 (26.8%) | 0 (0.0%) |
| Total | 496 (100.0%) | 13 (100.0%) |
Real Estate & Mortgages in Algonquin
Real Estate and Mortgage Overview in Algonquin
| Characteristic | Without Mortgage | With Mortgage |
| Housing Units | 189 | 307 |
| Median Property Value | $281,400 | $294,800 |
| Median Household Income | $49,479 | $66 |
| Monthly Housing Costs | $607 | $14 |
| Real Estate Taxes | $2,563 | $0 |
Property Value by Mortgage Status in Algonquin
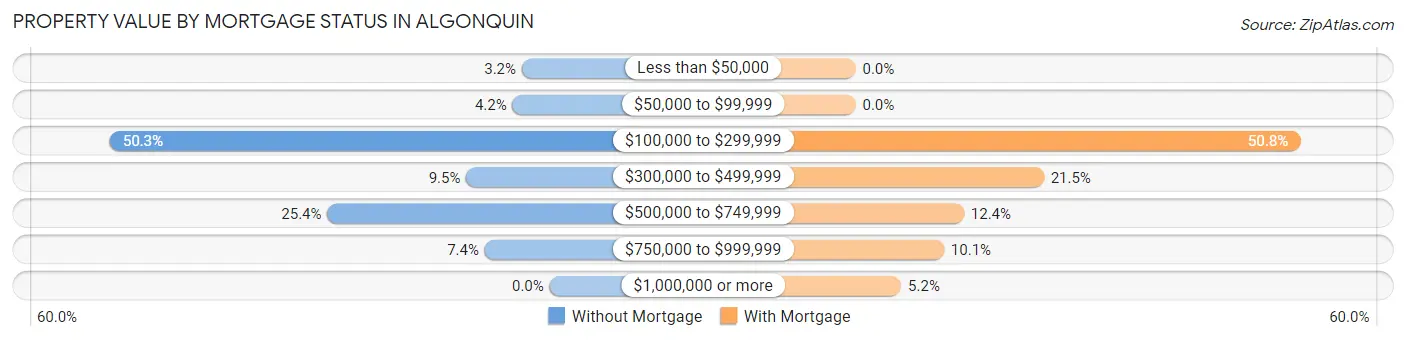
| Property Value | Without Mortgage | With Mortgage |
| Less than $50,000 | 6 (3.2%) | 0 (0.0%) |
| $50,000 to $99,999 | 8 (4.2%) | 0 (0.0%) |
| $100,000 to $299,999 | 95 (50.3%) | 156 (50.8%) |
| $300,000 to $499,999 | 18 (9.5%) | 66 (21.5%) |
| $500,000 to $749,999 | 48 (25.4%) | 38 (12.4%) |
| $750,000 to $999,999 | 14 (7.4%) | 31 (10.1%) |
| $1,000,000 or more | 0 (0.0%) | 16 (5.2%) |
| Total | 189 (100.0%) | 307 (100.0%) |
Household Income by Mortgage Status in Algonquin
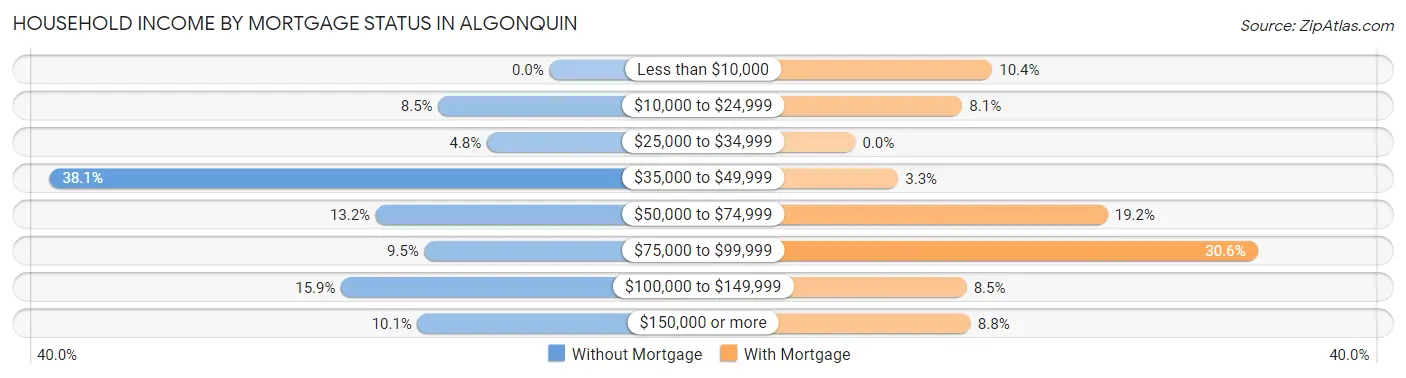
| Household Income | Without Mortgage | With Mortgage |
| Less than $10,000 | 0 (0.0%) | 32 (10.4%) |
| $10,000 to $24,999 | 16 (8.5%) | 25 (8.1%) |
| $25,000 to $34,999 | 9 (4.8%) | 0 (0.0%) |
| $35,000 to $49,999 | 72 (38.1%) | 10 (3.3%) |
| $50,000 to $74,999 | 25 (13.2%) | 59 (19.2%) |
| $75,000 to $99,999 | 18 (9.5%) | 94 (30.6%) |
| $100,000 to $149,999 | 30 (15.9%) | 26 (8.5%) |
| $150,000 or more | 19 (10.1%) | 27 (8.8%) |
| Total | 189 (100.0%) | 307 (100.0%) |
Property Value to Household Income Ratio in Algonquin
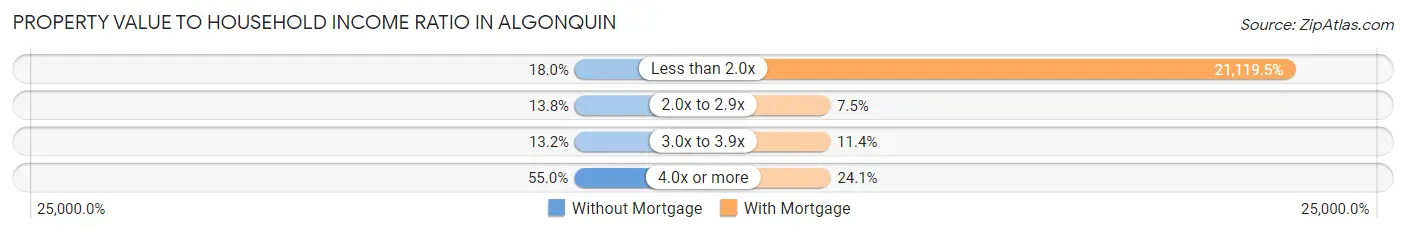
| Value-to-Income Ratio | Without Mortgage | With Mortgage |
| Less than 2.0x | 34 (18.0%) | 64,837 (21,119.5%) |
| 2.0x to 2.9x | 26 (13.8%) | 23 (7.5%) |
| 3.0x to 3.9x | 25 (13.2%) | 35 (11.4%) |
| 4.0x or more | 104 (55.0%) | 74 (24.1%) |
| Total | 189 (100.0%) | 307 (100.0%) |
Real Estate Taxes by Mortgage Status in Algonquin
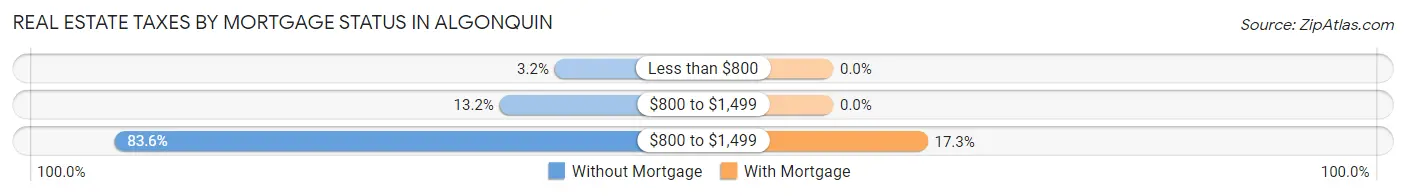
| Property Taxes | Without Mortgage | With Mortgage |
| Less than $800 | 6 (3.2%) | 0 (0.0%) |
| $800 to $1,499 | 25 (13.2%) | 0 (0.0%) |
| $800 to $1,499 | 158 (83.6%) | 53 (17.3%) |
| Total | 189 (100.0%) | 307 (100.0%) |
Health & Disability in Algonquin
Health Insurance Coverage by Age in Algonquin
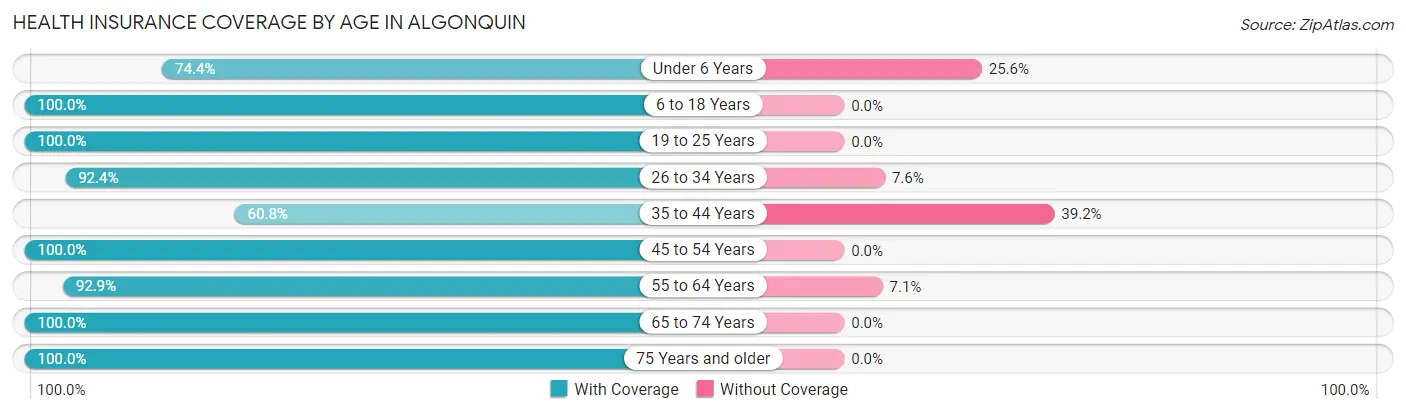
| Age Bracket | With Coverage | Without Coverage |
| Under 6 Years | 29 (74.4%) | 10 (25.6%) |
| 6 to 18 Years | 101 (100.0%) | 0 (0.0%) |
| 19 to 25 Years | 69 (100.0%) | 0 (0.0%) |
| 26 to 34 Years | 61 (92.4%) | 5 (7.6%) |
| 35 to 44 Years | 59 (60.8%) | 38 (39.2%) |
| 45 to 54 Years | 81 (100.0%) | 0 (0.0%) |
| 55 to 64 Years | 143 (92.9%) | 11 (7.1%) |
| 65 to 74 Years | 205 (100.0%) | 0 (0.0%) |
| 75 Years and older | 243 (100.0%) | 0 (0.0%) |
| Total | 991 (93.9%) | 64 (6.1%) |
Health Insurance Coverage by Citizenship Status in Algonquin
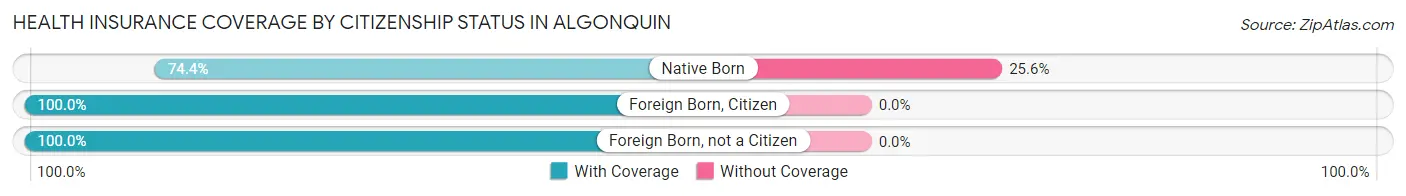
| Citizenship Status | With Coverage | Without Coverage |
| Native Born | 29 (74.4%) | 10 (25.6%) |
| Foreign Born, Citizen | 101 (100.0%) | 0 (0.0%) |
| Foreign Born, not a Citizen | 69 (100.0%) | 0 (0.0%) |
Health Insurance Coverage by Household Income in Algonquin
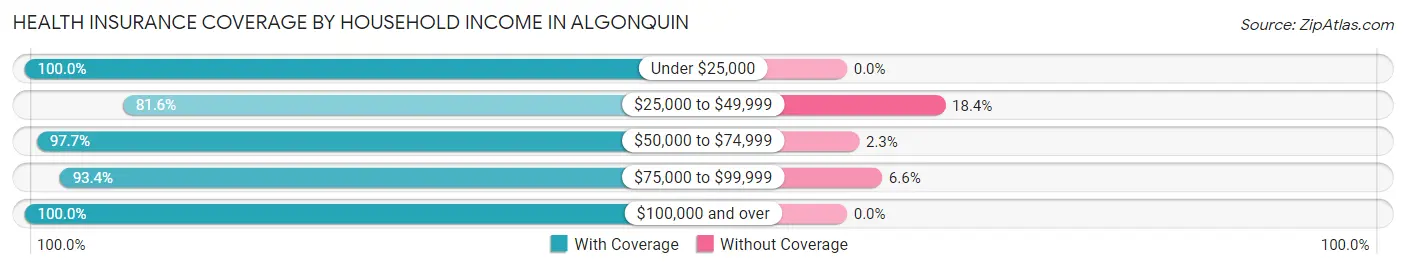
| Household Income | With Coverage | Without Coverage |
| Under $25,000 | 50 (100.0%) | 0 (0.0%) |
| $25,000 to $49,999 | 217 (81.6%) | 49 (18.4%) |
| $50,000 to $74,999 | 213 (97.7%) | 5 (2.3%) |
| $75,000 to $99,999 | 142 (93.4%) | 10 (6.6%) |
| $100,000 and over | 363 (100.0%) | 0 (0.0%) |
Public vs Private Health Insurance Coverage by Age in Algonquin
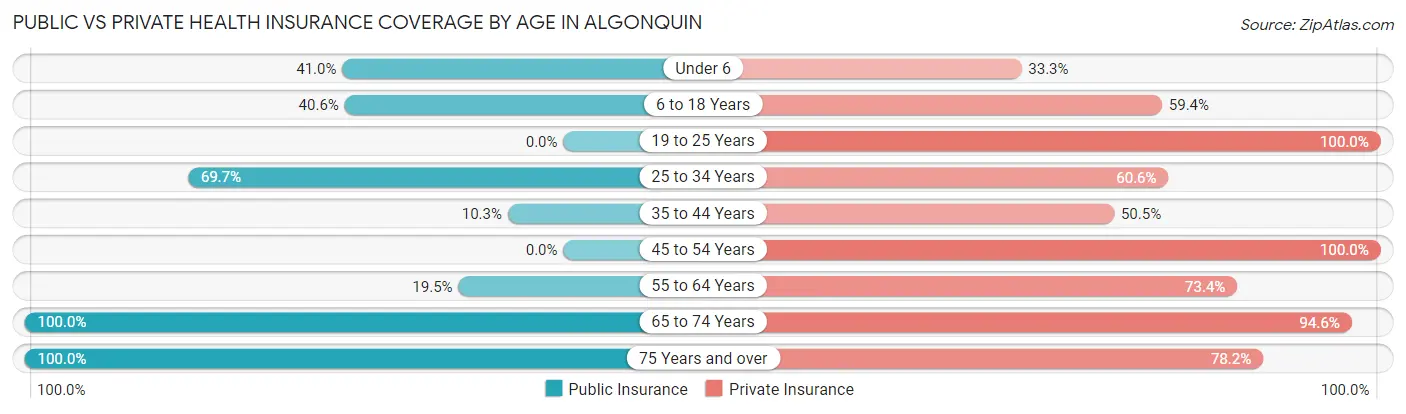
| Age Bracket | Public Insurance | Private Insurance |
| Under 6 | 16 (41.0%) | 13 (33.3%) |
| 6 to 18 Years | 41 (40.6%) | 60 (59.4%) |
| 19 to 25 Years | 0 (0.0%) | 69 (100.0%) |
| 25 to 34 Years | 46 (69.7%) | 40 (60.6%) |
| 35 to 44 Years | 10 (10.3%) | 49 (50.5%) |
| 45 to 54 Years | 0 (0.0%) | 81 (100.0%) |
| 55 to 64 Years | 30 (19.5%) | 113 (73.4%) |
| 65 to 74 Years | 205 (100.0%) | 194 (94.6%) |
| 75 Years and over | 243 (100.0%) | 190 (78.2%) |
| Total | 591 (56.0%) | 809 (76.7%) |
Disability Status by Sex by Age in Algonquin

| Age Bracket | Male | Female |
| Under 5 Years | 0 (0.0%) | 0 (0.0%) |
| 5 to 17 Years | 10 (12.5%) | 0 (0.0%) |
| 18 to 34 Years | 0 (0.0%) | 0 (0.0%) |
| 35 to 64 Years | 39 (21.0%) | 0 (0.0%) |
| 65 to 74 Years | 33 (31.4%) | 29 (29.0%) |
| 75 Years and over | 20 (29.0%) | 104 (59.8%) |
Disability Class by Sex by Age in Algonquin
Disability Class: Hearing Difficulty
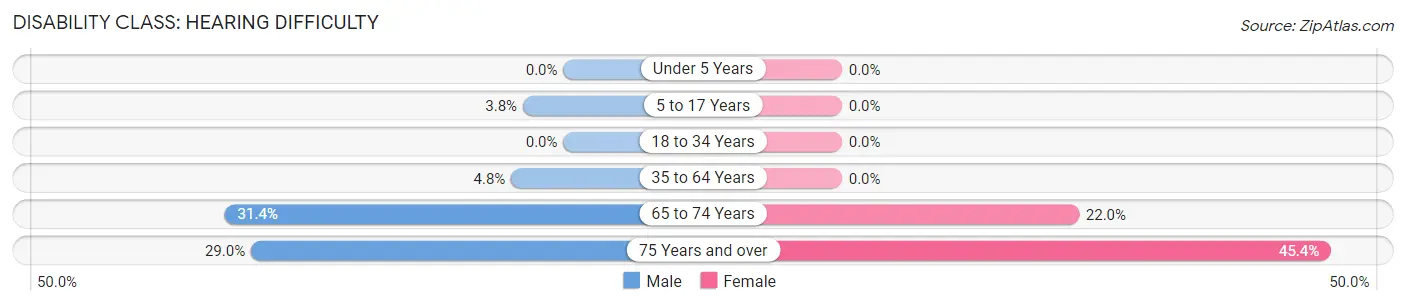
| Age Bracket | Male | Female |
| Under 5 Years | 0 (0.0%) | 0 (0.0%) |
| 5 to 17 Years | 3 (3.7%) | 0 (0.0%) |
| 18 to 34 Years | 0 (0.0%) | 0 (0.0%) |
| 35 to 64 Years | 9 (4.8%) | 0 (0.0%) |
| 65 to 74 Years | 33 (31.4%) | 22 (22.0%) |
| 75 Years and over | 20 (29.0%) | 79 (45.4%) |
Disability Class: Vision Difficulty
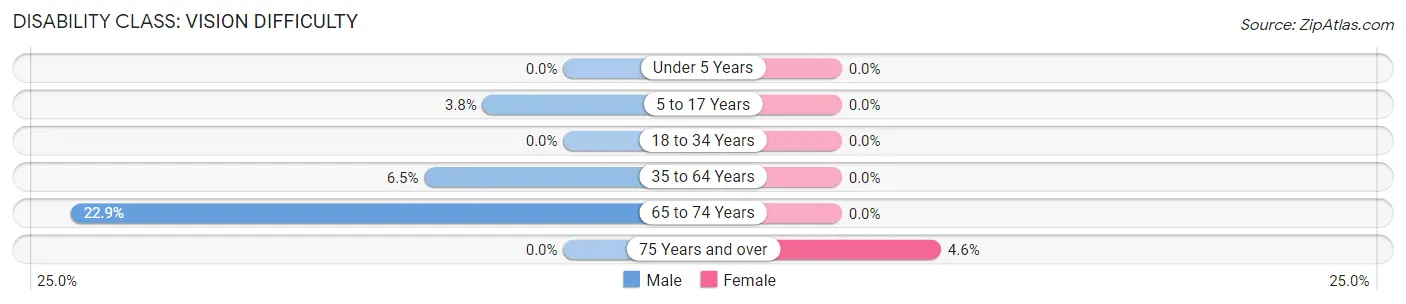
| Age Bracket | Male | Female |
| Under 5 Years | 0 (0.0%) | 0 (0.0%) |
| 5 to 17 Years | 3 (3.7%) | 0 (0.0%) |
| 18 to 34 Years | 0 (0.0%) | 0 (0.0%) |
| 35 to 64 Years | 12 (6.5%) | 0 (0.0%) |
| 65 to 74 Years | 24 (22.9%) | 0 (0.0%) |
| 75 Years and over | 0 (0.0%) | 8 (4.6%) |
Disability Class: Cognitive Difficulty
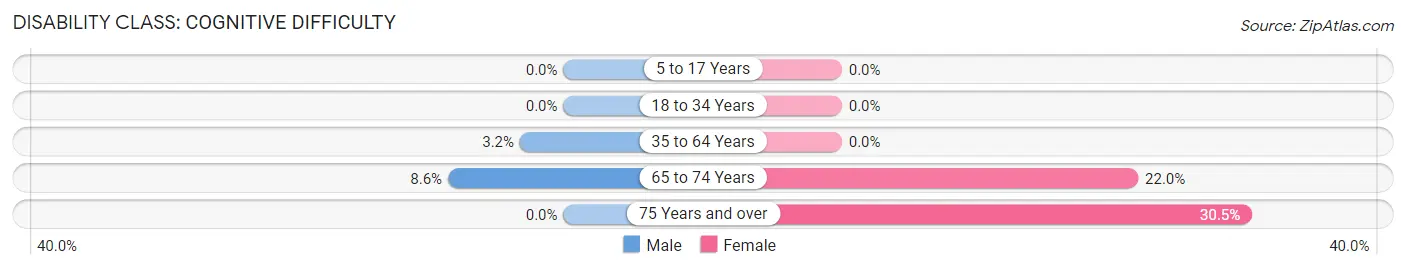
| Age Bracket | Male | Female |
| 5 to 17 Years | 0 (0.0%) | 0 (0.0%) |
| 18 to 34 Years | 0 (0.0%) | 0 (0.0%) |
| 35 to 64 Years | 6 (3.2%) | 0 (0.0%) |
| 65 to 74 Years | 9 (8.6%) | 22 (22.0%) |
| 75 Years and over | 0 (0.0%) | 53 (30.5%) |
Disability Class: Ambulatory Difficulty
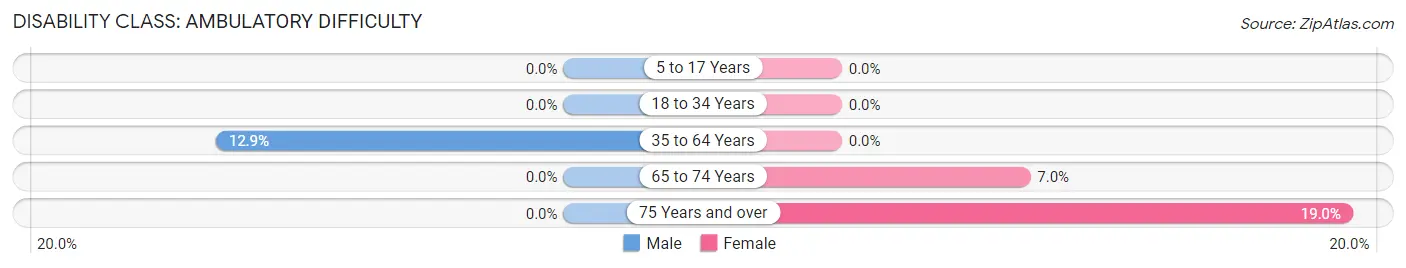
| Age Bracket | Male | Female |
| 5 to 17 Years | 0 (0.0%) | 0 (0.0%) |
| 18 to 34 Years | 0 (0.0%) | 0 (0.0%) |
| 35 to 64 Years | 24 (12.9%) | 0 (0.0%) |
| 65 to 74 Years | 0 (0.0%) | 7 (7.0%) |
| 75 Years and over | 0 (0.0%) | 33 (19.0%) |
Disability Class: Self-Care Difficulty
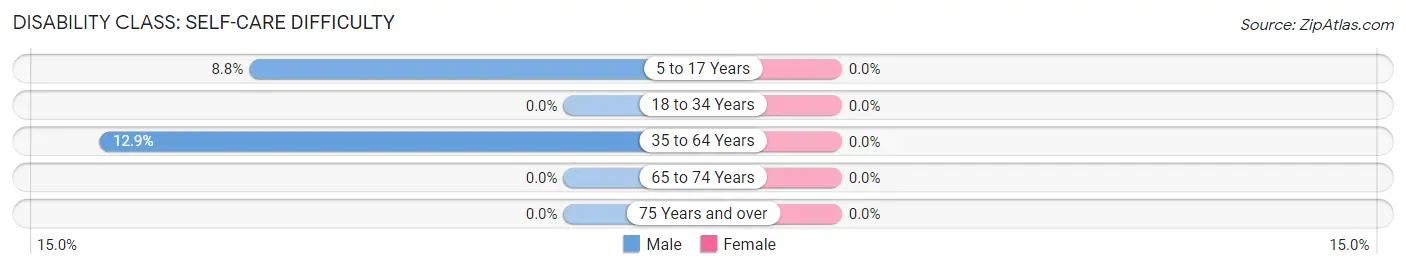
| Age Bracket | Male | Female |
| 5 to 17 Years | 7 (8.7%) | 0 (0.0%) |
| 18 to 34 Years | 0 (0.0%) | 0 (0.0%) |
| 35 to 64 Years | 24 (12.9%) | 0 (0.0%) |
| 65 to 74 Years | 0 (0.0%) | 0 (0.0%) |
| 75 Years and over | 0 (0.0%) | 0 (0.0%) |
Technology Access in Algonquin
Computing Device Access in Algonquin
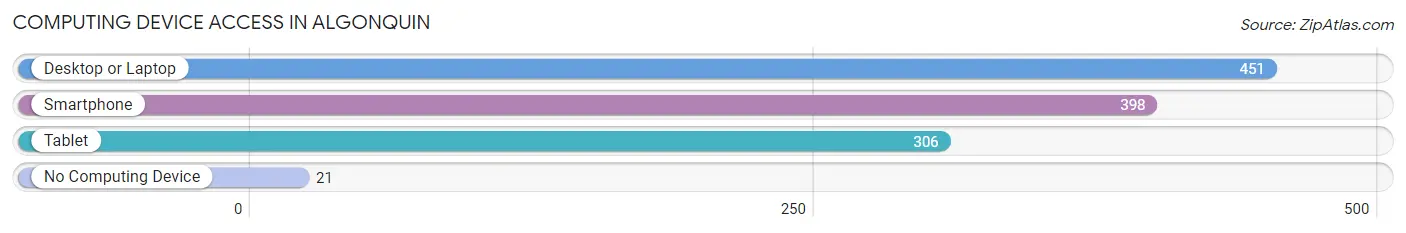
| Device Type | # Households | % Households |
| Desktop or Laptop | 451 | 88.6% |
| Smartphone | 398 | 78.2% |
| Tablet | 306 | 60.1% |
| No Computing Device | 21 | 4.1% |
| Total | 509 | 100.0% |
Internet Access in Algonquin
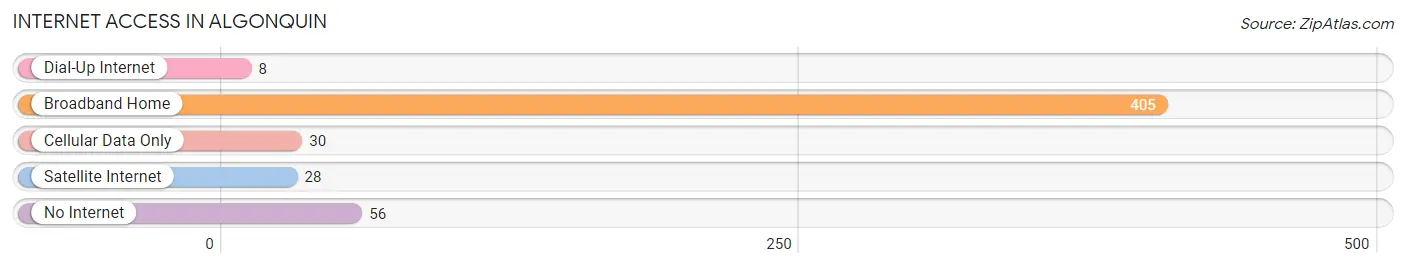
| Internet Type | # Households | % Households |
| Dial-Up Internet | 8 | 1.6% |
| Broadband Home | 405 | 79.6% |
| Cellular Data Only | 30 | 5.9% |
| Satellite Internet | 28 | 5.5% |
| No Internet | 56 | 11.0% |
| Total | 509 | 100.0% |
Algonquin Summary
Algonquin is a small town located in Maryland, United States. It is situated in the northern part of the state, near the Potomac River. The town has a population of approximately 1,500 people and is part of Montgomery County.
History
Algonquin was first settled in the late 1700s by a group of German immigrants. The town was originally known as “Germantown” and was part of Frederick County. In 1808, the town was renamed “Algonquin” after the Algonquin tribe of Native Americans. The town was incorporated in 1867 and has remained a small, rural community ever since.
Geography
Algonquin is located in the northern part of Maryland, near the Potomac River. The town is situated in a rural area and is surrounded by rolling hills and farmland. The town is located approximately 25 miles from Washington, D.C. and is part of Montgomery County.
Economy
Algonquin’s economy is largely based on agriculture and tourism. The town is home to several farms, which produce a variety of crops, including corn, soybeans, and wheat. The town also has several small businesses, including restaurants, shops, and a bed and breakfast. Tourism is also an important part of the town’s economy, as many people visit the area to take advantage of the town’s rural setting and scenic views.
Demographics
As of the 2010 census, Algonquin had a population of 1,500 people. The town is predominantly white, with approximately 90% of the population identifying as Caucasian. The town also has a small Hispanic population, with approximately 5% of the population identifying as Hispanic or Latino. The median household income in Algonquin is $60,000, and the median age is 44.
Algonquin is a small, rural town located in Maryland. It has a population of approximately 1,500 people and is part of Montgomery County. The town was first settled in the late 1700s by a group of German immigrants and was originally known as “Germantown.” The town’s economy is largely based on agriculture and tourism, and the town is home to several farms and small businesses. The town is predominantly white, with approximately 90% of the population identifying as Caucasian. The median household income in Algonquin is $60,000, and the median age is 44.
Common Questions
What is Per Capita Income in Algonquin?
Per Capita income in Algonquin is $40,798.
What is the Median Family Income in Algonquin?
Median Family Income in Algonquin is $66,008.
What is the Median Household income in Algonquin?
Median Household Income in Algonquin is $64,185.
What is Income or Wage Gap in Algonquin?
Income or Wage Gap in Algonquin is 19.0%.
Women in Algonquin earn 81.0 cents for every dollar earned by a man.
What is Inequality or Gini Index in Algonquin?
Inequality or Gini Index in Algonquin is 0.39.
What is the Total Population of Algonquin?
Total Population of Algonquin is 1,055.
What is the Total Male Population of Algonquin?
Total Male Population of Algonquin is 517.
What is the Total Female Population of Algonquin?
Total Female Population of Algonquin is 538.
What is the Ratio of Males per 100 Females in Algonquin?
There are 96.10 Males per 100 Females in Algonquin.
What is the Ratio of Females per 100 Males in Algonquin?
There are 104.06 Females per 100 Males in Algonquin.
What is the Median Population Age in Algonquin?
Median Population Age in Algonquin is 60.4 Years.
What is the Average Family Size in Algonquin
Average Family Size in Algonquin is 2.5 People.
What is the Average Household Size in Algonquin
Average Household Size in Algonquin is 2.1 People.
How Large is the Labor Force in Algonquin?
There are 510 People in the Labor Forcein in Algonquin.
What is the Percentage of People in the Labor Force in Algonquin?
55.6% of People are in the Labor Force in Algonquin.
What is the Unemployment Rate in Algonquin?
Unemployment Rate in Algonquin is 8.0%.