Zip Codes with the Highest Percentage of Population Employed in Installation, Maintenance & Repair in Bowie, MD
RELATED REPORTS & OPTIONS
Installation, Maintenance & Repair
Bowie
Compare Zip Codes
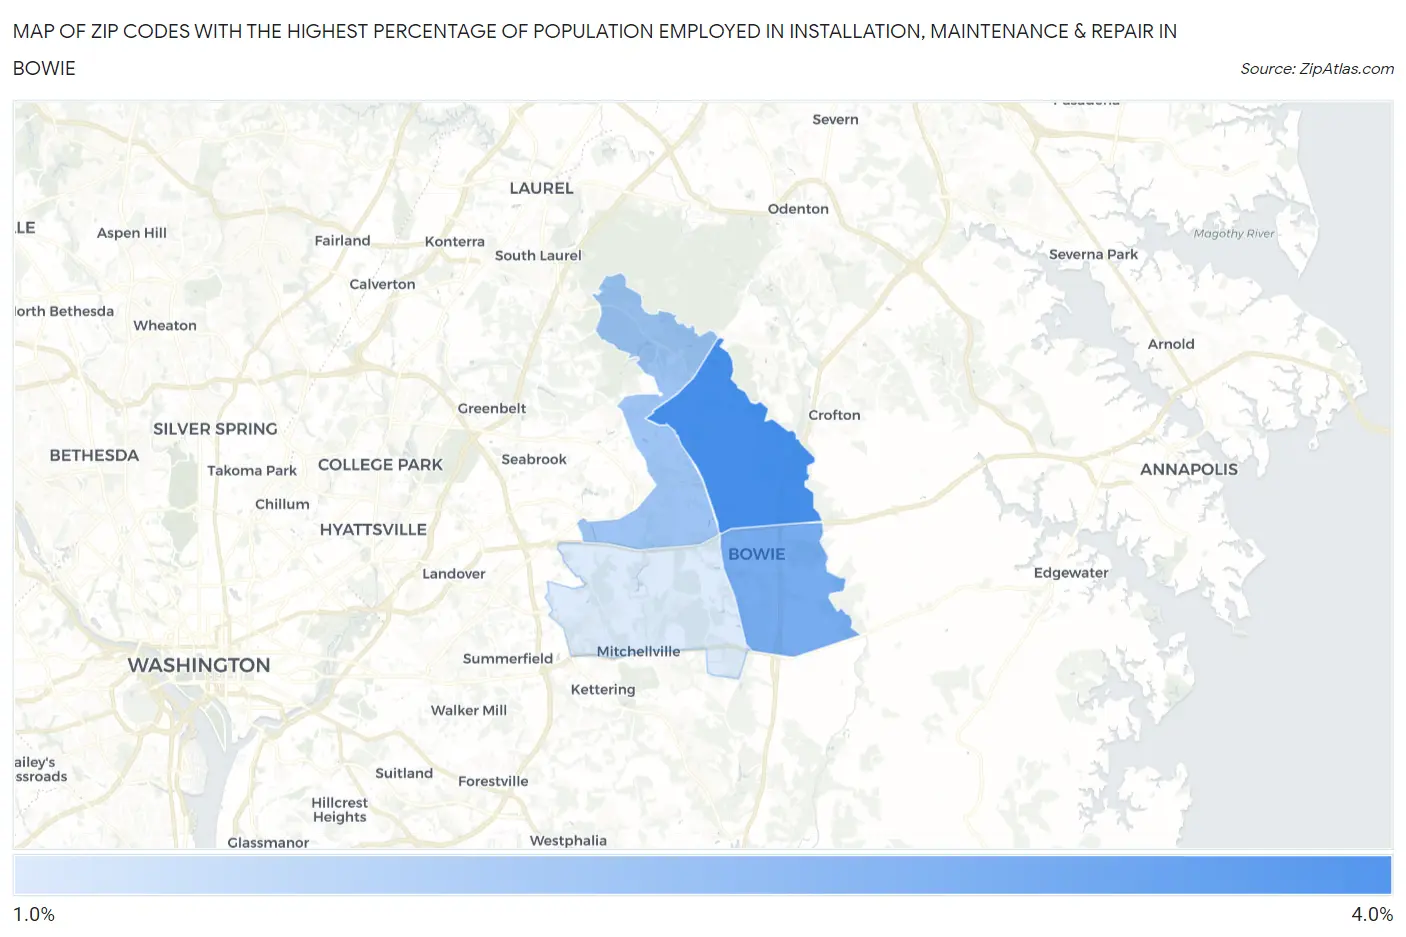
Map of Zip Codes with the Highest Percentage of Population Employed in Installation, Maintenance & Repair in Bowie
1.1%
3.2%
Zip Codes with the Highest Percentage of Population Employed in Installation, Maintenance & Repair in Bowie, MD
| Zip Code | % Employed | vs State | vs National | |
| 1. | 20715 | 3.2% | 2.8%(+0.417)#187 | 3.1%(+0.144)#15,970 |
| 2. | 20716 | 2.5% | 2.8%(-0.271)#240 | 3.1%(-0.543)#19,431 |
| 3. | 20720 | 2.0% | 2.8%(-0.824)#284 | 3.1%(-1.10)#22,149 |
| 4. | 20721 | 1.1% | 2.8%(-1.68)#343 | 3.1%(-1.96)#25,555 |
1
Common Questions
What are the Top 3 Zip Codes with the Highest Percentage of Population Employed in Installation, Maintenance & Repair in Bowie, MD?
Top 3 Zip Codes with the Highest Percentage of Population Employed in Installation, Maintenance & Repair in Bowie, MD are:
What zip code has the Highest Percentage of Population Employed in Installation, Maintenance & Repair in Bowie, MD?
20715 has the Highest Percentage of Population Employed in Installation, Maintenance & Repair in Bowie, MD with 3.2%.
What is the Percentage of Population Employed in Installation, Maintenance & Repair in Bowie, MD?
Percentage of Population Employed in Installation, Maintenance & Repair in Bowie is 2.7%.
What is the Percentage of Population Employed in Installation, Maintenance & Repair in Maryland?
Percentage of Population Employed in Installation, Maintenance & Repair in Maryland is 2.8%.
What is the Percentage of Population Employed in Installation, Maintenance & Repair in the United States?
Percentage of Population Employed in Installation, Maintenance & Repair in the United States is 3.1%.