Zip Codes with the Highest Percentage of Population Employed in Installation, Maintenance & Repair in Bethesda, MD
RELATED REPORTS & OPTIONS
Installation, Maintenance & Repair
Bethesda
Compare Zip Codes
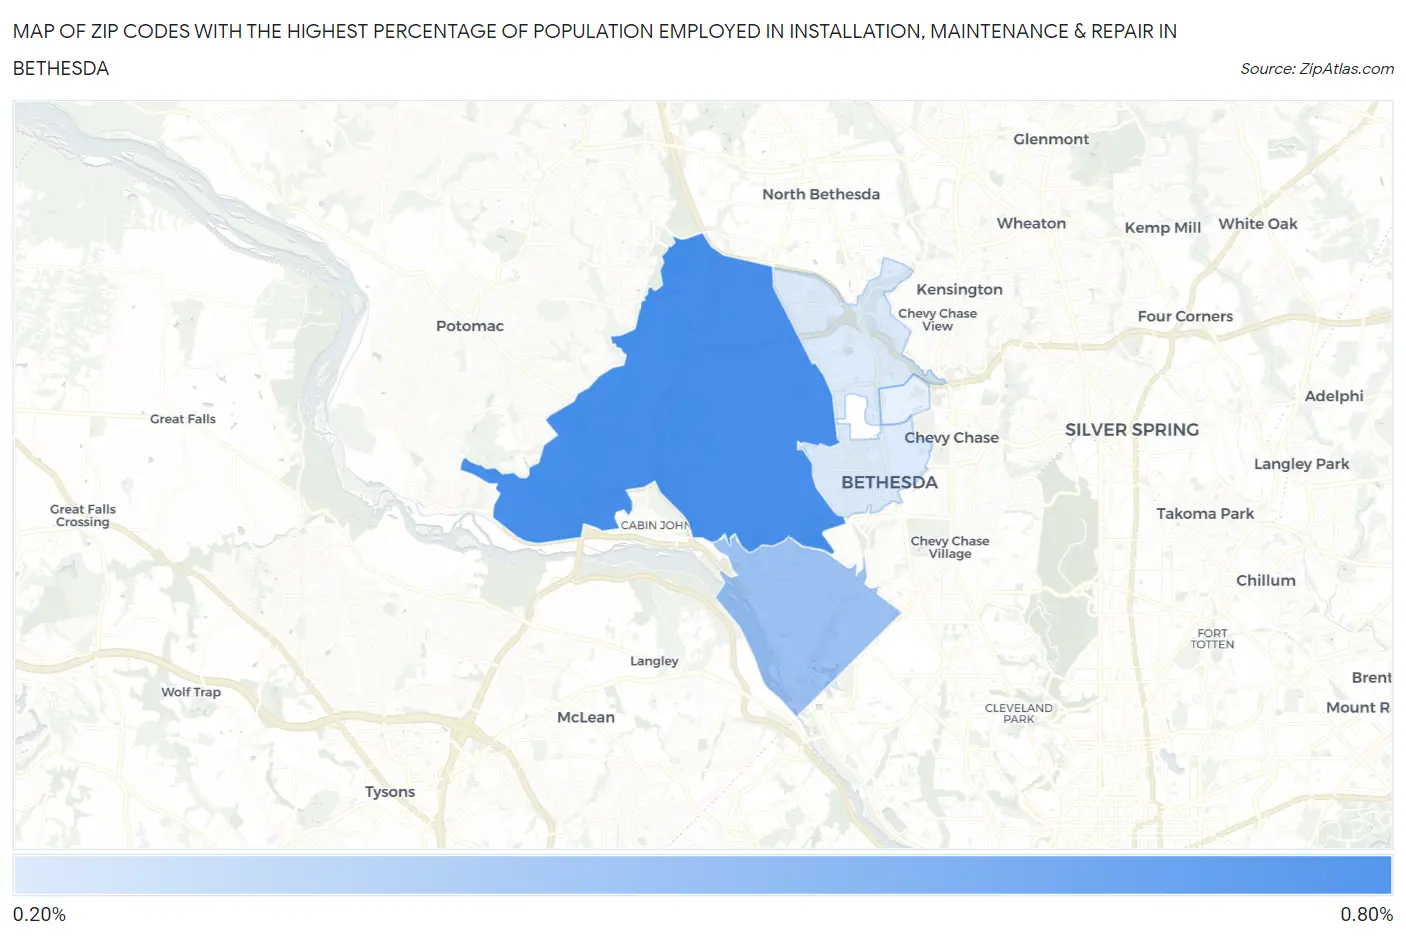
Map of Zip Codes with the Highest Percentage of Population Employed in Installation, Maintenance & Repair in Bethesda
0.25%
0.62%
Zip Codes with the Highest Percentage of Population Employed in Installation, Maintenance & Repair in Bethesda, MD
| Zip Code | % Employed | vs State | vs National | |
| 1. | 20817 | 0.62% | 2.8%(-2.18)#360 | 3.1%(-2.45)#26,975 |
| 2. | 20816 | 0.41% | 2.8%(-2.38)#370 | 3.1%(-2.66)#27,373 |
| 3. | 20814 | 0.25% | 2.8%(-2.55)#377 | 3.1%(-2.82)#27,633 |
1
Common Questions
What are the Top 3 Zip Codes with the Highest Percentage of Population Employed in Installation, Maintenance & Repair in Bethesda, MD?
Top 3 Zip Codes with the Highest Percentage of Population Employed in Installation, Maintenance & Repair in Bethesda, MD are:
What zip code has the Highest Percentage of Population Employed in Installation, Maintenance & Repair in Bethesda, MD?
20817 has the Highest Percentage of Population Employed in Installation, Maintenance & Repair in Bethesda, MD with 0.62%.
What is the Percentage of Population Employed in Installation, Maintenance & Repair in Bethesda, MD?
Percentage of Population Employed in Installation, Maintenance & Repair in Bethesda is 0.17%.
What is the Percentage of Population Employed in Installation, Maintenance & Repair in Maryland?
Percentage of Population Employed in Installation, Maintenance & Repair in Maryland is 2.8%.
What is the Percentage of Population Employed in Installation, Maintenance & Repair in the United States?
Percentage of Population Employed in Installation, Maintenance & Repair in the United States is 3.1%.