Zip Codes with the Highest Percentage of Population Employed in Installation, Maintenance & Repair in Bel Air, MD
RELATED REPORTS & OPTIONS
Installation, Maintenance & Repair
Bel Air
Compare Zip Codes
Map of Zip Codes with the Highest Percentage of Population Employed in Installation, Maintenance & Repair in Bel Air
1.5%
2.9%
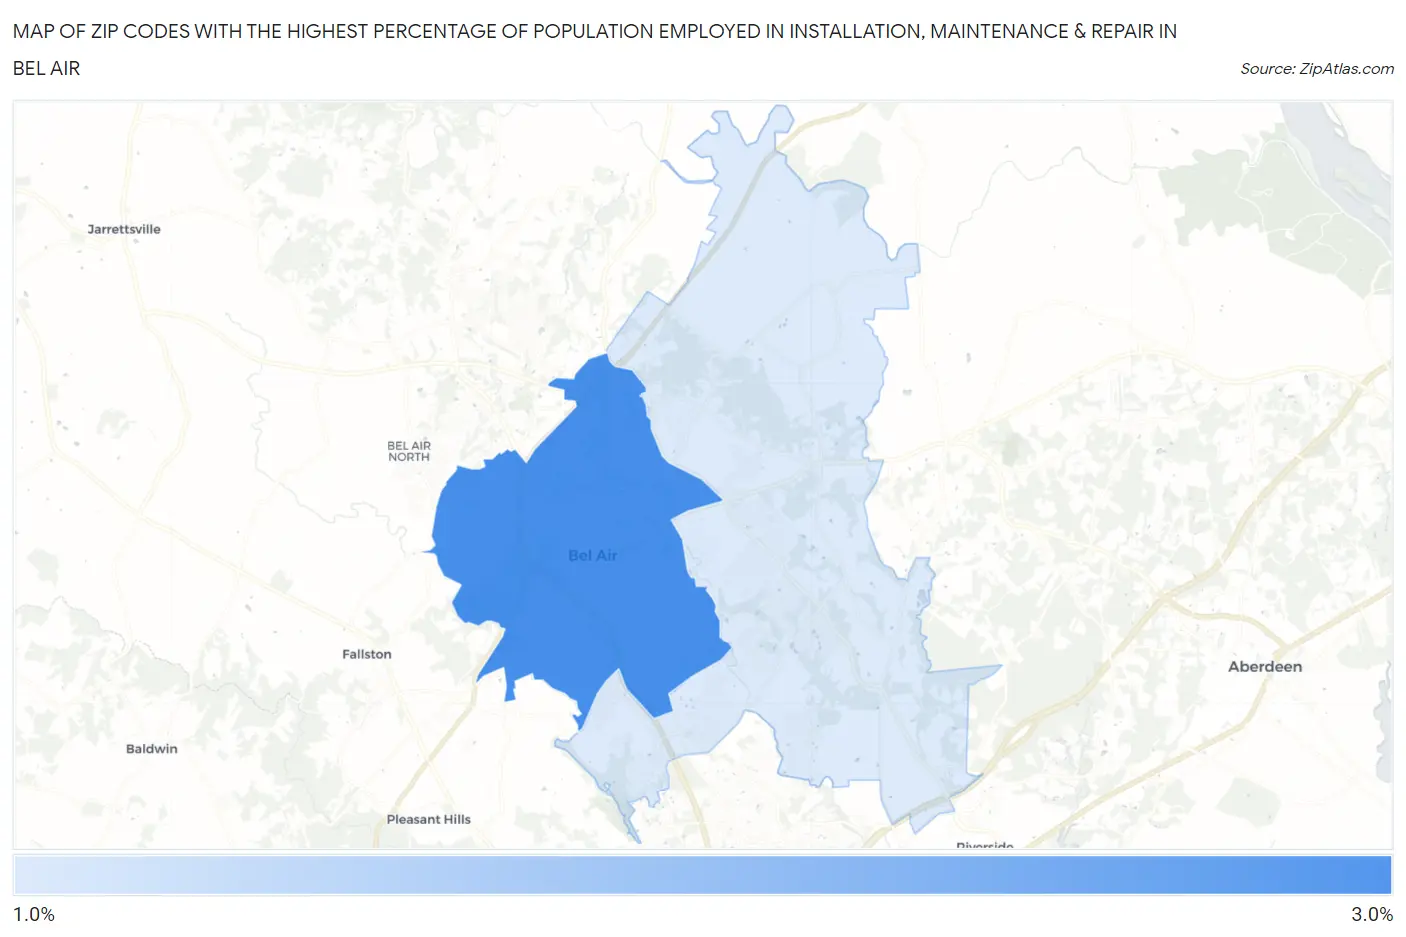
Zip Codes with the Highest Percentage of Population Employed in Installation, Maintenance & Repair in Bel Air, MD
| Zip Code | % Employed | vs State | vs National | |
| 1. | 21014 | 2.9% | 2.8%(+0.106)#210 | 3.1%(-0.166)#17,476 |
| 2. | 21015 | 1.5% | 2.8%(-1.28)#314 | 3.1%(-1.55)#24,105 |
1
Common Questions
What are the Top Zip Codes with the Highest Percentage of Population Employed in Installation, Maintenance & Repair in Bel Air, MD?
Top Zip Codes with the Highest Percentage of Population Employed in Installation, Maintenance & Repair in Bel Air, MD are:
What zip code has the Highest Percentage of Population Employed in Installation, Maintenance & Repair in Bel Air, MD?
21014 has the Highest Percentage of Population Employed in Installation, Maintenance & Repair in Bel Air, MD with 2.9%.
What is the Percentage of Population Employed in Installation, Maintenance & Repair in Bel Air, MD?
Percentage of Population Employed in Installation, Maintenance & Repair in Bel Air is 2.7%.
What is the Percentage of Population Employed in Installation, Maintenance & Repair in Maryland?
Percentage of Population Employed in Installation, Maintenance & Repair in Maryland is 2.8%.
What is the Percentage of Population Employed in Installation, Maintenance & Repair in the United States?
Percentage of Population Employed in Installation, Maintenance & Repair in the United States is 3.1%.