Ferndale, MD Map & Demographics
Ferndale Map
Ferndale Overview
$36,003
PER CAPITA INCOME
$98,750
AVG FAMILY INCOME
$82,347
AVG HOUSEHOLD INCOME
22.5%
WAGE / INCOME GAP [ % ]
77.5¢/ $1
WAGE / INCOME GAP [ $ ]
$13,235
FAMILY INCOME DEFICIT
0.38
INEQUALITY / GINI INDEX
16,669
TOTAL POPULATION
8,185
MALE POPULATION
8,484
FEMALE POPULATION
96.48
MALES / 100 FEMALES
103.65
FEMALES / 100 MALES
35.8
MEDIAN AGE
3.1
AVG FAMILY SIZE
2.6
AVG HOUSEHOLD SIZE
9,176
LABOR FORCE [ PEOPLE ]
70.1%
PERCENT IN LABOR FORCE
6.2%
UNEMPLOYMENT RATE
Income in Ferndale
Income Overview in Ferndale
Per Capita Income in Ferndale is $36,003, while median incomes of families and households are $98,750 and $82,347 respectively.
| Characteristic | Number | Measure |
| Per Capita Income | 16,669 | $36,003 |
| Median Family Income | 4,213 | $98,750 |
| Mean Family Income | 4,213 | $105,348 |
| Median Household Income | 6,483 | $82,347 |
| Mean Household Income | 6,483 | $90,181 |
| Income Deficit | 4,213 | $13,235 |
| Wage / Income Gap (%) | 16,669 | 22.55% |
| Wage / Income Gap ($) | 16,669 | 77.45¢ per $1 |
| Gini / Inequality Index | 16,669 | 0.38 |
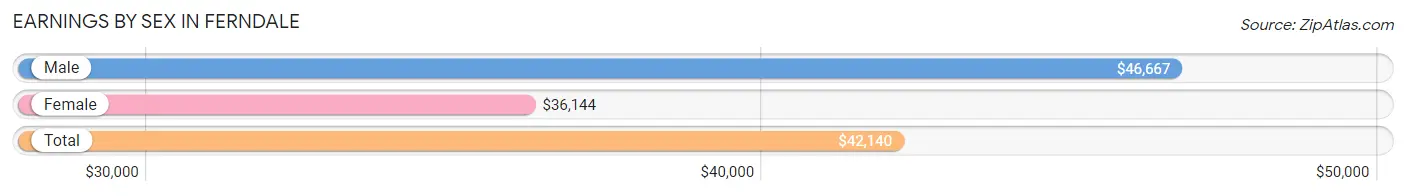
Earnings by Sex in Ferndale
Average Earnings in Ferndale are $42,140, $46,667 for men and $36,144 for women, a difference of 22.6%.
| Sex | Number | Average Earnings |
| Male | 4,748 (51.9%) | $46,667 |
| Female | 4,397 (48.1%) | $36,144 |
| Total | 9,145 (100.0%) | $42,140 |
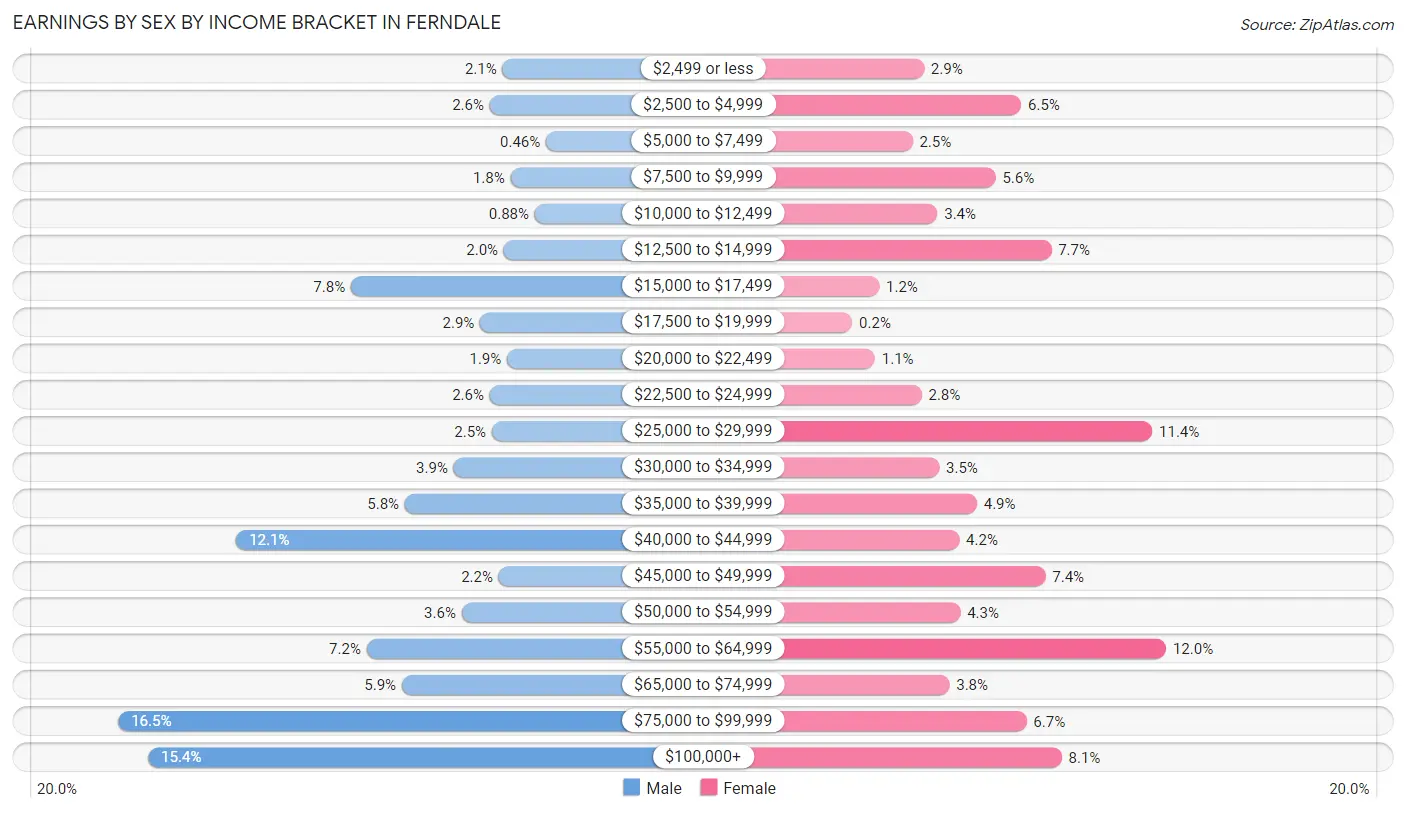
Earnings by Sex by Income Bracket in Ferndale
The most common earnings brackets in Ferndale are $75,000 to $99,999 for men (783 | 16.5%) and $55,000 to $64,999 for women (526 | 12.0%).
| Income | Male | Female |
| $2,499 or less | 99 (2.1%) | 127 (2.9%) |
| $2,500 to $4,999 | 122 (2.6%) | 287 (6.5%) |
| $5,000 to $7,499 | 22 (0.5%) | 108 (2.5%) |
| $7,500 to $9,999 | 85 (1.8%) | 245 (5.6%) |
| $10,000 to $12,499 | 42 (0.9%) | 149 (3.4%) |
| $12,500 to $14,999 | 97 (2.0%) | 337 (7.7%) |
| $15,000 to $17,499 | 369 (7.8%) | 53 (1.2%) |
| $17,500 to $19,999 | 139 (2.9%) | 9 (0.2%) |
| $20,000 to $22,499 | 91 (1.9%) | 46 (1.1%) |
| $22,500 to $24,999 | 122 (2.6%) | 123 (2.8%) |
| $25,000 to $29,999 | 118 (2.5%) | 503 (11.4%) |
| $30,000 to $34,999 | 186 (3.9%) | 152 (3.5%) |
| $35,000 to $39,999 | 273 (5.8%) | 214 (4.9%) |
| $40,000 to $44,999 | 573 (12.1%) | 185 (4.2%) |
| $45,000 to $49,999 | 106 (2.2%) | 327 (7.4%) |
| $50,000 to $54,999 | 172 (3.6%) | 187 (4.3%) |
| $55,000 to $64,999 | 341 (7.2%) | 526 (12.0%) |
| $65,000 to $74,999 | 278 (5.9%) | 169 (3.8%) |
| $75,000 to $99,999 | 783 (16.5%) | 296 (6.7%) |
| $100,000+ | 730 (15.4%) | 354 (8.1%) |
| Total | 4,748 (100.0%) | 4,397 (100.0%) |
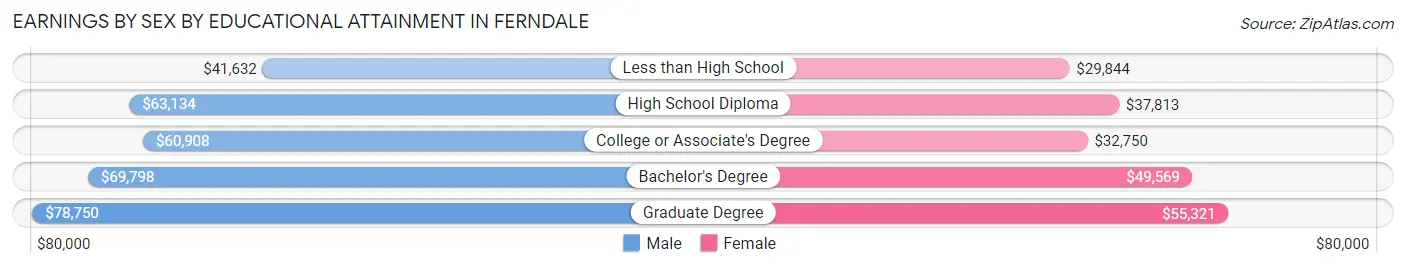
Earnings by Sex by Educational Attainment in Ferndale
Average earnings in Ferndale are $60,619 for men and $40,988 for women, a difference of 32.4%. Men with an educational attainment of graduate degree enjoy the highest average annual earnings of $78,750, while those with less than high school education earn the least with $41,632. Women with an educational attainment of graduate degree earn the most with the average annual earnings of $55,321, while those with less than high school education have the smallest earnings of $29,844.
| Educational Attainment | Male Income | Female Income |
| Less than High School | $41,632 | $29,844 |
| High School Diploma | $63,134 | $37,813 |
| College or Associate's Degree | $60,908 | $32,750 |
| Bachelor's Degree | $69,798 | $49,569 |
| Graduate Degree | $78,750 | $55,321 |
| Total | $60,619 | $40,988 |
Family Income in Ferndale
Family Income Brackets in Ferndale
According to the Ferndale family income data, there are 1,319 families falling into the $100,000 to $149,999 income range, which is the most common income bracket and makes up 31.3% of all families. Conversely, the $15,000 to $24,999 income bracket is the least frequent group with only 38 families (0.9%) belonging to this category.
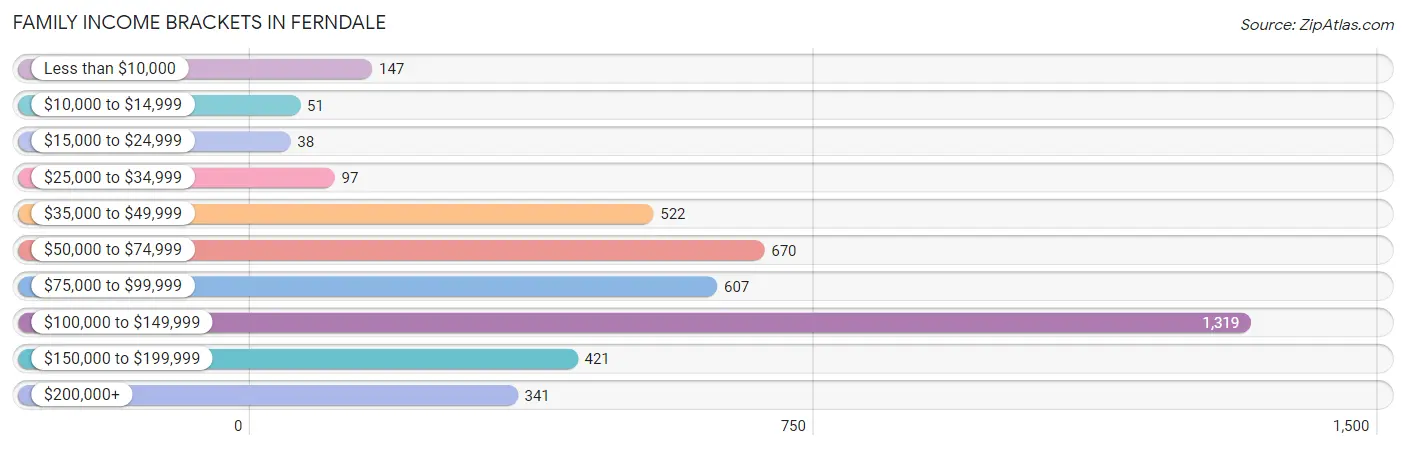
| Income Bracket | # Families | % Families |
| Less than $10,000 | 147 | 3.5% |
| $10,000 to $14,999 | 51 | 1.2% |
| $15,000 to $24,999 | 38 | 0.9% |
| $25,000 to $34,999 | 97 | 2.3% |
| $35,000 to $49,999 | 522 | 12.4% |
| $50,000 to $74,999 | 670 | 15.9% |
| $75,000 to $99,999 | 607 | 14.4% |
| $100,000 to $149,999 | 1,319 | 31.3% |
| $150,000 to $199,999 | 421 | 10.0% |
| $200,000+ | 341 | 8.1% |
Family Income by Famaliy Size in Ferndale
5-person families (253 | 6.0%) account for the highest median family income in Ferndale with $158,033 per family, while 2-person families (1,983 | 47.1%) have the highest median income of $40,116 per family member.
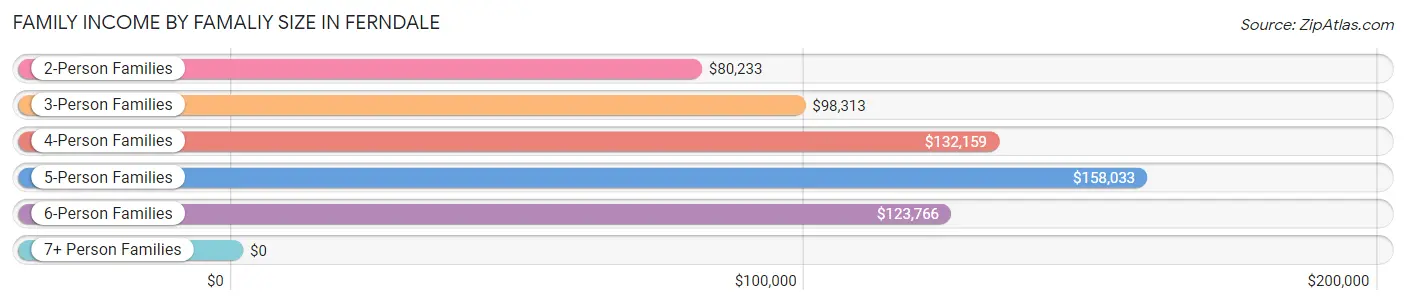
| Income Bracket | # Families | Median Income |
| 2-Person Families | 1,983 (47.1%) | $80,233 |
| 3-Person Families | 1,161 (27.6%) | $98,313 |
| 4-Person Families | 521 (12.4%) | $132,159 |
| 5-Person Families | 253 (6.0%) | $158,033 |
| 6-Person Families | 229 (5.4%) | $123,766 |
| 7+ Person Families | 66 (1.6%) | $0 |
| Total | 4,213 (100.0%) | $98,750 |
Family Income by Number of Earners in Ferndale
The median family income in Ferndale is $98,750, with families comprising 3+ earners (476) having the highest median family income of $158,125, while families with no earners (696) have the lowest median family income of $62,872, accounting for 11.3% and 16.5% of families, respectively.
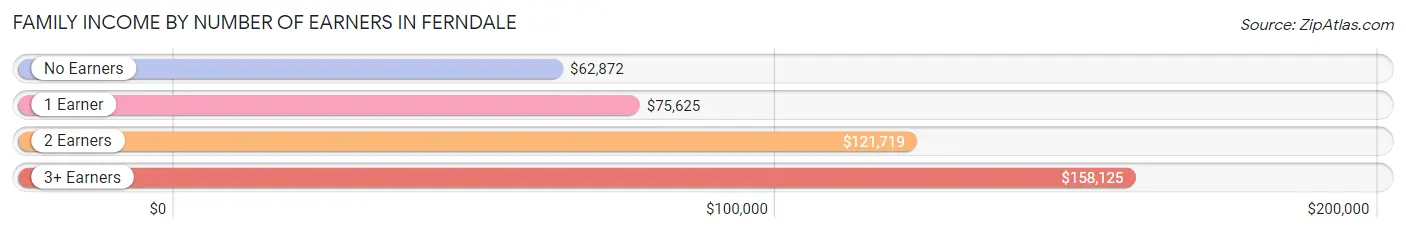
| Number of Earners | # Families | Median Income |
| No Earners | 696 (16.5%) | $62,872 |
| 1 Earner | 1,098 (26.1%) | $75,625 |
| 2 Earners | 1,943 (46.1%) | $121,719 |
| 3+ Earners | 476 (11.3%) | $158,125 |
| Total | 4,213 (100.0%) | $98,750 |
Household Income in Ferndale
Household Income Brackets in Ferndale
With 1,601 households falling in the category, the $100,000 to $149,999 income range is the most frequent in Ferndale, accounting for 24.7% of all households. In contrast, only 110 households (1.7%) fall into the $10,000 to $14,999 income bracket, making it the least populous group.
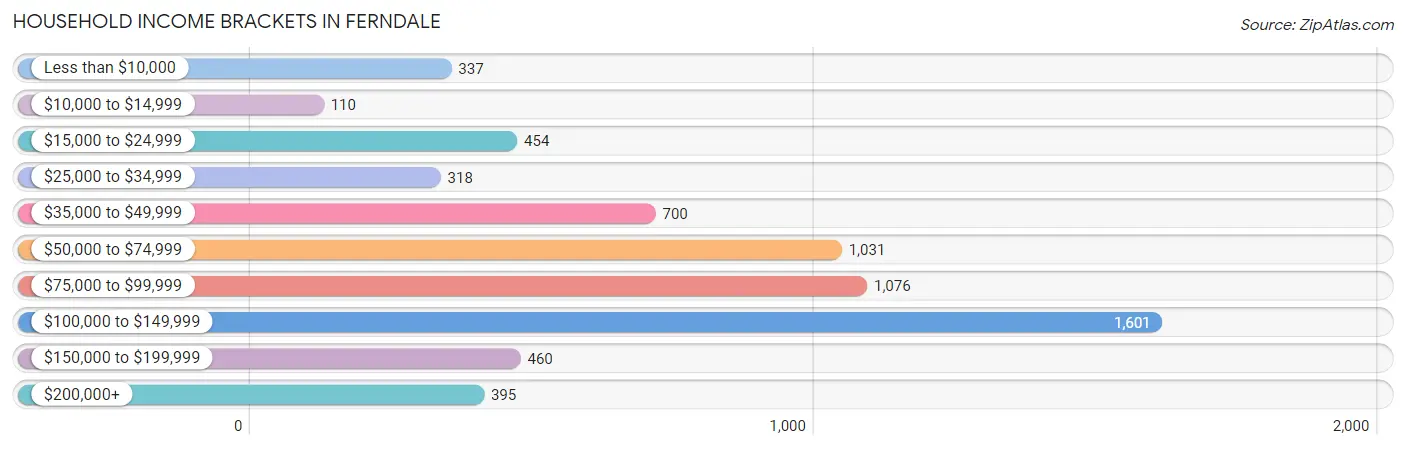
| Income Bracket | # Households | % Households |
| Less than $10,000 | 337 | 5.2% |
| $10,000 to $14,999 | 110 | 1.7% |
| $15,000 to $24,999 | 454 | 7.0% |
| $25,000 to $34,999 | 318 | 4.9% |
| $35,000 to $49,999 | 700 | 10.8% |
| $50,000 to $74,999 | 1,031 | 15.9% |
| $75,000 to $99,999 | 1,076 | 16.6% |
| $100,000 to $149,999 | 1,601 | 24.7% |
| $150,000 to $199,999 | 460 | 7.1% |
| $200,000+ | 395 | 6.1% |
Household Income by Householder Age in Ferndale
The median household income in Ferndale is $82,347, with the highest median household income of $103,329 found in the 45 to 64 years age bracket for the primary householder. A total of 2,019 households (31.1%) fall into this category. Meanwhile, the 15 to 24 years age bracket for the primary householder has the lowest median household income of $0, with 101 households (1.6%) in this group.
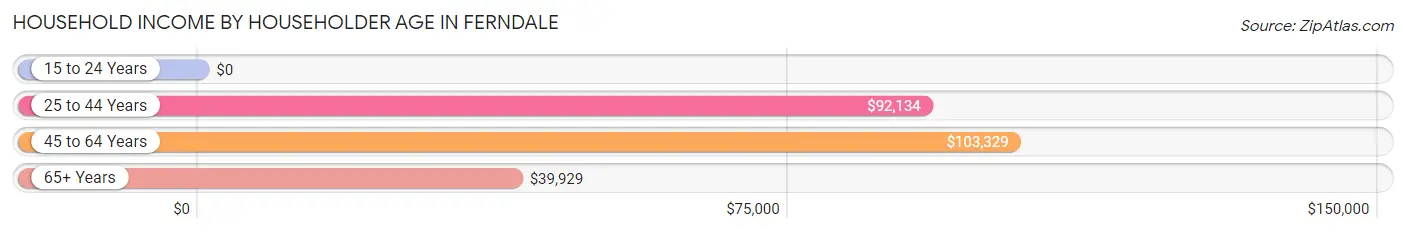
| Income Bracket | # Households | Median Income |
| 15 to 24 Years | 101 (1.6%) | $0 |
| 25 to 44 Years | 2,614 (40.3%) | $92,134 |
| 45 to 64 Years | 2,019 (31.1%) | $103,329 |
| 65+ Years | 1,749 (27.0%) | $39,929 |
| Total | 6,483 (100.0%) | $82,347 |
Poverty in Ferndale
Income Below Poverty by Sex and Age in Ferndale
With 2.4% poverty level for males and 8.6% for females among the residents of Ferndale, 15 year old males and 16 and 17 year old females are the most vulnerable to poverty, with 79 males (82.3%) and 41 females (25.8%) in their respective age groups living below the poverty level.
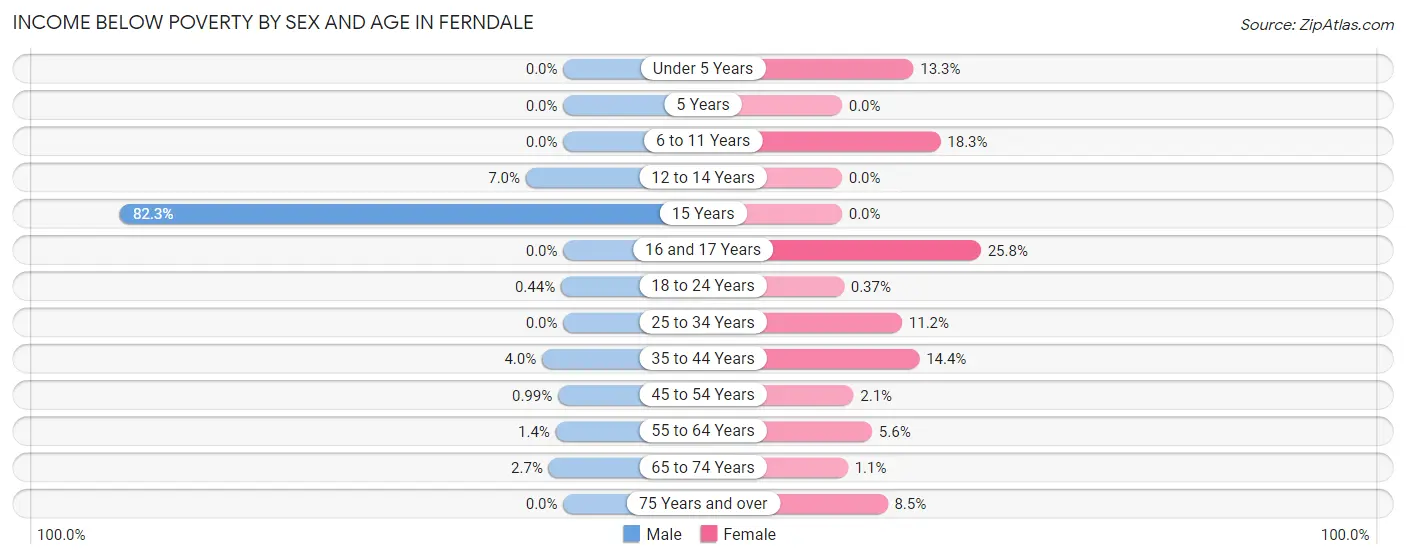
| Age Bracket | Male | Female |
| Under 5 Years | 0 (0.0%) | 118 (13.3%) |
| 5 Years | 0 (0.0%) | 0 (0.0%) |
| 6 to 11 Years | 0 (0.0%) | 82 (18.3%) |
| 12 to 14 Years | 22 (7.0%) | 0 (0.0%) |
| 15 Years | 79 (82.3%) | 0 (0.0%) |
| 16 and 17 Years | 0 (0.0%) | 41 (25.8%) |
| 18 to 24 Years | 4 (0.4%) | 2 (0.4%) |
| 25 to 34 Years | 0 (0.0%) | 184 (11.2%) |
| 35 to 44 Years | 49 (4.0%) | 162 (14.4%) |
| 45 to 54 Years | 9 (1.0%) | 18 (2.1%) |
| 55 to 64 Years | 12 (1.4%) | 48 (5.6%) |
| 65 to 74 Years | 18 (2.7%) | 8 (1.1%) |
| 75 Years and over | 0 (0.0%) | 66 (8.5%) |
| Total | 193 (2.4%) | 729 (8.6%) |
Income Above Poverty by Sex and Age in Ferndale
According to the poverty statistics in Ferndale, males aged under 5 years and females aged 5 years are the age groups that are most secure financially, with 100.0% of males and 100.0% of females in these age groups living above the poverty line.
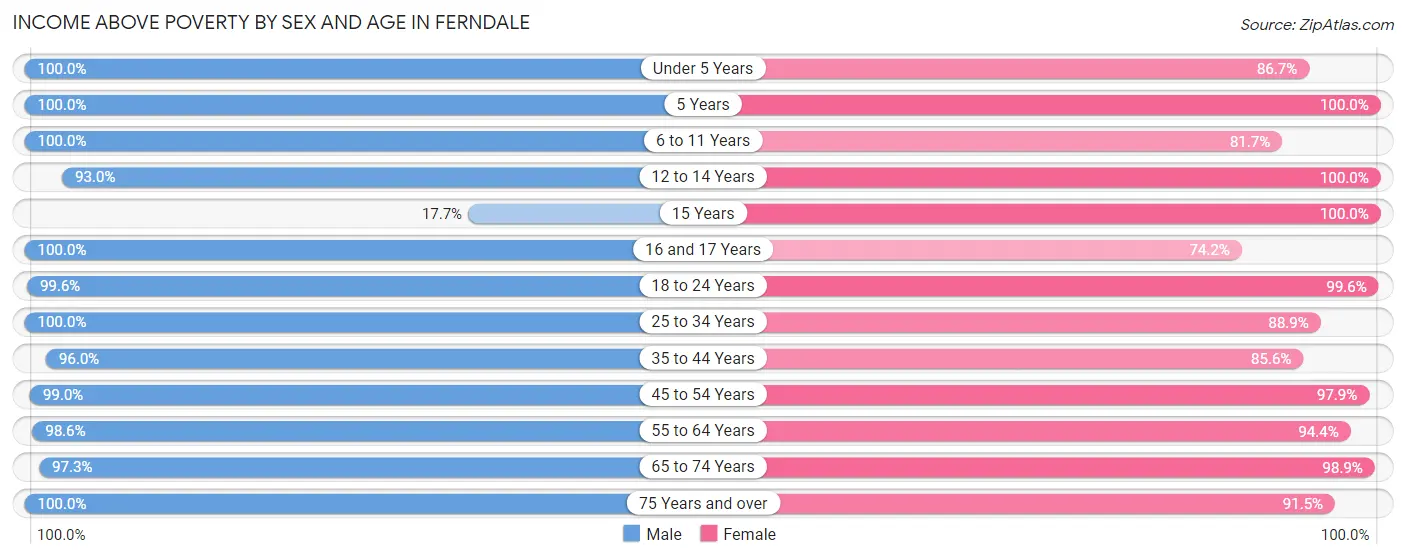
| Age Bracket | Male | Female |
| Under 5 Years | 438 (100.0%) | 771 (86.7%) |
| 5 Years | 97 (100.0%) | 214 (100.0%) |
| 6 to 11 Years | 808 (100.0%) | 366 (81.7%) |
| 12 to 14 Years | 294 (93.0%) | 173 (100.0%) |
| 15 Years | 17 (17.7%) | 55 (100.0%) |
| 16 and 17 Years | 122 (100.0%) | 118 (74.2%) |
| 18 to 24 Years | 910 (99.6%) | 542 (99.6%) |
| 25 to 34 Years | 1,120 (100.0%) | 1,466 (88.8%) |
| 35 to 44 Years | 1,189 (96.0%) | 965 (85.6%) |
| 45 to 54 Years | 896 (99.0%) | 823 (97.9%) |
| 55 to 64 Years | 826 (98.6%) | 811 (94.4%) |
| 65 to 74 Years | 647 (97.3%) | 720 (98.9%) |
| 75 Years and over | 583 (100.0%) | 712 (91.5%) |
| Total | 7,947 (97.6%) | 7,736 (91.4%) |
Income Below Poverty Among Married-Couple Families in Ferndale
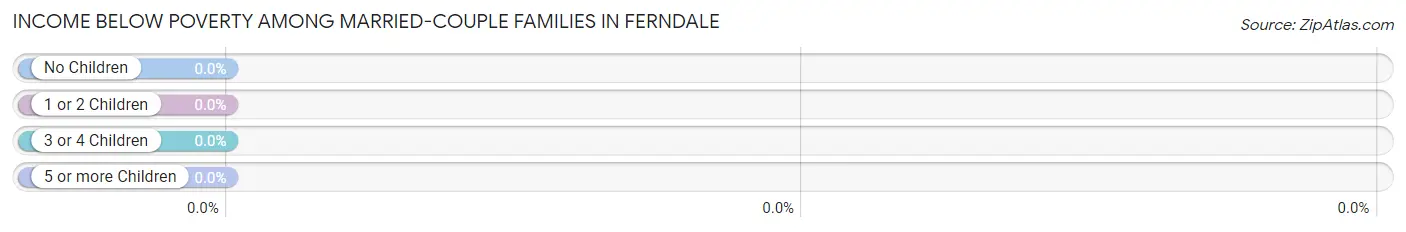
| Children | Above Poverty | Below Poverty |
| No Children | 1,792 (100.0%) | 0 (0.0%) |
| 1 or 2 Children | 904 (100.0%) | 0 (0.0%) |
| 3 or 4 Children | 287 (100.0%) | 0 (0.0%) |
| 5 or more Children | 0 (0.0%) | 0 (0.0%) |
| Total | 2,983 (100.0%) | 0 (0.0%) |
Income Below Poverty Among Single-Parent Households in Ferndale
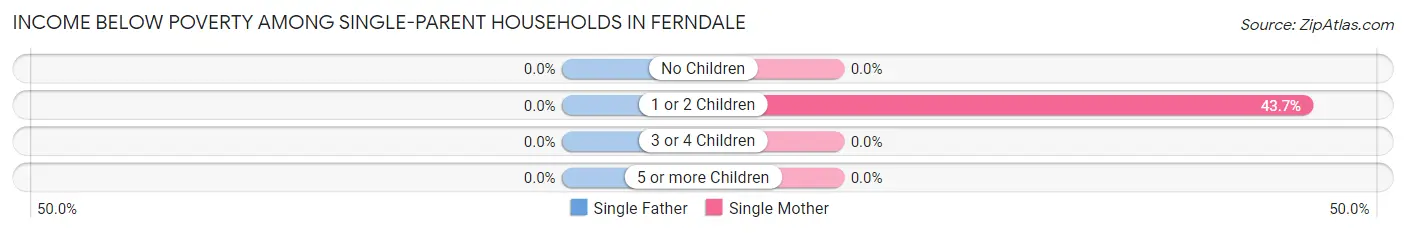
| Children | Single Father | Single Mother |
| No Children | 0 (0.0%) | 0 (0.0%) |
| 1 or 2 Children | 0 (0.0%) | 201 (43.7%) |
| 3 or 4 Children | 0 (0.0%) | 0 (0.0%) |
| 5 or more Children | 0 (0.0%) | 0 (0.0%) |
| Total | 0 (0.0%) | 201 (23.3%) |
Income Below Poverty Among Married-Couple vs Single-Parent Households in Ferndale
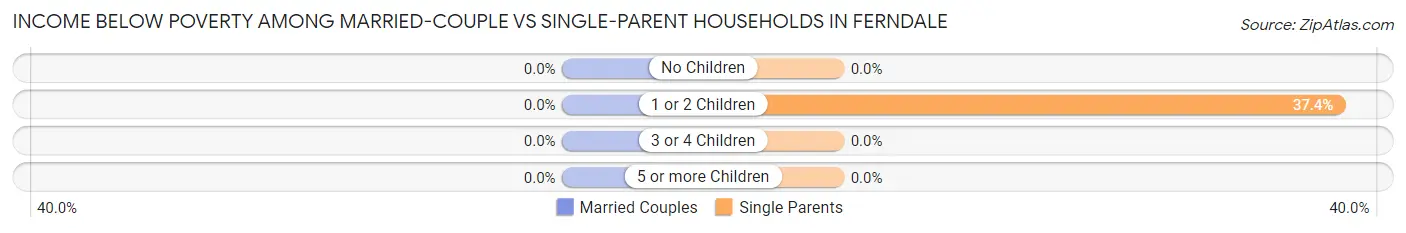
| Children | Married-Couple Families | Single-Parent Households |
| No Children | 0 (0.0%) | 0 (0.0%) |
| 1 or 2 Children | 0 (0.0%) | 201 (37.4%) |
| 3 or 4 Children | 0 (0.0%) | 0 (0.0%) |
| 5 or more Children | 0 (0.0%) | 0 (0.0%) |
| Total | 0 (0.0%) | 201 (16.3%) |
Race in Ferndale
The most populous races in Ferndale are White / Caucasian (9,988 | 59.9%), Black / African American (3,936 | 23.6%), and Two or more Races (1,686 | 10.1%).
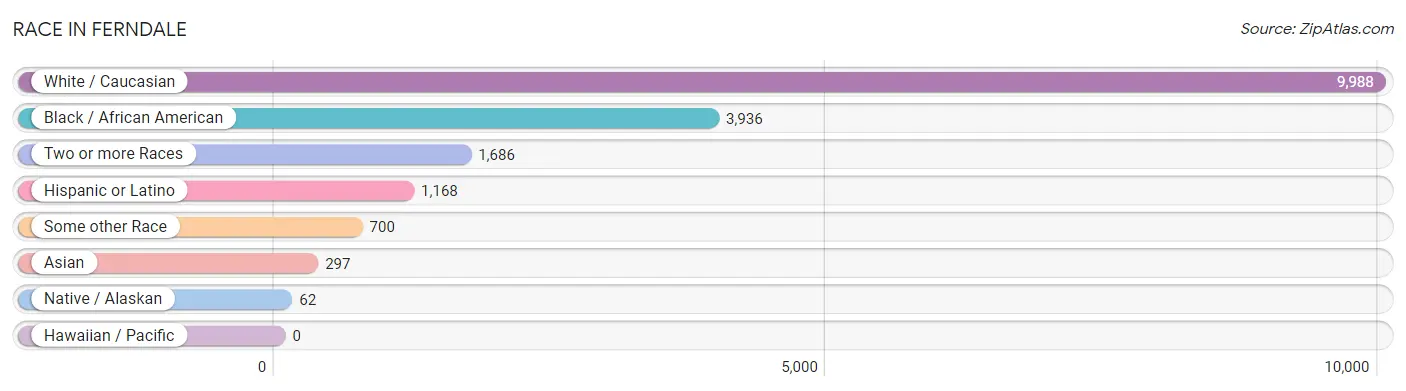
| Race | # Population | % Population |
| Asian | 297 | 1.8% |
| Black / African American | 3,936 | 23.6% |
| Hawaiian / Pacific | 0 | 0.0% |
| Hispanic or Latino | 1,168 | 7.0% |
| Native / Alaskan | 62 | 0.4% |
| White / Caucasian | 9,988 | 59.9% |
| Two or more Races | 1,686 | 10.1% |
| Some other Race | 700 | 4.2% |
| Total | 16,669 | 100.0% |
Ancestry in Ferndale
The most populous ancestries reported in Ferndale are German (2,815 | 16.9%), Irish (2,523 | 15.1%), English (1,695 | 10.2%), Subsaharan African (684 | 4.1%), and Italian (679 | 4.1%), together accounting for 50.4% of all Ferndale residents.
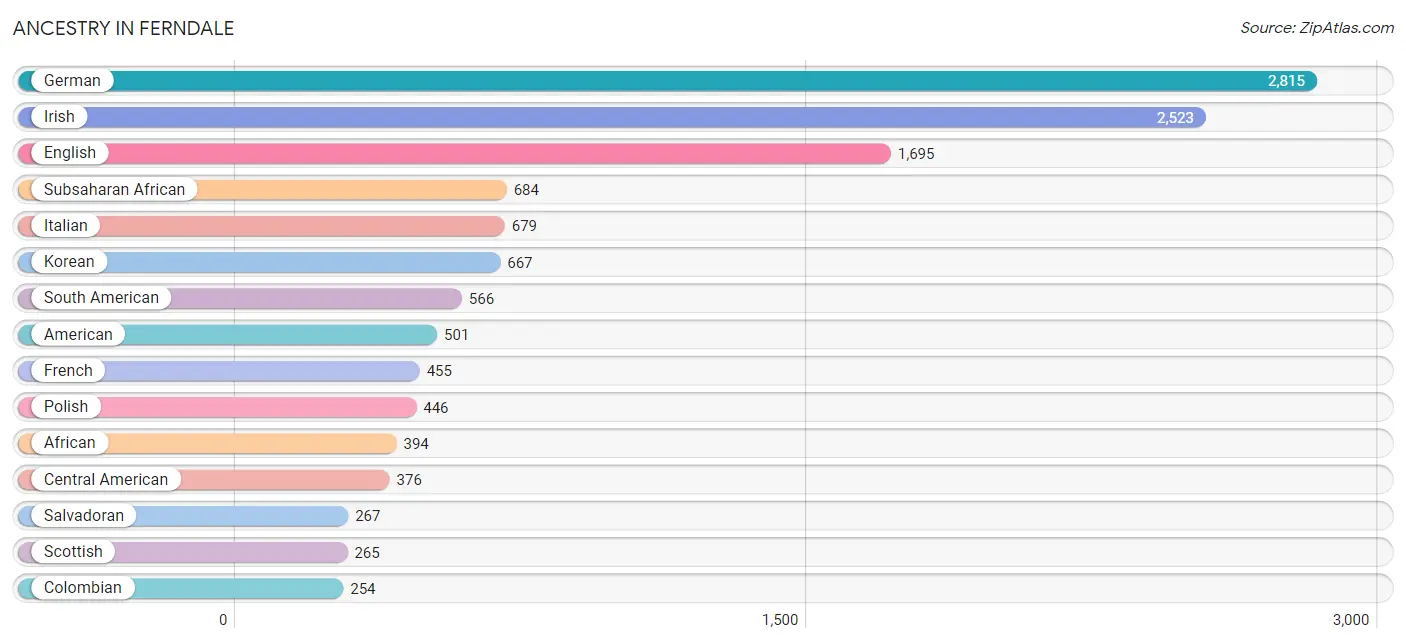
| Ancestry | # Population | % Population |
| African | 394 | 2.4% |
| American | 501 | 3.0% |
| Apache | 51 | 0.3% |
| Arab | 52 | 0.3% |
| Argentinean | 215 | 1.3% |
| Austrian | 6 | 0.0% |
| Blackfeet | 58 | 0.4% |
| British | 37 | 0.2% |
| Burmese | 36 | 0.2% |
| Canadian | 13 | 0.1% |
| Central American | 376 | 2.3% |
| Cherokee | 126 | 0.8% |
| Chippewa | 14 | 0.1% |
| Colombian | 254 | 1.5% |
| Czech | 10 | 0.1% |
| Danish | 27 | 0.2% |
| Dutch | 62 | 0.4% |
| Eastern European | 103 | 0.6% |
| English | 1,695 | 10.2% |
| European | 58 | 0.4% |
| French | 455 | 2.7% |
| French Canadian | 47 | 0.3% |
| German | 2,815 | 16.9% |
| Greek | 68 | 0.4% |
| Honduran | 24 | 0.1% |
| Hungarian | 28 | 0.2% |
| Indian (Asian) | 13 | 0.1% |
| Irish | 2,523 | 15.1% |
| Iroquois | 20 | 0.1% |
| Italian | 679 | 4.1% |
| Jordanian | 29 | 0.2% |
| Kenyan | 49 | 0.3% |
| Korean | 667 | 4.0% |
| Liberian | 34 | 0.2% |
| Lithuanian | 150 | 0.9% |
| Mexican | 27 | 0.2% |
| Moroccan | 23 | 0.1% |
| Nicaraguan | 38 | 0.2% |
| Nigerian | 184 | 1.1% |
| Norwegian | 234 | 1.4% |
| Panamanian | 47 | 0.3% |
| Peruvian | 97 | 0.6% |
| Polish | 446 | 2.7% |
| Puerto Rican | 77 | 0.5% |
| Russian | 116 | 0.7% |
| Salvadoran | 267 | 1.6% |
| Scandinavian | 106 | 0.6% |
| Scotch-Irish | 49 | 0.3% |
| Scottish | 265 | 1.6% |
| Senegalese | 23 | 0.1% |
| South American | 566 | 3.4% |
| Spanish | 20 | 0.1% |
| Sri Lankan | 35 | 0.2% |
| Subsaharan African | 684 | 4.1% |
| Swedish | 88 | 0.5% |
| Swiss | 11 | 0.1% |
| Trinidadian and Tobagonian | 5 | 0.0% |
| Welsh | 32 | 0.2% | View All 58 Rows |
Immigrants in Ferndale
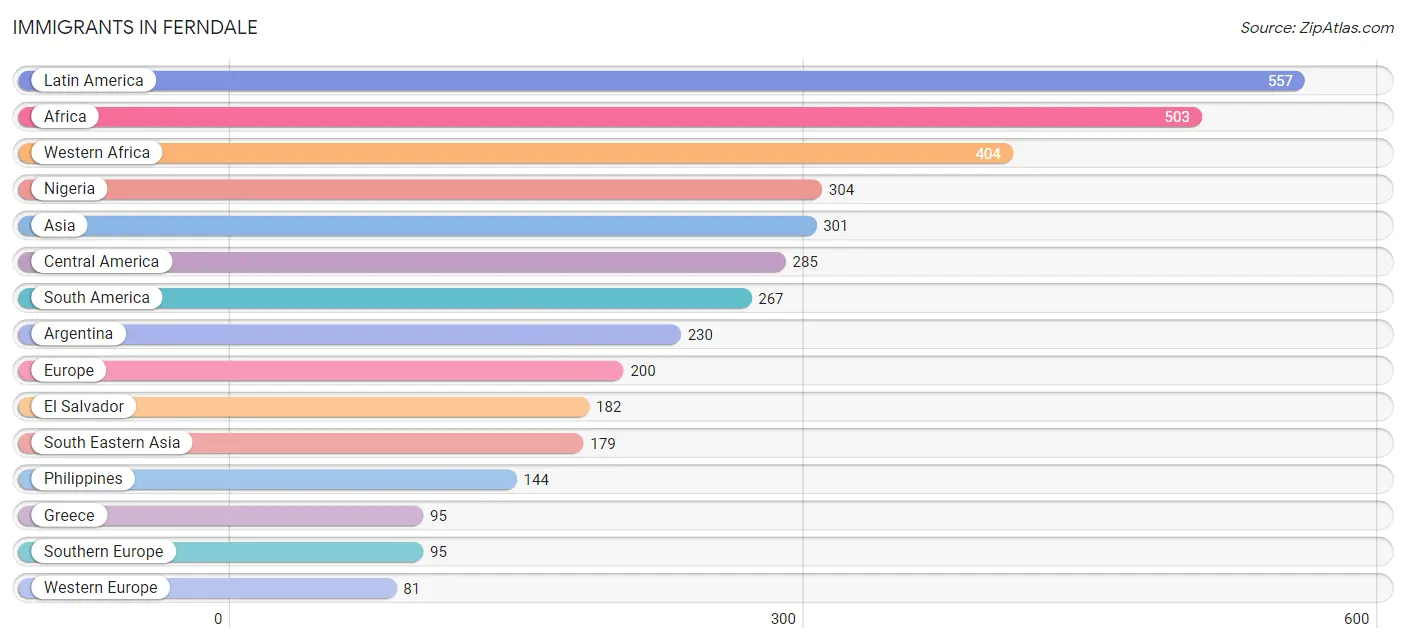
The most numerous immigrant groups reported in Ferndale came from Latin America (557 | 3.3%), Africa (503 | 3.0%), Western Africa (404 | 2.4%), Nigeria (304 | 1.8%), and Asia (301 | 1.8%), together accounting for 12.4% of all Ferndale residents.
| Immigration Origin | # Population | % Population |
| Africa | 503 | 3.0% |
| Argentina | 230 | 1.4% |
| Asia | 301 | 1.8% |
| Canada | 28 | 0.2% |
| Caribbean | 5 | 0.0% |
| Central America | 285 | 1.7% |
| China | 6 | 0.0% |
| Colombia | 8 | 0.1% |
| Eastern Africa | 76 | 0.5% |
| Eastern Asia | 31 | 0.2% |
| Eastern Europe | 8 | 0.1% |
| Ecuador | 29 | 0.2% |
| El Salvador | 182 | 1.1% |
| Europe | 200 | 1.2% |
| France | 17 | 0.1% |
| Germany | 64 | 0.4% |
| Ghana | 55 | 0.3% |
| Greece | 95 | 0.6% |
| Honduras | 15 | 0.1% |
| Jordan | 45 | 0.3% |
| Kenya | 76 | 0.5% |
| Korea | 25 | 0.2% |
| Kuwait | 9 | 0.1% |
| Latin America | 557 | 3.3% |
| Liberia | 22 | 0.1% |
| Mexico | 27 | 0.2% |
| Morocco | 23 | 0.1% |
| Nepal | 37 | 0.2% |
| Nicaragua | 14 | 0.1% |
| Nigeria | 304 | 1.8% |
| Northern Africa | 23 | 0.1% |
| Northern Europe | 16 | 0.1% |
| Panama | 47 | 0.3% |
| Philippines | 144 | 0.9% |
| Romania | 8 | 0.1% |
| Senegal | 23 | 0.1% |
| South America | 267 | 1.6% |
| South Central Asia | 37 | 0.2% |
| South Eastern Asia | 179 | 1.1% |
| Southern Europe | 95 | 0.6% |
| Trinidad and Tobago | 5 | 0.0% |
| Vietnam | 35 | 0.2% |
| Western Africa | 404 | 2.4% |
| Western Asia | 54 | 0.3% |
| Western Europe | 81 | 0.5% | View All 45 Rows |
Sex and Age in Ferndale
Sex and Age in Ferndale
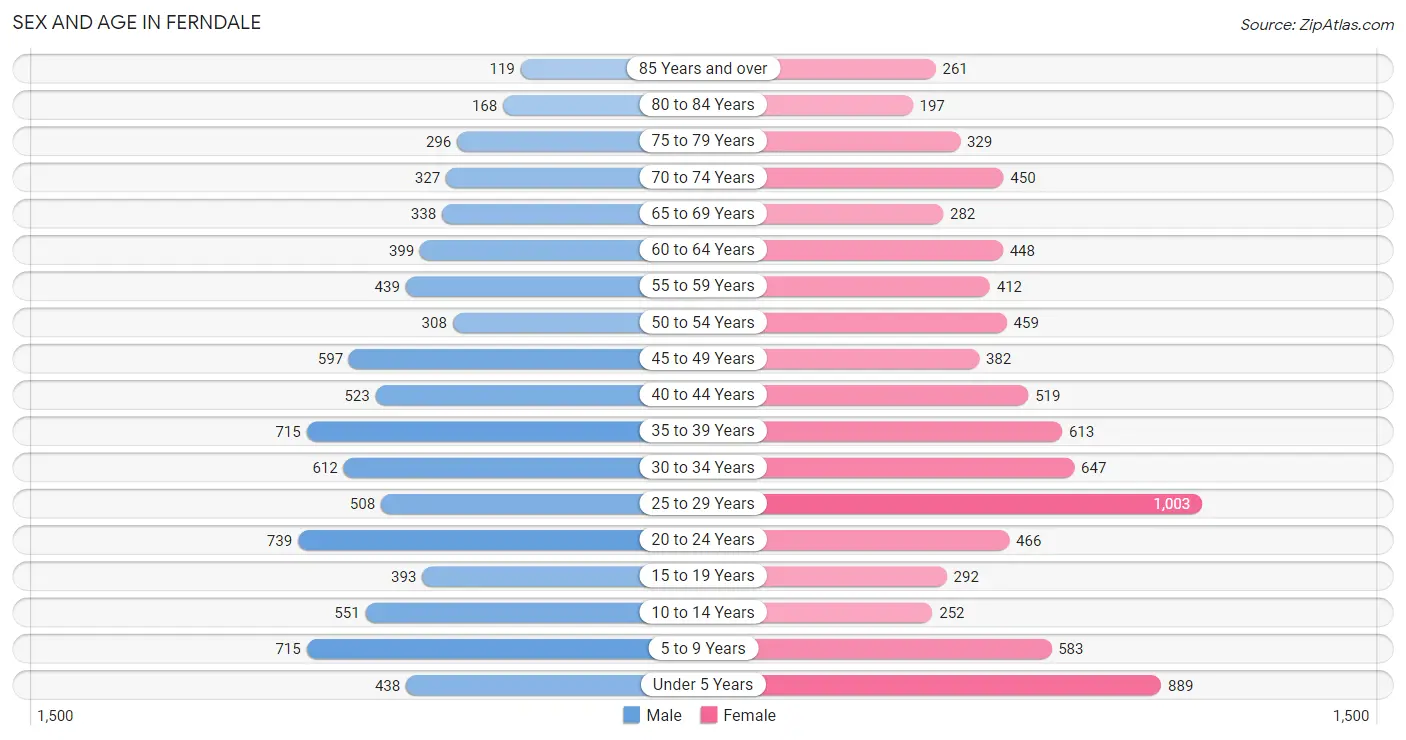
The most populous age groups in Ferndale are 20 to 24 Years (739 | 9.0%) for men and 25 to 29 Years (1,003 | 11.8%) for women.
| Age Bracket | Male | Female |
| Under 5 Years | 438 (5.3%) | 889 (10.5%) |
| 5 to 9 Years | 715 (8.7%) | 583 (6.9%) |
| 10 to 14 Years | 551 (6.7%) | 252 (3.0%) |
| 15 to 19 Years | 393 (4.8%) | 292 (3.4%) |
| 20 to 24 Years | 739 (9.0%) | 466 (5.5%) |
| 25 to 29 Years | 508 (6.2%) | 1,003 (11.8%) |
| 30 to 34 Years | 612 (7.5%) | 647 (7.6%) |
| 35 to 39 Years | 715 (8.7%) | 613 (7.2%) |
| 40 to 44 Years | 523 (6.4%) | 519 (6.1%) |
| 45 to 49 Years | 597 (7.3%) | 382 (4.5%) |
| 50 to 54 Years | 308 (3.8%) | 459 (5.4%) |
| 55 to 59 Years | 439 (5.4%) | 412 (4.9%) |
| 60 to 64 Years | 399 (4.9%) | 448 (5.3%) |
| 65 to 69 Years | 338 (4.1%) | 282 (3.3%) |
| 70 to 74 Years | 327 (4.0%) | 450 (5.3%) |
| 75 to 79 Years | 296 (3.6%) | 329 (3.9%) |
| 80 to 84 Years | 168 (2.1%) | 197 (2.3%) |
| 85 Years and over | 119 (1.5%) | 261 (3.1%) |
| Total | 8,185 (100.0%) | 8,484 (100.0%) |
Families and Households in Ferndale
Median Family Size in Ferndale
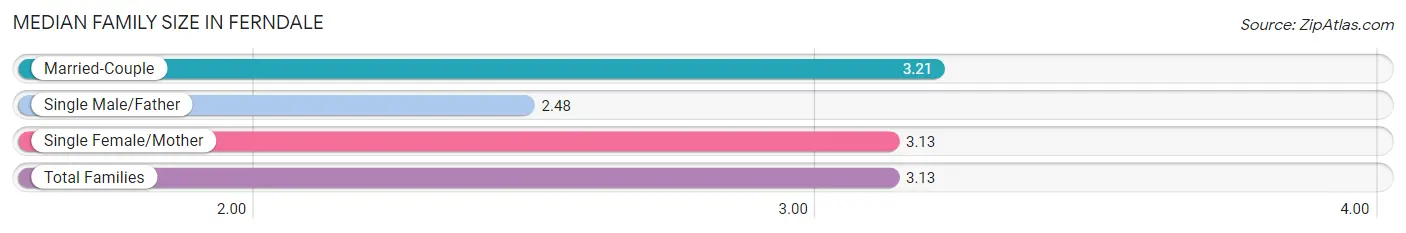
The median family size in Ferndale is 3.13 persons per family, with married-couple families (2,983 | 70.8%) accounting for the largest median family size of 3.21 persons per family. On the other hand, single male/father families (366 | 8.7%) represent the smallest median family size with 2.48 persons per family.
| Family Type | # Families | Family Size |
| Married-Couple | 2,983 (70.8%) | 3.21 |
| Single Male/Father | 366 (8.7%) | 2.48 |
| Single Female/Mother | 864 (20.5%) | 3.13 |
| Total Families | 4,213 (100.0%) | 3.13 |
Median Household Size in Ferndale
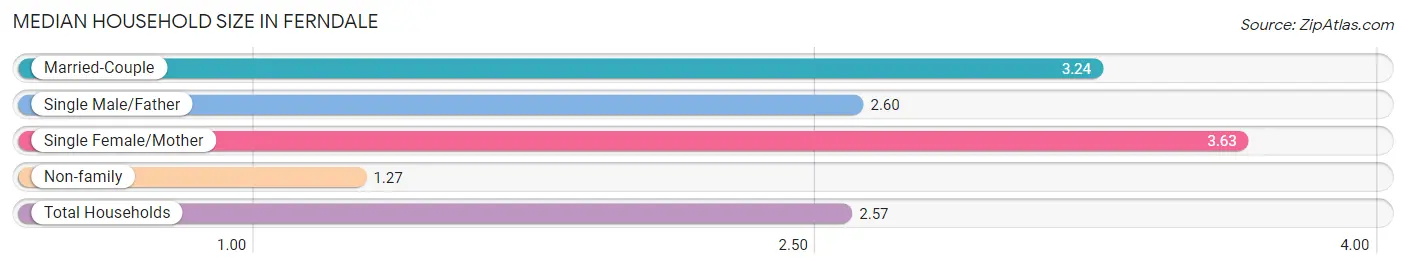
The median household size in Ferndale is 2.57 persons per household, with single female/mother households (864 | 13.3%) accounting for the largest median household size of 3.63 persons per household. non-family households (2,270 | 35.0%) represent the smallest median household size with 1.27 persons per household.
| Household Type | # Households | Household Size |
| Married-Couple | 2,983 (46.0%) | 3.24 |
| Single Male/Father | 366 (5.7%) | 2.60 |
| Single Female/Mother | 864 (13.3%) | 3.63 |
| Non-family | 2,270 (35.0%) | 1.27 |
| Total Households | 6,483 (100.0%) | 2.57 |
Household Size by Marriage Status in Ferndale
Out of a total of 6,483 households in Ferndale, 4,213 (65.0%) are family households, while 2,270 (35.0%) are nonfamily households. The most numerous type of family households are 2-person households, comprising 1,815, and the most common type of nonfamily households are 1-person households, comprising 1,936.
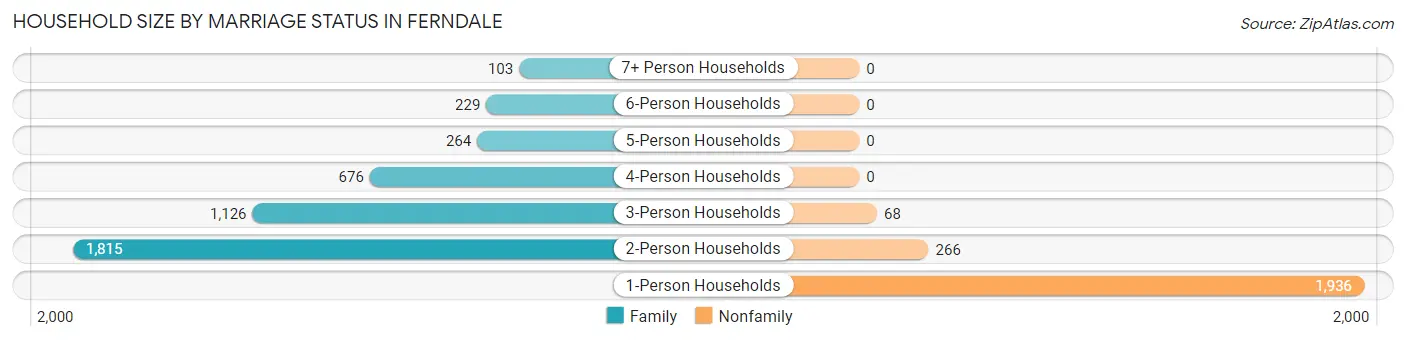
| Household Size | Family Households | Nonfamily Households |
| 1-Person Households | - | 1,936 (29.9%) |
| 2-Person Households | 1,815 (28.0%) | 266 (4.1%) |
| 3-Person Households | 1,126 (17.4%) | 68 (1.1%) |
| 4-Person Households | 676 (10.4%) | 0 (0.0%) |
| 5-Person Households | 264 (4.1%) | 0 (0.0%) |
| 6-Person Households | 229 (3.5%) | 0 (0.0%) |
| 7+ Person Households | 103 (1.6%) | 0 (0.0%) |
| Total | 4,213 (65.0%) | 2,270 (35.0%) |
Female Fertility in Ferndale
Fertility by Age in Ferndale
Average fertility rate in Ferndale is 87.0 births per 1,000 women. Women in the age bracket of 20 to 34 years have the highest fertility rate with 155.0 births per 1,000 women. Women in the age bracket of 20 to 34 years acount for 92.4% of all women with births.
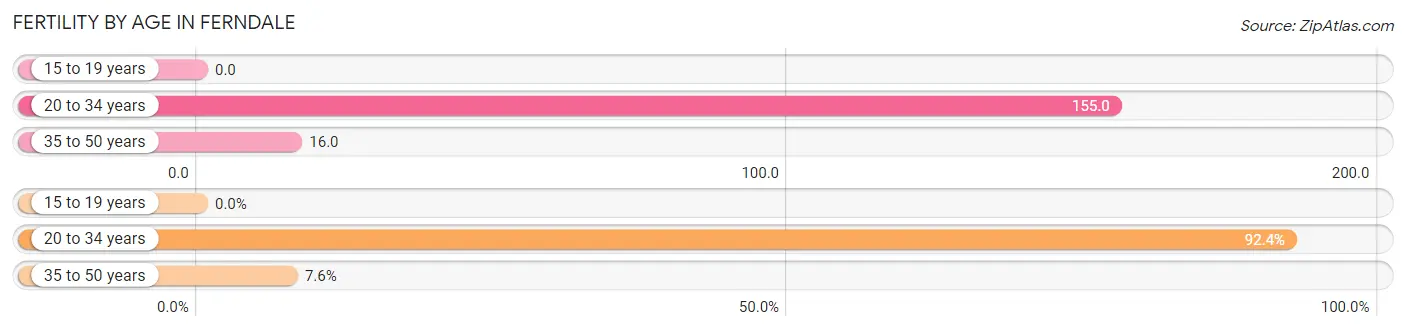
| Age Bracket | Women with Births | Births / 1,000 Women |
| 15 to 19 years | 0 (0.0%) | 0.0 |
| 20 to 34 years | 327 (92.4%) | 155.0 |
| 35 to 50 years | 27 (7.6%) | 16.0 |
| Total | 354 (100.0%) | 87.0 |
Fertility by Age by Marriage Status in Ferndale
66.9% of women with births (354) in Ferndale are married. The highest percentage of unmarried women with births falls into 35 to 50 years age bracket with 37.0% of them unmarried at the time of birth, while the lowest percentage of unmarried women with births belong to 20 to 34 years age bracket with 32.7% of them unmarried.
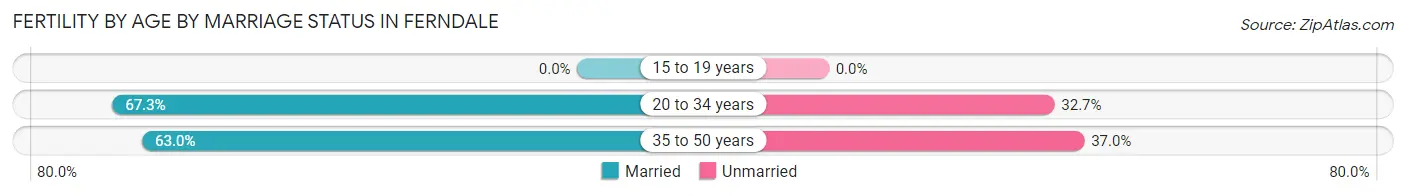
| Age Bracket | Married | Unmarried |
| 15 to 19 years | 0 (0.0%) | 0 (0.0%) |
| 20 to 34 years | 220 (67.3%) | 107 (32.7%) |
| 35 to 50 years | 17 (63.0%) | 10 (37.0%) |
| Total | 237 (66.9%) | 117 (33.1%) |
Fertility by Education in Ferndale
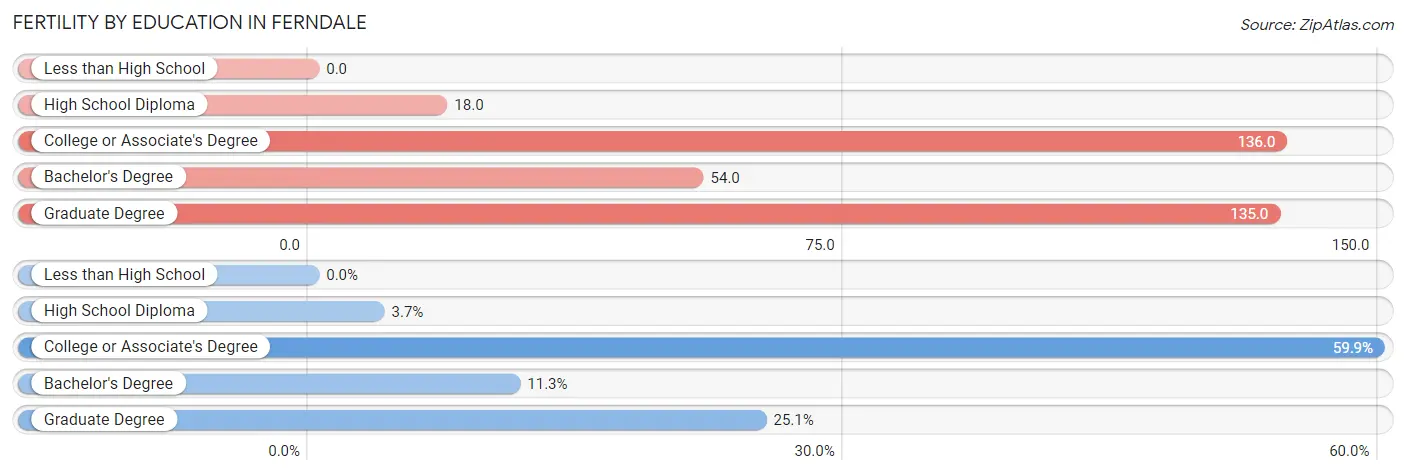
| Educational Attainment | Women with Births | Births / 1,000 Women |
| Less than High School | 0 (0.0%) | 0.0 |
| High School Diploma | 13 (3.7%) | 18.0 |
| College or Associate's Degree | 212 (59.9%) | 136.0 |
| Bachelor's Degree | 40 (11.3%) | 54.0 |
| Graduate Degree | 89 (25.1%) | 135.0 |
| Total | 354 (100.0%) | 87.0 |
Fertility by Education by Marriage Status in Ferndale
33.1% of women with births in Ferndale are unmarried. Women with the educational attainment of high school diploma are most likely to be married with 100.0% of them married at childbirth, while women with the educational attainment of college or associate's degree are least likely to be married with 50.5% of them unmarried at childbirth.
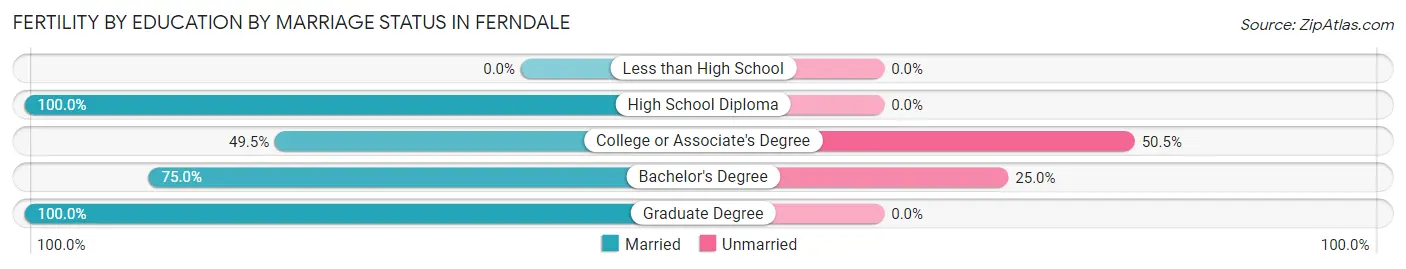
| Educational Attainment | Married | Unmarried |
| Less than High School | 0 (0.0%) | 0 (0.0%) |
| High School Diploma | 13 (100.0%) | 0 (0.0%) |
| College or Associate's Degree | 105 (49.5%) | 107 (50.5%) |
| Bachelor's Degree | 30 (75.0%) | 10 (25.0%) |
| Graduate Degree | 89 (100.0%) | 0 (0.0%) |
| Total | 237 (66.9%) | 117 (33.1%) |
Employment Characteristics in Ferndale
Employment by Class of Employer in Ferndale
Among the 8,484 employed individuals in Ferndale, private company employees (5,809 | 68.5%), federal government employees (842 | 9.9%), and local government employees (552 | 6.5%) make up the most common classes of employment.
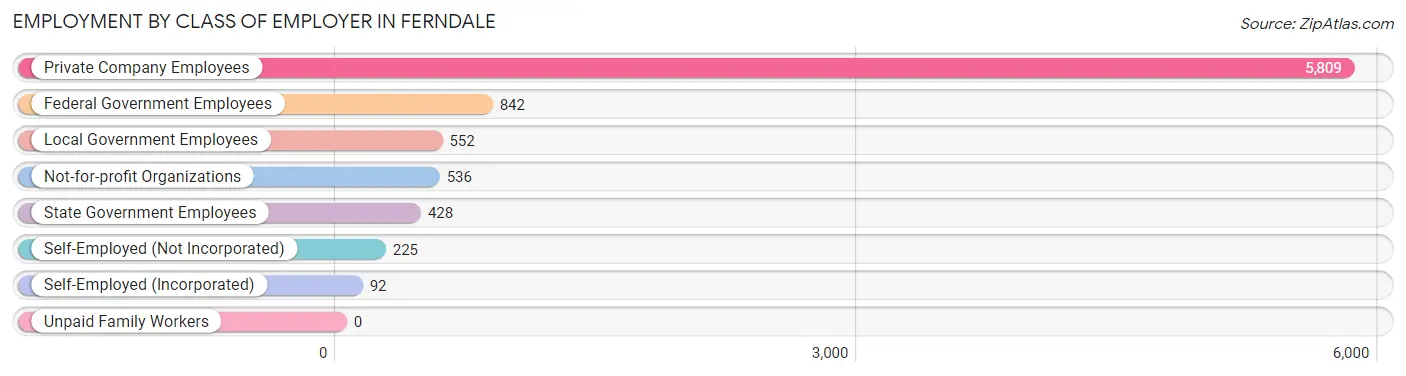
| Employer Class | # Employees | % Employees |
| Private Company Employees | 5,809 | 68.5% |
| Self-Employed (Incorporated) | 92 | 1.1% |
| Self-Employed (Not Incorporated) | 225 | 2.6% |
| Not-for-profit Organizations | 536 | 6.3% |
| Local Government Employees | 552 | 6.5% |
| State Government Employees | 428 | 5.0% |
| Federal Government Employees | 842 | 9.9% |
| Unpaid Family Workers | 0 | 0.0% |
| Total | 8,484 | 100.0% |
Employment Status by Age in Ferndale
According to the labor force statistics for Ferndale, out of the total population over 16 years of age (13,090), 70.1% or 9,176 individuals are in the labor force, with 6.2% or 569 of them unemployed. The age group with the highest labor force participation rate is 30 to 34 years, with 96.4% or 1,214 individuals in the labor force. Within the labor force, the 65 to 74 years age range has the highest percentage of unemployed individuals, with 17.1% or 42 of them being unemployed.
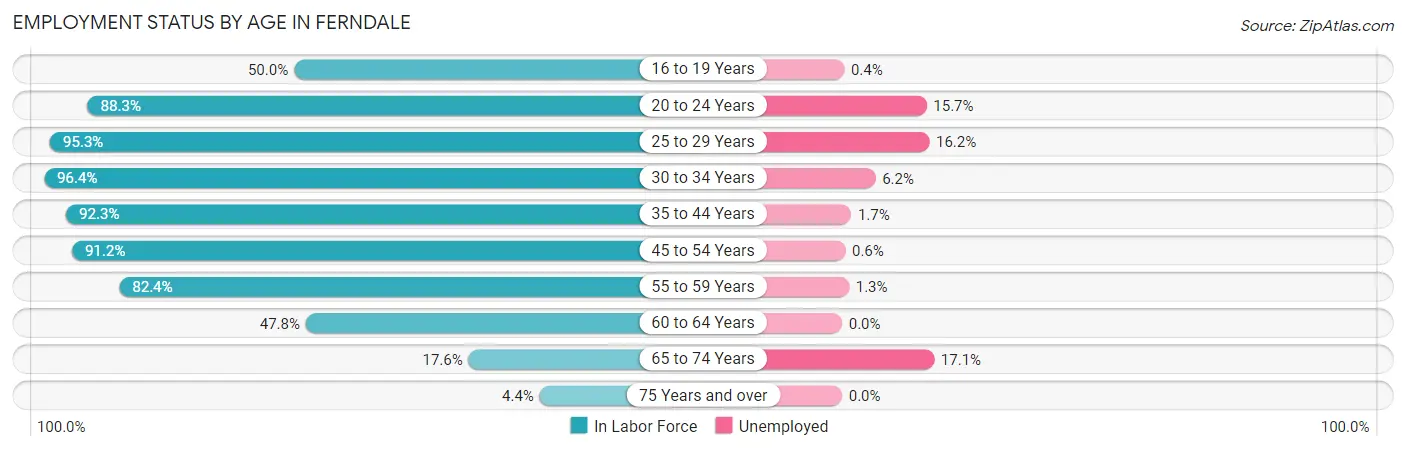
| Age Bracket | In Labor Force | Unemployed |
| 16 to 19 Years | 267 (50.0%) | 1 (0.4%) |
| 20 to 24 Years | 1,064 (88.3%) | 167 (15.7%) |
| 25 to 29 Years | 1,440 (95.3%) | 233 (16.2%) |
| 30 to 34 Years | 1,214 (96.4%) | 75 (6.2%) |
| 35 to 44 Years | 2,188 (92.3%) | 37 (1.7%) |
| 45 to 54 Years | 1,592 (91.2%) | 10 (0.6%) |
| 55 to 59 Years | 701 (82.4%) | 9 (1.3%) |
| 60 to 64 Years | 405 (47.8%) | 0 (0.0%) |
| 65 to 74 Years | 246 (17.6%) | 42 (17.1%) |
| 75 Years and over | 60 (4.4%) | 0 (0.0%) |
| Total | 9,176 (70.1%) | 569 (6.2%) |
Employment Status by Educational Attainment in Ferndale
According to labor force statistics for Ferndale, 87.8% of individuals (7,537) out of the total population between 25 and 64 years of age (8,584) are in the labor force, with 4.7% or 354 of them being unemployed. The group with the highest labor force participation rate are those with the educational attainment of bachelor's degree or higher, with 95.4% or 2,148 individuals in the labor force. Within the labor force, individuals with bachelor's degree or higher education have the highest percentage of unemployment, with 7.8% or 168 of them being unemployed.
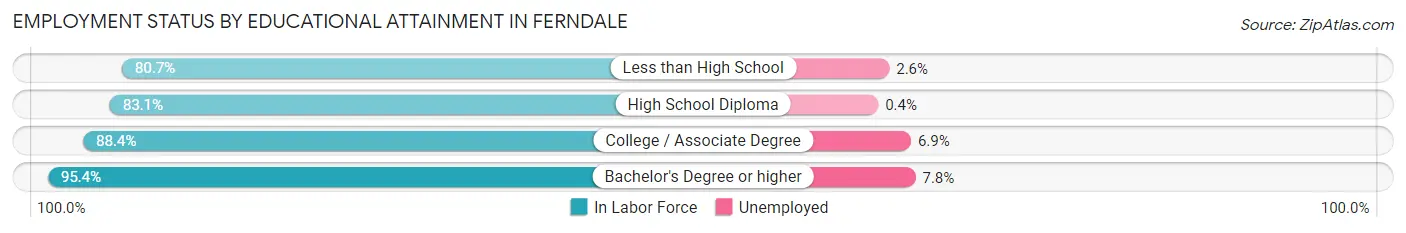
| Educational Attainment | In Labor Force | Unemployed |
| Less than High School | 497 (80.7%) | 16 (2.6%) |
| High School Diploma | 2,459 (83.1%) | 12 (0.4%) |
| College / Associate Degree | 2,437 (88.4%) | 190 (6.9%) |
| Bachelor's Degree or higher | 2,148 (95.4%) | 176 (7.8%) |
| Total | 7,537 (87.8%) | 403 (4.7%) |
Employment Occupations by Sex in Ferndale
Management, Business, Science and Arts Occupations
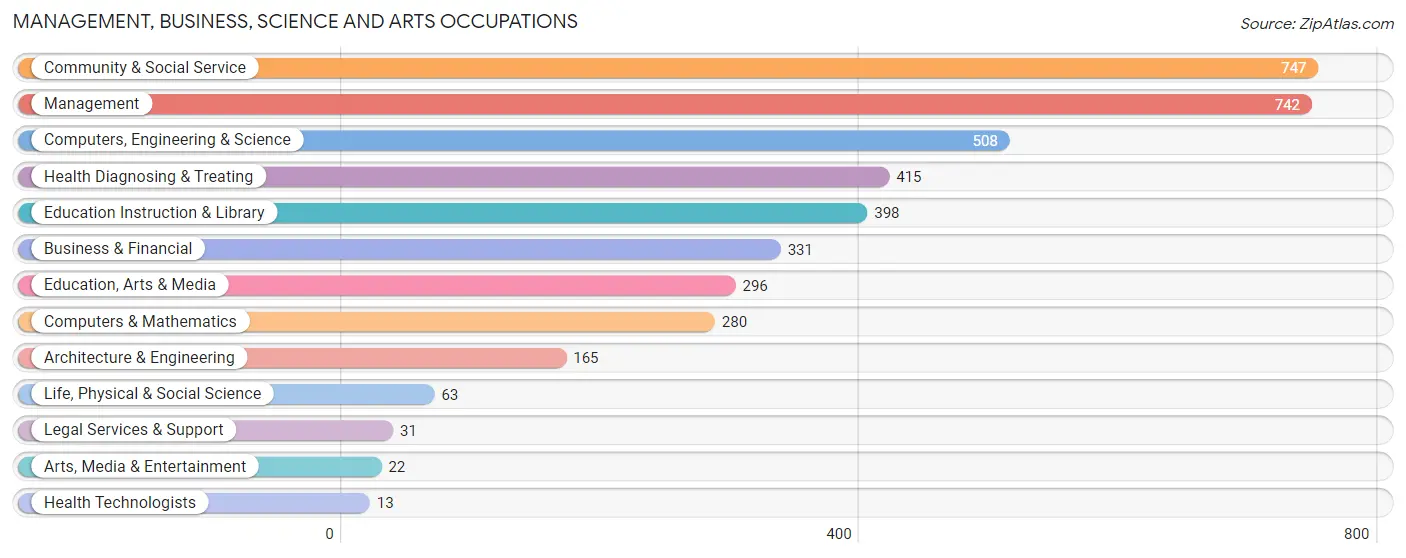
The most common Management, Business, Science and Arts occupations in Ferndale are Community & Social Service (747 | 8.9%), Management (742 | 8.9%), Computers, Engineering & Science (508 | 6.1%), Health Diagnosing & Treating (415 | 5.0%), and Education Instruction & Library (398 | 4.8%).
Management, Business, Science and Arts Occupations by Sex
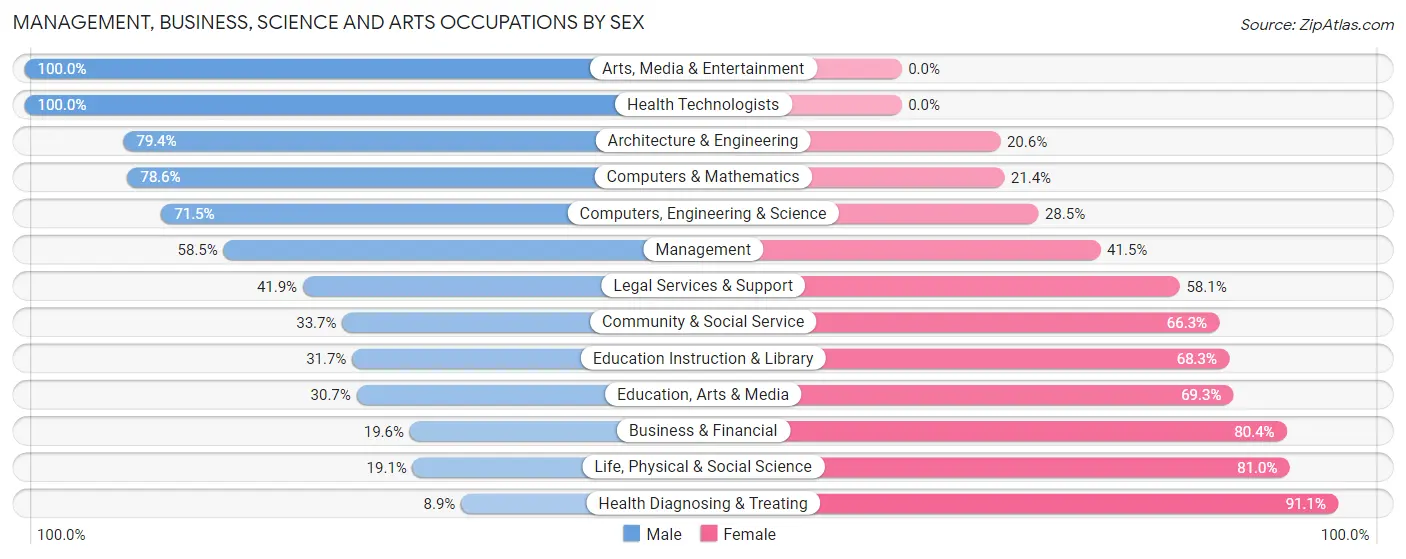
Within the Management, Business, Science and Arts occupations in Ferndale, the most male-oriented occupations are Arts, Media & Entertainment (100.0%), Health Technologists (100.0%), and Architecture & Engineering (79.4%), while the most female-oriented occupations are Health Diagnosing & Treating (91.1%), Life, Physical & Social Science (80.9%), and Business & Financial (80.4%).
| Occupation | Male | Female |
| Management | 434 (58.5%) | 308 (41.5%) |
| Business & Financial | 65 (19.6%) | 266 (80.4%) |
| Computers, Engineering & Science | 363 (71.5%) | 145 (28.5%) |
| Computers & Mathematics | 220 (78.6%) | 60 (21.4%) |
| Architecture & Engineering | 131 (79.4%) | 34 (20.6%) |
| Life, Physical & Social Science | 12 (19.1%) | 51 (80.9%) |
| Community & Social Service | 252 (33.7%) | 495 (66.3%) |
| Education, Arts & Media | 91 (30.7%) | 205 (69.3%) |
| Legal Services & Support | 13 (41.9%) | 18 (58.1%) |
| Education Instruction & Library | 126 (31.7%) | 272 (68.3%) |
| Arts, Media & Entertainment | 22 (100.0%) | 0 (0.0%) |
| Health Diagnosing & Treating | 37 (8.9%) | 378 (91.1%) |
| Health Technologists | 13 (100.0%) | 0 (0.0%) |
| Total (Category) | 1,151 (42.0%) | 1,592 (58.0%) |
| Total (Overall) | 4,340 (51.9%) | 4,022 (48.1%) |
Services Occupations
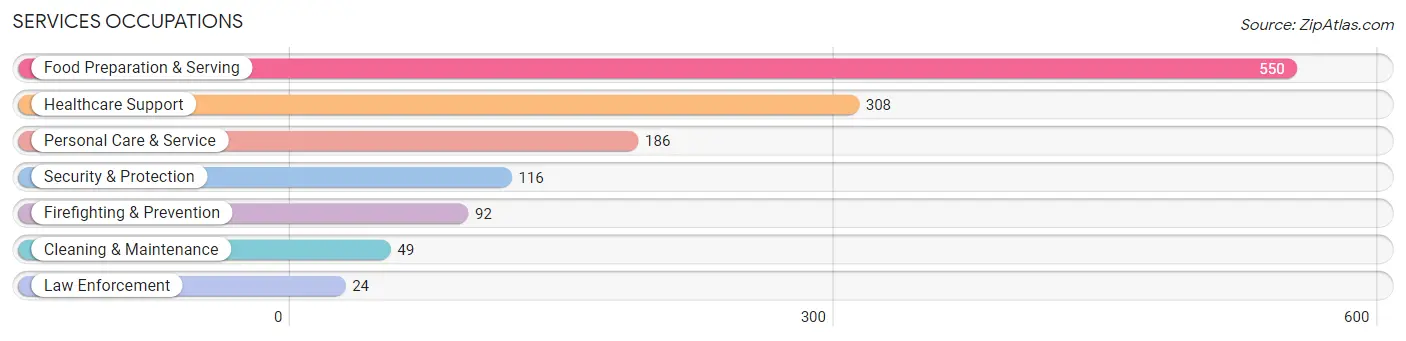
The most common Services occupations in Ferndale are Food Preparation & Serving (550 | 6.6%), Healthcare Support (308 | 3.7%), Personal Care & Service (186 | 2.2%), Security & Protection (116 | 1.4%), and Firefighting & Prevention (92 | 1.1%).
Services Occupations by Sex
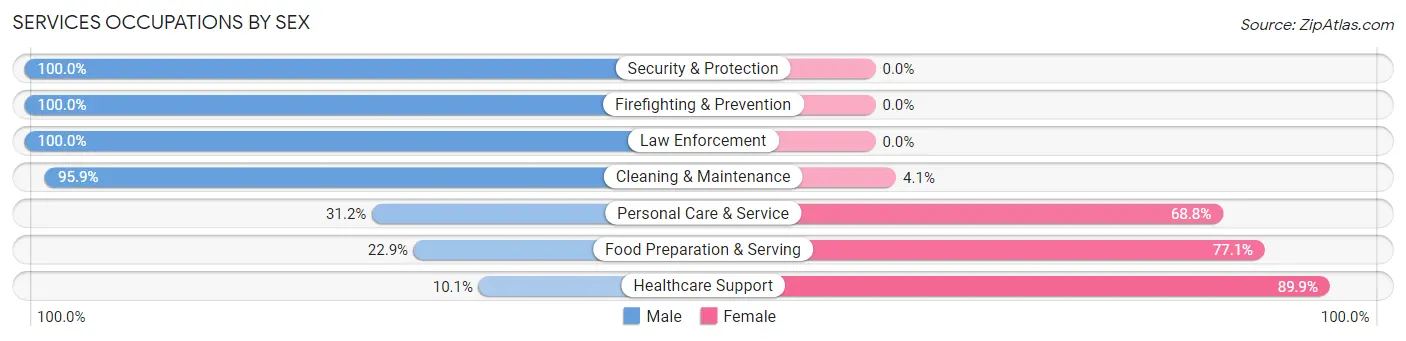
Within the Services occupations in Ferndale, the most male-oriented occupations are Security & Protection (100.0%), Firefighting & Prevention (100.0%), and Law Enforcement (100.0%), while the most female-oriented occupations are Healthcare Support (89.9%), Food Preparation & Serving (77.1%), and Personal Care & Service (68.8%).
| Occupation | Male | Female |
| Healthcare Support | 31 (10.1%) | 277 (89.9%) |
| Security & Protection | 116 (100.0%) | 0 (0.0%) |
| Firefighting & Prevention | 92 (100.0%) | 0 (0.0%) |
| Law Enforcement | 24 (100.0%) | 0 (0.0%) |
| Food Preparation & Serving | 126 (22.9%) | 424 (77.1%) |
| Cleaning & Maintenance | 47 (95.9%) | 2 (4.1%) |
| Personal Care & Service | 58 (31.2%) | 128 (68.8%) |
| Total (Category) | 378 (31.3%) | 831 (68.7%) |
| Total (Overall) | 4,340 (51.9%) | 4,022 (48.1%) |
Sales and Office Occupations
The most common Sales and Office occupations in Ferndale are Office & Administration (1,496 | 17.9%), and Sales & Related (610 | 7.3%).
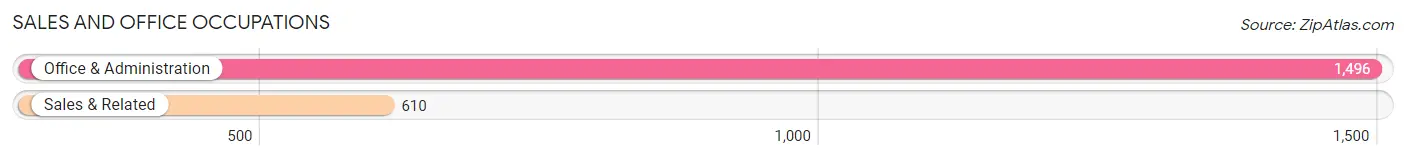
Sales and Office Occupations by Sex
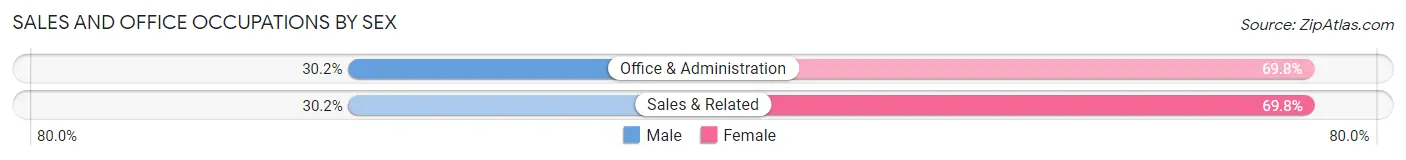
| Occupation | Male | Female |
| Sales & Related | 184 (30.2%) | 426 (69.8%) |
| Office & Administration | 452 (30.2%) | 1,044 (69.8%) |
| Total (Category) | 636 (30.2%) | 1,470 (69.8%) |
| Total (Overall) | 4,340 (51.9%) | 4,022 (48.1%) |
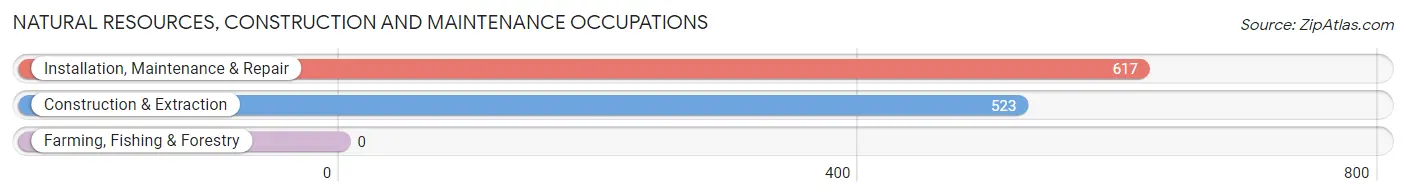
Natural Resources, Construction and Maintenance Occupations
The most common Natural Resources, Construction and Maintenance occupations in Ferndale are Installation, Maintenance & Repair (617 | 7.4%), and Construction & Extraction (523 | 6.2%).
Natural Resources, Construction and Maintenance Occupations by Sex
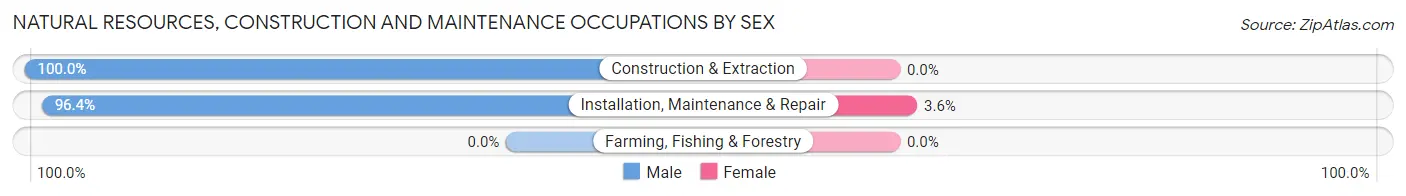
| Occupation | Male | Female |
| Farming, Fishing & Forestry | 0 (0.0%) | 0 (0.0%) |
| Construction & Extraction | 523 (100.0%) | 0 (0.0%) |
| Installation, Maintenance & Repair | 595 (96.4%) | 22 (3.6%) |
| Total (Category) | 1,118 (98.1%) | 22 (1.9%) |
| Total (Overall) | 4,340 (51.9%) | 4,022 (48.1%) |
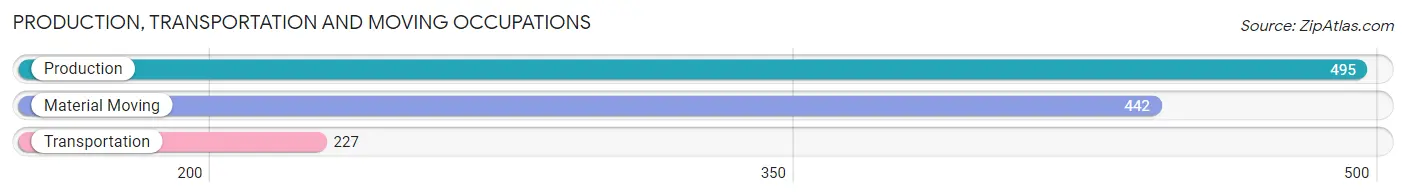
Production, Transportation and Moving Occupations
The most common Production, Transportation and Moving occupations in Ferndale are Production (495 | 5.9%), Material Moving (442 | 5.3%), and Transportation (227 | 2.7%).
Production, Transportation and Moving Occupations by Sex
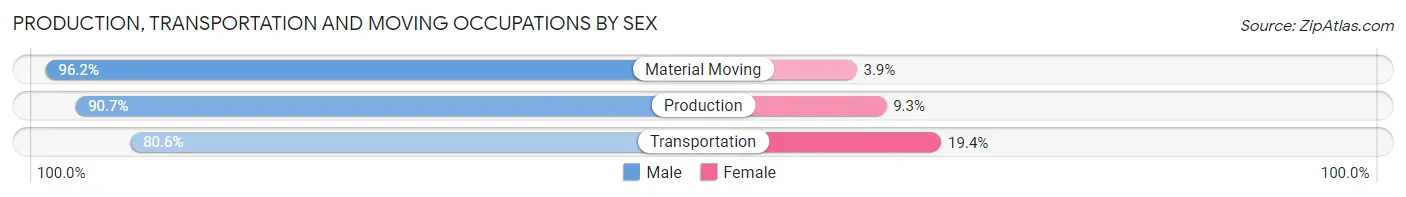
| Occupation | Male | Female |
| Production | 449 (90.7%) | 46 (9.3%) |
| Transportation | 183 (80.6%) | 44 (19.4%) |
| Material Moving | 425 (96.2%) | 17 (3.8%) |
| Total (Category) | 1,057 (90.8%) | 107 (9.2%) |
| Total (Overall) | 4,340 (51.9%) | 4,022 (48.1%) |
Employment Industries by Sex in Ferndale
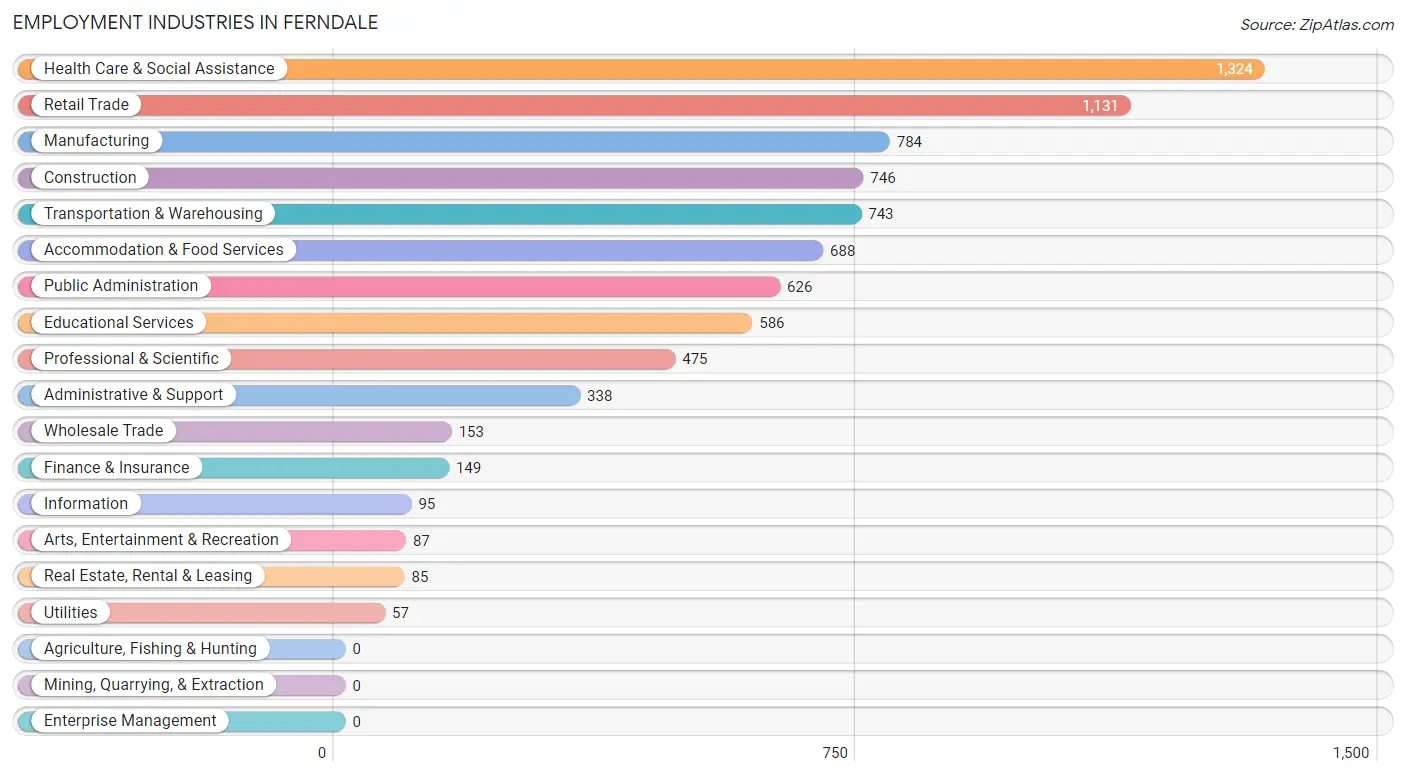
Employment Industries in Ferndale
The major employment industries in Ferndale include Health Care & Social Assistance (1,324 | 15.8%), Retail Trade (1,131 | 13.5%), Manufacturing (784 | 9.4%), Construction (746 | 8.9%), and Transportation & Warehousing (743 | 8.9%).
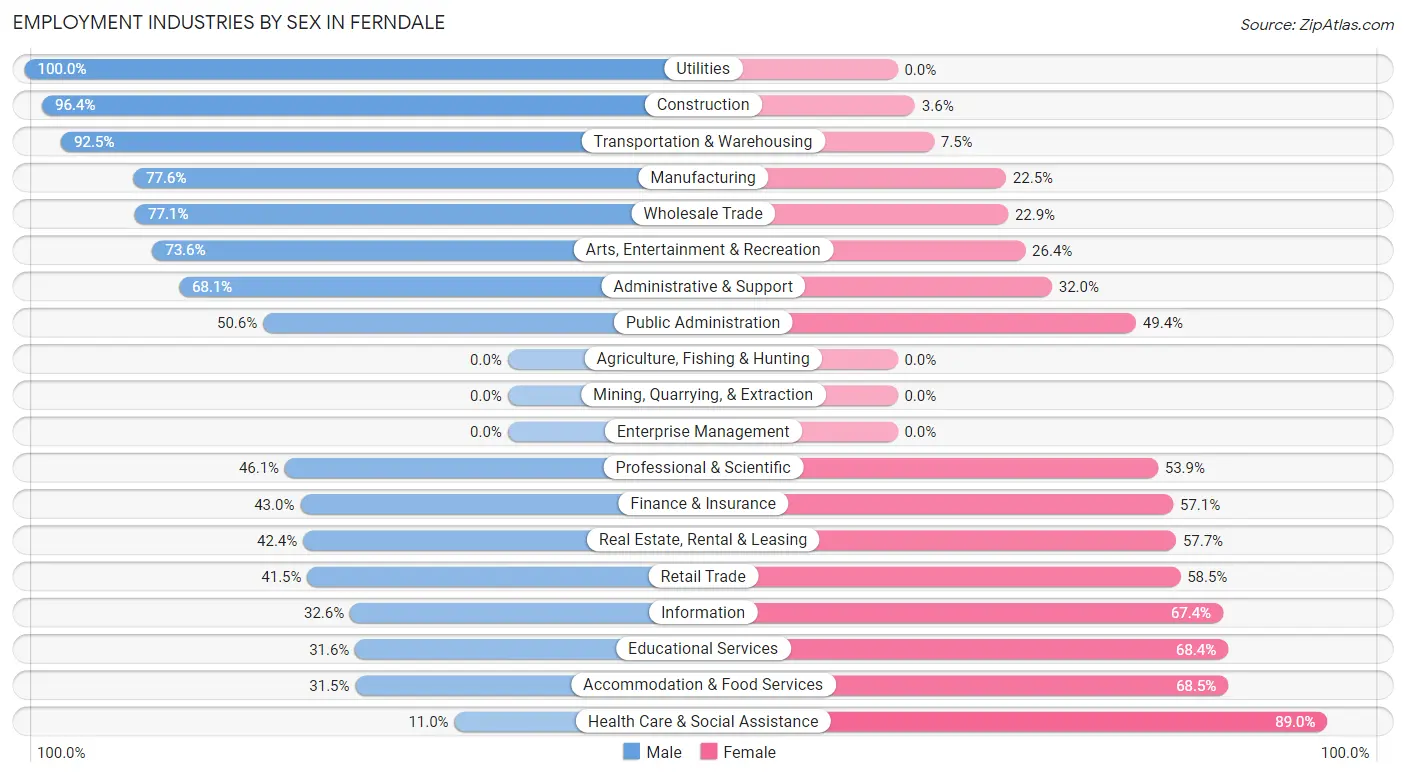
Employment Industries by Sex in Ferndale
The Ferndale industries that see more men than women are Utilities (100.0%), Construction (96.4%), and Transportation & Warehousing (92.5%), whereas the industries that tend to have a higher number of women are Health Care & Social Assistance (89.0%), Accommodation & Food Services (68.5%), and Educational Services (68.4%).
| Industry | Male | Female |
| Agriculture, Fishing & Hunting | 0 (0.0%) | 0 (0.0%) |
| Mining, Quarrying, & Extraction | 0 (0.0%) | 0 (0.0%) |
| Construction | 719 (96.4%) | 27 (3.6%) |
| Manufacturing | 608 (77.5%) | 176 (22.5%) |
| Wholesale Trade | 118 (77.1%) | 35 (22.9%) |
| Retail Trade | 469 (41.5%) | 662 (58.5%) |
| Transportation & Warehousing | 687 (92.5%) | 56 (7.5%) |
| Utilities | 57 (100.0%) | 0 (0.0%) |
| Information | 31 (32.6%) | 64 (67.4%) |
| Finance & Insurance | 64 (42.9%) | 85 (57.1%) |
| Real Estate, Rental & Leasing | 36 (42.3%) | 49 (57.7%) |
| Professional & Scientific | 219 (46.1%) | 256 (53.9%) |
| Enterprise Management | 0 (0.0%) | 0 (0.0%) |
| Administrative & Support | 230 (68.0%) | 108 (32.0%) |
| Educational Services | 185 (31.6%) | 401 (68.4%) |
| Health Care & Social Assistance | 146 (11.0%) | 1,178 (89.0%) |
| Arts, Entertainment & Recreation | 64 (73.6%) | 23 (26.4%) |
| Accommodation & Food Services | 217 (31.5%) | 471 (68.5%) |
| Public Administration | 317 (50.6%) | 309 (49.4%) |
| Total | 4,340 (51.9%) | 4,022 (48.1%) |
Education in Ferndale
School Enrollment in Ferndale
The most common levels of schooling among the 4,439 students in Ferndale are college / undergraduate (1,109 | 25.0%), elementary school (878 | 19.8%), and middle school (733 | 16.5%).
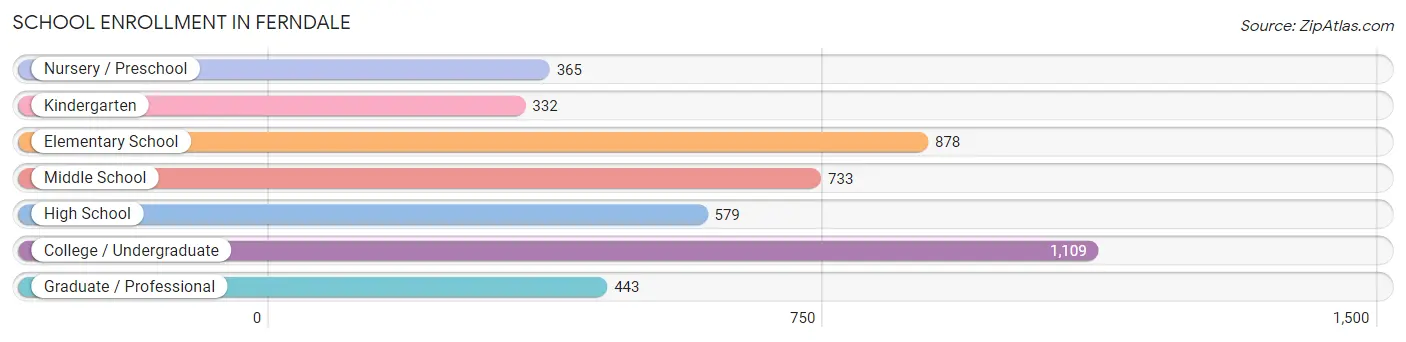
| School Level | # Students | % Students |
| Nursery / Preschool | 365 | 8.2% |
| Kindergarten | 332 | 7.5% |
| Elementary School | 878 | 19.8% |
| Middle School | 733 | 16.5% |
| High School | 579 | 13.0% |
| College / Undergraduate | 1,109 | 25.0% |
| Graduate / Professional | 443 | 10.0% |
| Total | 4,439 | 100.0% |
School Enrollment by Age by Funding Source in Ferndale
Out of a total of 4,439 students who are enrolled in schools in Ferndale, 661 (14.9%) attend a private institution, while the remaining 3,778 (85.1%) are enrolled in public schools. The age group of 3 to 4 year olds has the highest likelihood of being enrolled in private schools, with 190 (66.4% in the age bracket) enrolled. Conversely, the age group of 18 to 19 year olds has the lowest likelihood of being enrolled in a private school, with 90 (100.0% in the age bracket) attending a public institution.
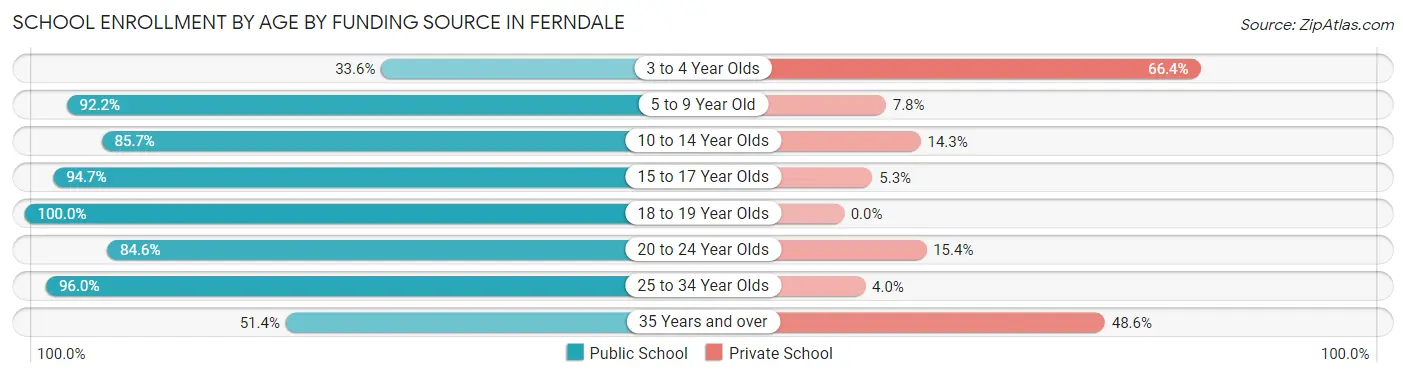
| Age Bracket | Public School | Private School |
| 3 to 4 Year Olds | 96 (33.6%) | 190 (66.4%) |
| 5 to 9 Year Old | 1,176 (92.2%) | 100 (7.8%) |
| 10 to 14 Year Olds | 688 (85.7%) | 115 (14.3%) |
| 15 to 17 Year Olds | 408 (94.7%) | 23 (5.3%) |
| 18 to 19 Year Olds | 90 (100.0%) | 0 (0.0%) |
| 20 to 24 Year Olds | 418 (84.6%) | 76 (15.4%) |
| 25 to 34 Year Olds | 770 (96.0%) | 32 (4.0%) |
| 35 Years and over | 132 (51.4%) | 125 (48.6%) |
| Total | 3,778 (85.1%) | 661 (14.9%) |
Educational Attainment by Field of Study in Ferndale
Science & technology (481 | 16.9%), psychology (332 | 11.7%), business (306 | 10.7%), liberal arts & history (253 | 8.9%), and arts & humanities (228 | 8.0%) are the most common fields of study among 2,851 individuals in Ferndale who have obtained a bachelor's degree or higher.
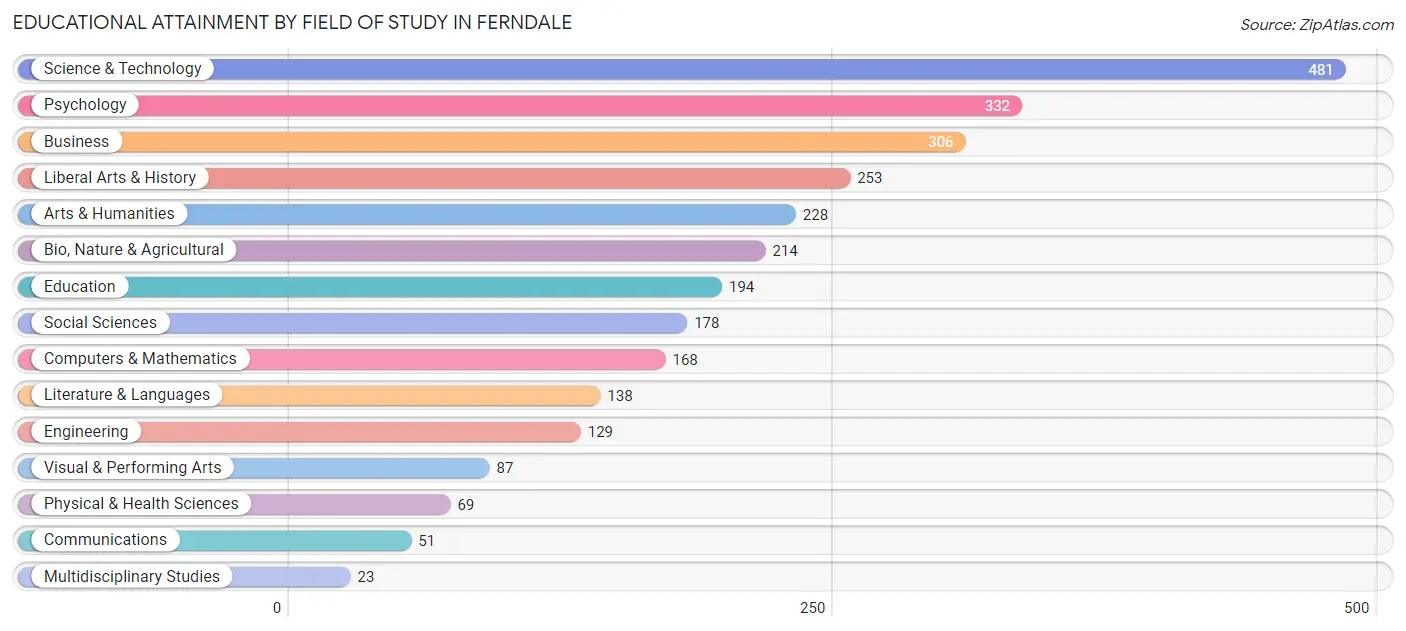
| Field of Study | # Graduates | % Graduates |
| Computers & Mathematics | 168 | 5.9% |
| Bio, Nature & Agricultural | 214 | 7.5% |
| Physical & Health Sciences | 69 | 2.4% |
| Psychology | 332 | 11.7% |
| Social Sciences | 178 | 6.2% |
| Engineering | 129 | 4.5% |
| Multidisciplinary Studies | 23 | 0.8% |
| Science & Technology | 481 | 16.9% |
| Business | 306 | 10.7% |
| Education | 194 | 6.8% |
| Literature & Languages | 138 | 4.8% |
| Liberal Arts & History | 253 | 8.9% |
| Visual & Performing Arts | 87 | 3.0% |
| Communications | 51 | 1.8% |
| Arts & Humanities | 228 | 8.0% |
| Total | 2,851 | 100.0% |
Transportation & Commute in Ferndale
Vehicle Availability by Sex in Ferndale
The most prevalent vehicle ownership categories in Ferndale are males with 2 vehicles (1,588, accounting for 35.3%) and females with 2 vehicles (1,540, making up 39.9%).
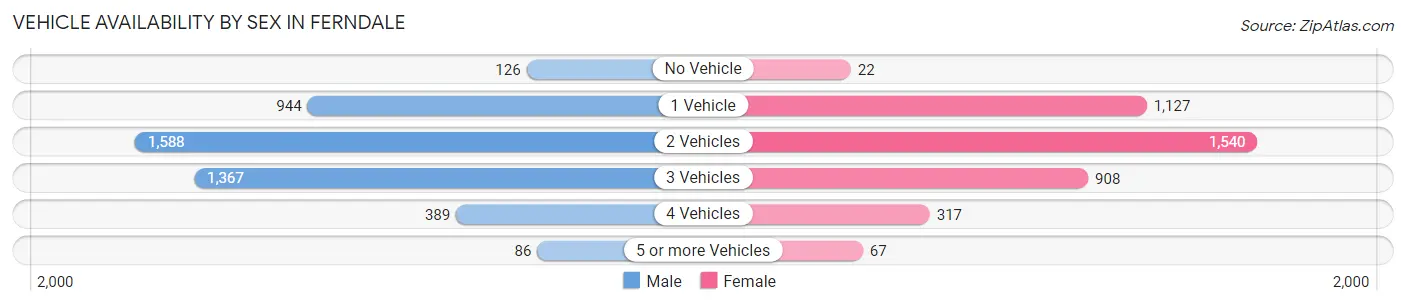
| Vehicles Available | Male | Female |
| No Vehicle | 126 (2.8%) | 22 (0.5%) |
| 1 Vehicle | 944 (21.0%) | 1,127 (28.3%) |
| 2 Vehicles | 1,588 (35.3%) | 1,540 (38.7%) |
| 3 Vehicles | 1,367 (30.4%) | 908 (22.8%) |
| 4 Vehicles | 389 (8.6%) | 317 (8.0%) |
| 5 or more Vehicles | 86 (1.9%) | 67 (1.7%) |
| Total | 4,500 (100.0%) | 3,981 (100.0%) |
Commute Time in Ferndale
The most frequently occuring commute durations in Ferndale are 15 to 19 minutes (1,547 commuters, 20.0%), 30 to 34 minutes (1,344 commuters, 17.4%), and 10 to 14 minutes (1,004 commuters, 13.0%).
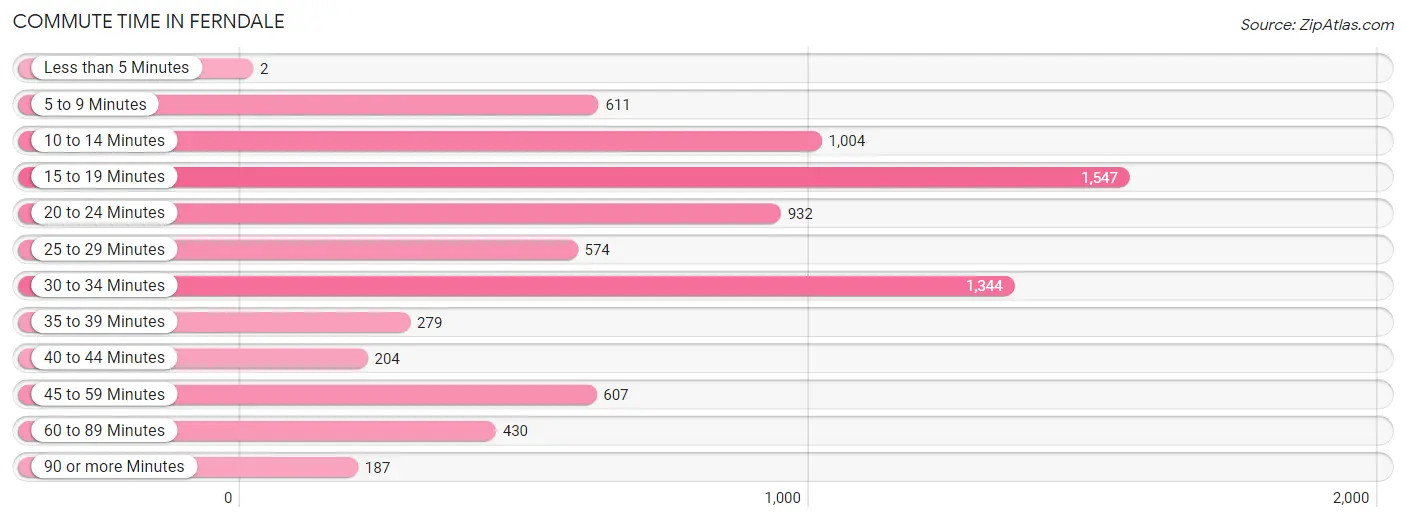
| Commute Time | # Commuters | % Commuters |
| Less than 5 Minutes | 2 | 0.0% |
| 5 to 9 Minutes | 611 | 7.9% |
| 10 to 14 Minutes | 1,004 | 13.0% |
| 15 to 19 Minutes | 1,547 | 20.0% |
| 20 to 24 Minutes | 932 | 12.1% |
| 25 to 29 Minutes | 574 | 7.4% |
| 30 to 34 Minutes | 1,344 | 17.4% |
| 35 to 39 Minutes | 279 | 3.6% |
| 40 to 44 Minutes | 204 | 2.6% |
| 45 to 59 Minutes | 607 | 7.9% |
| 60 to 89 Minutes | 430 | 5.6% |
| 90 or more Minutes | 187 | 2.4% |
Commute Time by Sex in Ferndale
The most common commute times in Ferndale are 15 to 19 minutes (888 commuters, 20.6%) for males and 30 to 34 minutes (755 commuters, 22.2%) for females.
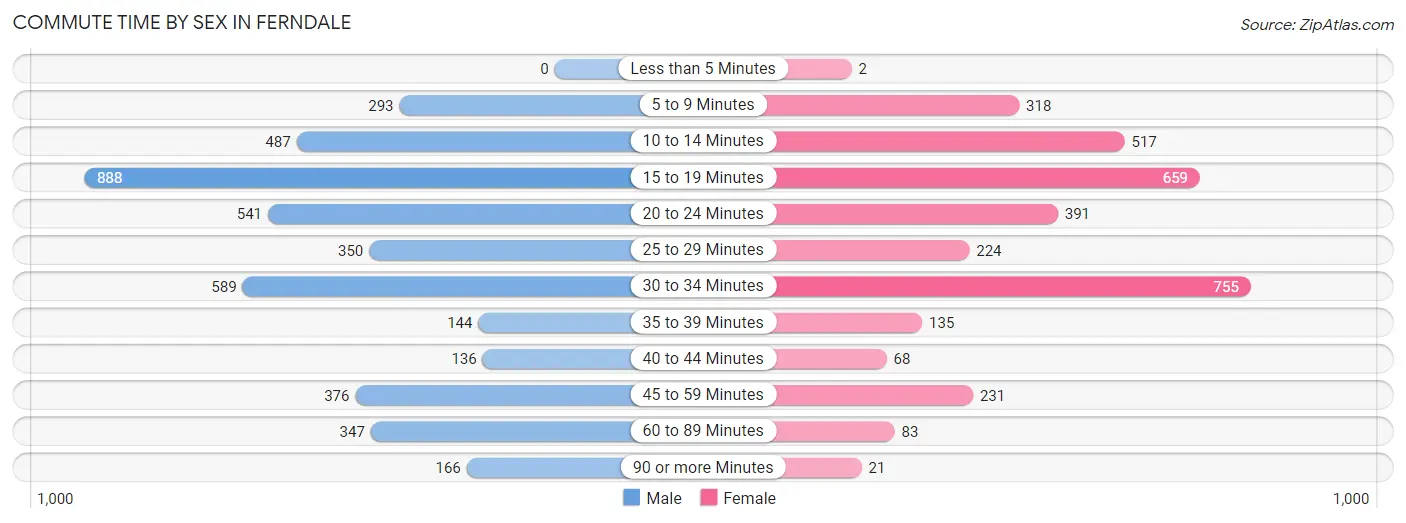
| Commute Time | Male | Female |
| Less than 5 Minutes | 0 (0.0%) | 2 (0.1%) |
| 5 to 9 Minutes | 293 (6.8%) | 318 (9.3%) |
| 10 to 14 Minutes | 487 (11.3%) | 517 (15.2%) |
| 15 to 19 Minutes | 888 (20.6%) | 659 (19.4%) |
| 20 to 24 Minutes | 541 (12.5%) | 391 (11.5%) |
| 25 to 29 Minutes | 350 (8.1%) | 224 (6.6%) |
| 30 to 34 Minutes | 589 (13.6%) | 755 (22.2%) |
| 35 to 39 Minutes | 144 (3.3%) | 135 (4.0%) |
| 40 to 44 Minutes | 136 (3.2%) | 68 (2.0%) |
| 45 to 59 Minutes | 376 (8.7%) | 231 (6.8%) |
| 60 to 89 Minutes | 347 (8.0%) | 83 (2.4%) |
| 90 or more Minutes | 166 (3.8%) | 21 (0.6%) |
Time of Departure to Work by Sex in Ferndale
The most frequent times of departure to work in Ferndale are 6:00 AM to 6:29 AM (886, 20.5%) for males and 7:30 AM to 7:59 AM (684, 20.1%) for females.
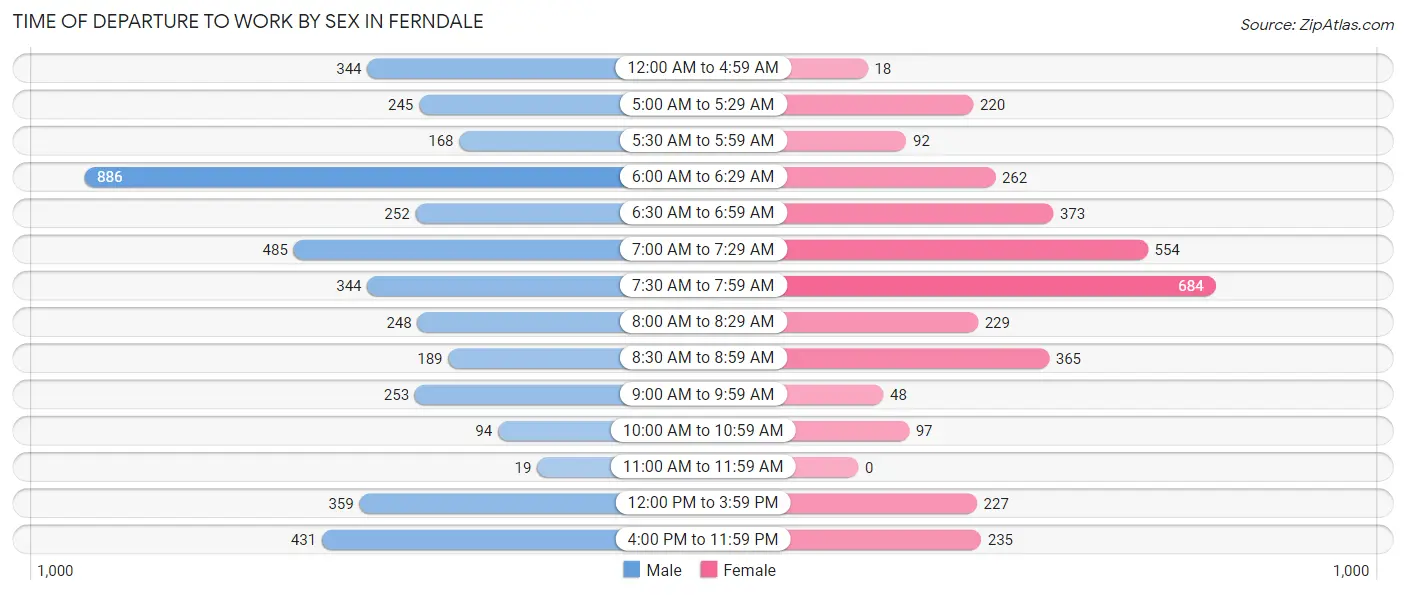
| Time of Departure | Male | Female |
| 12:00 AM to 4:59 AM | 344 (8.0%) | 18 (0.5%) |
| 5:00 AM to 5:29 AM | 245 (5.7%) | 220 (6.5%) |
| 5:30 AM to 5:59 AM | 168 (3.9%) | 92 (2.7%) |
| 6:00 AM to 6:29 AM | 886 (20.5%) | 262 (7.7%) |
| 6:30 AM to 6:59 AM | 252 (5.8%) | 373 (11.0%) |
| 7:00 AM to 7:29 AM | 485 (11.2%) | 554 (16.3%) |
| 7:30 AM to 7:59 AM | 344 (8.0%) | 684 (20.1%) |
| 8:00 AM to 8:29 AM | 248 (5.7%) | 229 (6.7%) |
| 8:30 AM to 8:59 AM | 189 (4.4%) | 365 (10.7%) |
| 9:00 AM to 9:59 AM | 253 (5.9%) | 48 (1.4%) |
| 10:00 AM to 10:59 AM | 94 (2.2%) | 97 (2.9%) |
| 11:00 AM to 11:59 AM | 19 (0.4%) | 0 (0.0%) |
| 12:00 PM to 3:59 PM | 359 (8.3%) | 227 (6.7%) |
| 4:00 PM to 11:59 PM | 431 (10.0%) | 235 (6.9%) |
| Total | 4,317 (100.0%) | 3,404 (100.0%) |
Housing Occupancy in Ferndale
Occupancy by Ownership in Ferndale
Of the total 6,483 dwellings in Ferndale, owner-occupied units account for 4,349 (67.1%), while renter-occupied units make up 2,134 (32.9%).
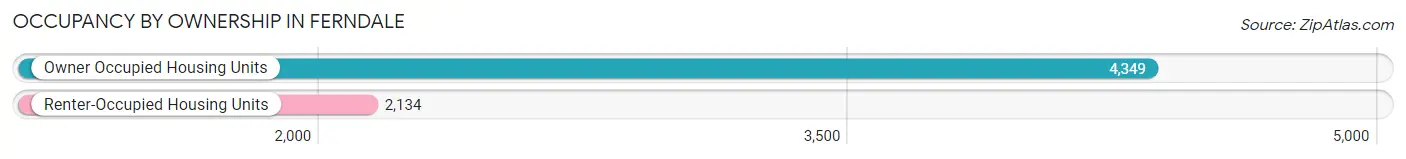
| Occupancy | # Housing Units | % Housing Units |
| Owner Occupied Housing Units | 4,349 | 67.1% |
| Renter-Occupied Housing Units | 2,134 | 32.9% |
| Total Occupied Housing Units | 6,483 | 100.0% |
Occupancy by Household Size in Ferndale
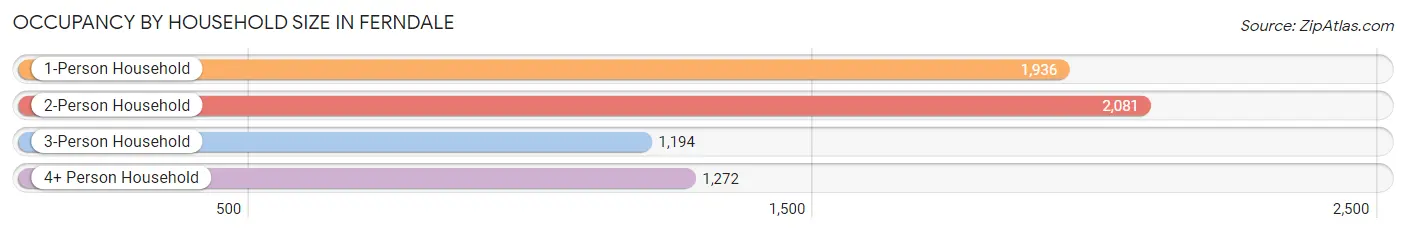
| Household Size | # Housing Units | % Housing Units |
| 1-Person Household | 1,936 | 29.9% |
| 2-Person Household | 2,081 | 32.1% |
| 3-Person Household | 1,194 | 18.4% |
| 4+ Person Household | 1,272 | 19.6% |
| Total Housing Units | 6,483 | 100.0% |
Occupancy by Ownership by Household Size in Ferndale
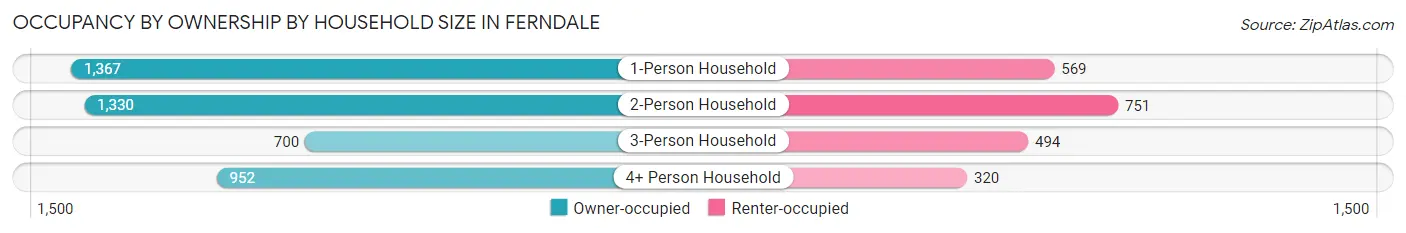
| Household Size | Owner-occupied | Renter-occupied |
| 1-Person Household | 1,367 (70.6%) | 569 (29.4%) |
| 2-Person Household | 1,330 (63.9%) | 751 (36.1%) |
| 3-Person Household | 700 (58.6%) | 494 (41.4%) |
| 4+ Person Household | 952 (74.8%) | 320 (25.2%) |
| Total Housing Units | 4,349 (67.1%) | 2,134 (32.9%) |
Occupancy by Educational Attainment in Ferndale
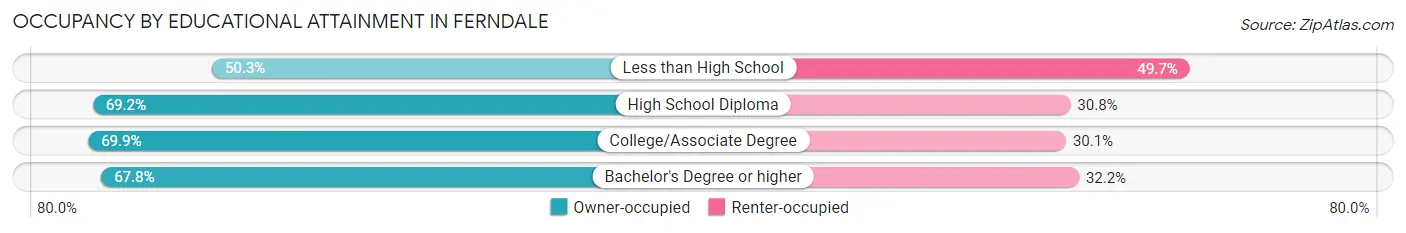
| Household Size | Owner-occupied | Renter-occupied |
| Less than High School | 356 (50.3%) | 352 (49.7%) |
| High School Diploma | 1,487 (69.2%) | 662 (30.8%) |
| College/Associate Degree | 1,565 (69.9%) | 674 (30.1%) |
| Bachelor's Degree or higher | 941 (67.8%) | 446 (32.2%) |
Occupancy by Age of Householder in Ferndale
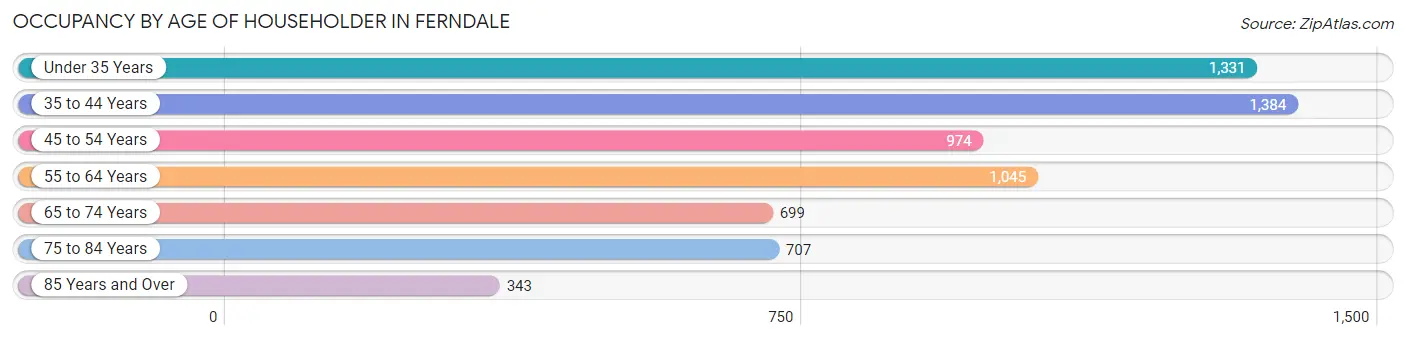
| Age Bracket | # Households | % Households |
| Under 35 Years | 1,331 | 20.5% |
| 35 to 44 Years | 1,384 | 21.3% |
| 45 to 54 Years | 974 | 15.0% |
| 55 to 64 Years | 1,045 | 16.1% |
| 65 to 74 Years | 699 | 10.8% |
| 75 to 84 Years | 707 | 10.9% |
| 85 Years and Over | 343 | 5.3% |
| Total | 6,483 | 100.0% |
Housing Finances in Ferndale
Median Income by Occupancy in Ferndale
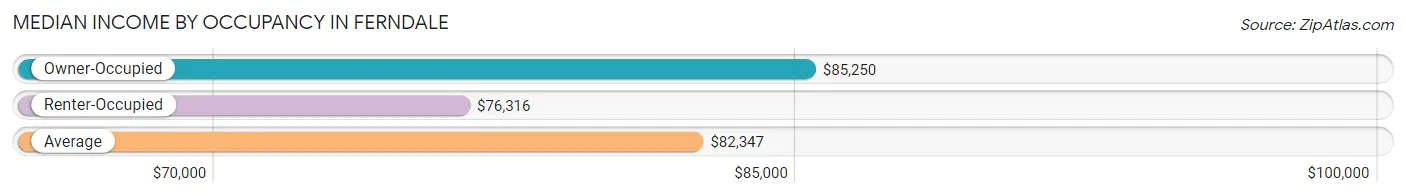
| Occupancy Type | # Households | Median Income |
| Owner-Occupied | 4,349 (67.1%) | $85,250 |
| Renter-Occupied | 2,134 (32.9%) | $76,316 |
| Average | 6,483 (100.0%) | $82,347 |
Occupancy by Householder Income Bracket in Ferndale
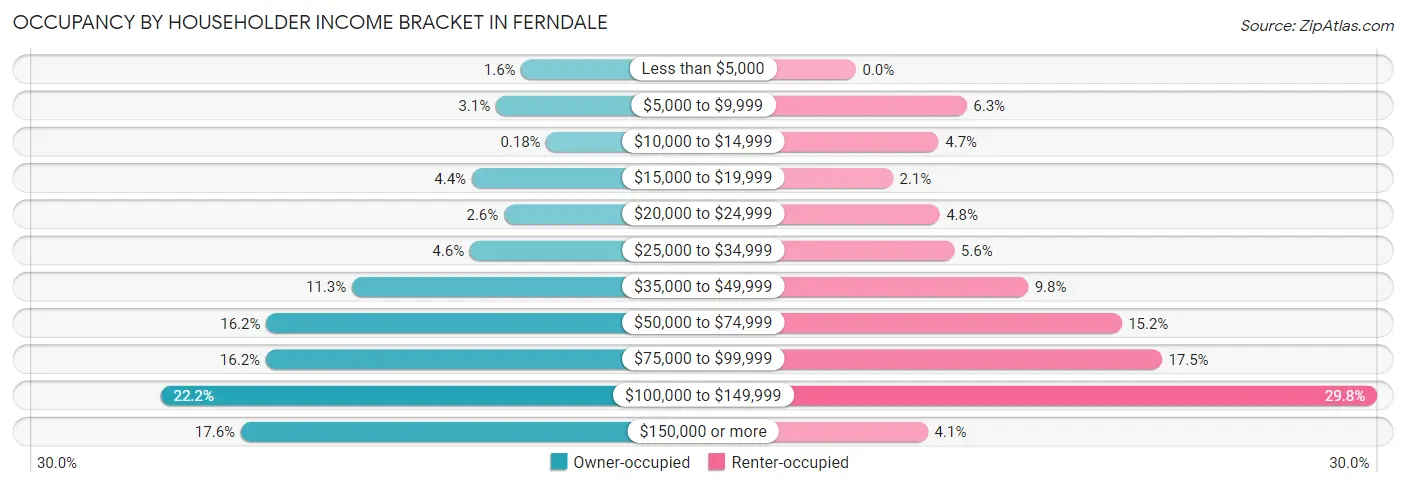
| Income Bracket | Owner-occupied | Renter-occupied |
| Less than $5,000 | 70 (1.6%) | 0 (0.0%) |
| $5,000 to $9,999 | 133 (3.1%) | 135 (6.3%) |
| $10,000 to $14,999 | 8 (0.2%) | 101 (4.7%) |
| $15,000 to $19,999 | 193 (4.4%) | 45 (2.1%) |
| $20,000 to $24,999 | 113 (2.6%) | 102 (4.8%) |
| $25,000 to $34,999 | 198 (4.5%) | 120 (5.6%) |
| $35,000 to $49,999 | 491 (11.3%) | 210 (9.8%) |
| $50,000 to $74,999 | 704 (16.2%) | 324 (15.2%) |
| $75,000 to $99,999 | 705 (16.2%) | 373 (17.5%) |
| $100,000 to $149,999 | 967 (22.2%) | 636 (29.8%) |
| $150,000 or more | 767 (17.6%) | 88 (4.1%) |
| Total | 4,349 (100.0%) | 2,134 (100.0%) |
Monthly Housing Cost Tiers in Ferndale
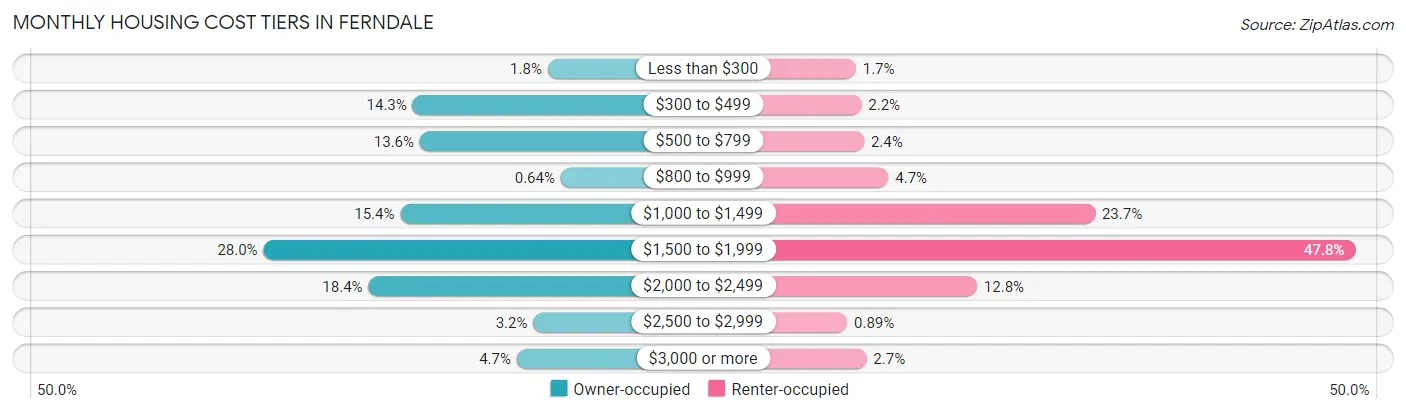
| Monthly Cost | Owner-occupied | Renter-occupied |
| Less than $300 | 80 (1.8%) | 36 (1.7%) |
| $300 to $499 | 621 (14.3%) | 47 (2.2%) |
| $500 to $799 | 592 (13.6%) | 52 (2.4%) |
| $800 to $999 | 28 (0.6%) | 100 (4.7%) |
| $1,000 to $1,499 | 670 (15.4%) | 506 (23.7%) |
| $1,500 to $1,999 | 1,218 (28.0%) | 1,019 (47.7%) |
| $2,000 to $2,499 | 798 (18.3%) | 274 (12.8%) |
| $2,500 to $2,999 | 138 (3.2%) | 19 (0.9%) |
| $3,000 or more | 204 (4.7%) | 57 (2.7%) |
| Total | 4,349 (100.0%) | 2,134 (100.0%) |
Physical Housing Characteristics in Ferndale
Housing Structures in Ferndale
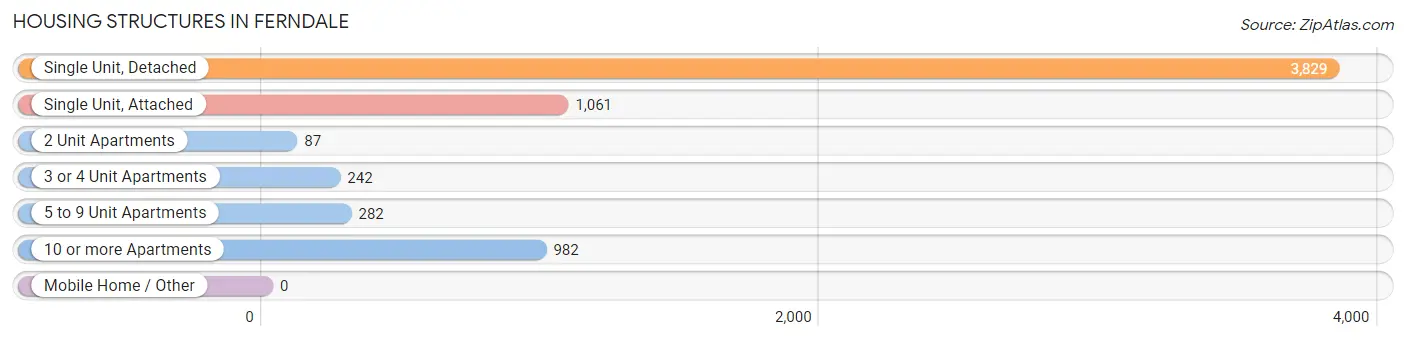
| Structure Type | # Housing Units | % Housing Units |
| Single Unit, Detached | 3,829 | 59.1% |
| Single Unit, Attached | 1,061 | 16.4% |
| 2 Unit Apartments | 87 | 1.3% |
| 3 or 4 Unit Apartments | 242 | 3.7% |
| 5 to 9 Unit Apartments | 282 | 4.3% |
| 10 or more Apartments | 982 | 15.1% |
| Mobile Home / Other | 0 | 0.0% |
| Total | 6,483 | 100.0% |
Housing Structures by Occupancy in Ferndale
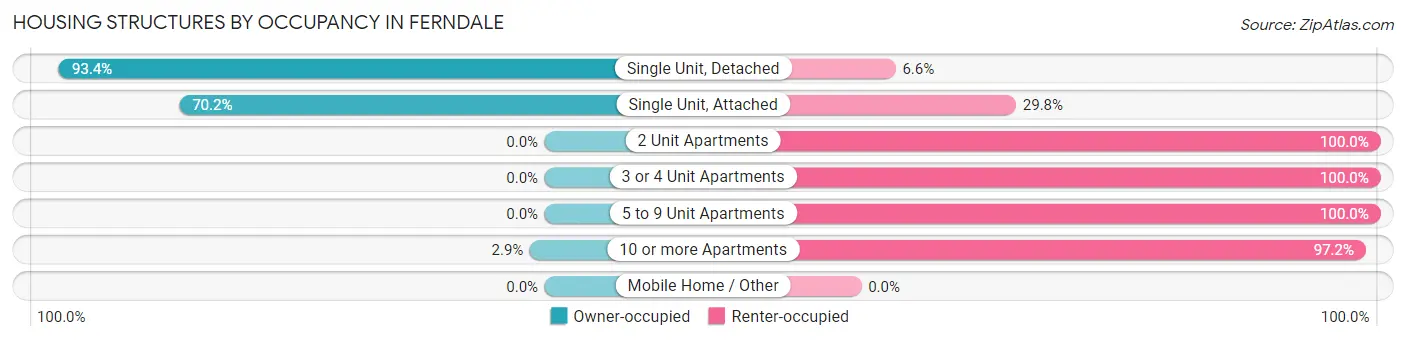
| Structure Type | Owner-occupied | Renter-occupied |
| Single Unit, Detached | 3,576 (93.4%) | 253 (6.6%) |
| Single Unit, Attached | 745 (70.2%) | 316 (29.8%) |
| 2 Unit Apartments | 0 (0.0%) | 87 (100.0%) |
| 3 or 4 Unit Apartments | 0 (0.0%) | 242 (100.0%) |
| 5 to 9 Unit Apartments | 0 (0.0%) | 282 (100.0%) |
| 10 or more Apartments | 28 (2.9%) | 954 (97.2%) |
| Mobile Home / Other | 0 (0.0%) | 0 (0.0%) |
| Total | 4,349 (67.1%) | 2,134 (32.9%) |
Housing Structures by Number of Rooms in Ferndale
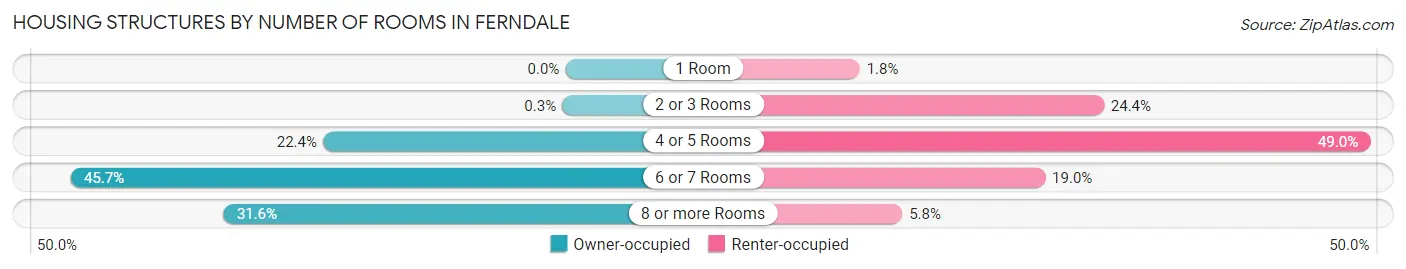
| Number of Rooms | Owner-occupied | Renter-occupied |
| 1 Room | 0 (0.0%) | 39 (1.8%) |
| 2 or 3 Rooms | 13 (0.3%) | 521 (24.4%) |
| 4 or 5 Rooms | 975 (22.4%) | 1,046 (49.0%) |
| 6 or 7 Rooms | 1,988 (45.7%) | 405 (19.0%) |
| 8 or more Rooms | 1,373 (31.6%) | 123 (5.8%) |
| Total | 4,349 (100.0%) | 2,134 (100.0%) |
Housing Structure by Heating Type in Ferndale
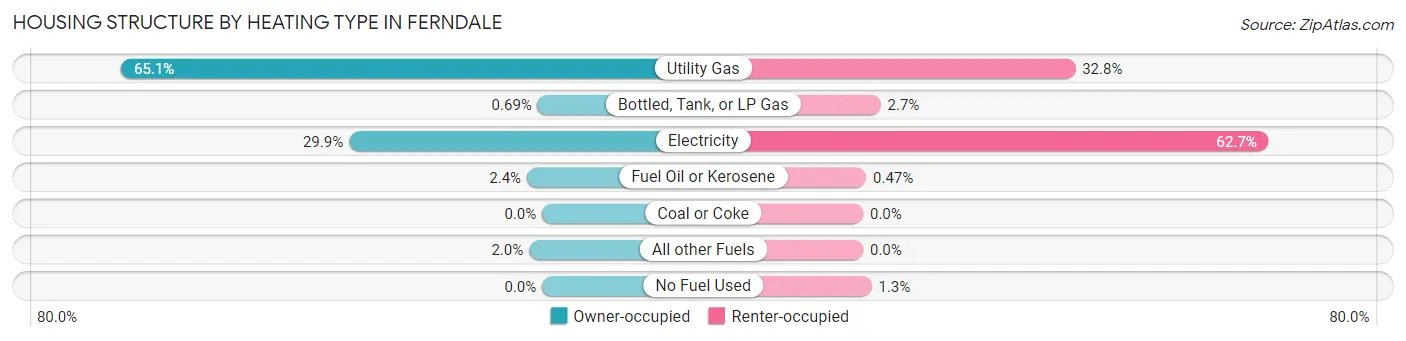
| Heating Type | Owner-occupied | Renter-occupied |
| Utility Gas | 2,831 (65.1%) | 700 (32.8%) |
| Bottled, Tank, or LP Gas | 30 (0.7%) | 58 (2.7%) |
| Electricity | 1,298 (29.8%) | 1,338 (62.7%) |
| Fuel Oil or Kerosene | 102 (2.4%) | 10 (0.5%) |
| Coal or Coke | 0 (0.0%) | 0 (0.0%) |
| All other Fuels | 88 (2.0%) | 0 (0.0%) |
| No Fuel Used | 0 (0.0%) | 28 (1.3%) |
| Total | 4,349 (100.0%) | 2,134 (100.0%) |
Household Vehicle Usage in Ferndale
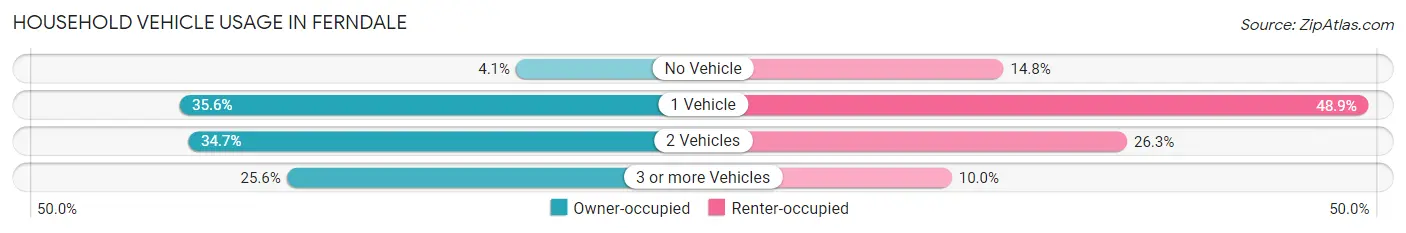
| Vehicles per Household | Owner-occupied | Renter-occupied |
| No Vehicle | 180 (4.1%) | 316 (14.8%) |
| 1 Vehicle | 1,547 (35.6%) | 1,043 (48.9%) |
| 2 Vehicles | 1,511 (34.7%) | 562 (26.3%) |
| 3 or more Vehicles | 1,111 (25.6%) | 213 (10.0%) |
| Total | 4,349 (100.0%) | 2,134 (100.0%) |
Real Estate & Mortgages in Ferndale
Real Estate and Mortgage Overview in Ferndale
| Characteristic | Without Mortgage | With Mortgage |
| Housing Units | 1,201 | 3,148 |
| Median Property Value | $287,400 | $317,000 |
| Median Household Income | $59,208 | $599 |
| Monthly Housing Costs | $475 | $204 |
| Real Estate Taxes | $2,378 | $128 |
Property Value by Mortgage Status in Ferndale
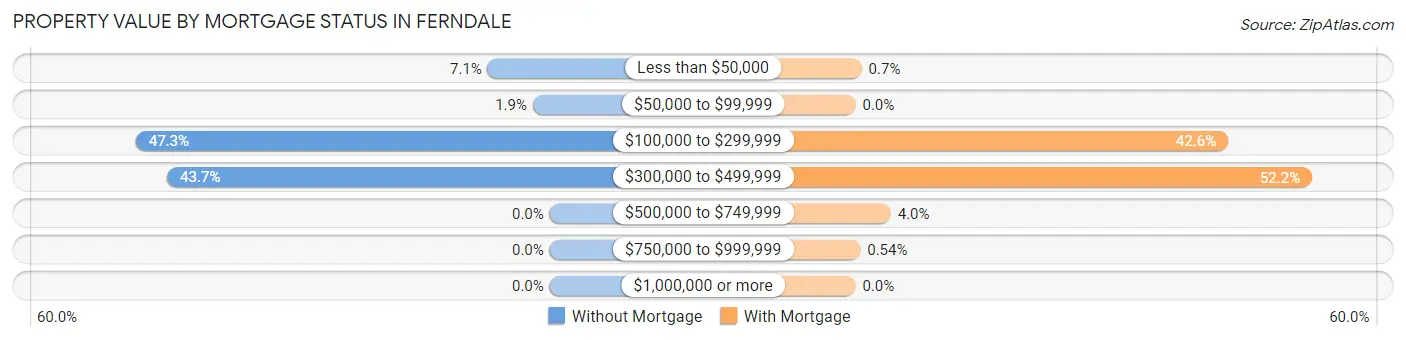
| Property Value | Without Mortgage | With Mortgage |
| Less than $50,000 | 85 (7.1%) | 22 (0.7%) |
| $50,000 to $99,999 | 23 (1.9%) | 0 (0.0%) |
| $100,000 to $299,999 | 568 (47.3%) | 1,340 (42.6%) |
| $300,000 to $499,999 | 525 (43.7%) | 1,642 (52.2%) |
| $500,000 to $749,999 | 0 (0.0%) | 127 (4.0%) |
| $750,000 to $999,999 | 0 (0.0%) | 17 (0.5%) |
| $1,000,000 or more | 0 (0.0%) | 0 (0.0%) |
| Total | 1,201 (100.0%) | 3,148 (100.0%) |
Household Income by Mortgage Status in Ferndale
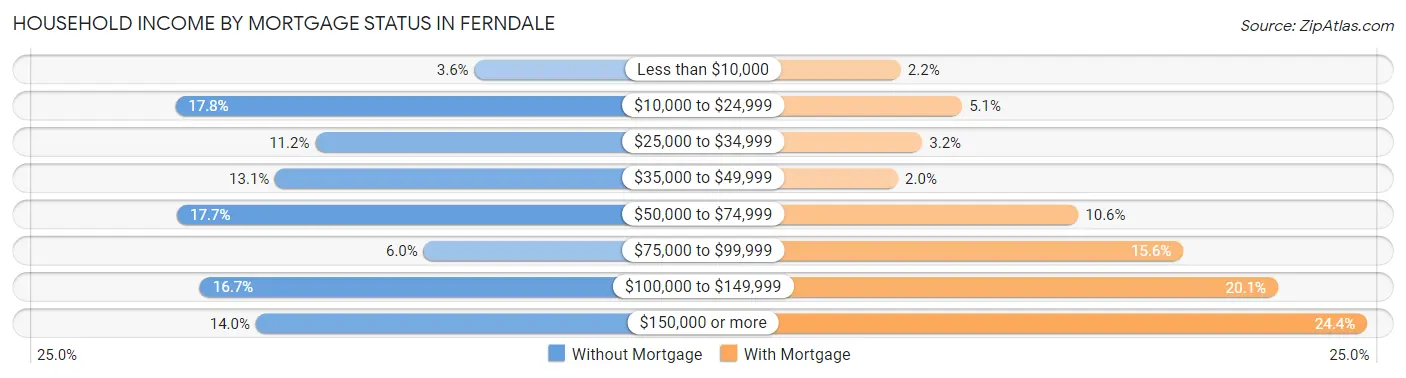
| Household Income | Without Mortgage | With Mortgage |
| Less than $10,000 | 43 (3.6%) | 68 (2.2%) |
| $10,000 to $24,999 | 214 (17.8%) | 160 (5.1%) |
| $25,000 to $34,999 | 134 (11.2%) | 100 (3.2%) |
| $35,000 to $49,999 | 157 (13.1%) | 64 (2.0%) |
| $50,000 to $74,999 | 213 (17.7%) | 334 (10.6%) |
| $75,000 to $99,999 | 72 (6.0%) | 491 (15.6%) |
| $100,000 to $149,999 | 200 (16.7%) | 633 (20.1%) |
| $150,000 or more | 168 (14.0%) | 767 (24.4%) |
| Total | 1,201 (100.0%) | 3,148 (100.0%) |
Property Value to Household Income Ratio in Ferndale
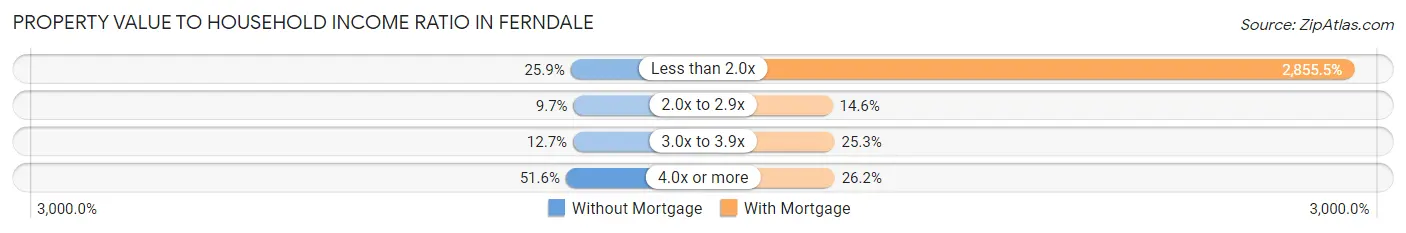
| Value-to-Income Ratio | Without Mortgage | With Mortgage |
| Less than 2.0x | 311 (25.9%) | 89,892 (2,855.5%) |
| 2.0x to 2.9x | 117 (9.7%) | 458 (14.5%) |
| 3.0x to 3.9x | 153 (12.7%) | 796 (25.3%) |
| 4.0x or more | 620 (51.6%) | 826 (26.2%) |
| Total | 1,201 (100.0%) | 3,148 (100.0%) |
Real Estate Taxes by Mortgage Status in Ferndale
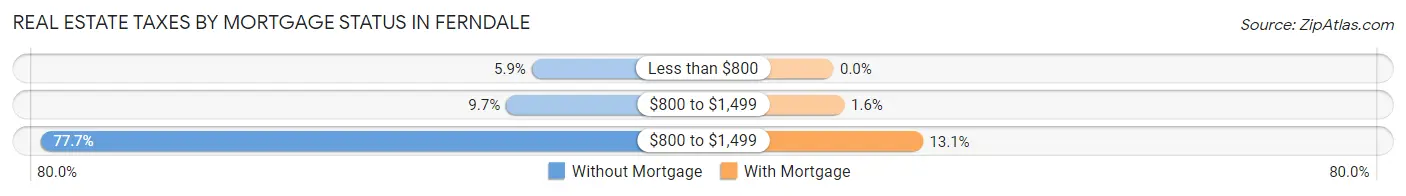
| Property Taxes | Without Mortgage | With Mortgage |
| Less than $800 | 71 (5.9%) | 0 (0.0%) |
| $800 to $1,499 | 116 (9.7%) | 51 (1.6%) |
| $800 to $1,499 | 933 (77.7%) | 411 (13.1%) |
| Total | 1,201 (100.0%) | 3,148 (100.0%) |
Health & Disability in Ferndale
Health Insurance Coverage by Age in Ferndale
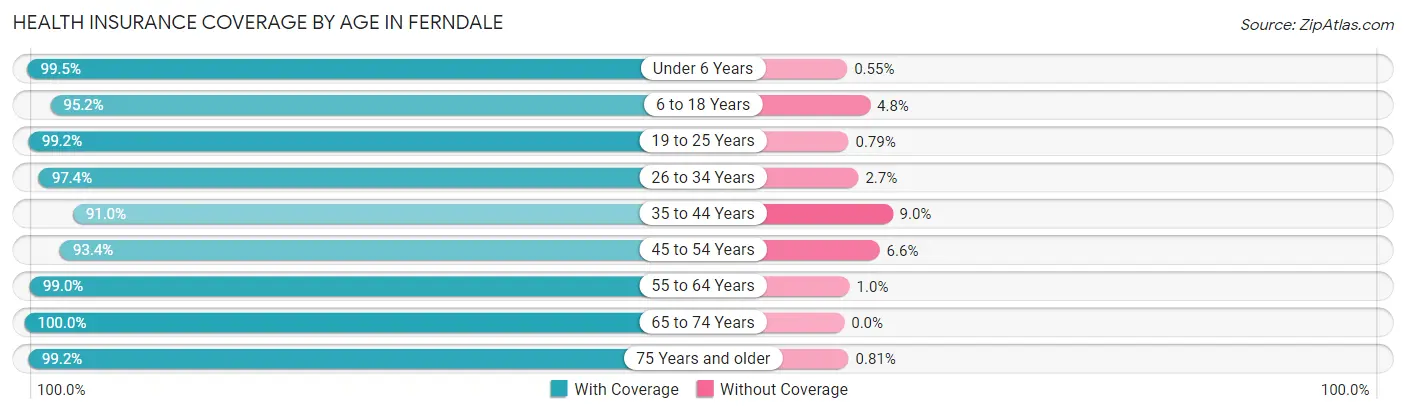
| Age Bracket | With Coverage | Without Coverage |
| Under 6 Years | 1,629 (99.5%) | 9 (0.5%) |
| 6 to 18 Years | 2,274 (95.2%) | 115 (4.8%) |
| 19 to 25 Years | 1,381 (99.2%) | 11 (0.8%) |
| 26 to 34 Years | 2,349 (97.4%) | 64 (2.6%) |
| 35 to 44 Years | 2,141 (91.0%) | 212 (9.0%) |
| 45 to 54 Years | 1,631 (93.4%) | 115 (6.6%) |
| 55 to 64 Years | 1,680 (99.0%) | 17 (1.0%) |
| 65 to 74 Years | 1,393 (100.0%) | 0 (0.0%) |
| 75 Years and older | 1,350 (99.2%) | 11 (0.8%) |
| Total | 15,828 (96.6%) | 554 (3.4%) |
Health Insurance Coverage by Citizenship Status in Ferndale
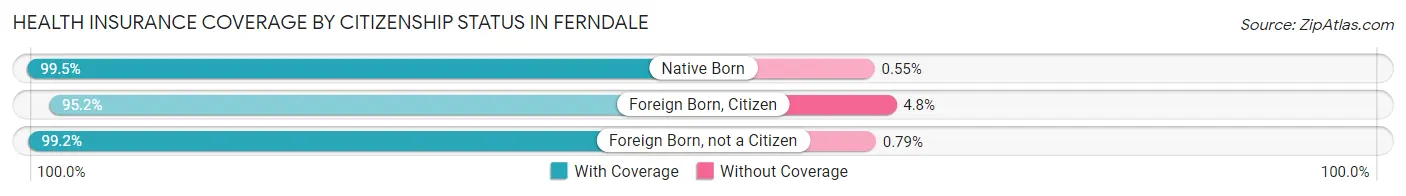
| Citizenship Status | With Coverage | Without Coverage |
| Native Born | 1,629 (99.5%) | 9 (0.5%) |
| Foreign Born, Citizen | 2,274 (95.2%) | 115 (4.8%) |
| Foreign Born, not a Citizen | 1,381 (99.2%) | 11 (0.8%) |
Health Insurance Coverage by Household Income in Ferndale
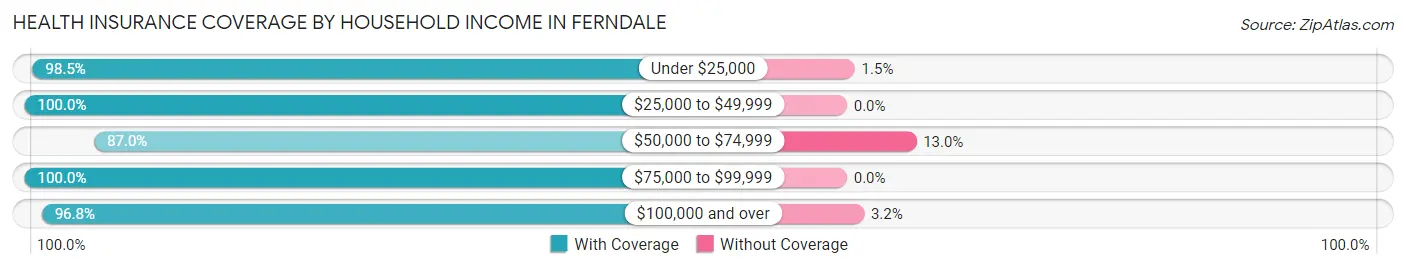
| Household Income | With Coverage | Without Coverage |
| Under $25,000 | 1,270 (98.5%) | 19 (1.5%) |
| $25,000 to $49,999 | 1,631 (100.0%) | 0 (0.0%) |
| $50,000 to $74,999 | 1,888 (87.0%) | 282 (13.0%) |
| $75,000 to $99,999 | 3,421 (100.0%) | 0 (0.0%) |
| $100,000 and over | 7,610 (96.8%) | 252 (3.2%) |
Public vs Private Health Insurance Coverage by Age in Ferndale
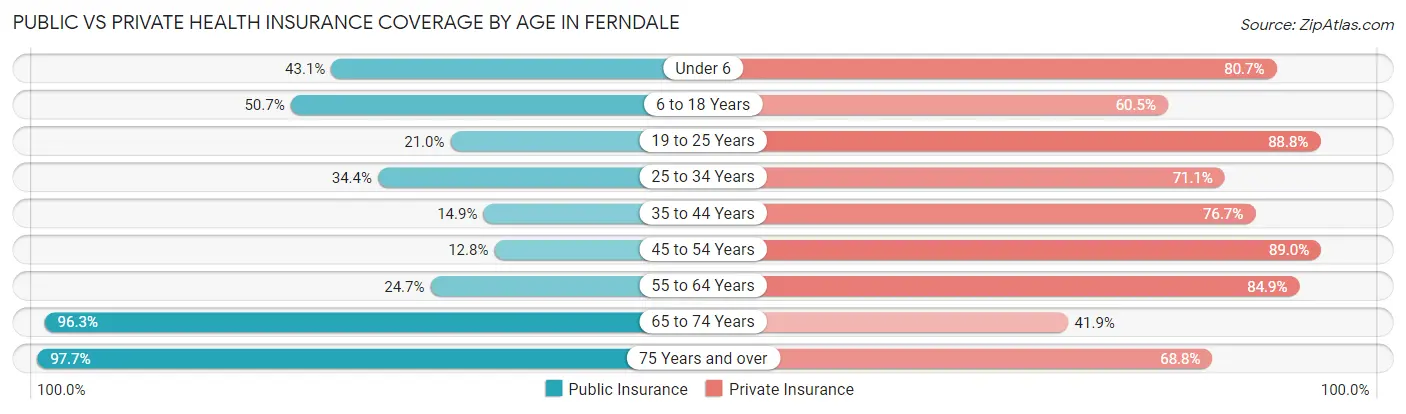
| Age Bracket | Public Insurance | Private Insurance |
| Under 6 | 706 (43.1%) | 1,321 (80.6%) |
| 6 to 18 Years | 1,210 (50.6%) | 1,445 (60.5%) |
| 19 to 25 Years | 292 (21.0%) | 1,236 (88.8%) |
| 25 to 34 Years | 831 (34.4%) | 1,715 (71.1%) |
| 35 to 44 Years | 350 (14.9%) | 1,805 (76.7%) |
| 45 to 54 Years | 224 (12.8%) | 1,553 (88.9%) |
| 55 to 64 Years | 419 (24.7%) | 1,441 (84.9%) |
| 65 to 74 Years | 1,341 (96.3%) | 584 (41.9%) |
| 75 Years and over | 1,329 (97.7%) | 936 (68.8%) |
| Total | 6,702 (40.9%) | 12,036 (73.5%) |
Disability Status by Sex by Age in Ferndale
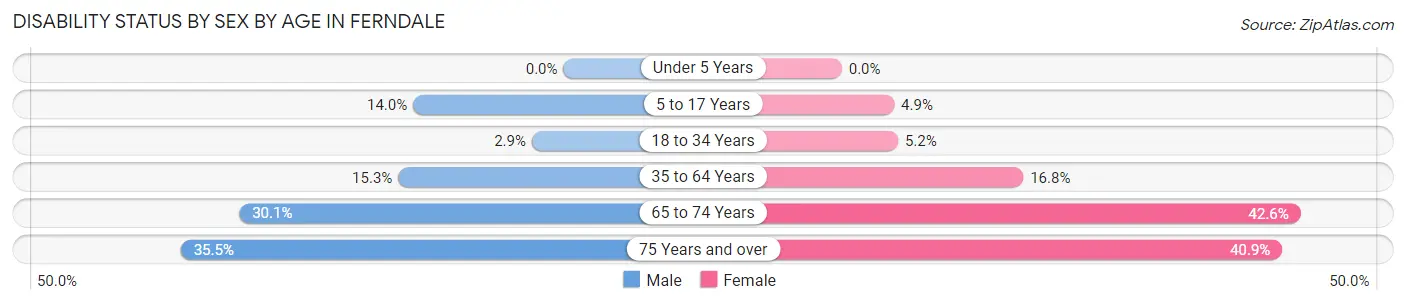
| Age Bracket | Male | Female |
| Under 5 Years | 0 (0.0%) | 0 (0.0%) |
| 5 to 17 Years | 207 (14.0%) | 51 (4.9%) |
| 18 to 34 Years | 54 (2.9%) | 111 (5.2%) |
| 35 to 64 Years | 455 (15.3%) | 476 (16.8%) |
| 65 to 74 Years | 200 (30.1%) | 310 (42.6%) |
| 75 Years and over | 207 (35.5%) | 318 (40.9%) |
Disability Class by Sex by Age in Ferndale
Disability Class: Hearing Difficulty
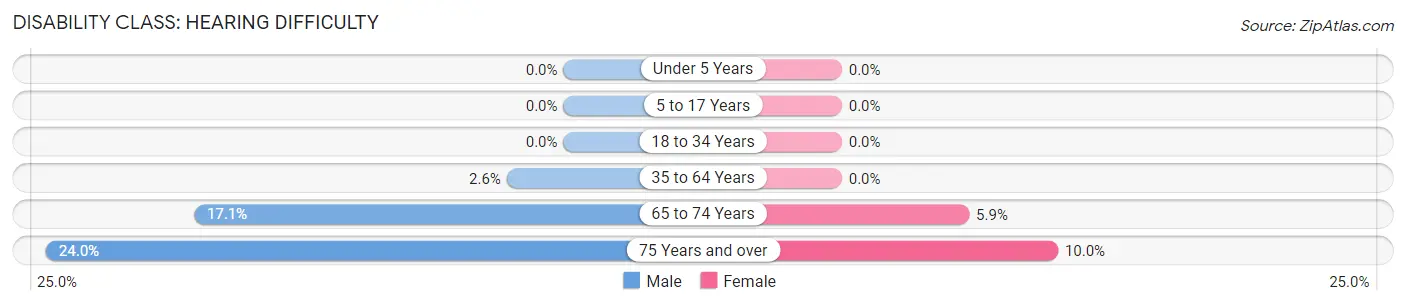
| Age Bracket | Male | Female |
| Under 5 Years | 0 (0.0%) | 0 (0.0%) |
| 5 to 17 Years | 0 (0.0%) | 0 (0.0%) |
| 18 to 34 Years | 0 (0.0%) | 0 (0.0%) |
| 35 to 64 Years | 78 (2.6%) | 0 (0.0%) |
| 65 to 74 Years | 114 (17.1%) | 43 (5.9%) |
| 75 Years and over | 140 (24.0%) | 78 (10.0%) |
Disability Class: Vision Difficulty
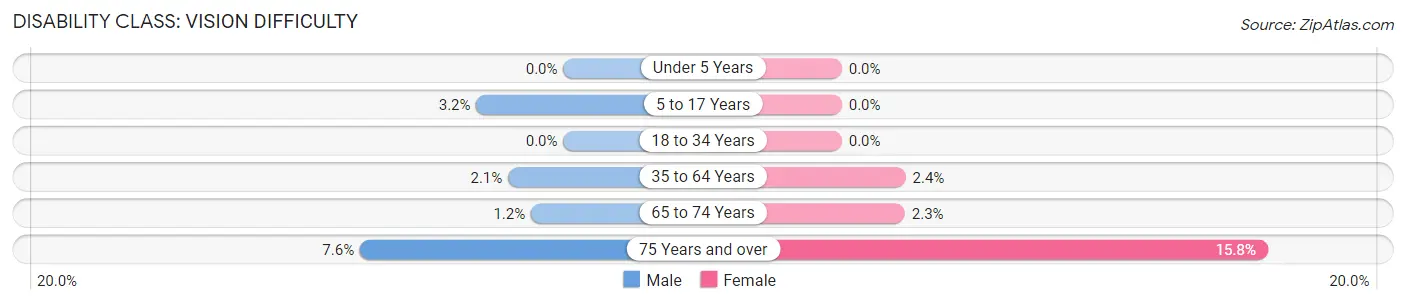
| Age Bracket | Male | Female |
| Under 5 Years | 0 (0.0%) | 0 (0.0%) |
| 5 to 17 Years | 48 (3.2%) | 0 (0.0%) |
| 18 to 34 Years | 0 (0.0%) | 0 (0.0%) |
| 35 to 64 Years | 61 (2.1%) | 67 (2.4%) |
| 65 to 74 Years | 8 (1.2%) | 17 (2.3%) |
| 75 Years and over | 44 (7.5%) | 123 (15.8%) |
Disability Class: Cognitive Difficulty
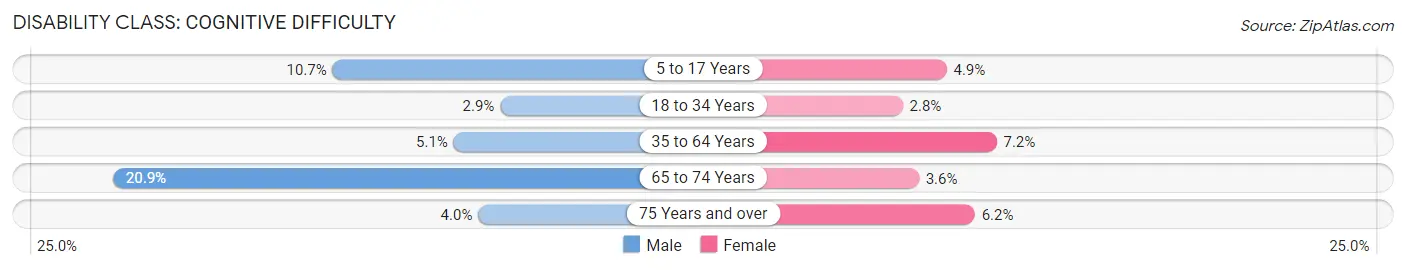
| Age Bracket | Male | Female |
| 5 to 17 Years | 159 (10.7%) | 51 (4.9%) |
| 18 to 34 Years | 54 (2.9%) | 60 (2.8%) |
| 35 to 64 Years | 151 (5.1%) | 203 (7.2%) |
| 65 to 74 Years | 139 (20.9%) | 26 (3.6%) |
| 75 Years and over | 23 (4.0%) | 48 (6.2%) |
Disability Class: Ambulatory Difficulty
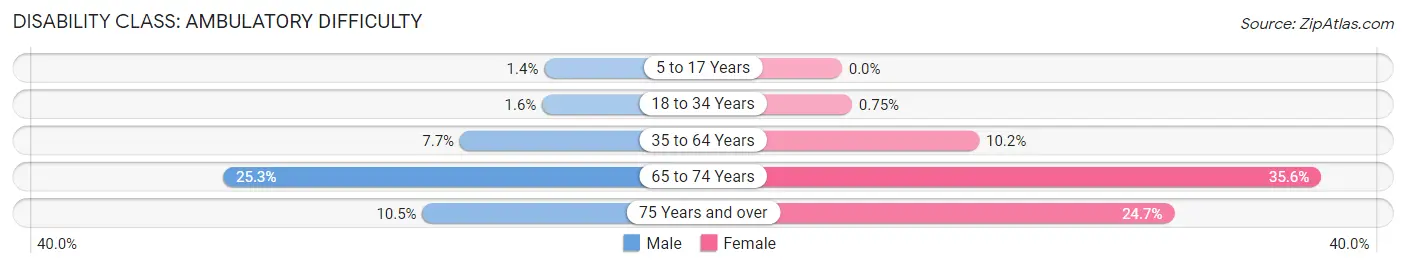
| Age Bracket | Male | Female |
| 5 to 17 Years | 21 (1.4%) | 0 (0.0%) |
| 18 to 34 Years | 29 (1.6%) | 16 (0.7%) |
| 35 to 64 Years | 228 (7.7%) | 288 (10.2%) |
| 65 to 74 Years | 168 (25.3%) | 259 (35.6%) |
| 75 Years and over | 61 (10.5%) | 192 (24.7%) |
Disability Class: Self-Care Difficulty
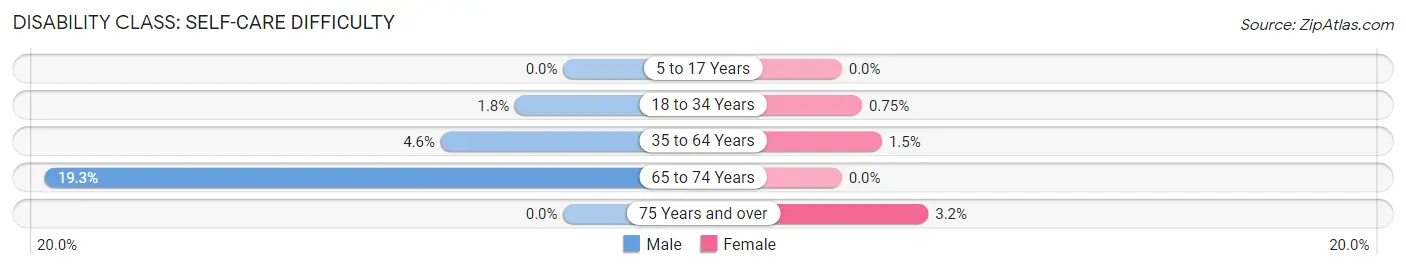
| Age Bracket | Male | Female |
| 5 to 17 Years | 0 (0.0%) | 0 (0.0%) |
| 18 to 34 Years | 33 (1.8%) | 16 (0.7%) |
| 35 to 64 Years | 135 (4.5%) | 42 (1.5%) |
| 65 to 74 Years | 128 (19.3%) | 0 (0.0%) |
| 75 Years and over | 0 (0.0%) | 25 (3.2%) |
Technology Access in Ferndale
Computing Device Access in Ferndale
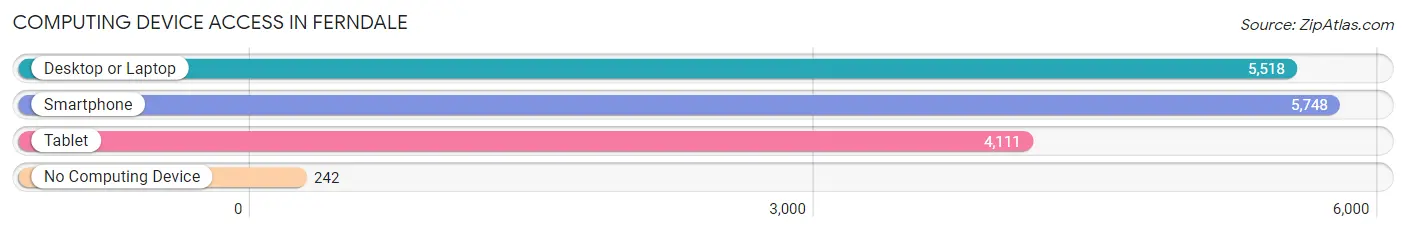
| Device Type | # Households | % Households |
| Desktop or Laptop | 5,518 | 85.1% |
| Smartphone | 5,748 | 88.7% |
| Tablet | 4,111 | 63.4% |
| No Computing Device | 242 | 3.7% |
| Total | 6,483 | 100.0% |
Internet Access in Ferndale
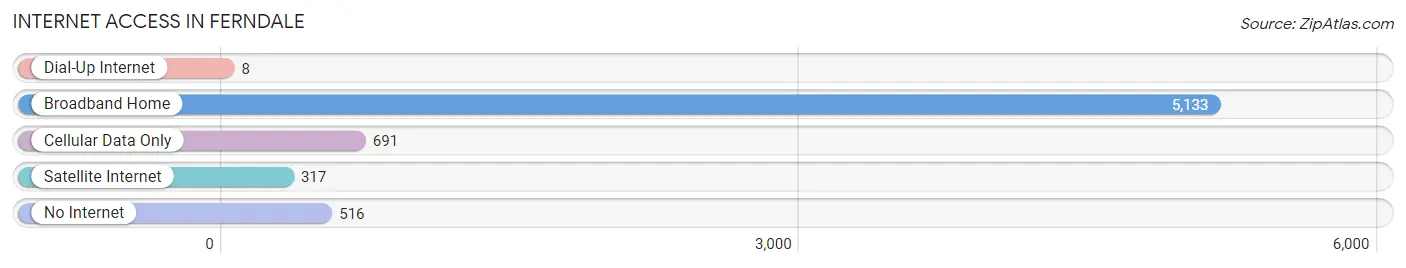
| Internet Type | # Households | % Households |
| Dial-Up Internet | 8 | 0.1% |
| Broadband Home | 5,133 | 79.2% |
| Cellular Data Only | 691 | 10.7% |
| Satellite Internet | 317 | 4.9% |
| No Internet | 516 | 8.0% |
| Total | 6,483 | 100.0% |
Ferndale Summary
Ferndale, Maryland is a small town located in Anne Arundel County, Maryland. It is situated on the banks of the Patapsco River, just south of Baltimore. The town has a population of approximately 4,000 people and is part of the Baltimore-Washington metropolitan area.
History
Ferndale was first settled in the early 1700s by English settlers. The town was originally known as “Fern Dale” and was part of the larger area known as “Fern Dale Hundred”. The town was officially incorporated in 1891 and was named after the abundance of ferns in the area.
In the late 1800s, the town was a popular summer resort destination for wealthy Baltimoreans. The town was known for its beautiful scenery and its many resorts and hotels. The town also had a thriving fishing industry, with many of the town’s residents working as fishermen.
In the early 1900s, the town began to decline in popularity as a resort destination. The town’s economy shifted to focus on manufacturing and industry. The town was home to several factories, including a paper mill, a cannery, and a brickyard.
Geography
Ferndale is located in Anne Arundel County, Maryland. The town is situated on the banks of the Patapsco River, just south of Baltimore. The town is bordered by the towns of Brooklyn Park, Linthicum, and Glen Burnie.
The town has a total area of 1.3 square miles, all of which is land. The town is located at an elevation of approximately 20 feet above sea level. The town is located in a humid subtropical climate zone, with hot, humid summers and mild winters.
Economy
Ferndale’s economy is largely based on manufacturing and industry. The town is home to several factories, including a paper mill, a cannery, and a brickyard. The town is also home to several small businesses, including restaurants, retail stores, and service providers.
The town is also home to several government agencies, including the Anne Arundel County Police Department and the Anne Arundel County Fire Department. The town is also home to a branch of the Anne Arundel County Public Library.
Demographics
As of the 2010 census, Ferndale had a population of 4,000 people. The town has a population density of 3,000 people per square mile. The town is approximately 75% white, 15% African American, and 5% Hispanic. The median household income in the town is $50,000.
Conclusion
Ferndale, Maryland is a small town located in Anne Arundel County, Maryland. The town has a population of approximately 4,000 people and is part of the Baltimore-Washington metropolitan area. The town was first settled in the early 1700s and was officially incorporated in 1891. The town’s economy is largely based on manufacturing and industry, and the town is home to several government agencies. As of the 2010 census, Ferndale had a population of 4,000 people, with a population density of 3,000 people per square mile. The town is approximately 75% white, 15% African American, and 5% Hispanic. The median household income in the town is $50,000.
Common Questions
What is Per Capita Income in Ferndale?
Per Capita income in Ferndale is $36,003.
What is the Median Family Income in Ferndale?
Median Family Income in Ferndale is $98,750.
What is the Median Household income in Ferndale?
Median Household Income in Ferndale is $82,347.
What is Income or Wage Gap in Ferndale?
Income or Wage Gap in Ferndale is 22.5%.
Women in Ferndale earn 77.5 cents for every dollar earned by a man.
What is Family Income Deficit in Ferndale?
Family Income Deficit in Ferndale is $13,235.
Families that are below poverty line in Ferndale earn $13,235 less on average than the poverty threshold level.
What is Inequality or Gini Index in Ferndale?
Inequality or Gini Index in Ferndale is 0.38.
What is the Total Population of Ferndale?
Total Population of Ferndale is 16,669.
What is the Total Male Population of Ferndale?
Total Male Population of Ferndale is 8,185.
What is the Total Female Population of Ferndale?
Total Female Population of Ferndale is 8,484.
What is the Ratio of Males per 100 Females in Ferndale?
There are 96.48 Males per 100 Females in Ferndale.
What is the Ratio of Females per 100 Males in Ferndale?
There are 103.65 Females per 100 Males in Ferndale.
What is the Median Population Age in Ferndale?
Median Population Age in Ferndale is 35.8 Years.
What is the Average Family Size in Ferndale
Average Family Size in Ferndale is 3.1 People.
What is the Average Household Size in Ferndale
Average Household Size in Ferndale is 2.6 People.
How Large is the Labor Force in Ferndale?
There are 9,176 People in the Labor Forcein in Ferndale.
What is the Percentage of People in the Labor Force in Ferndale?
70.1% of People are in the Labor Force in Ferndale.
What is the Unemployment Rate in Ferndale?
Unemployment Rate in Ferndale is 6.2%.