Eckhart Mines, MD Map & Demographics
Eckhart Mines Map
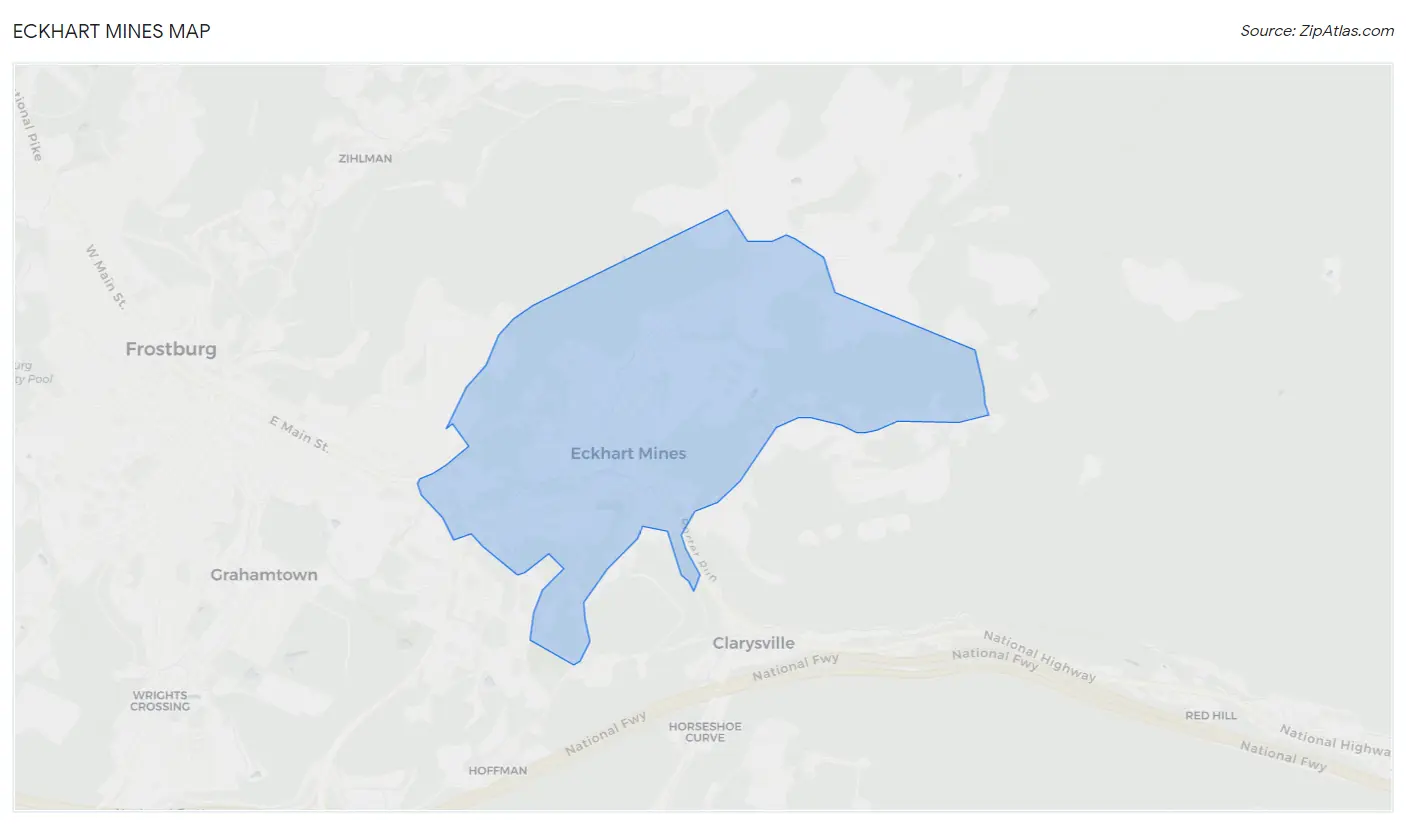
Eckhart Mines Overview
$20,535
PER CAPITA INCOME
$52,366
AVG FAMILY INCOME
$50,804
AVG HOUSEHOLD INCOME
27.2%
WAGE / INCOME GAP [ % ]
72.8¢/ $1
WAGE / INCOME GAP [ $ ]
0.38
INEQUALITY / GINI INDEX
514
TOTAL POPULATION
284
MALE POPULATION
230
FEMALE POPULATION
123.48
MALES / 100 FEMALES
80.99
FEMALES / 100 MALES
48.2
MEDIAN AGE
3.0
AVG FAMILY SIZE
2.6
AVG HOUSEHOLD SIZE
216
LABOR FORCE [ PEOPLE ]
53.5%
PERCENT IN LABOR FORCE
9.3%
UNEMPLOYMENT RATE
Eckhart Mines Area Codes
Income in Eckhart Mines
Income Overview in Eckhart Mines
Per Capita Income in Eckhart Mines is $20,535, while median incomes of families and households are $52,366 and $50,804 respectively.
| Characteristic | Number | Measure |
| Per Capita Income | 514 | $20,535 |
| Median Family Income | 159 | $52,366 |
| Mean Family Income | 159 | $61,015 |
| Median Household Income | 194 | $50,804 |
| Mean Household Income | 194 | $50,855 |
| Income Deficit | 159 | $0 |
| Wage / Income Gap (%) | 514 | 27.18% |
| Wage / Income Gap ($) | 514 | 72.82¢ per $1 |
| Gini / Inequality Index | 514 | 0.38 |
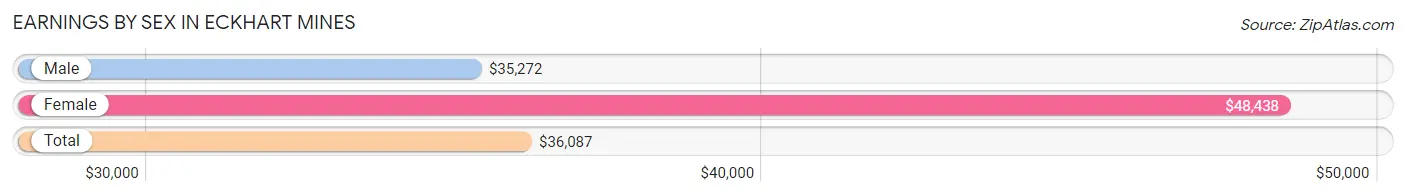
Earnings by Sex in Eckhart Mines
Average Earnings in Eckhart Mines are $36,087, $35,272 for men and $48,438 for women, a difference of 27.2%.
| Sex | Number | Average Earnings |
| Male | 157 (80.1%) | $35,272 |
| Female | 39 (19.9%) | $48,438 |
| Total | 196 (100.0%) | $36,087 |
Earnings by Sex by Income Bracket in Eckhart Mines
The most common earnings brackets in Eckhart Mines are $30,000 to $34,999 for men (58 | 36.9%) and $45,000 to $49,999 for women (20 | 51.3%).

| Income | Male | Female |
| $2,499 or less | 18 (11.5%) | 0 (0.0%) |
| $2,500 to $4,999 | 0 (0.0%) | 0 (0.0%) |
| $5,000 to $7,499 | 0 (0.0%) | 0 (0.0%) |
| $7,500 to $9,999 | 0 (0.0%) | 0 (0.0%) |
| $10,000 to $12,499 | 0 (0.0%) | 0 (0.0%) |
| $12,500 to $14,999 | 0 (0.0%) | 0 (0.0%) |
| $15,000 to $17,499 | 0 (0.0%) | 0 (0.0%) |
| $17,500 to $19,999 | 0 (0.0%) | 0 (0.0%) |
| $20,000 to $22,499 | 0 (0.0%) | 0 (0.0%) |
| $22,500 to $24,999 | 0 (0.0%) | 0 (0.0%) |
| $25,000 to $29,999 | 0 (0.0%) | 0 (0.0%) |
| $30,000 to $34,999 | 58 (36.9%) | 12 (30.8%) |
| $35,000 to $39,999 | 23 (14.6%) | 0 (0.0%) |
| $40,000 to $44,999 | 0 (0.0%) | 0 (0.0%) |
| $45,000 to $49,999 | 0 (0.0%) | 20 (51.3%) |
| $50,000 to $54,999 | 34 (21.7%) | 0 (0.0%) |
| $55,000 to $64,999 | 0 (0.0%) | 0 (0.0%) |
| $65,000 to $74,999 | 24 (15.3%) | 0 (0.0%) |
| $75,000 to $99,999 | 0 (0.0%) | 7 (17.9%) |
| $100,000+ | 0 (0.0%) | 0 (0.0%) |
| Total | 157 (100.0%) | 39 (100.0%) |
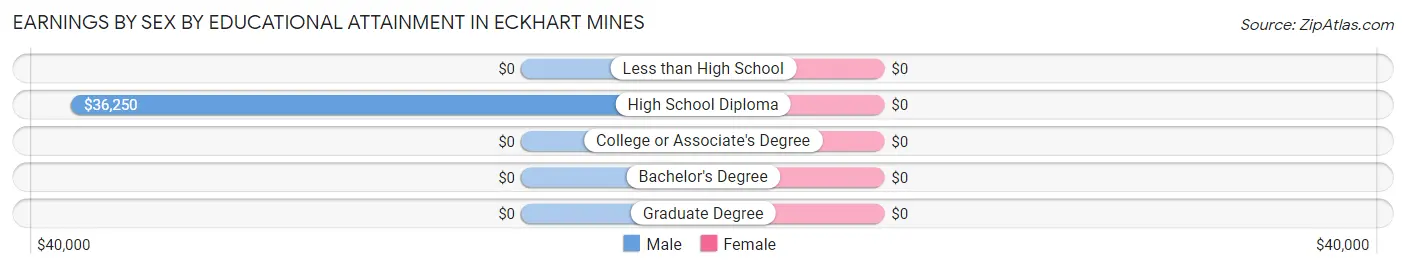
Earnings by Sex by Educational Attainment in Eckhart Mines
| Educational Attainment | Male Income | Female Income |
| Less than High School | - | - |
| High School Diploma | $36,250 | $0 |
| College or Associate's Degree | - | - |
| Bachelor's Degree | - | - |
| Graduate Degree | - | - |
| Total | $36,250 | $48,438 |
Family Income in Eckhart Mines
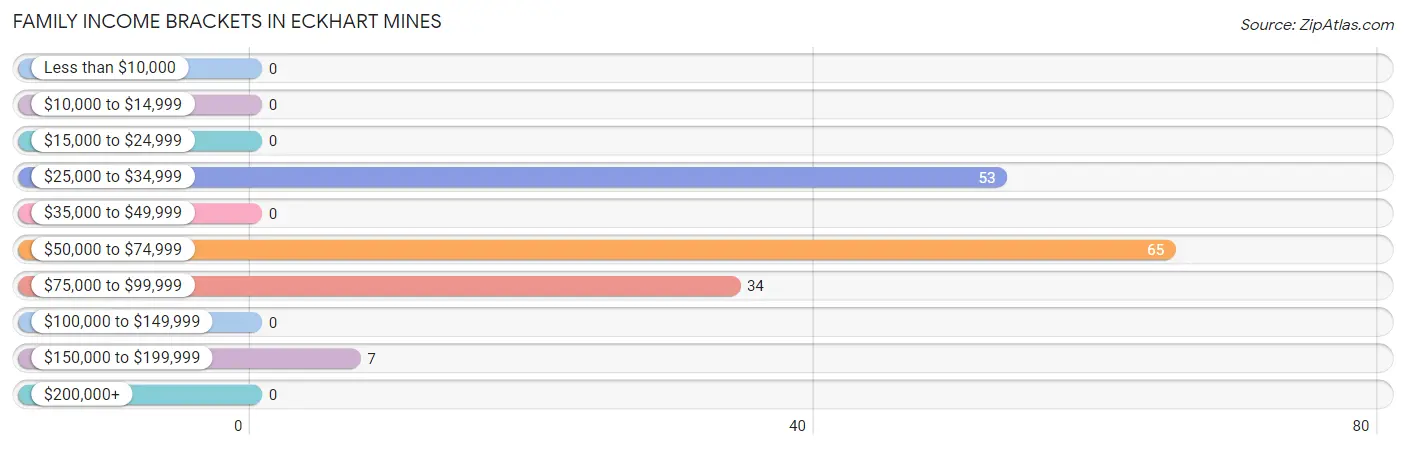
Family Income Brackets in Eckhart Mines
According to the Eckhart Mines family income data, there are 65 families falling into the $50,000 to $74,999 income range, which is the most common income bracket and makes up 40.9% of all families.
| Income Bracket | # Families | % Families |
| Less than $10,000 | 0 | 0.0% |
| $10,000 to $14,999 | 0 | 0.0% |
| $15,000 to $24,999 | 0 | 0.0% |
| $25,000 to $34,999 | 53 | 33.3% |
| $35,000 to $49,999 | 0 | 0.0% |
| $50,000 to $74,999 | 65 | 40.9% |
| $75,000 to $99,999 | 34 | 21.4% |
| $100,000 to $149,999 | 0 | 0.0% |
| $150,000 to $199,999 | 7 | 4.4% |
| $200,000+ | 0 | 0.0% |
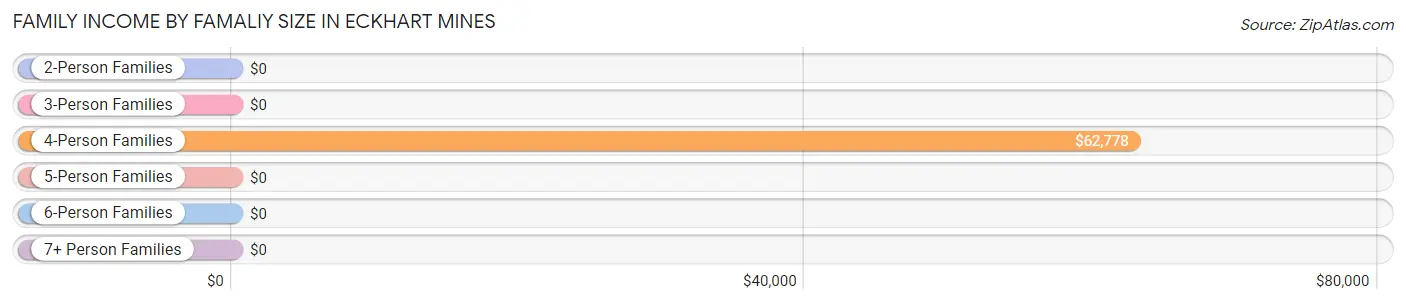
Family Income by Famaliy Size in Eckhart Mines
4-person families (60 | 37.7%) account for the highest median family income in Eckhart Mines with $62,778 per family, while 4-person families (60 | 37.7%) have the highest median income of $15,694 per family member.
| Income Bracket | # Families | Median Income |
| 2-Person Families | 79 (49.7%) | $0 |
| 3-Person Families | 20 (12.6%) | $0 |
| 4-Person Families | 60 (37.7%) | $62,778 |
| 5-Person Families | 0 (0.0%) | $0 |
| 6-Person Families | 0 (0.0%) | $0 |
| 7+ Person Families | 0 (0.0%) | $0 |
| Total | 159 (100.0%) | $52,366 |
Family Income by Number of Earners in Eckhart Mines
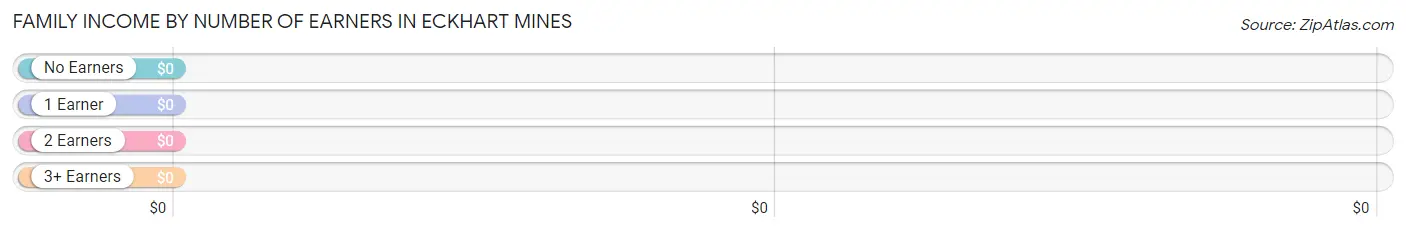
| Number of Earners | # Families | Median Income |
| No Earners | 37 (23.3%) | $0 |
| 1 Earner | 81 (50.9%) | $0 |
| 2 Earners | 21 (13.2%) | $0 |
| 3+ Earners | 20 (12.6%) | $0 |
| Total | 159 (100.0%) | $52,366 |
Household Income in Eckhart Mines
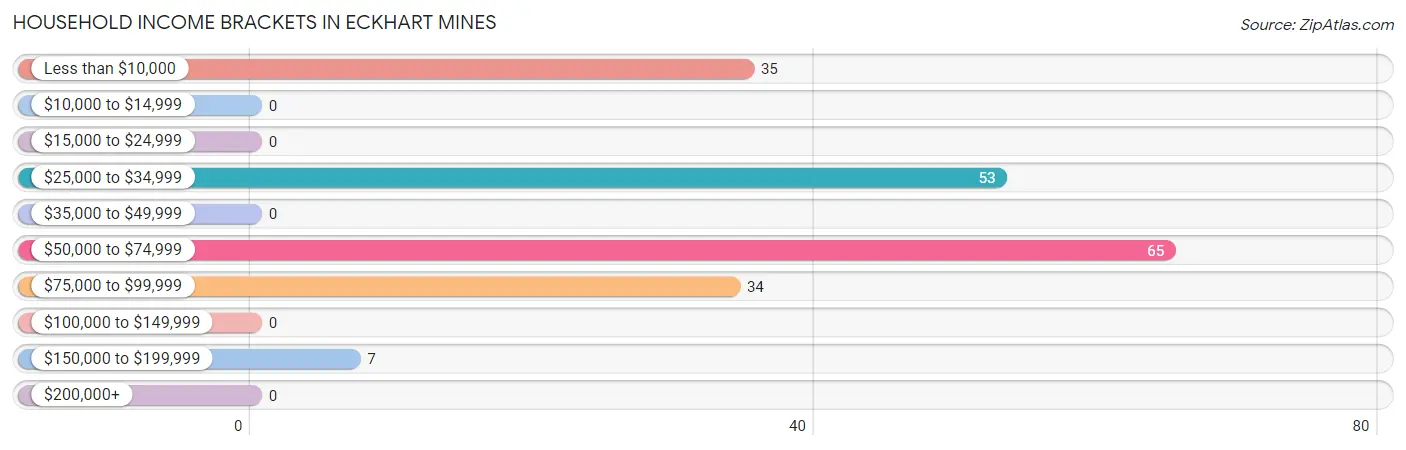
Household Income Brackets in Eckhart Mines
With 65 households falling in the category, the $50,000 to $74,999 income range is the most frequent in Eckhart Mines, accounting for 33.5% of all households.
| Income Bracket | # Households | % Households |
| Less than $10,000 | 35 | 18.0% |
| $10,000 to $14,999 | 0 | 0.0% |
| $15,000 to $24,999 | 0 | 0.0% |
| $25,000 to $34,999 | 53 | 27.3% |
| $35,000 to $49,999 | 0 | 0.0% |
| $50,000 to $74,999 | 65 | 33.5% |
| $75,000 to $99,999 | 34 | 17.5% |
| $100,000 to $149,999 | 0 | 0.0% |
| $150,000 to $199,999 | 7 | 3.6% |
| $200,000+ | 0 | 0.0% |
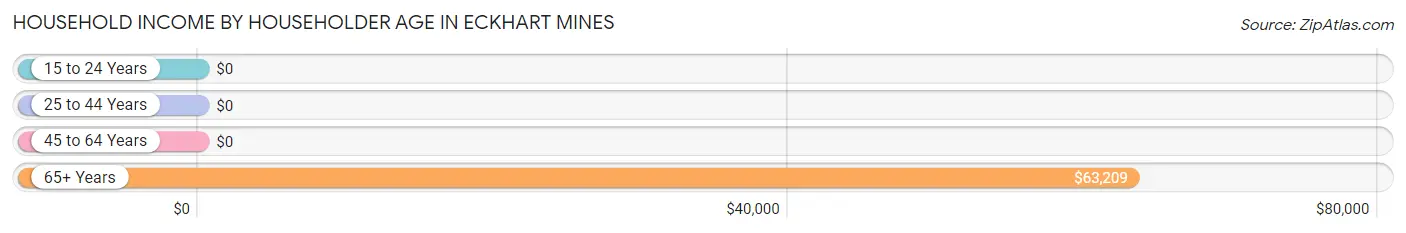
Household Income by Householder Age in Eckhart Mines
The median household income in Eckhart Mines is $50,804, with the highest median household income of $63,209 found in the 65+ years age bracket for the primary householder. A total of 53 households (27.3%) fall into this category. Meanwhile, the 15 to 24 years age bracket for the primary householder has the lowest median household income of $0, with 28 households (14.4%) in this group.
| Income Bracket | # Households | Median Income |
| 15 to 24 Years | 28 (14.4%) | $0 |
| 25 to 44 Years | 21 (10.8%) | $0 |
| 45 to 64 Years | 92 (47.4%) | $0 |
| 65+ Years | 53 (27.3%) | $63,209 |
| Total | 194 (100.0%) | $50,804 |
Poverty in Eckhart Mines
Income Below Poverty by Sex and Age in Eckhart Mines
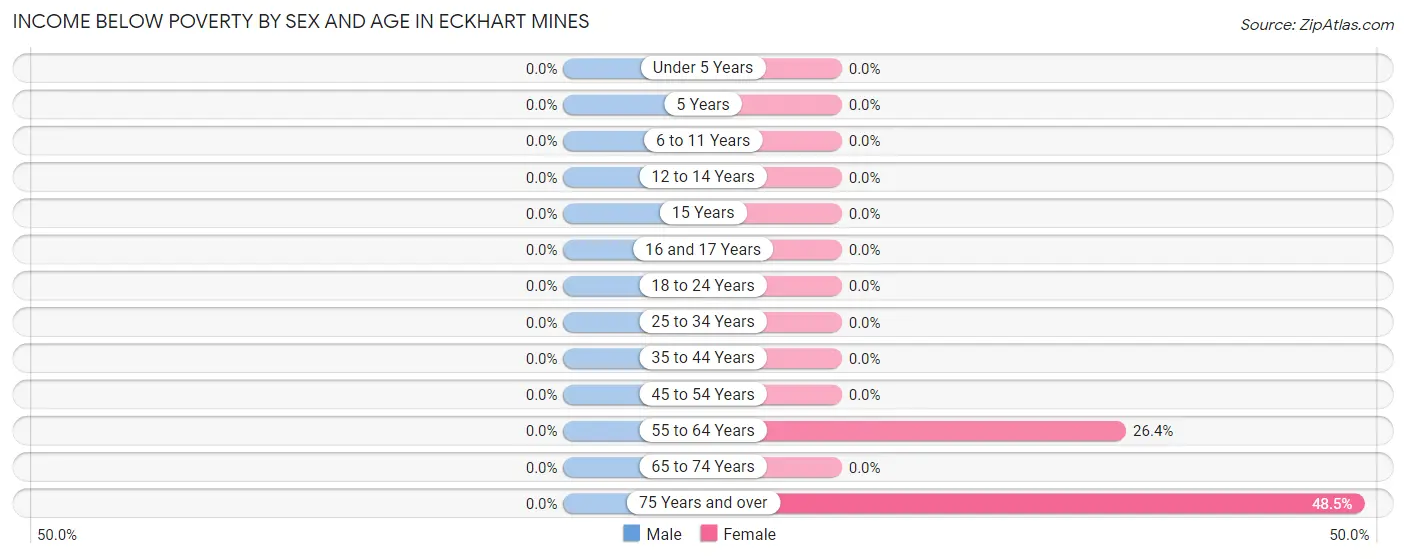
| Age Bracket | Male | Female |
| Under 5 Years | 0 (0.0%) | 0 (0.0%) |
| 5 Years | 0 (0.0%) | 0 (0.0%) |
| 6 to 11 Years | 0 (0.0%) | 0 (0.0%) |
| 12 to 14 Years | 0 (0.0%) | 0 (0.0%) |
| 15 Years | 0 (0.0%) | 0 (0.0%) |
| 16 and 17 Years | 0 (0.0%) | 0 (0.0%) |
| 18 to 24 Years | 0 (0.0%) | 0 (0.0%) |
| 25 to 34 Years | 0 (0.0%) | 0 (0.0%) |
| 35 to 44 Years | 0 (0.0%) | 0 (0.0%) |
| 45 to 54 Years | 0 (0.0%) | 0 (0.0%) |
| 55 to 64 Years | 0 (0.0%) | 19 (26.4%) |
| 65 to 74 Years | 0 (0.0%) | 0 (0.0%) |
| 75 Years and over | 0 (0.0%) | 16 (48.5%) |
| Total | 0 (0.0%) | 35 (15.2%) |
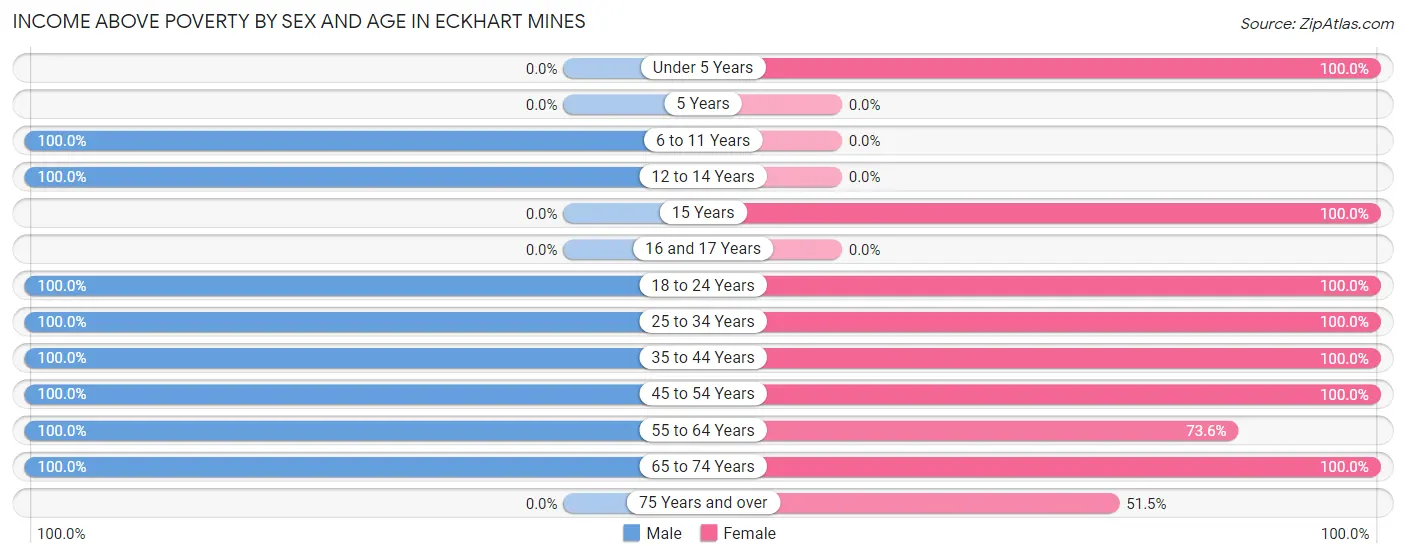
Income Above Poverty by Sex and Age in Eckhart Mines
According to the poverty statistics in Eckhart Mines, males aged 6 to 11 years and females aged under 5 years are the age groups that are most secure financially, with 100.0% of males and 100.0% of females in these age groups living above the poverty line.
| Age Bracket | Male | Female |
| Under 5 Years | 0 (0.0%) | 26 (100.0%) |
| 5 Years | 0 (0.0%) | 0 (0.0%) |
| 6 to 11 Years | 29 (100.0%) | 0 (0.0%) |
| 12 to 14 Years | 41 (100.0%) | 0 (0.0%) |
| 15 Years | 0 (0.0%) | 14 (100.0%) |
| 16 and 17 Years | 0 (0.0%) | 0 (0.0%) |
| 18 to 24 Years | 18 (100.0%) | 28 (100.0%) |
| 25 to 34 Years | 34 (100.0%) | 7 (100.0%) |
| 35 to 44 Years | 44 (100.0%) | 12 (100.0%) |
| 45 to 54 Years | 23 (100.0%) | 20 (100.0%) |
| 55 to 64 Years | 58 (100.0%) | 53 (73.6%) |
| 65 to 74 Years | 37 (100.0%) | 18 (100.0%) |
| 75 Years and over | 0 (0.0%) | 17 (51.5%) |
| Total | 284 (100.0%) | 195 (84.8%) |
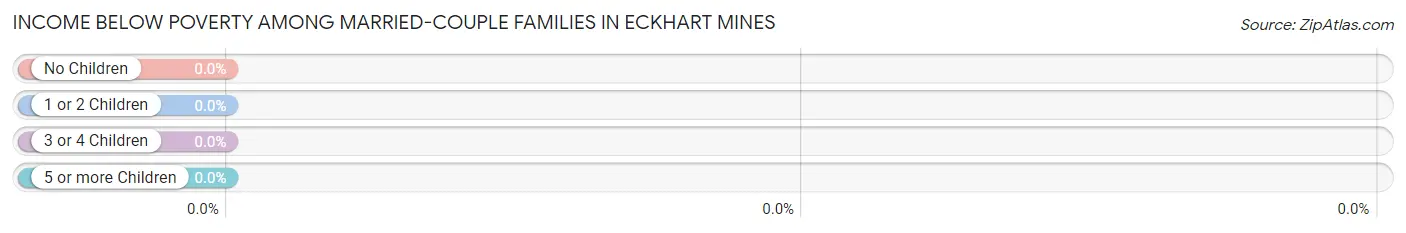
Income Below Poverty Among Married-Couple Families in Eckhart Mines
| Children | Above Poverty | Below Poverty |
| No Children | 99 (100.0%) | 0 (0.0%) |
| 1 or 2 Children | 60 (100.0%) | 0 (0.0%) |
| 3 or 4 Children | 0 (0.0%) | 0 (0.0%) |
| 5 or more Children | 0 (0.0%) | 0 (0.0%) |
| Total | 159 (100.0%) | 0 (0.0%) |
Income Below Poverty Among Single-Parent Households in Eckhart Mines
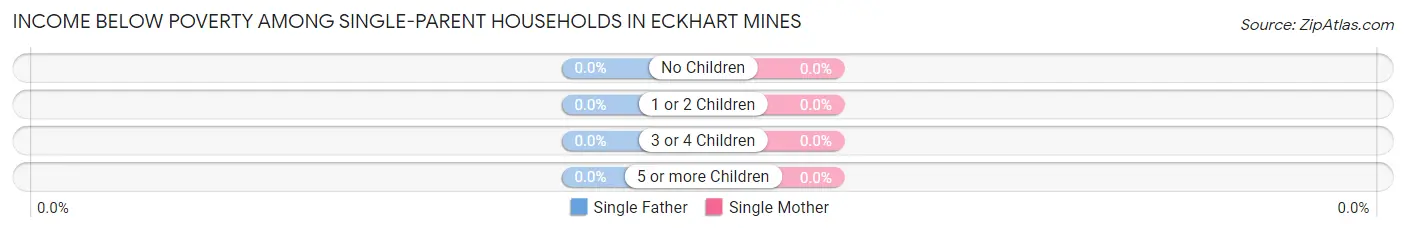
| Children | Single Father | Single Mother |
| No Children | 0 (0.0%) | 0 (0.0%) |
| 1 or 2 Children | 0 (0.0%) | 0 (0.0%) |
| 3 or 4 Children | 0 (0.0%) | 0 (0.0%) |
| 5 or more Children | 0 (0.0%) | 0 (0.0%) |
| Total | 0 (0.0%) | 0 (0.0%) |
Income Below Poverty Among Married-Couple vs Single-Parent Households in Eckhart Mines
| Children | Married-Couple Families | Single-Parent Households |
| No Children | 0 (0.0%) | 0 (0.0%) |
| 1 or 2 Children | 0 (0.0%) | 0 (0.0%) |
| 3 or 4 Children | 0 (0.0%) | 0 (0.0%) |
| 5 or more Children | 0 (0.0%) | 0 (0.0%) |
| Total | 0 (0.0%) | 0 (0.0%) |
Race in Eckhart Mines
The most populous races in Eckhart Mines are , and White / Caucasian (514 | 100.0%).
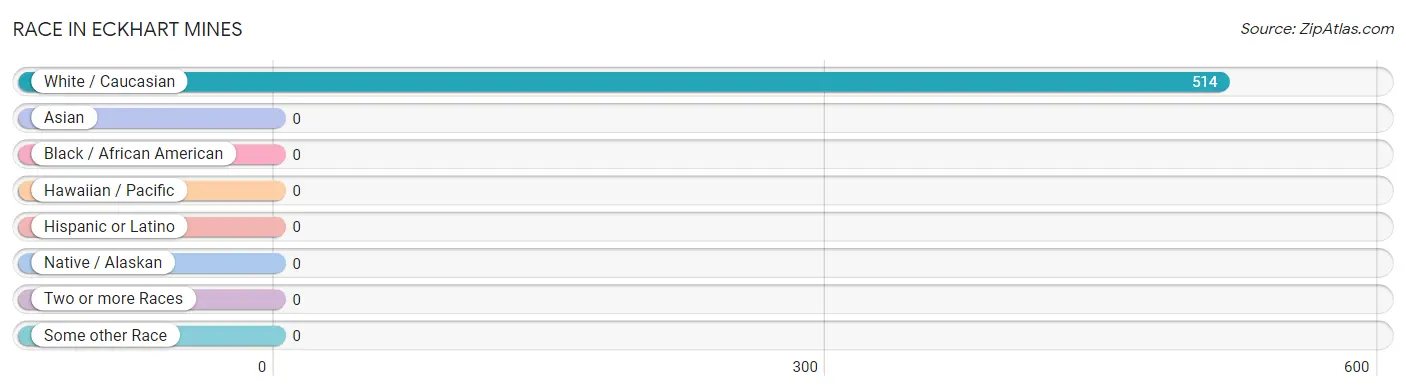
| Race | # Population | % Population |
| Asian | 0 | 0.0% |
| Black / African American | 0 | 0.0% |
| Hawaiian / Pacific | 0 | 0.0% |
| Hispanic or Latino | 0 | 0.0% |
| Native / Alaskan | 0 | 0.0% |
| White / Caucasian | 514 | 100.0% |
| Two or more Races | 0 | 0.0% |
| Some other Race | 0 | 0.0% |
| Total | 514 | 100.0% |
Ancestry in Eckhart Mines
The most populous ancestries reported in Eckhart Mines are German (101 | 19.7%), Scottish (101 | 19.7%), Irish (81 | 15.8%), American (61 | 11.9%), and French (17 | 3.3%), together accounting for 70.2% of all Eckhart Mines residents.
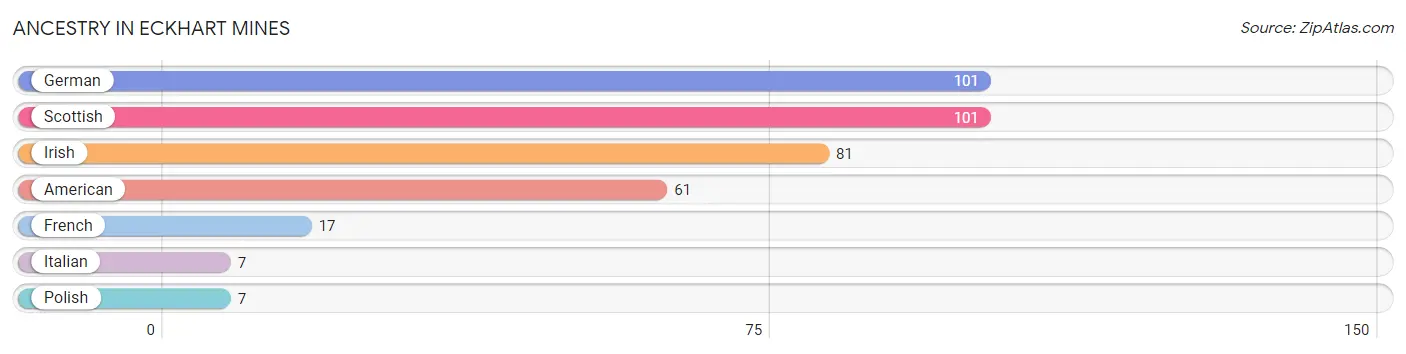
| Ancestry | # Population | % Population |
| American | 61 | 11.9% |
| French | 17 | 3.3% |
| German | 101 | 19.7% |
| Irish | 81 | 15.8% |
| Italian | 7 | 1.4% |
| Polish | 7 | 1.4% |
| Scottish | 101 | 19.7% | View All 7 Rows |
Immigrants in Eckhart Mines

| Immigration Origin | # Population | % Population | View All 0 Rows |
Sex and Age in Eckhart Mines
Sex and Age in Eckhart Mines
The most populous age groups in Eckhart Mines are 55 to 59 Years (58 | 20.4%) for men and 55 to 59 Years (53 | 23.0%) for women.
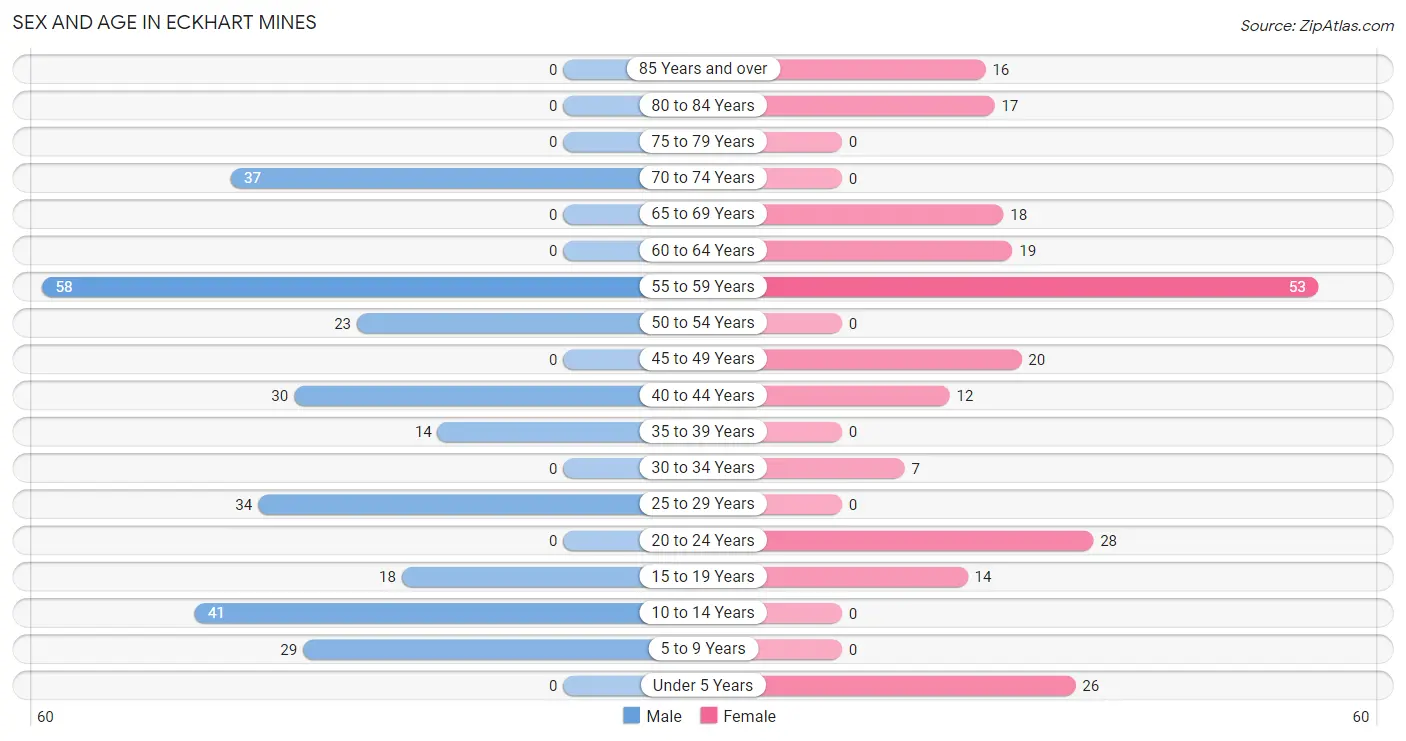
| Age Bracket | Male | Female |
| Under 5 Years | 0 (0.0%) | 26 (11.3%) |
| 5 to 9 Years | 29 (10.2%) | 0 (0.0%) |
| 10 to 14 Years | 41 (14.4%) | 0 (0.0%) |
| 15 to 19 Years | 18 (6.3%) | 14 (6.1%) |
| 20 to 24 Years | 0 (0.0%) | 28 (12.2%) |
| 25 to 29 Years | 34 (12.0%) | 0 (0.0%) |
| 30 to 34 Years | 0 (0.0%) | 7 (3.0%) |
| 35 to 39 Years | 14 (4.9%) | 0 (0.0%) |
| 40 to 44 Years | 30 (10.6%) | 12 (5.2%) |
| 45 to 49 Years | 0 (0.0%) | 20 (8.7%) |
| 50 to 54 Years | 23 (8.1%) | 0 (0.0%) |
| 55 to 59 Years | 58 (20.4%) | 53 (23.0%) |
| 60 to 64 Years | 0 (0.0%) | 19 (8.3%) |
| 65 to 69 Years | 0 (0.0%) | 18 (7.8%) |
| 70 to 74 Years | 37 (13.0%) | 0 (0.0%) |
| 75 to 79 Years | 0 (0.0%) | 0 (0.0%) |
| 80 to 84 Years | 0 (0.0%) | 17 (7.4%) |
| 85 Years and over | 0 (0.0%) | 16 (7.0%) |
| Total | 284 (100.0%) | 230 (100.0%) |
Families and Households in Eckhart Mines
Median Family Size in Eckhart Mines
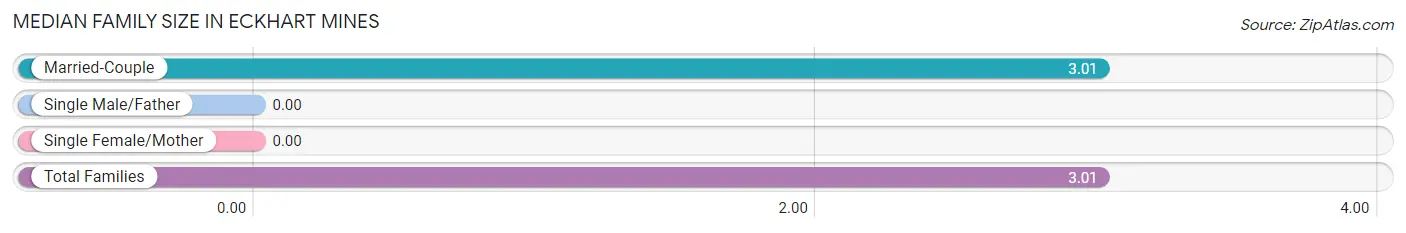
| Family Type | # Families | Family Size |
| Married-Couple | 159 (100.0%) | 3.01 |
| Single Male/Father | 0 (0.0%) | - |
| Single Female/Mother | 0 (0.0%) | - |
| Total Families | 159 (100.0%) | 3.01 |
Median Household Size in Eckhart Mines
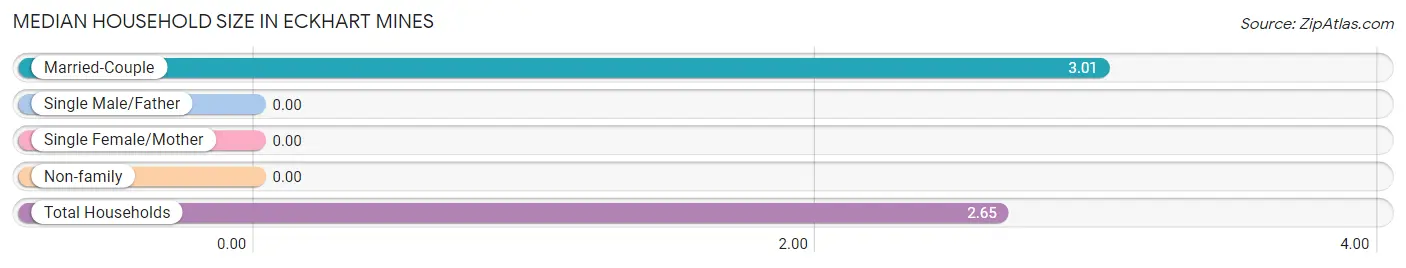
| Household Type | # Households | Household Size |
| Married-Couple | 159 (82.0%) | 3.01 |
| Single Male/Father | 0 (0.0%) | - |
| Single Female/Mother | 0 (0.0%) | - |
| Non-family | 35 (18.0%) | - |
| Total Households | 194 (100.0%) | 2.65 |
Household Size by Marriage Status in Eckhart Mines
Out of a total of 194 households in Eckhart Mines, 159 (82.0%) are family households, while 35 (18.0%) are nonfamily households. The most numerous type of family households are 2-person households, comprising 79, and the most common type of nonfamily households are 1-person households, comprising 35.
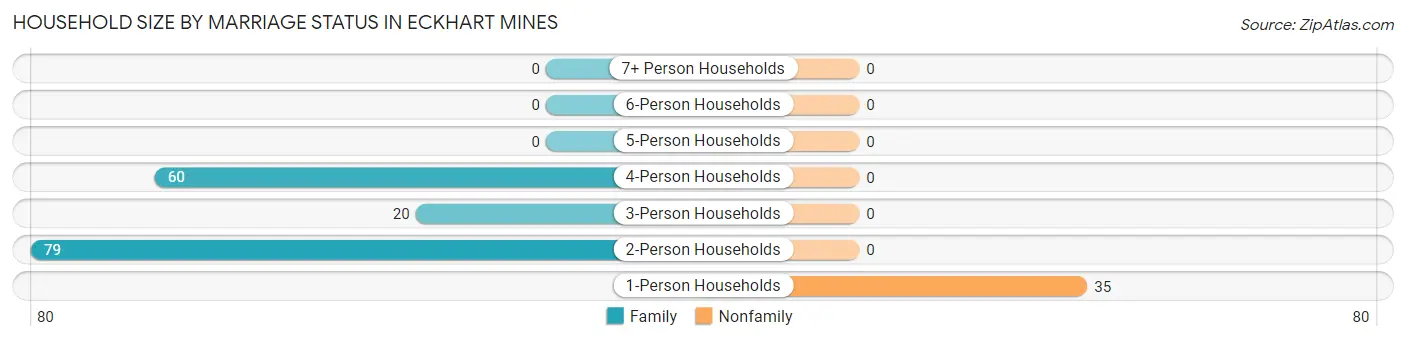
| Household Size | Family Households | Nonfamily Households |
| 1-Person Households | - | 35 (18.0%) |
| 2-Person Households | 79 (40.7%) | 0 (0.0%) |
| 3-Person Households | 20 (10.3%) | 0 (0.0%) |
| 4-Person Households | 60 (30.9%) | 0 (0.0%) |
| 5-Person Households | 0 (0.0%) | 0 (0.0%) |
| 6-Person Households | 0 (0.0%) | 0 (0.0%) |
| 7+ Person Households | 0 (0.0%) | 0 (0.0%) |
| Total | 159 (82.0%) | 35 (18.0%) |
Female Fertility in Eckhart Mines
Fertility by Age in Eckhart Mines
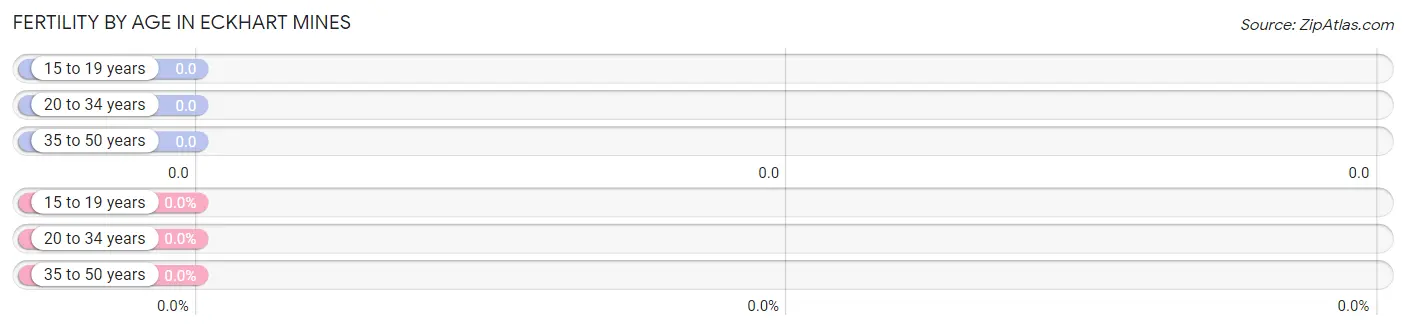
| Age Bracket | Women with Births | Births / 1,000 Women |
| 15 to 19 years | 0 (0.0%) | 0.0 |
| 20 to 34 years | 0 (0.0%) | 0.0 |
| 35 to 50 years | 0 (0.0%) | 0.0 |
| Total | 0 (0.0%) | 0.0 |
Fertility by Age by Marriage Status in Eckhart Mines
| Age Bracket | Married | Unmarried |
| 15 to 19 years | 0 (0.0%) | 0 (0.0%) |
| 20 to 34 years | 0 (0.0%) | 0 (0.0%) |
| 35 to 50 years | 0 (0.0%) | 0 (0.0%) |
| Total | 0 (0.0%) | 0 (0.0%) |
Fertility by Education in Eckhart Mines
| Educational Attainment | Women with Births | Births / 1,000 Women |
| Less than High School | 0 (0.0%) | 0.0 |
| High School Diploma | 0 (0.0%) | 0.0 |
| College or Associate's Degree | 0 (0.0%) | 0.0 |
| Bachelor's Degree | 0 (0.0%) | 0.0 |
| Graduate Degree | 0 (0.0%) | 0.0 |
| Total | 0 (0.0%) | 0.0 |
Fertility by Education by Marriage Status in Eckhart Mines
| Educational Attainment | Married | Unmarried |
| Less than High School | 0 (0.0%) | 0 (0.0%) |
| High School Diploma | 0 (0.0%) | 0 (0.0%) |
| College or Associate's Degree | 0 (0.0%) | 0 (0.0%) |
| Bachelor's Degree | 0 (0.0%) | 0 (0.0%) |
| Graduate Degree | 0 (0.0%) | 0 (0.0%) |
| Total | 0 (0.0%) | 0 (0.0%) |
Employment Characteristics in Eckhart Mines
Employment by Class of Employer in Eckhart Mines
Among the 196 employed individuals in Eckhart Mines, , and private company employees (196 | 100.0%) make up the most common classes of employment.
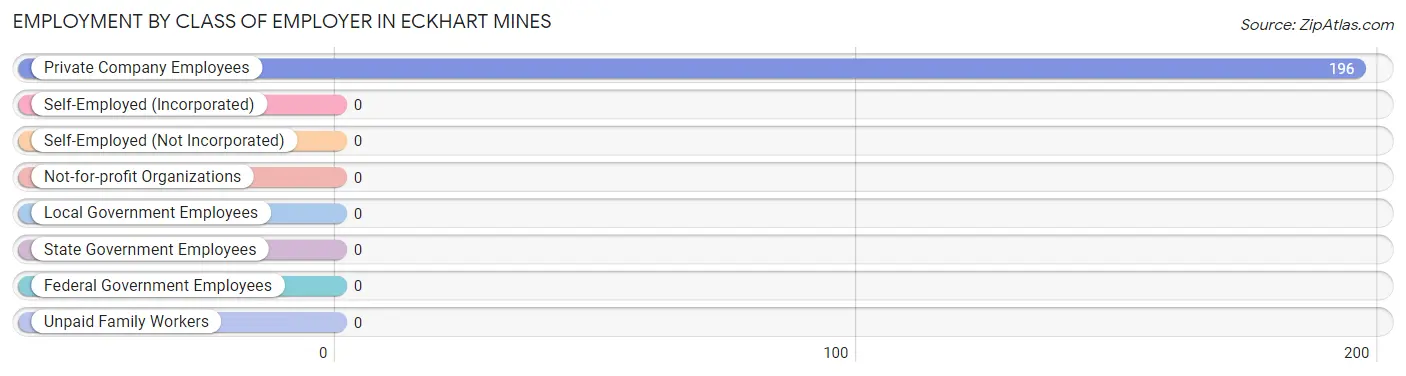
| Employer Class | # Employees | % Employees |
| Private Company Employees | 196 | 100.0% |
| Self-Employed (Incorporated) | 0 | 0.0% |
| Self-Employed (Not Incorporated) | 0 | 0.0% |
| Not-for-profit Organizations | 0 | 0.0% |
| Local Government Employees | 0 | 0.0% |
| State Government Employees | 0 | 0.0% |
| Federal Government Employees | 0 | 0.0% |
| Unpaid Family Workers | 0 | 0.0% |
| Total | 196 | 100.0% |
Employment Status by Age in Eckhart Mines
According to the labor force statistics for Eckhart Mines, out of the total population over 16 years of age (404), 53.5% or 216 individuals are in the labor force, with 9.3% or 20 of them unemployed. The age group with the highest labor force participation rate is 16 to 19 years, with 100.0% or 18 individuals in the labor force. Within the labor force, the 35 to 44 years age range has the highest percentage of unemployed individuals, with 35.7% or 20 of them being unemployed.
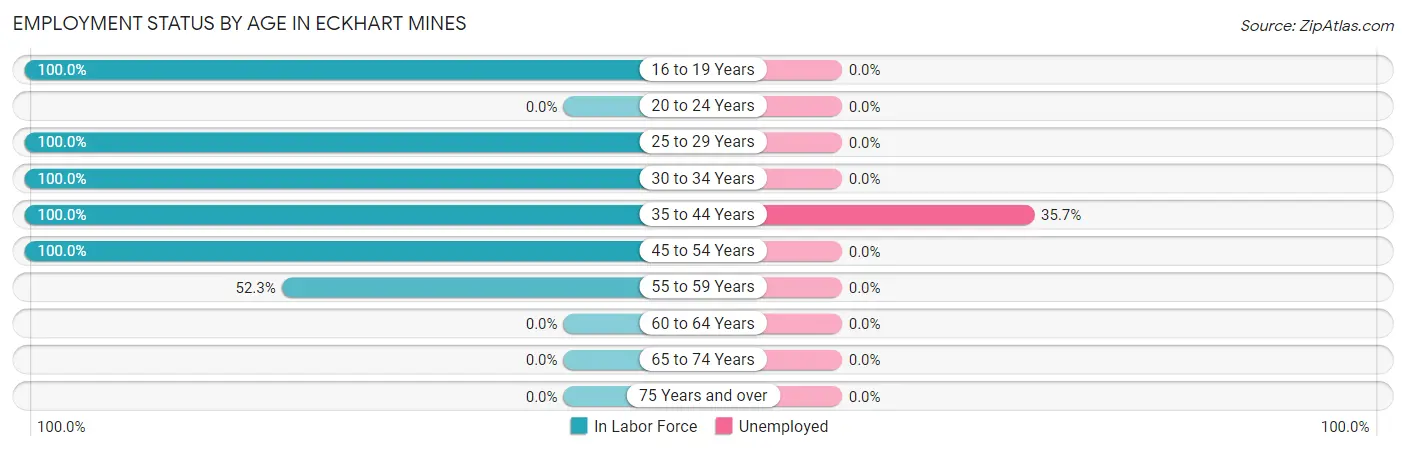
| Age Bracket | In Labor Force | Unemployed |
| 16 to 19 Years | 18 (100.0%) | 0 (0.0%) |
| 20 to 24 Years | 0 (0.0%) | 0 (0.0%) |
| 25 to 29 Years | 34 (100.0%) | 0 (0.0%) |
| 30 to 34 Years | 7 (100.0%) | 0 (0.0%) |
| 35 to 44 Years | 56 (100.0%) | 20 (35.7%) |
| 45 to 54 Years | 43 (100.0%) | 0 (0.0%) |
| 55 to 59 Years | 58 (52.3%) | 0 (0.0%) |
| 60 to 64 Years | 0 (0.0%) | 0 (0.0%) |
| 65 to 74 Years | 0 (0.0%) | 0 (0.0%) |
| 75 Years and over | 0 (0.0%) | 0 (0.0%) |
| Total | 216 (53.5%) | 20 (9.3%) |
Employment Status by Educational Attainment in Eckhart Mines
According to labor force statistics for Eckhart Mines, 73.3% of individuals (198) out of the total population between 25 and 64 years of age (270) are in the labor force, with 10.1% or 20 of them being unemployed. The group with the highest labor force participation rate are those with the educational attainment of college / associate degree, with 100.0% or 20 individuals in the labor force. Within the labor force, individuals with high school diploma education have the highest percentage of unemployment, with 11.7% or 20 of them being unemployed.
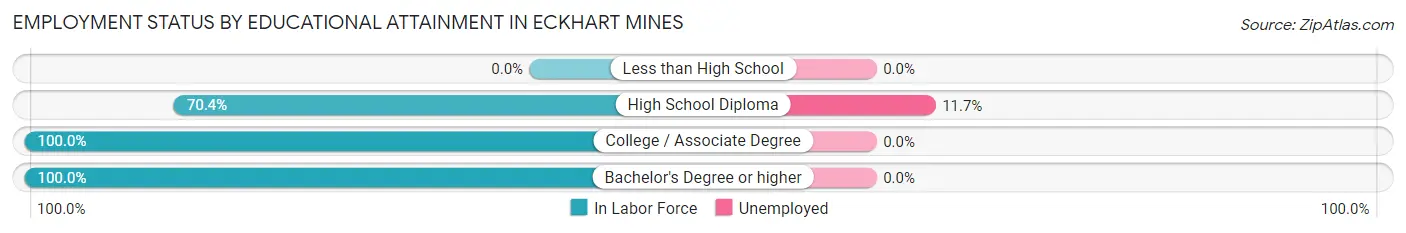
| Educational Attainment | In Labor Force | Unemployed |
| Less than High School | 0 (0.0%) | 0 (0.0%) |
| High School Diploma | 171 (70.4%) | 28 (11.7%) |
| College / Associate Degree | 20 (100.0%) | 0 (0.0%) |
| Bachelor's Degree or higher | 7 (100.0%) | 0 (0.0%) |
| Total | 198 (73.3%) | 27 (10.1%) |
Employment Occupations by Sex in Eckhart Mines
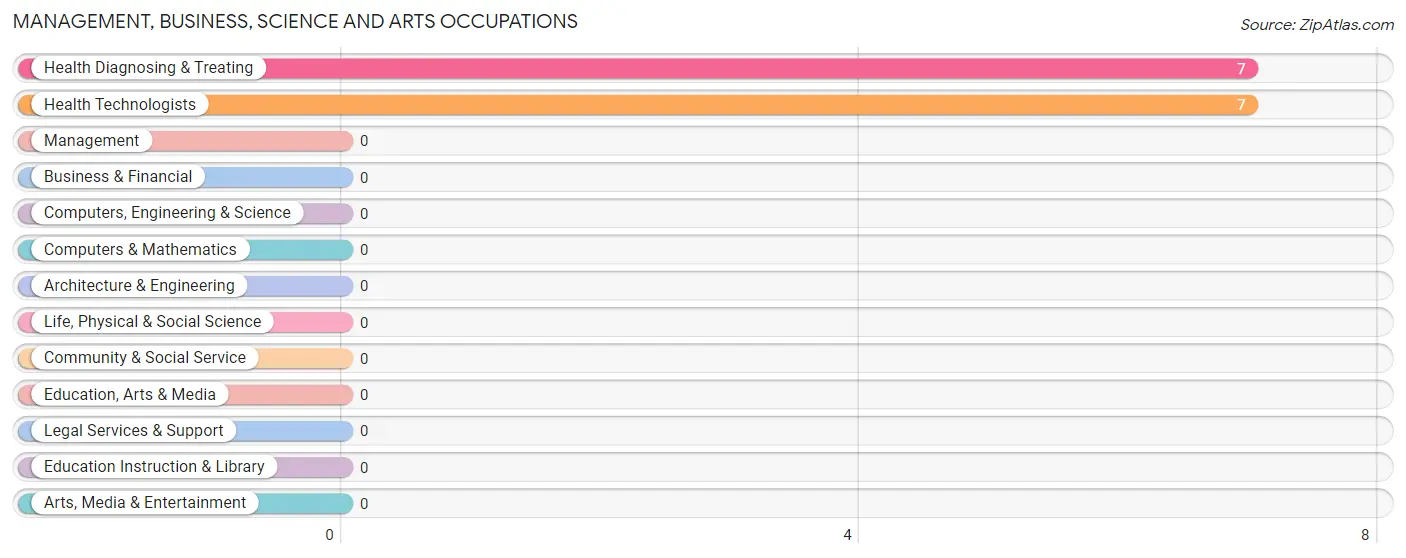
Management, Business, Science and Arts Occupations
The most common Management, Business, Science and Arts occupations in Eckhart Mines are Health Diagnosing & Treating (7 | 3.6%), and Health Technologists (7 | 3.6%).
Management, Business, Science and Arts Occupations by Sex
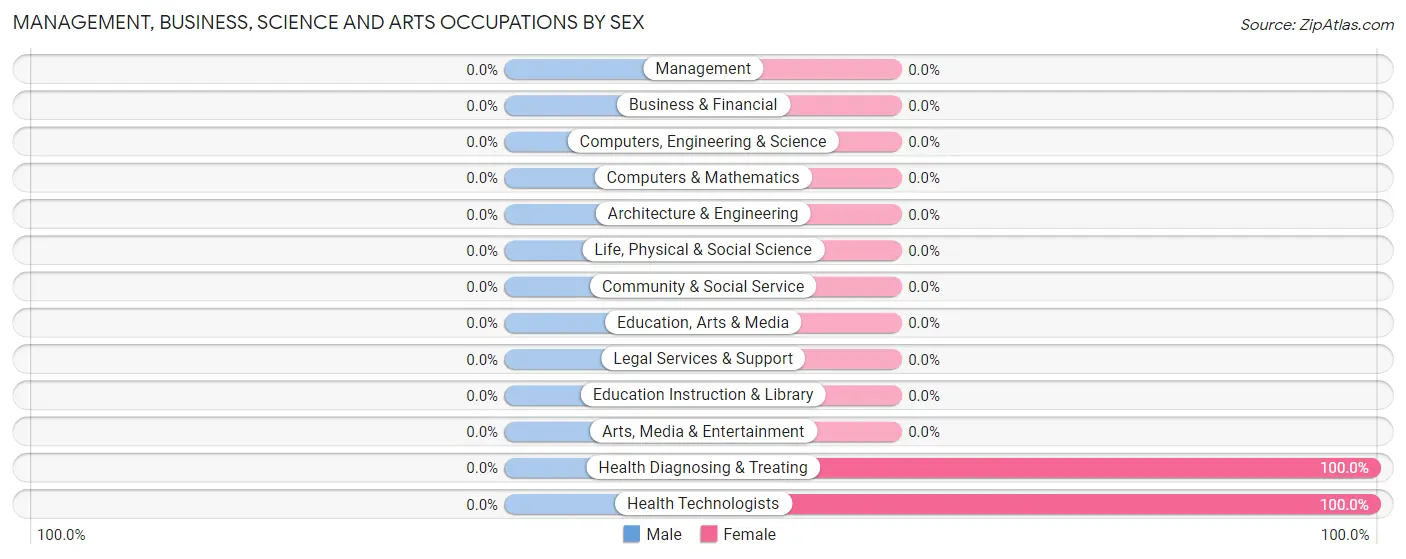
| Occupation | Male | Female |
| Management | 0 (0.0%) | 0 (0.0%) |
| Business & Financial | 0 (0.0%) | 0 (0.0%) |
| Computers, Engineering & Science | 0 (0.0%) | 0 (0.0%) |
| Computers & Mathematics | 0 (0.0%) | 0 (0.0%) |
| Architecture & Engineering | 0 (0.0%) | 0 (0.0%) |
| Life, Physical & Social Science | 0 (0.0%) | 0 (0.0%) |
| Community & Social Service | 0 (0.0%) | 0 (0.0%) |
| Education, Arts & Media | 0 (0.0%) | 0 (0.0%) |
| Legal Services & Support | 0 (0.0%) | 0 (0.0%) |
| Education Instruction & Library | 0 (0.0%) | 0 (0.0%) |
| Arts, Media & Entertainment | 0 (0.0%) | 0 (0.0%) |
| Health Diagnosing & Treating | 0 (0.0%) | 7 (100.0%) |
| Health Technologists | 0 (0.0%) | 7 (100.0%) |
| Total (Category) | 0 (0.0%) | 7 (100.0%) |
| Total (Overall) | 157 (80.1%) | 39 (19.9%) |
Services Occupations
Services Occupations by Sex
| Occupation | Male | Female |
| Healthcare Support | 0 (0.0%) | 0 (0.0%) |
| Security & Protection | 0 (0.0%) | 0 (0.0%) |
| Firefighting & Prevention | 0 (0.0%) | 0 (0.0%) |
| Law Enforcement | 0 (0.0%) | 0 (0.0%) |
| Food Preparation & Serving | 0 (0.0%) | 0 (0.0%) |
| Cleaning & Maintenance | 0 (0.0%) | 0 (0.0%) |
| Personal Care & Service | 0 (0.0%) | 0 (0.0%) |
| Total (Category) | 0 (0.0%) | 0 (0.0%) |
| Total (Overall) | 157 (80.1%) | 39 (19.9%) |
Sales and Office Occupations
The most common Sales and Office occupations in Eckhart Mines are , and Office & Administration (32 | 16.3%).
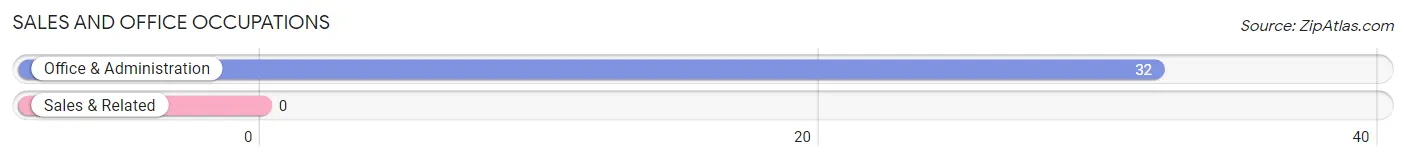
Sales and Office Occupations by Sex
| Occupation | Male | Female |
| Sales & Related | 0 (0.0%) | 0 (0.0%) |
| Office & Administration | 0 (0.0%) | 32 (100.0%) |
| Total (Category) | 0 (0.0%) | 32 (100.0%) |
| Total (Overall) | 157 (80.1%) | 39 (19.9%) |
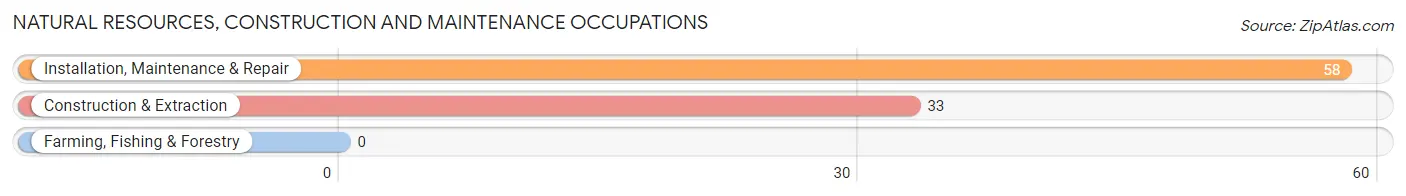
Natural Resources, Construction and Maintenance Occupations
The most common Natural Resources, Construction and Maintenance occupations in Eckhart Mines are Installation, Maintenance & Repair (58 | 29.6%), and Construction & Extraction (33 | 16.8%).
Natural Resources, Construction and Maintenance Occupations by Sex
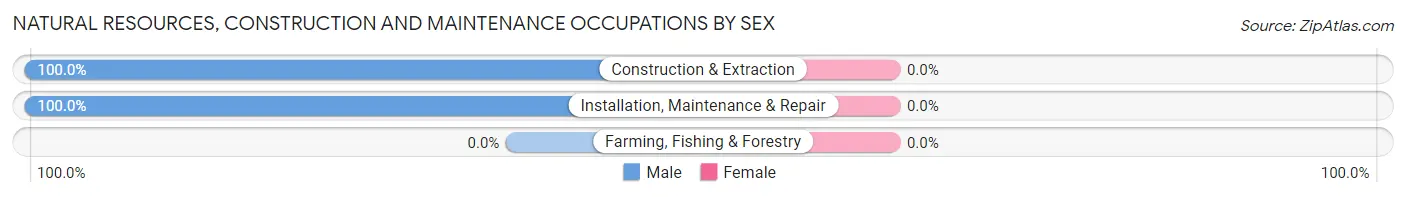
| Occupation | Male | Female |
| Farming, Fishing & Forestry | 0 (0.0%) | 0 (0.0%) |
| Construction & Extraction | 33 (100.0%) | 0 (0.0%) |
| Installation, Maintenance & Repair | 58 (100.0%) | 0 (0.0%) |
| Total (Category) | 91 (100.0%) | 0 (0.0%) |
| Total (Overall) | 157 (80.1%) | 39 (19.9%) |
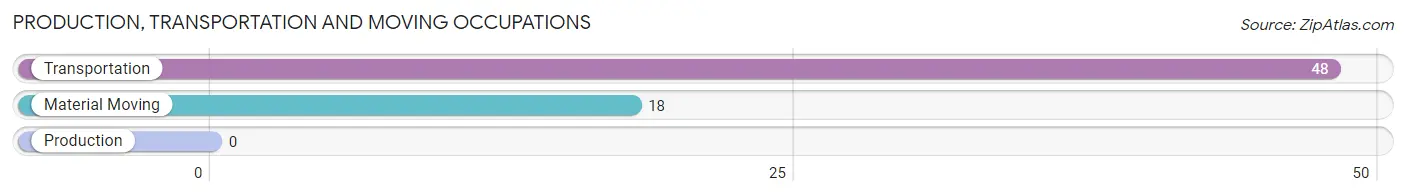
Production, Transportation and Moving Occupations
The most common Production, Transportation and Moving occupations in Eckhart Mines are Transportation (48 | 24.5%), and Material Moving (18 | 9.2%).
Production, Transportation and Moving Occupations by Sex
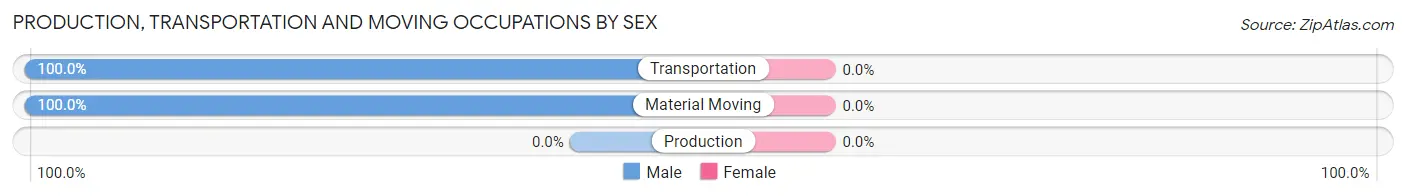
| Occupation | Male | Female |
| Production | 0 (0.0%) | 0 (0.0%) |
| Transportation | 48 (100.0%) | 0 (0.0%) |
| Material Moving | 18 (100.0%) | 0 (0.0%) |
| Total (Category) | 66 (100.0%) | 0 (0.0%) |
| Total (Overall) | 157 (80.1%) | 39 (19.9%) |
Employment Industries by Sex in Eckhart Mines
Employment Industries in Eckhart Mines
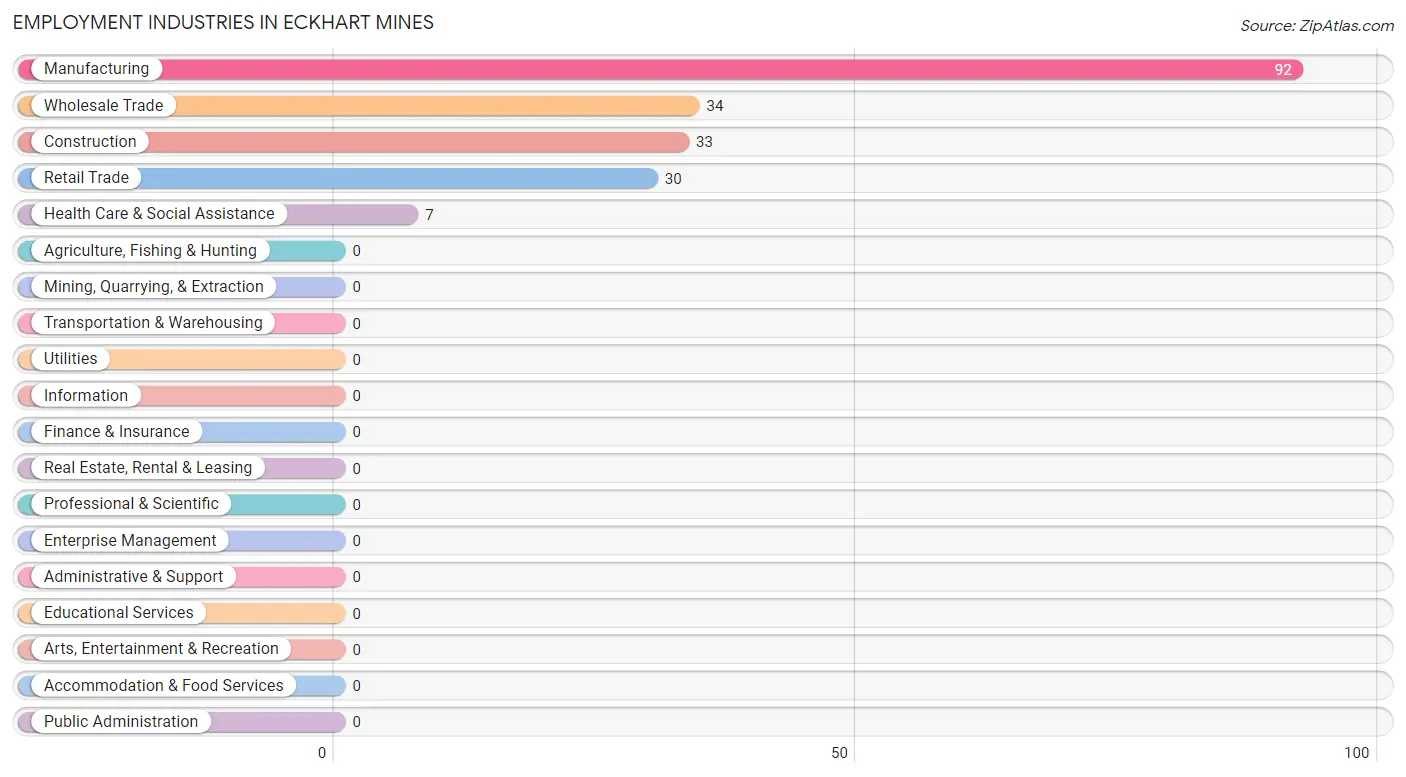
The major employment industries in Eckhart Mines include Manufacturing (92 | 46.9%), Wholesale Trade (34 | 17.3%), Construction (33 | 16.8%), Retail Trade (30 | 15.3%), and Health Care & Social Assistance (7 | 3.6%).
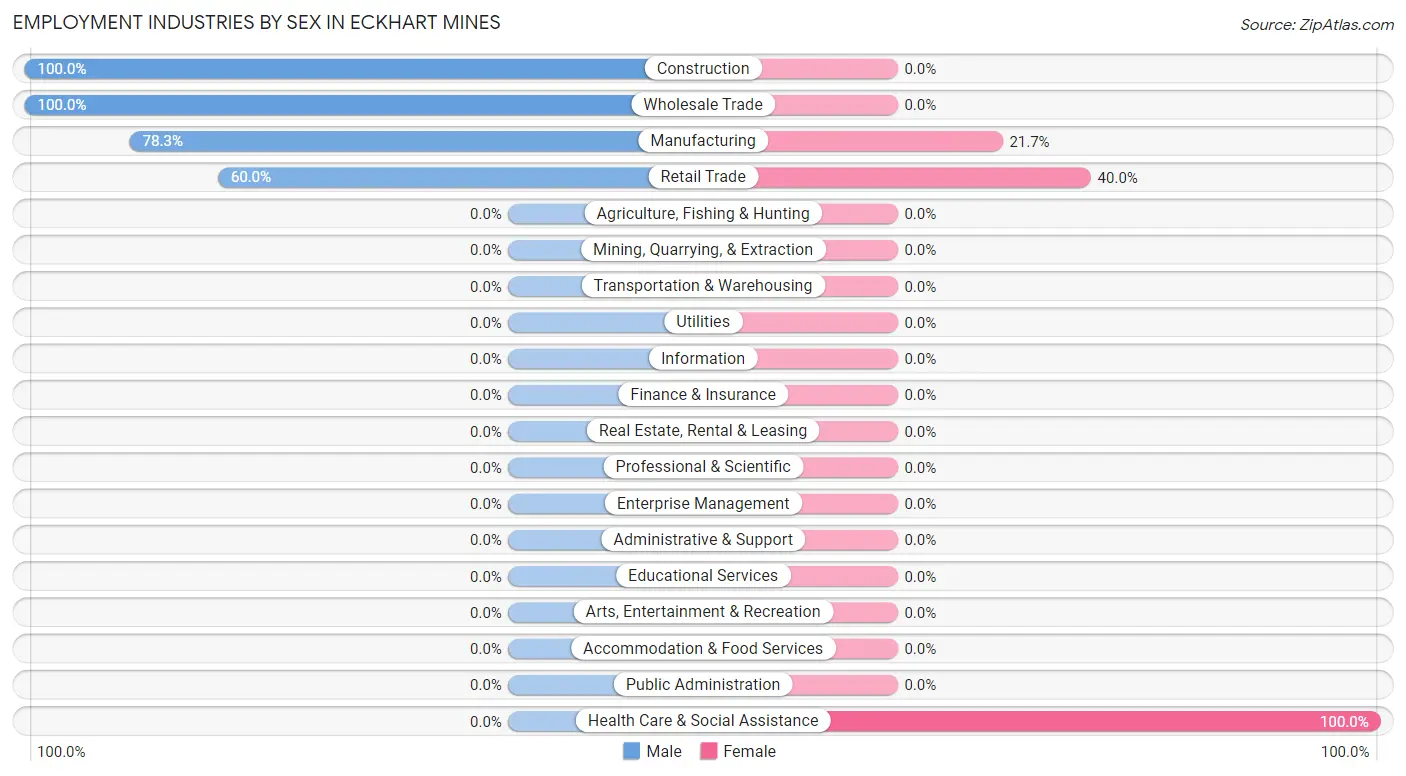
Employment Industries by Sex in Eckhart Mines
The Eckhart Mines industries that see more men than women are Construction (100.0%), Wholesale Trade (100.0%), and Manufacturing (78.3%), whereas the industries that tend to have a higher number of women are Health Care & Social Assistance (100.0%), Retail Trade (40.0%), and Manufacturing (21.7%).
| Industry | Male | Female |
| Agriculture, Fishing & Hunting | 0 (0.0%) | 0 (0.0%) |
| Mining, Quarrying, & Extraction | 0 (0.0%) | 0 (0.0%) |
| Construction | 33 (100.0%) | 0 (0.0%) |
| Manufacturing | 72 (78.3%) | 20 (21.7%) |
| Wholesale Trade | 34 (100.0%) | 0 (0.0%) |
| Retail Trade | 18 (60.0%) | 12 (40.0%) |
| Transportation & Warehousing | 0 (0.0%) | 0 (0.0%) |
| Utilities | 0 (0.0%) | 0 (0.0%) |
| Information | 0 (0.0%) | 0 (0.0%) |
| Finance & Insurance | 0 (0.0%) | 0 (0.0%) |
| Real Estate, Rental & Leasing | 0 (0.0%) | 0 (0.0%) |
| Professional & Scientific | 0 (0.0%) | 0 (0.0%) |
| Enterprise Management | 0 (0.0%) | 0 (0.0%) |
| Administrative & Support | 0 (0.0%) | 0 (0.0%) |
| Educational Services | 0 (0.0%) | 0 (0.0%) |
| Health Care & Social Assistance | 0 (0.0%) | 7 (100.0%) |
| Arts, Entertainment & Recreation | 0 (0.0%) | 0 (0.0%) |
| Accommodation & Food Services | 0 (0.0%) | 0 (0.0%) |
| Public Administration | 0 (0.0%) | 0 (0.0%) |
| Total | 157 (80.1%) | 39 (19.9%) |
Education in Eckhart Mines
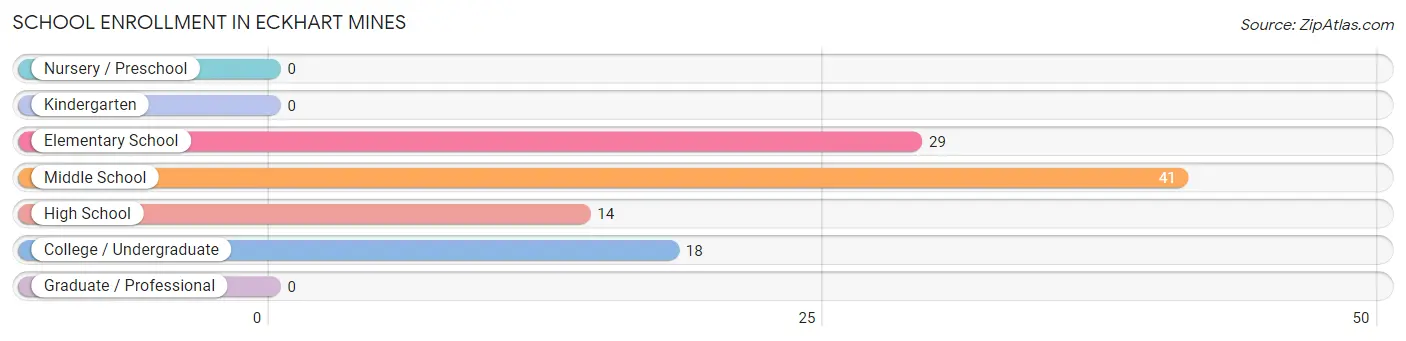
School Enrollment in Eckhart Mines
The most common levels of schooling among the 102 students in Eckhart Mines are middle school (41 | 40.2%), elementary school (29 | 28.4%), and college / undergraduate (18 | 17.6%).
| School Level | # Students | % Students |
| Nursery / Preschool | 0 | 0.0% |
| Kindergarten | 0 | 0.0% |
| Elementary School | 29 | 28.4% |
| Middle School | 41 | 40.2% |
| High School | 14 | 13.7% |
| College / Undergraduate | 18 | 17.6% |
| Graduate / Professional | 0 | 0.0% |
| Total | 102 | 100.0% |
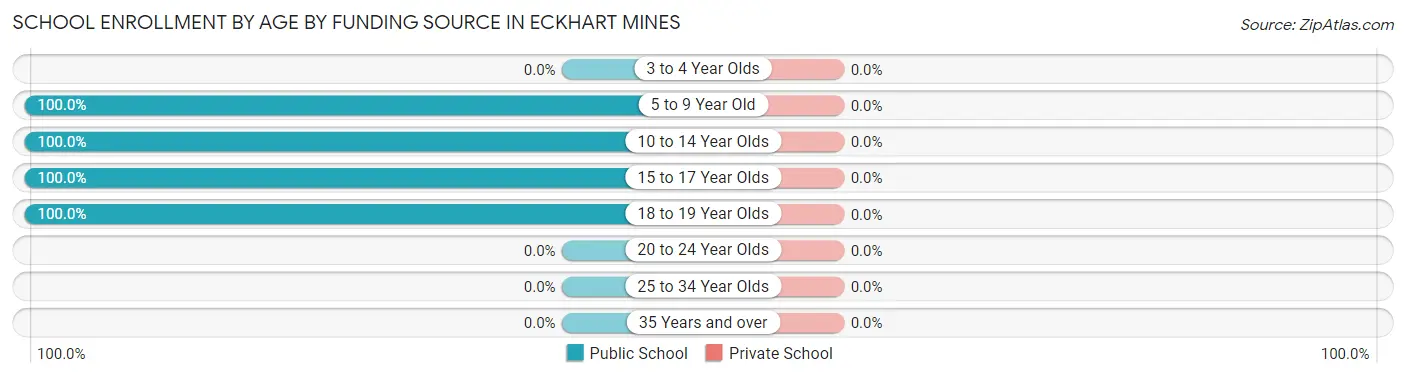
School Enrollment by Age by Funding Source in Eckhart Mines
| Age Bracket | Public School | Private School |
| 3 to 4 Year Olds | 0 (0.0%) | 0 (0.0%) |
| 5 to 9 Year Old | 29 (100.0%) | 0 (0.0%) |
| 10 to 14 Year Olds | 41 (100.0%) | 0 (0.0%) |
| 15 to 17 Year Olds | 14 (100.0%) | 0 (0.0%) |
| 18 to 19 Year Olds | 18 (100.0%) | 0 (0.0%) |
| 20 to 24 Year Olds | 0 (0.0%) | 0 (0.0%) |
| 25 to 34 Year Olds | 0 (0.0%) | 0 (0.0%) |
| 35 Years and over | 0 (0.0%) | 0 (0.0%) |
| Total | 102 (100.0%) | 0 (0.0%) |
Educational Attainment by Field of Study in Eckhart Mines
, and science & technology (7 | 100.0%) are the most common fields of study among 7 individuals in Eckhart Mines who have obtained a bachelor's degree or higher.
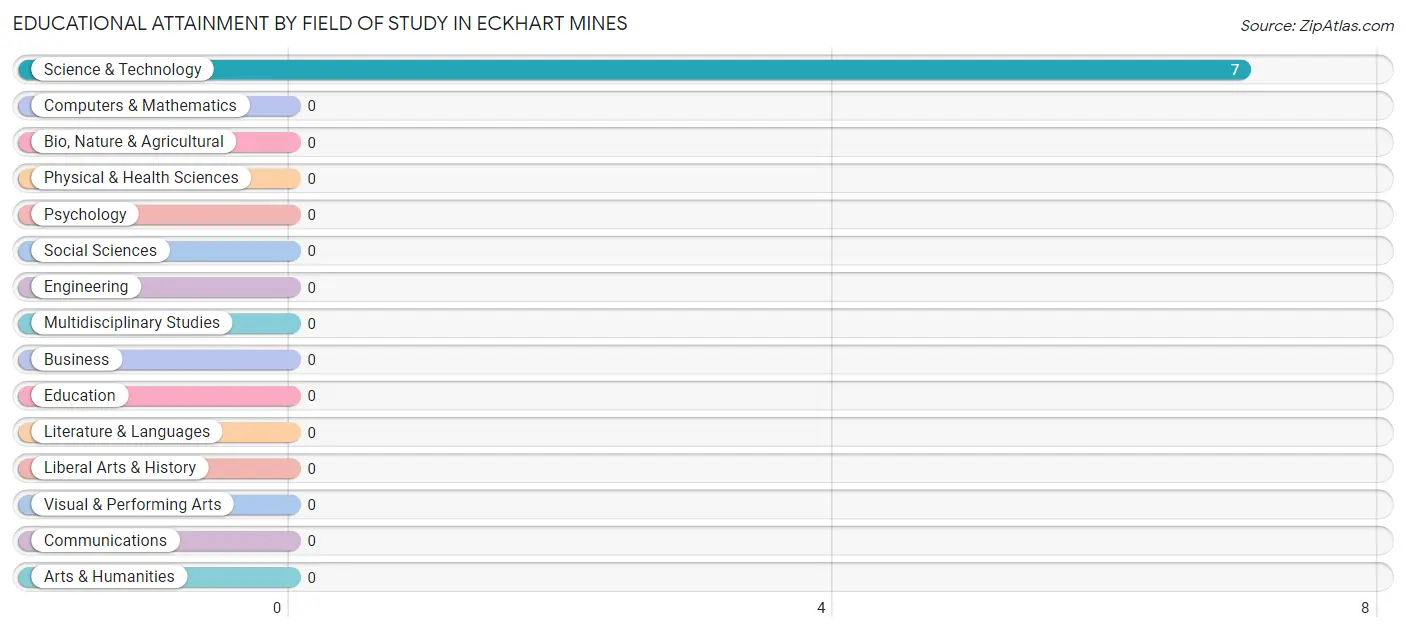
| Field of Study | # Graduates | % Graduates |
| Computers & Mathematics | 0 | 0.0% |
| Bio, Nature & Agricultural | 0 | 0.0% |
| Physical & Health Sciences | 0 | 0.0% |
| Psychology | 0 | 0.0% |
| Social Sciences | 0 | 0.0% |
| Engineering | 0 | 0.0% |
| Multidisciplinary Studies | 0 | 0.0% |
| Science & Technology | 7 | 100.0% |
| Business | 0 | 0.0% |
| Education | 0 | 0.0% |
| Literature & Languages | 0 | 0.0% |
| Liberal Arts & History | 0 | 0.0% |
| Visual & Performing Arts | 0 | 0.0% |
| Communications | 0 | 0.0% |
| Arts & Humanities | 0 | 0.0% |
| Total | 7 | 100.0% |
Transportation & Commute in Eckhart Mines
Vehicle Availability by Sex in Eckhart Mines
The most prevalent vehicle ownership categories in Eckhart Mines are males with 1 vehicle (58, accounting for 36.9%) and females with 1 vehicle (0, making up 148.7%).
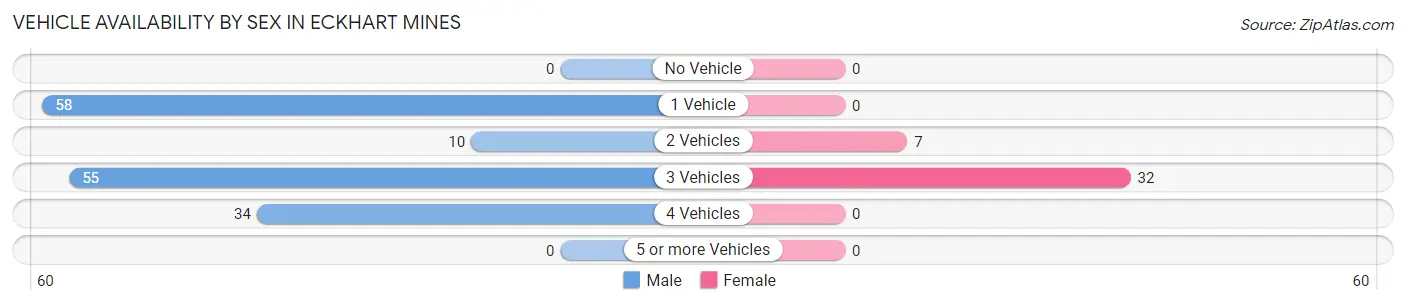
| Vehicles Available | Male | Female |
| No Vehicle | 0 (0.0%) | 0 (0.0%) |
| 1 Vehicle | 58 (36.9%) | 0 (0.0%) |
| 2 Vehicles | 10 (6.4%) | 7 (17.9%) |
| 3 Vehicles | 55 (35.0%) | 32 (82.1%) |
| 4 Vehicles | 34 (21.7%) | 0 (0.0%) |
| 5 or more Vehicles | 0 (0.0%) | 0 (0.0%) |
| Total | 157 (100.0%) | 39 (100.0%) |
Commute Time in Eckhart Mines
The most frequently occuring commute durations in Eckhart Mines are 10 to 14 minutes (88 commuters, 44.9%), 90 or more minutes (44 commuters, 22.5%), and 20 to 24 minutes (30 commuters, 15.3%).
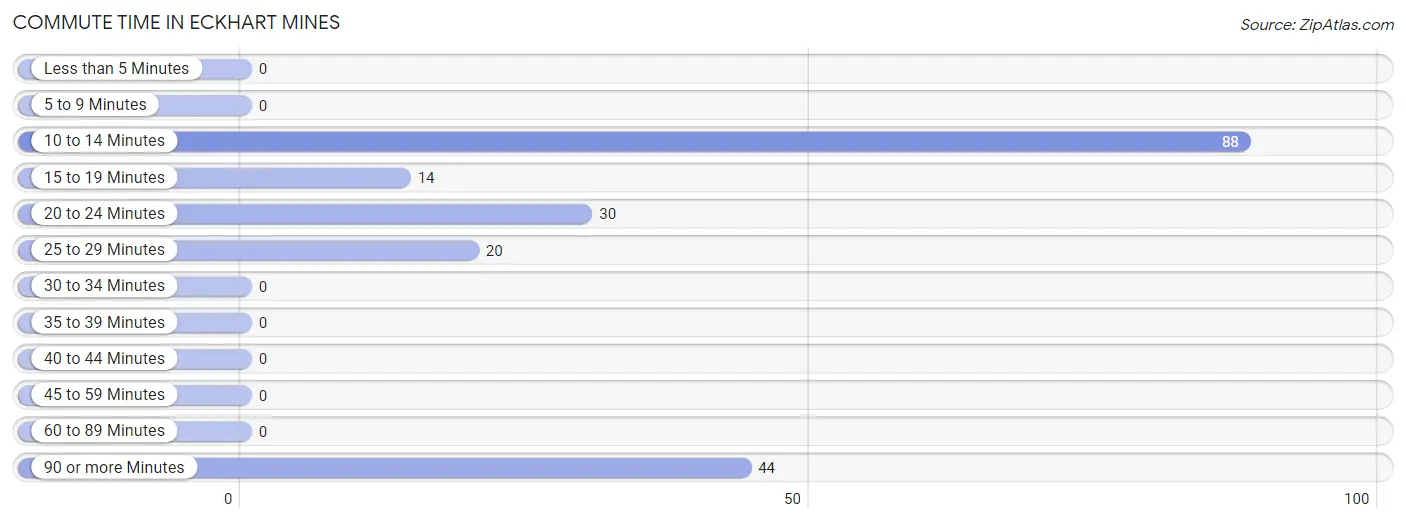
| Commute Time | # Commuters | % Commuters |
| Less than 5 Minutes | 0 | 0.0% |
| 5 to 9 Minutes | 0 | 0.0% |
| 10 to 14 Minutes | 88 | 44.9% |
| 15 to 19 Minutes | 14 | 7.1% |
| 20 to 24 Minutes | 30 | 15.3% |
| 25 to 29 Minutes | 20 | 10.2% |
| 30 to 34 Minutes | 0 | 0.0% |
| 35 to 39 Minutes | 0 | 0.0% |
| 40 to 44 Minutes | 0 | 0.0% |
| 45 to 59 Minutes | 0 | 0.0% |
| 60 to 89 Minutes | 0 | 0.0% |
| 90 or more Minutes | 44 | 22.5% |
Commute Time by Sex in Eckhart Mines
The most common commute times in Eckhart Mines are 10 to 14 minutes (76 commuters, 48.4%) for males and 25 to 29 minutes (20 commuters, 51.3%) for females.
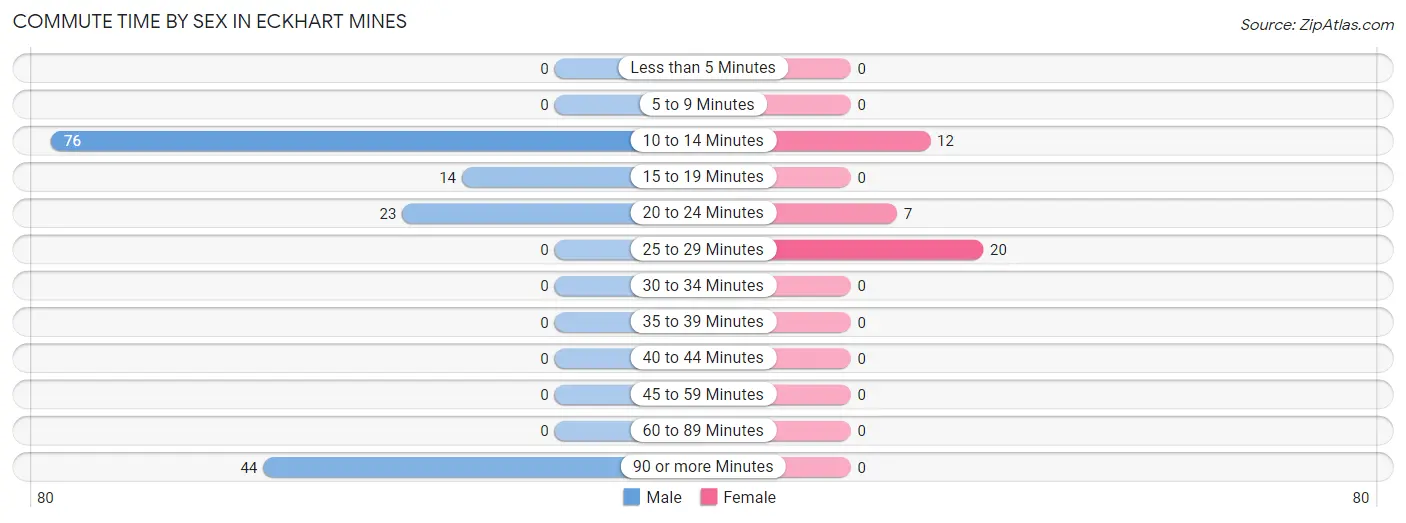
| Commute Time | Male | Female |
| Less than 5 Minutes | 0 (0.0%) | 0 (0.0%) |
| 5 to 9 Minutes | 0 (0.0%) | 0 (0.0%) |
| 10 to 14 Minutes | 76 (48.4%) | 12 (30.8%) |
| 15 to 19 Minutes | 14 (8.9%) | 0 (0.0%) |
| 20 to 24 Minutes | 23 (14.6%) | 7 (17.9%) |
| 25 to 29 Minutes | 0 (0.0%) | 20 (51.3%) |
| 30 to 34 Minutes | 0 (0.0%) | 0 (0.0%) |
| 35 to 39 Minutes | 0 (0.0%) | 0 (0.0%) |
| 40 to 44 Minutes | 0 (0.0%) | 0 (0.0%) |
| 45 to 59 Minutes | 0 (0.0%) | 0 (0.0%) |
| 60 to 89 Minutes | 0 (0.0%) | 0 (0.0%) |
| 90 or more Minutes | 44 (28.0%) | 0 (0.0%) |
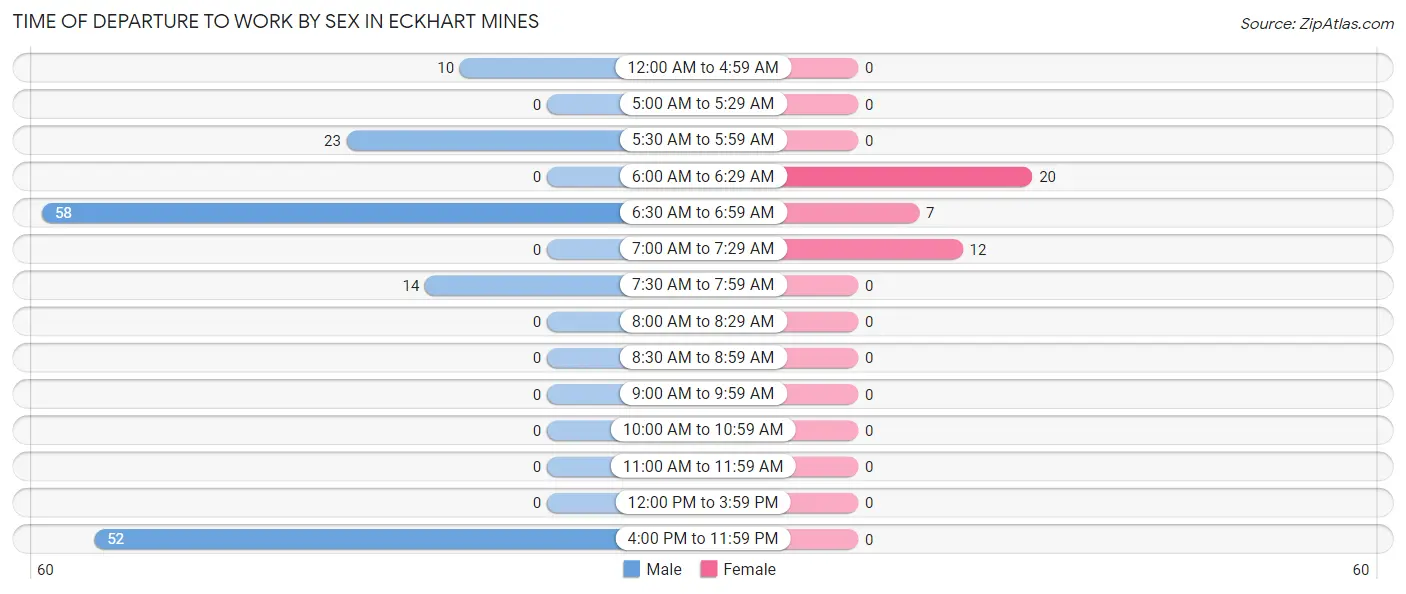
Time of Departure to Work by Sex in Eckhart Mines
The most frequent times of departure to work in Eckhart Mines are 6:30 AM to 6:59 AM (58, 36.9%) for males and 6:00 AM to 6:29 AM (20, 51.3%) for females.
| Time of Departure | Male | Female |
| 12:00 AM to 4:59 AM | 10 (6.4%) | 0 (0.0%) |
| 5:00 AM to 5:29 AM | 0 (0.0%) | 0 (0.0%) |
| 5:30 AM to 5:59 AM | 23 (14.6%) | 0 (0.0%) |
| 6:00 AM to 6:29 AM | 0 (0.0%) | 20 (51.3%) |
| 6:30 AM to 6:59 AM | 58 (36.9%) | 7 (17.9%) |
| 7:00 AM to 7:29 AM | 0 (0.0%) | 12 (30.8%) |
| 7:30 AM to 7:59 AM | 14 (8.9%) | 0 (0.0%) |
| 8:00 AM to 8:29 AM | 0 (0.0%) | 0 (0.0%) |
| 8:30 AM to 8:59 AM | 0 (0.0%) | 0 (0.0%) |
| 9:00 AM to 9:59 AM | 0 (0.0%) | 0 (0.0%) |
| 10:00 AM to 10:59 AM | 0 (0.0%) | 0 (0.0%) |
| 11:00 AM to 11:59 AM | 0 (0.0%) | 0 (0.0%) |
| 12:00 PM to 3:59 PM | 0 (0.0%) | 0 (0.0%) |
| 4:00 PM to 11:59 PM | 52 (33.1%) | 0 (0.0%) |
| Total | 157 (100.0%) | 39 (100.0%) |
Housing Occupancy in Eckhart Mines
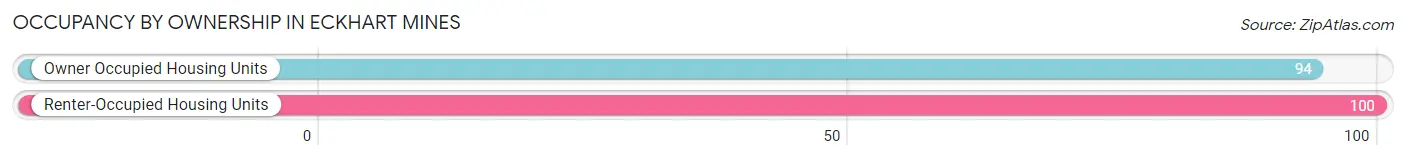
Occupancy by Ownership in Eckhart Mines
Of the total 194 dwellings in Eckhart Mines, owner-occupied units account for 94 (48.4%), while renter-occupied units make up 100 (51.5%).
| Occupancy | # Housing Units | % Housing Units |
| Owner Occupied Housing Units | 94 | 48.4% |
| Renter-Occupied Housing Units | 100 | 51.5% |
| Total Occupied Housing Units | 194 | 100.0% |
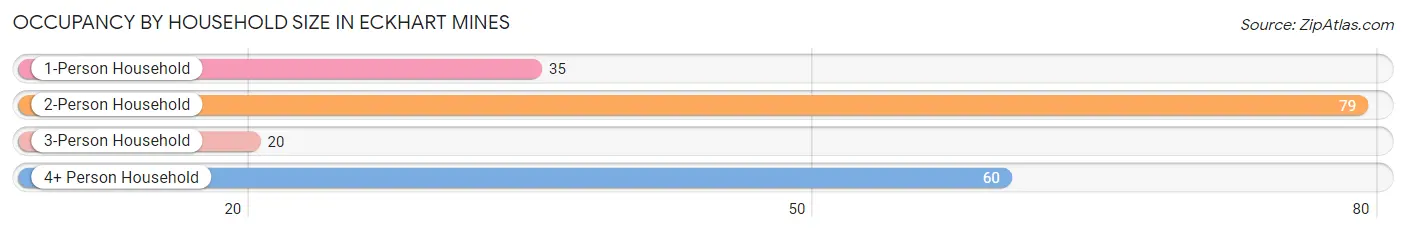
Occupancy by Household Size in Eckhart Mines
| Household Size | # Housing Units | % Housing Units |
| 1-Person Household | 35 | 18.0% |
| 2-Person Household | 79 | 40.7% |
| 3-Person Household | 20 | 10.3% |
| 4+ Person Household | 60 | 30.9% |
| Total Housing Units | 194 | 100.0% |
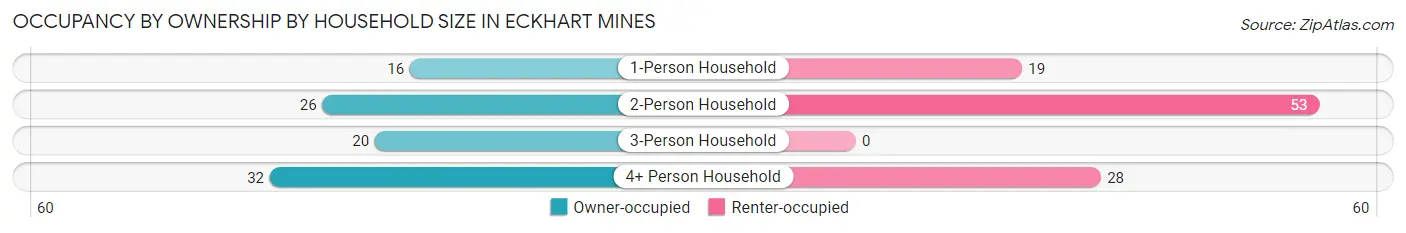
Occupancy by Ownership by Household Size in Eckhart Mines
| Household Size | Owner-occupied | Renter-occupied |
| 1-Person Household | 16 (45.7%) | 19 (54.3%) |
| 2-Person Household | 26 (32.9%) | 53 (67.1%) |
| 3-Person Household | 20 (100.0%) | 0 (0.0%) |
| 4+ Person Household | 32 (53.3%) | 28 (46.7%) |
| Total Housing Units | 94 (48.4%) | 100 (51.5%) |
Occupancy by Educational Attainment in Eckhart Mines
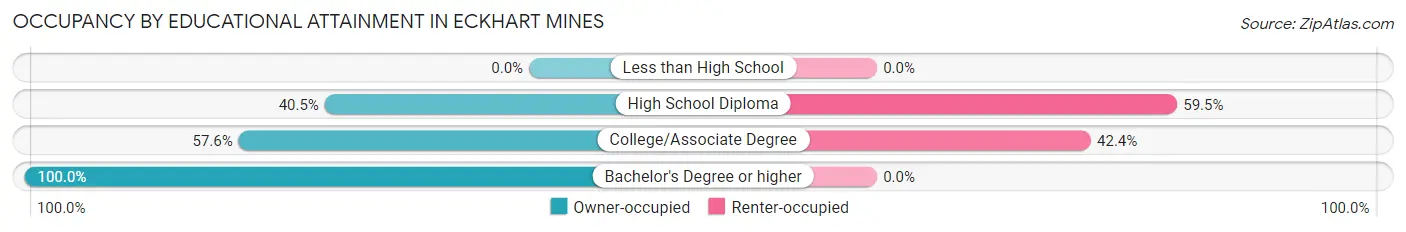
| Household Size | Owner-occupied | Renter-occupied |
| Less than High School | 0 (0.0%) | 0 (0.0%) |
| High School Diploma | 49 (40.5%) | 72 (59.5%) |
| College/Associate Degree | 38 (57.6%) | 28 (42.4%) |
| Bachelor's Degree or higher | 7 (100.0%) | 0 (0.0%) |
Occupancy by Age of Householder in Eckhart Mines
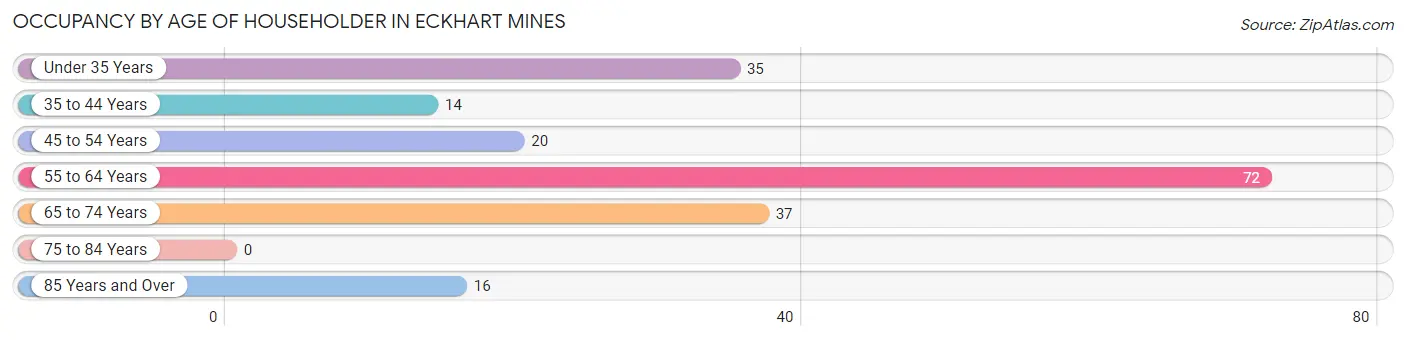
| Age Bracket | # Households | % Households |
| Under 35 Years | 35 | 18.0% |
| 35 to 44 Years | 14 | 7.2% |
| 45 to 54 Years | 20 | 10.3% |
| 55 to 64 Years | 72 | 37.1% |
| 65 to 74 Years | 37 | 19.1% |
| 75 to 84 Years | 0 | 0.0% |
| 85 Years and Over | 16 | 8.3% |
| Total | 194 | 100.0% |
Housing Finances in Eckhart Mines
Median Income by Occupancy in Eckhart Mines
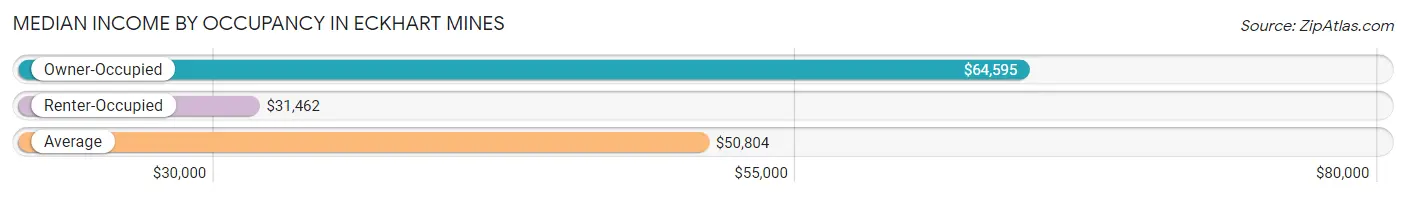
| Occupancy Type | # Households | Median Income |
| Owner-Occupied | 94 (48.4%) | $64,595 |
| Renter-Occupied | 100 (51.5%) | $31,462 |
| Average | 194 (100.0%) | $50,804 |
Occupancy by Householder Income Bracket in Eckhart Mines
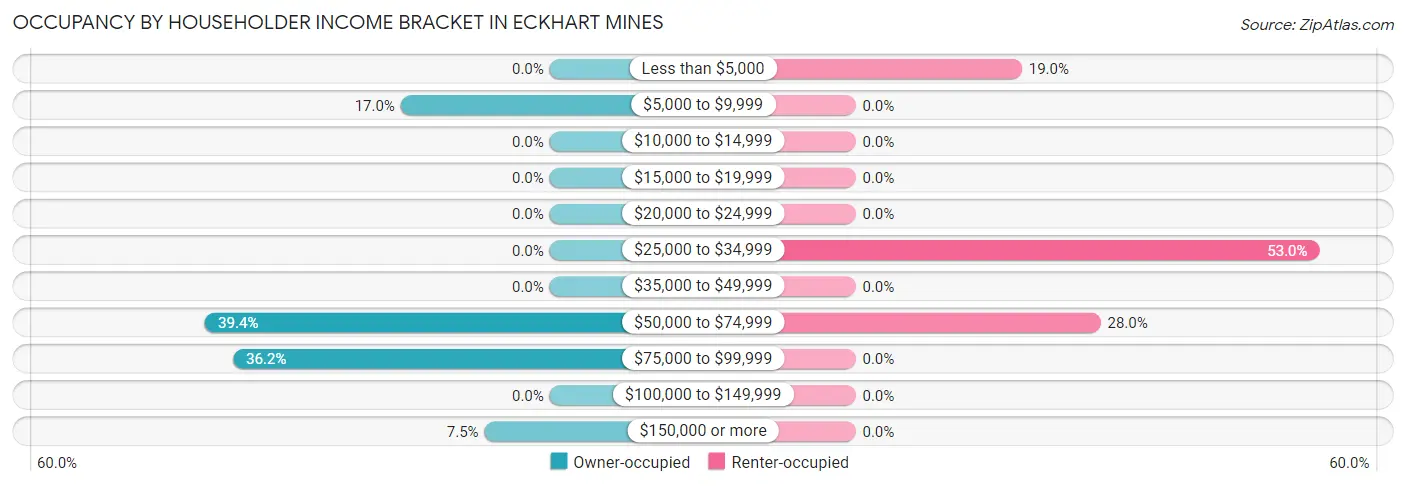
| Income Bracket | Owner-occupied | Renter-occupied |
| Less than $5,000 | 0 (0.0%) | 19 (19.0%) |
| $5,000 to $9,999 | 16 (17.0%) | 0 (0.0%) |
| $10,000 to $14,999 | 0 (0.0%) | 0 (0.0%) |
| $15,000 to $19,999 | 0 (0.0%) | 0 (0.0%) |
| $20,000 to $24,999 | 0 (0.0%) | 0 (0.0%) |
| $25,000 to $34,999 | 0 (0.0%) | 53 (53.0%) |
| $35,000 to $49,999 | 0 (0.0%) | 0 (0.0%) |
| $50,000 to $74,999 | 37 (39.4%) | 28 (28.0%) |
| $75,000 to $99,999 | 34 (36.2%) | 0 (0.0%) |
| $100,000 to $149,999 | 0 (0.0%) | 0 (0.0%) |
| $150,000 or more | 7 (7.4%) | 0 (0.0%) |
| Total | 94 (100.0%) | 100 (100.0%) |
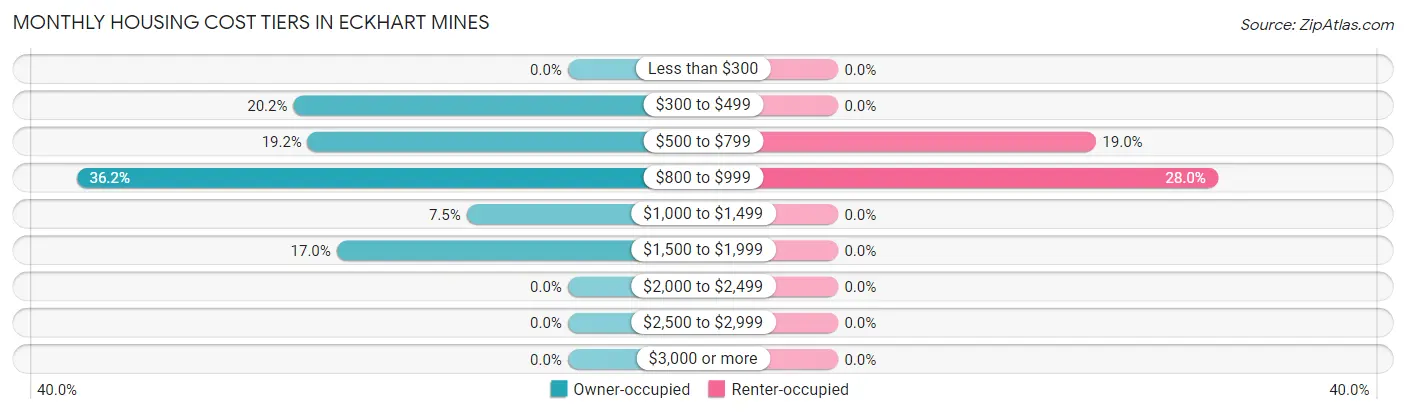
Monthly Housing Cost Tiers in Eckhart Mines
| Monthly Cost | Owner-occupied | Renter-occupied |
| Less than $300 | 0 (0.0%) | 0 (0.0%) |
| $300 to $499 | 19 (20.2%) | 0 (0.0%) |
| $500 to $799 | 18 (19.2%) | 19 (19.0%) |
| $800 to $999 | 34 (36.2%) | 28 (28.0%) |
| $1,000 to $1,499 | 7 (7.4%) | 0 (0.0%) |
| $1,500 to $1,999 | 16 (17.0%) | 0 (0.0%) |
| $2,000 to $2,499 | 0 (0.0%) | 0 (0.0%) |
| $2,500 to $2,999 | 0 (0.0%) | 0 (0.0%) |
| $3,000 or more | 0 (0.0%) | 0 (0.0%) |
| Total | 94 (100.0%) | 100 (100.0%) |
Physical Housing Characteristics in Eckhart Mines
Housing Structures in Eckhart Mines
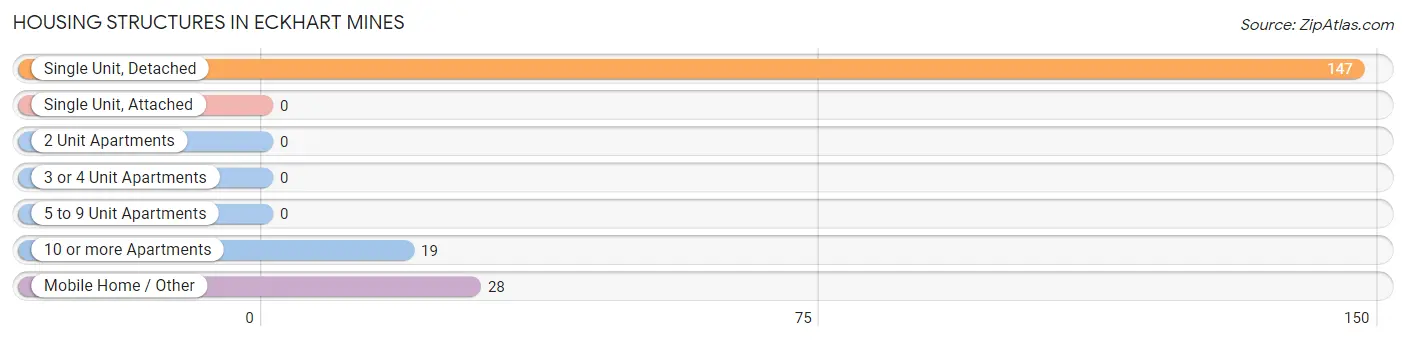
| Structure Type | # Housing Units | % Housing Units |
| Single Unit, Detached | 147 | 75.8% |
| Single Unit, Attached | 0 | 0.0% |
| 2 Unit Apartments | 0 | 0.0% |
| 3 or 4 Unit Apartments | 0 | 0.0% |
| 5 to 9 Unit Apartments | 0 | 0.0% |
| 10 or more Apartments | 19 | 9.8% |
| Mobile Home / Other | 28 | 14.4% |
| Total | 194 | 100.0% |
Housing Structures by Occupancy in Eckhart Mines
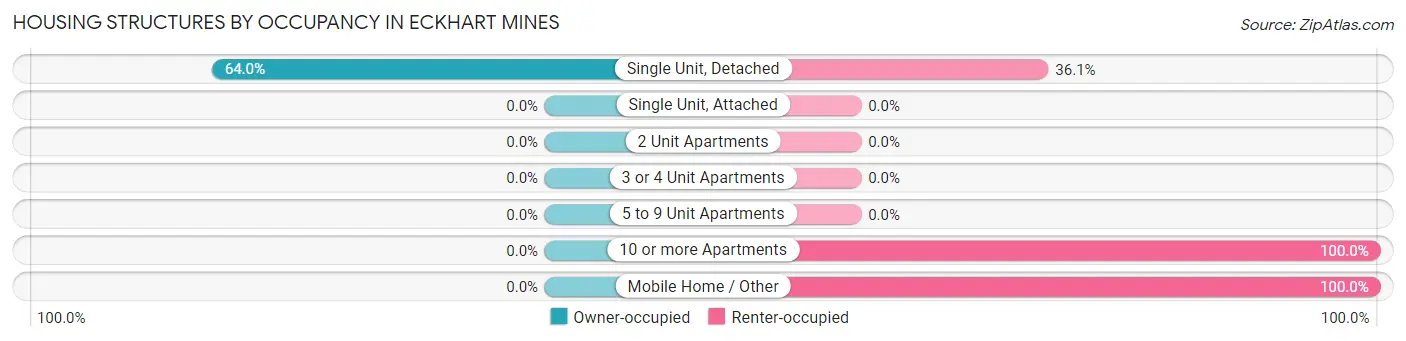
| Structure Type | Owner-occupied | Renter-occupied |
| Single Unit, Detached | 94 (63.9%) | 53 (36.0%) |
| Single Unit, Attached | 0 (0.0%) | 0 (0.0%) |
| 2 Unit Apartments | 0 (0.0%) | 0 (0.0%) |
| 3 or 4 Unit Apartments | 0 (0.0%) | 0 (0.0%) |
| 5 to 9 Unit Apartments | 0 (0.0%) | 0 (0.0%) |
| 10 or more Apartments | 0 (0.0%) | 19 (100.0%) |
| Mobile Home / Other | 0 (0.0%) | 28 (100.0%) |
| Total | 94 (48.4%) | 100 (51.5%) |
Housing Structures by Number of Rooms in Eckhart Mines
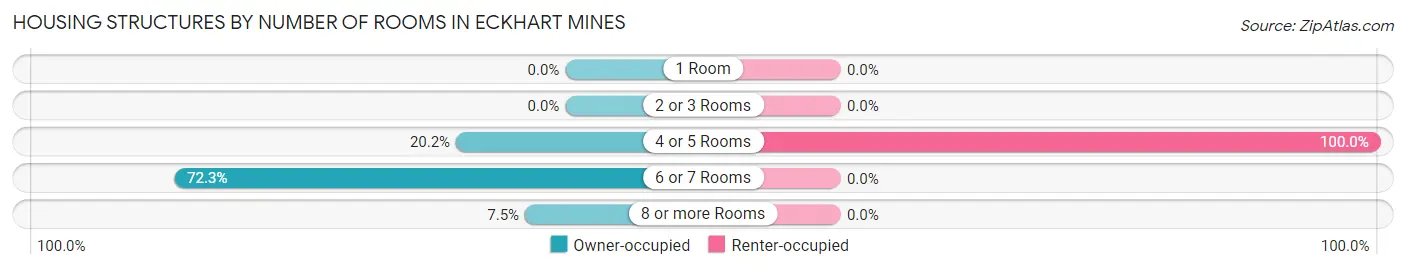
| Number of Rooms | Owner-occupied | Renter-occupied |
| 1 Room | 0 (0.0%) | 0 (0.0%) |
| 2 or 3 Rooms | 0 (0.0%) | 0 (0.0%) |
| 4 or 5 Rooms | 19 (20.2%) | 100 (100.0%) |
| 6 or 7 Rooms | 68 (72.3%) | 0 (0.0%) |
| 8 or more Rooms | 7 (7.4%) | 0 (0.0%) |
| Total | 94 (100.0%) | 100 (100.0%) |
Housing Structure by Heating Type in Eckhart Mines
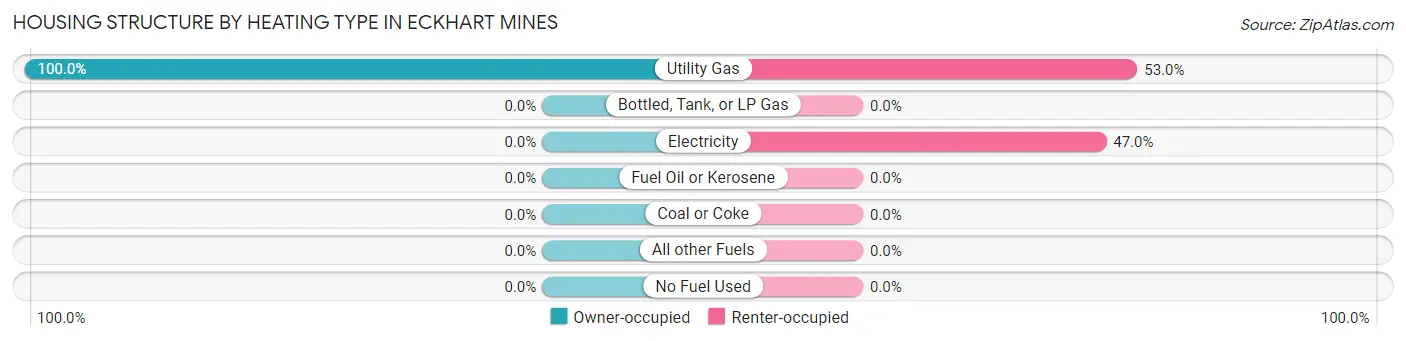
| Heating Type | Owner-occupied | Renter-occupied |
| Utility Gas | 94 (100.0%) | 53 (53.0%) |
| Bottled, Tank, or LP Gas | 0 (0.0%) | 0 (0.0%) |
| Electricity | 0 (0.0%) | 47 (47.0%) |
| Fuel Oil or Kerosene | 0 (0.0%) | 0 (0.0%) |
| Coal or Coke | 0 (0.0%) | 0 (0.0%) |
| All other Fuels | 0 (0.0%) | 0 (0.0%) |
| No Fuel Used | 0 (0.0%) | 0 (0.0%) |
| Total | 94 (100.0%) | 100 (100.0%) |
Household Vehicle Usage in Eckhart Mines
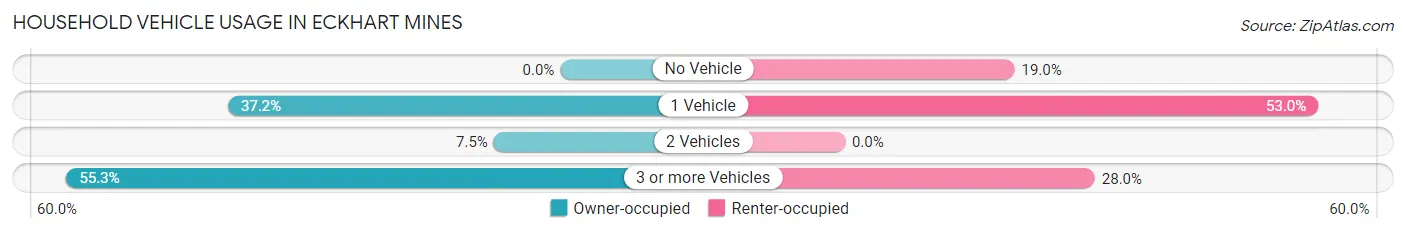
| Vehicles per Household | Owner-occupied | Renter-occupied |
| No Vehicle | 0 (0.0%) | 19 (19.0%) |
| 1 Vehicle | 35 (37.2%) | 53 (53.0%) |
| 2 Vehicles | 7 (7.4%) | 0 (0.0%) |
| 3 or more Vehicles | 52 (55.3%) | 28 (28.0%) |
| Total | 94 (100.0%) | 100 (100.0%) |
Real Estate & Mortgages in Eckhart Mines
Real Estate and Mortgage Overview in Eckhart Mines
| Characteristic | Without Mortgage | With Mortgage |
| Housing Units | 37 | 57 |
| Median Property Value | - | - |
| Median Household Income | - | - |
| Monthly Housing Costs | - | - |
| Real Estate Taxes | - | - |
Property Value by Mortgage Status in Eckhart Mines
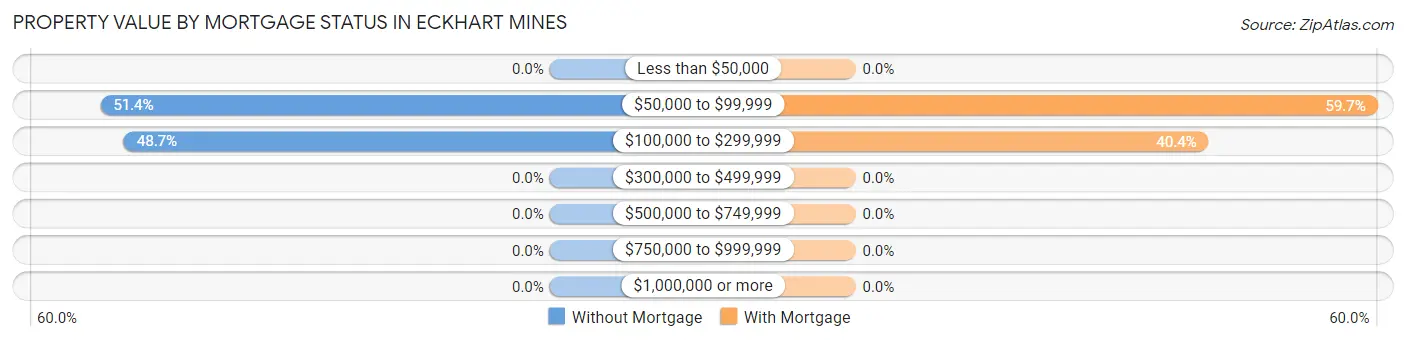
| Property Value | Without Mortgage | With Mortgage |
| Less than $50,000 | 0 (0.0%) | 0 (0.0%) |
| $50,000 to $99,999 | 19 (51.3%) | 34 (59.7%) |
| $100,000 to $299,999 | 18 (48.6%) | 23 (40.4%) |
| $300,000 to $499,999 | 0 (0.0%) | 0 (0.0%) |
| $500,000 to $749,999 | 0 (0.0%) | 0 (0.0%) |
| $750,000 to $999,999 | 0 (0.0%) | 0 (0.0%) |
| $1,000,000 or more | 0 (0.0%) | 0 (0.0%) |
| Total | 37 (100.0%) | 57 (100.0%) |
Household Income by Mortgage Status in Eckhart Mines
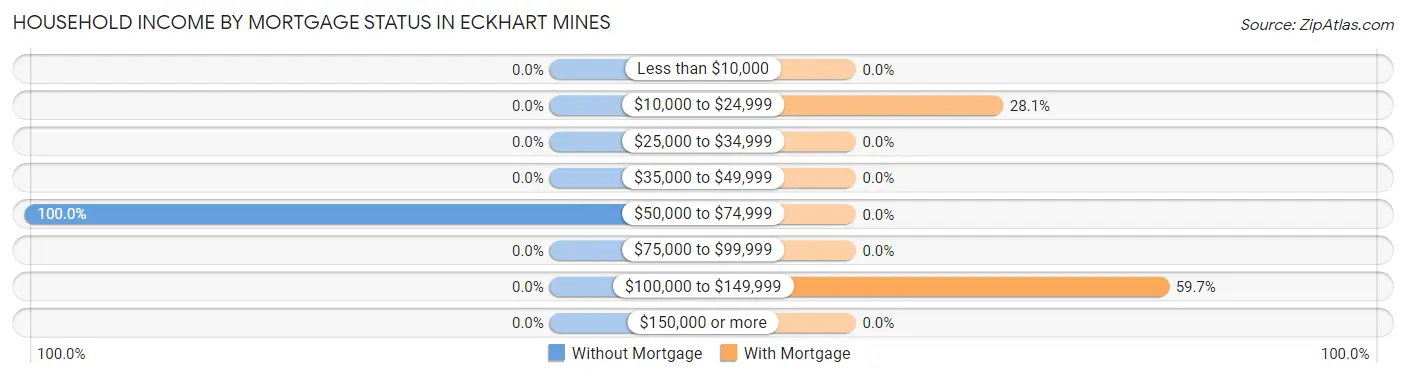
| Household Income | Without Mortgage | With Mortgage |
| Less than $10,000 | 0 (0.0%) | 0 (0.0%) |
| $10,000 to $24,999 | 0 (0.0%) | 16 (28.1%) |
| $25,000 to $34,999 | 0 (0.0%) | 0 (0.0%) |
| $35,000 to $49,999 | 0 (0.0%) | 0 (0.0%) |
| $50,000 to $74,999 | 37 (100.0%) | 0 (0.0%) |
| $75,000 to $99,999 | 0 (0.0%) | 0 (0.0%) |
| $100,000 to $149,999 | 0 (0.0%) | 34 (59.7%) |
| $150,000 or more | 0 (0.0%) | 0 (0.0%) |
| Total | 37 (100.0%) | 57 (100.0%) |
Property Value to Household Income Ratio in Eckhart Mines
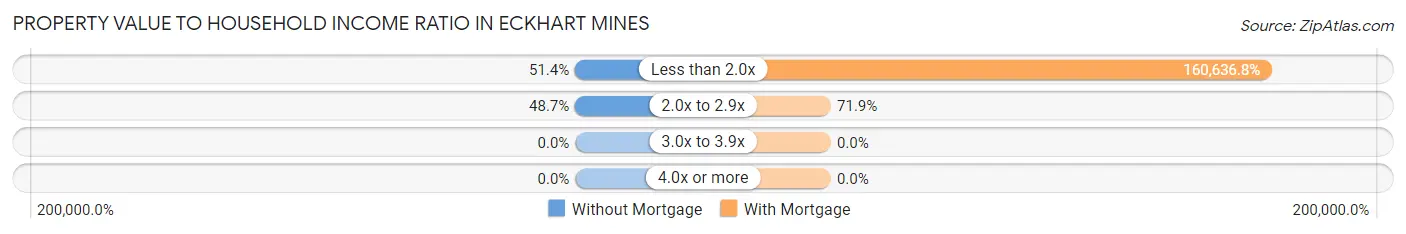
| Value-to-Income Ratio | Without Mortgage | With Mortgage |
| Less than 2.0x | 19 (51.3%) | 91,563 (160,636.8%) |
| 2.0x to 2.9x | 18 (48.6%) | 41 (71.9%) |
| 3.0x to 3.9x | 0 (0.0%) | 0 (0.0%) |
| 4.0x or more | 0 (0.0%) | 0 (0.0%) |
| Total | 37 (100.0%) | 57 (100.0%) |
Real Estate Taxes by Mortgage Status in Eckhart Mines
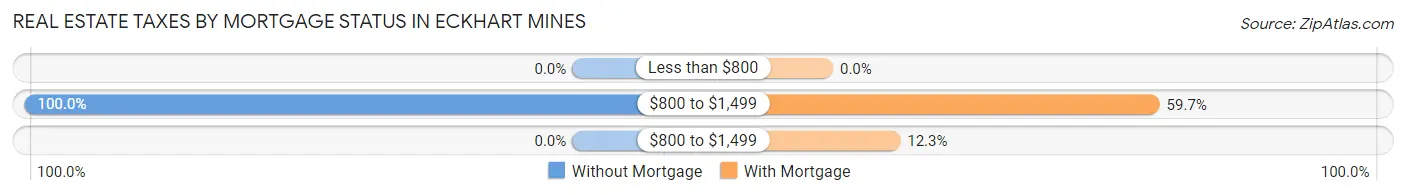
| Property Taxes | Without Mortgage | With Mortgage |
| Less than $800 | 0 (0.0%) | 0 (0.0%) |
| $800 to $1,499 | 37 (100.0%) | 34 (59.7%) |
| $800 to $1,499 | 0 (0.0%) | 7 (12.3%) |
| Total | 37 (100.0%) | 57 (100.0%) |
Health & Disability in Eckhart Mines
Health Insurance Coverage by Age in Eckhart Mines
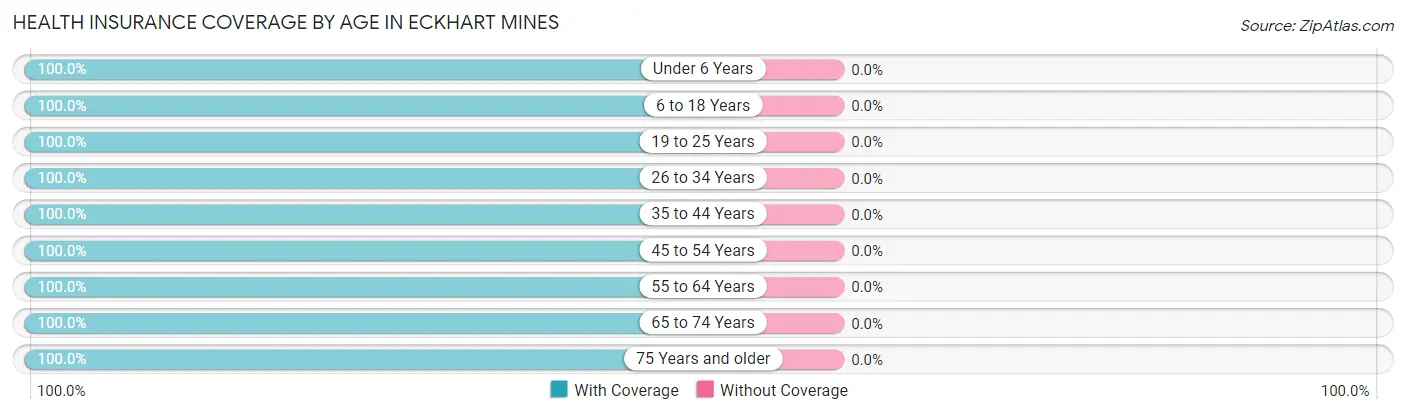
| Age Bracket | With Coverage | Without Coverage |
| Under 6 Years | 26 (100.0%) | 0 (0.0%) |
| 6 to 18 Years | 102 (100.0%) | 0 (0.0%) |
| 19 to 25 Years | 28 (100.0%) | 0 (0.0%) |
| 26 to 34 Years | 41 (100.0%) | 0 (0.0%) |
| 35 to 44 Years | 56 (100.0%) | 0 (0.0%) |
| 45 to 54 Years | 43 (100.0%) | 0 (0.0%) |
| 55 to 64 Years | 130 (100.0%) | 0 (0.0%) |
| 65 to 74 Years | 55 (100.0%) | 0 (0.0%) |
| 75 Years and older | 33 (100.0%) | 0 (0.0%) |
| Total | 514 (100.0%) | 0 (0.0%) |
Health Insurance Coverage by Citizenship Status in Eckhart Mines
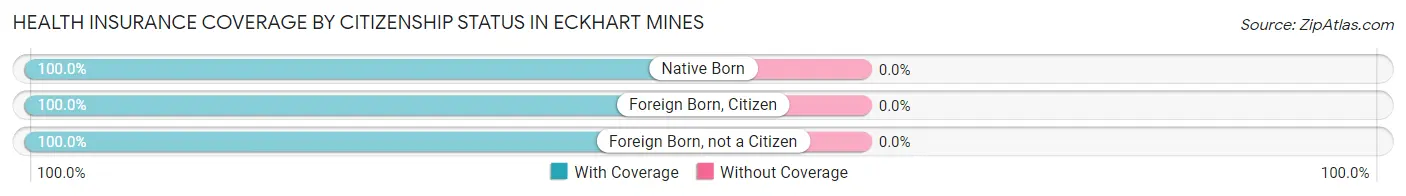
| Citizenship Status | With Coverage | Without Coverage |
| Native Born | 26 (100.0%) | 0 (0.0%) |
| Foreign Born, Citizen | 102 (100.0%) | 0 (0.0%) |
| Foreign Born, not a Citizen | 28 (100.0%) | 0 (0.0%) |
Health Insurance Coverage by Household Income in Eckhart Mines
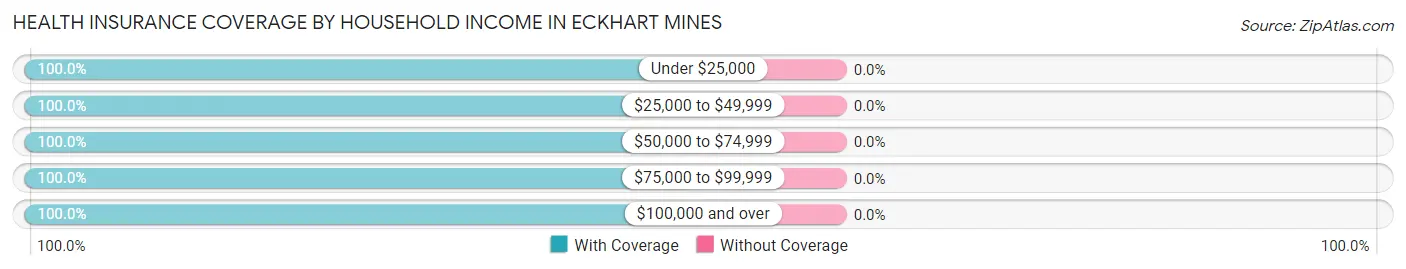
| Household Income | With Coverage | Without Coverage |
| Under $25,000 | 35 (100.0%) | 0 (0.0%) |
| $25,000 to $49,999 | 111 (100.0%) | 0 (0.0%) |
| $50,000 to $74,999 | 234 (100.0%) | 0 (0.0%) |
| $75,000 to $99,999 | 117 (100.0%) | 0 (0.0%) |
| $100,000 and over | 17 (100.0%) | 0 (0.0%) |
Public vs Private Health Insurance Coverage by Age in Eckhart Mines
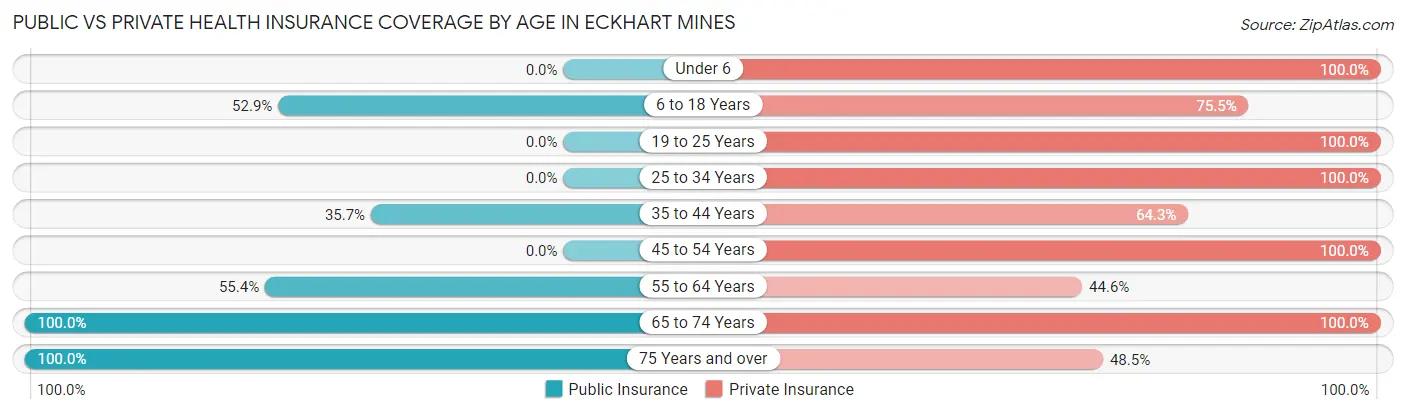
| Age Bracket | Public Insurance | Private Insurance |
| Under 6 | 0 (0.0%) | 26 (100.0%) |
| 6 to 18 Years | 54 (52.9%) | 77 (75.5%) |
| 19 to 25 Years | 0 (0.0%) | 28 (100.0%) |
| 25 to 34 Years | 0 (0.0%) | 41 (100.0%) |
| 35 to 44 Years | 20 (35.7%) | 36 (64.3%) |
| 45 to 54 Years | 0 (0.0%) | 43 (100.0%) |
| 55 to 64 Years | 72 (55.4%) | 58 (44.6%) |
| 65 to 74 Years | 55 (100.0%) | 55 (100.0%) |
| 75 Years and over | 33 (100.0%) | 16 (48.5%) |
| Total | 234 (45.5%) | 380 (73.9%) |
Disability Status by Sex by Age in Eckhart Mines
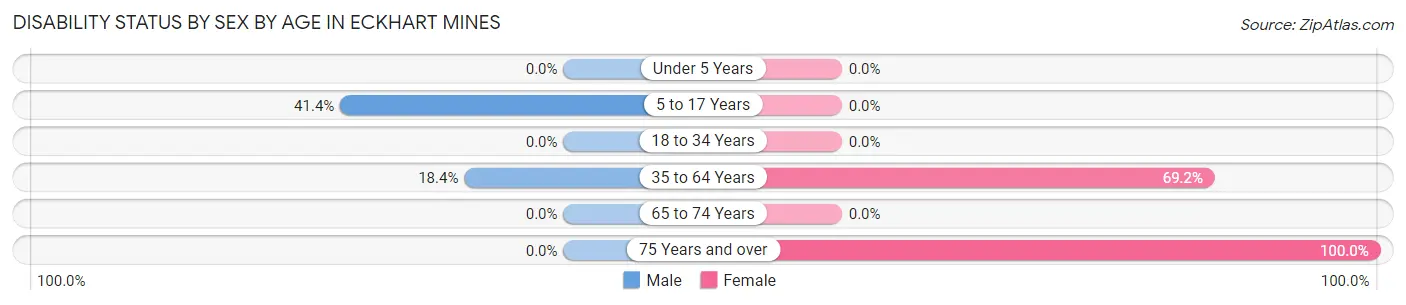
| Age Bracket | Male | Female |
| Under 5 Years | 0 (0.0%) | 0 (0.0%) |
| 5 to 17 Years | 29 (41.4%) | 0 (0.0%) |
| 18 to 34 Years | 0 (0.0%) | 0 (0.0%) |
| 35 to 64 Years | 23 (18.4%) | 72 (69.2%) |
| 65 to 74 Years | 0 (0.0%) | 0 (0.0%) |
| 75 Years and over | 0 (0.0%) | 33 (100.0%) |
Disability Class by Sex by Age in Eckhart Mines
Disability Class: Hearing Difficulty
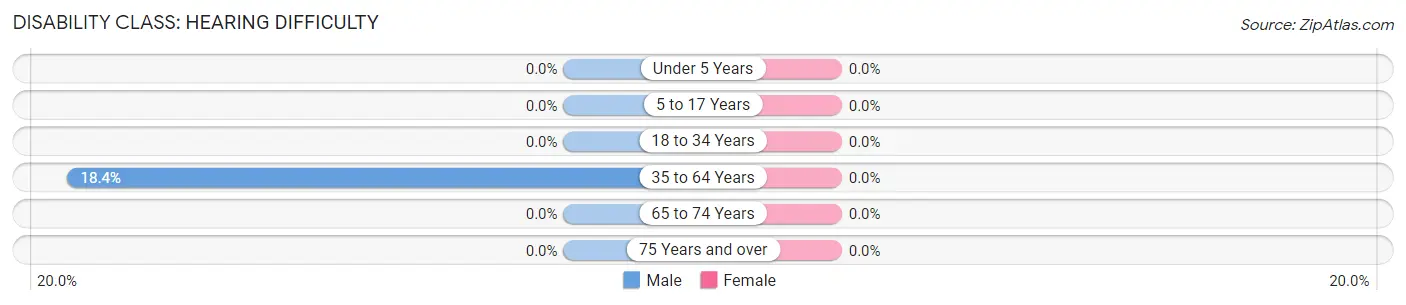
| Age Bracket | Male | Female |
| Under 5 Years | 0 (0.0%) | 0 (0.0%) |
| 5 to 17 Years | 0 (0.0%) | 0 (0.0%) |
| 18 to 34 Years | 0 (0.0%) | 0 (0.0%) |
| 35 to 64 Years | 23 (18.4%) | 0 (0.0%) |
| 65 to 74 Years | 0 (0.0%) | 0 (0.0%) |
| 75 Years and over | 0 (0.0%) | 0 (0.0%) |
Disability Class: Vision Difficulty
| Age Bracket | Male | Female |
| Under 5 Years | 0 (0.0%) | 0 (0.0%) |
| 5 to 17 Years | 0 (0.0%) | 0 (0.0%) |
| 18 to 34 Years | 0 (0.0%) | 0 (0.0%) |
| 35 to 64 Years | 0 (0.0%) | 0 (0.0%) |
| 65 to 74 Years | 0 (0.0%) | 0 (0.0%) |
| 75 Years and over | 0 (0.0%) | 0 (0.0%) |
Disability Class: Cognitive Difficulty
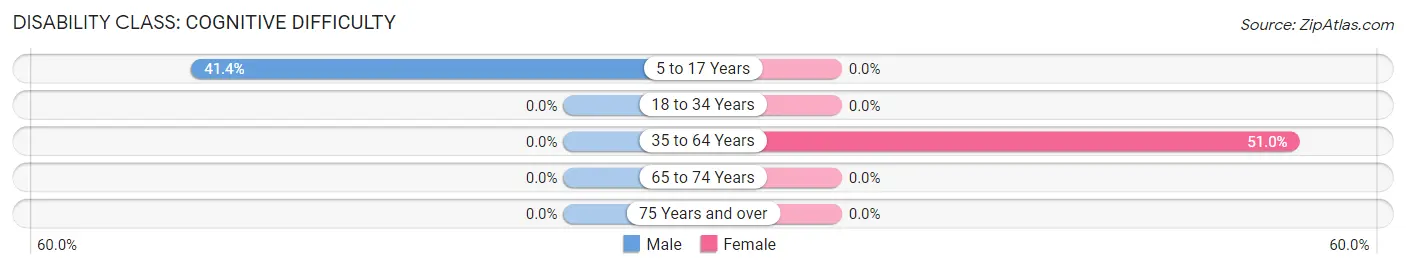
| Age Bracket | Male | Female |
| 5 to 17 Years | 29 (41.4%) | 0 (0.0%) |
| 18 to 34 Years | 0 (0.0%) | 0 (0.0%) |
| 35 to 64 Years | 0 (0.0%) | 53 (51.0%) |
| 65 to 74 Years | 0 (0.0%) | 0 (0.0%) |
| 75 Years and over | 0 (0.0%) | 0 (0.0%) |
Disability Class: Ambulatory Difficulty
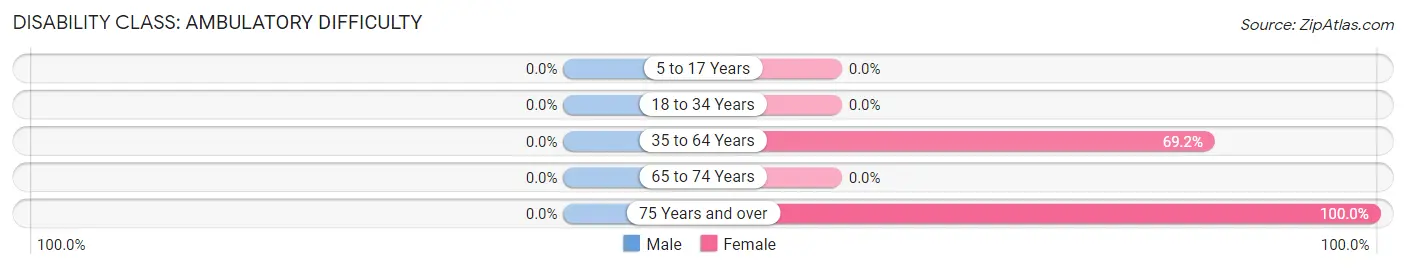
| Age Bracket | Male | Female |
| 5 to 17 Years | 0 (0.0%) | 0 (0.0%) |
| 18 to 34 Years | 0 (0.0%) | 0 (0.0%) |
| 35 to 64 Years | 0 (0.0%) | 72 (69.2%) |
| 65 to 74 Years | 0 (0.0%) | 0 (0.0%) |
| 75 Years and over | 0 (0.0%) | 33 (100.0%) |
Disability Class: Self-Care Difficulty
| Age Bracket | Male | Female |
| 5 to 17 Years | 0 (0.0%) | 0 (0.0%) |
| 18 to 34 Years | 0 (0.0%) | 0 (0.0%) |
| 35 to 64 Years | 0 (0.0%) | 0 (0.0%) |
| 65 to 74 Years | 0 (0.0%) | 0 (0.0%) |
| 75 Years and over | 0 (0.0%) | 0 (0.0%) |
Technology Access in Eckhart Mines
Computing Device Access in Eckhart Mines
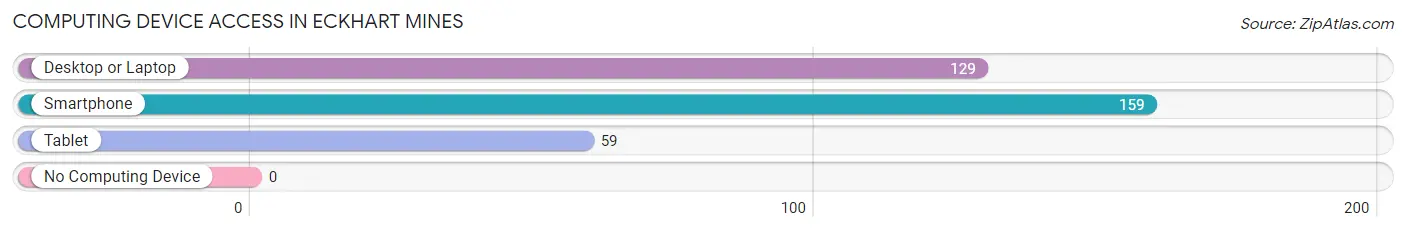
| Device Type | # Households | % Households |
| Desktop or Laptop | 129 | 66.5% |
| Smartphone | 159 | 82.0% |
| Tablet | 59 | 30.4% |
| No Computing Device | 0 | 0.0% |
| Total | 194 | 100.0% |
Internet Access in Eckhart Mines
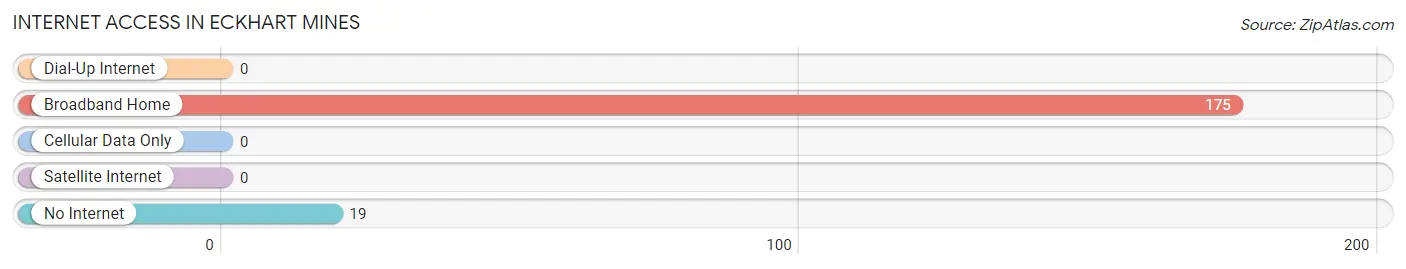
| Internet Type | # Households | % Households |
| Dial-Up Internet | 0 | 0.0% |
| Broadband Home | 175 | 90.2% |
| Cellular Data Only | 0 | 0.0% |
| Satellite Internet | 0 | 0.0% |
| No Internet | 19 | 9.8% |
| Total | 194 | 100.0% |
Eckhart Mines Summary
Eckhart Mines is an unincorporated community located in Allegany County, Maryland. It is situated in the Appalachian Mountains, approximately two miles east of Frostburg. The town was founded in 1837 and named after the Eckhart family, who owned the land at the time. The town was originally a mining town, and the Eckhart Mines were the largest coal mines in the area.
History
The town of Eckhart Mines was founded in 1837 by the Eckhart family, who owned the land at the time. The Eckhart family had been living in the area since the late 1700s, and they had been mining coal since the early 1800s. The Eckhart Mines were the largest coal mines in the area, and they provided employment for many of the town's residents. The town grew rapidly in the late 1800s and early 1900s, and by the 1920s it had a population of over 1,000 people.
The town was home to several churches, a school, a post office, and a variety of businesses. The Eckhart Mines were the main source of employment for the town's residents, and the coal industry was the main source of income for the town. The town also had a thriving agricultural industry, and many of the town's residents were farmers.
The town began to decline in the mid-1900s, as the coal industry began to decline. The Eckhart Mines closed in the 1950s, and the town's population began to decline as well. By the 2000s, the town's population had dropped to just over 500 people.
Geography
Eckhart Mines is located in Allegany County, Maryland, in the Appalachian Mountains. The town is situated approximately two miles east of Frostburg, and it is bordered by the towns of Midland and Barton. The town is located at an elevation of 1,890 feet above sea level. The town is surrounded by mountains and hills, and the town is located in a valley. The town is located near the Potomac River, and the town is also located near the Savage River State Forest.
Economy
The economy of Eckhart Mines is largely based on agriculture and tourism. The town is home to several farms, and the town is also home to several tourist attractions, such as the Eckhart Mines Museum and the Eckhart Mines Railroad. The town is also home to several small businesses, such as restaurants, stores, and gas stations.
Demographics
As of the 2010 census, the population of Eckhart Mines was 517 people. The town is predominantly white, with 95.3% of the population being white. The median household income in the town is $37,500, and the median age is 44. The town has a poverty rate of 16.3%, and the unemployment rate is 6.3%.
Conclusion
Eckhart Mines is an unincorporated community located in Allegany County, Maryland. The town was founded in 1837 and was originally a mining town. The town's economy is largely based on agriculture and tourism, and the town is home to several tourist attractions. The town has a population of 517 people, and the median household income is $37,500. The town has a poverty rate of 16.3%, and the unemployment rate is 6.3%.
Common Questions
What is Per Capita Income in Eckhart Mines?
Per Capita income in Eckhart Mines is $20,535.
What is the Median Family Income in Eckhart Mines?
Median Family Income in Eckhart Mines is $52,366.
What is the Median Household income in Eckhart Mines?
Median Household Income in Eckhart Mines is $50,804.
What is Income or Wage Gap in Eckhart Mines?
Income or Wage Gap in Eckhart Mines is 27.2%.
Women in Eckhart Mines earn 72.8 cents for every dollar earned by a man.
What is Inequality or Gini Index in Eckhart Mines?
Inequality or Gini Index in Eckhart Mines is 0.38.
What is the Total Population of Eckhart Mines?
Total Population of Eckhart Mines is 514.
What is the Total Male Population of Eckhart Mines?
Total Male Population of Eckhart Mines is 284.
What is the Total Female Population of Eckhart Mines?
Total Female Population of Eckhart Mines is 230.
What is the Ratio of Males per 100 Females in Eckhart Mines?
There are 123.48 Males per 100 Females in Eckhart Mines.
What is the Ratio of Females per 100 Males in Eckhart Mines?
There are 80.99 Females per 100 Males in Eckhart Mines.
What is the Median Population Age in Eckhart Mines?
Median Population Age in Eckhart Mines is 48.2 Years.
What is the Average Family Size in Eckhart Mines
Average Family Size in Eckhart Mines is 3.0 People.
What is the Average Household Size in Eckhart Mines
Average Household Size in Eckhart Mines is 2.6 People.
How Large is the Labor Force in Eckhart Mines?
There are 216 People in the Labor Forcein in Eckhart Mines.
What is the Percentage of People in the Labor Force in Eckhart Mines?
53.5% of People are in the Labor Force in Eckhart Mines.
What is the Unemployment Rate in Eckhart Mines?
Unemployment Rate in Eckhart Mines is 9.3%.