Zip Codes with the Highest Percentage of Population Employed in Installation, Maintenance & Repair in Rockville, MD
RELATED REPORTS & OPTIONS
Installation, Maintenance & Repair
Rockville
Compare Zip Codes
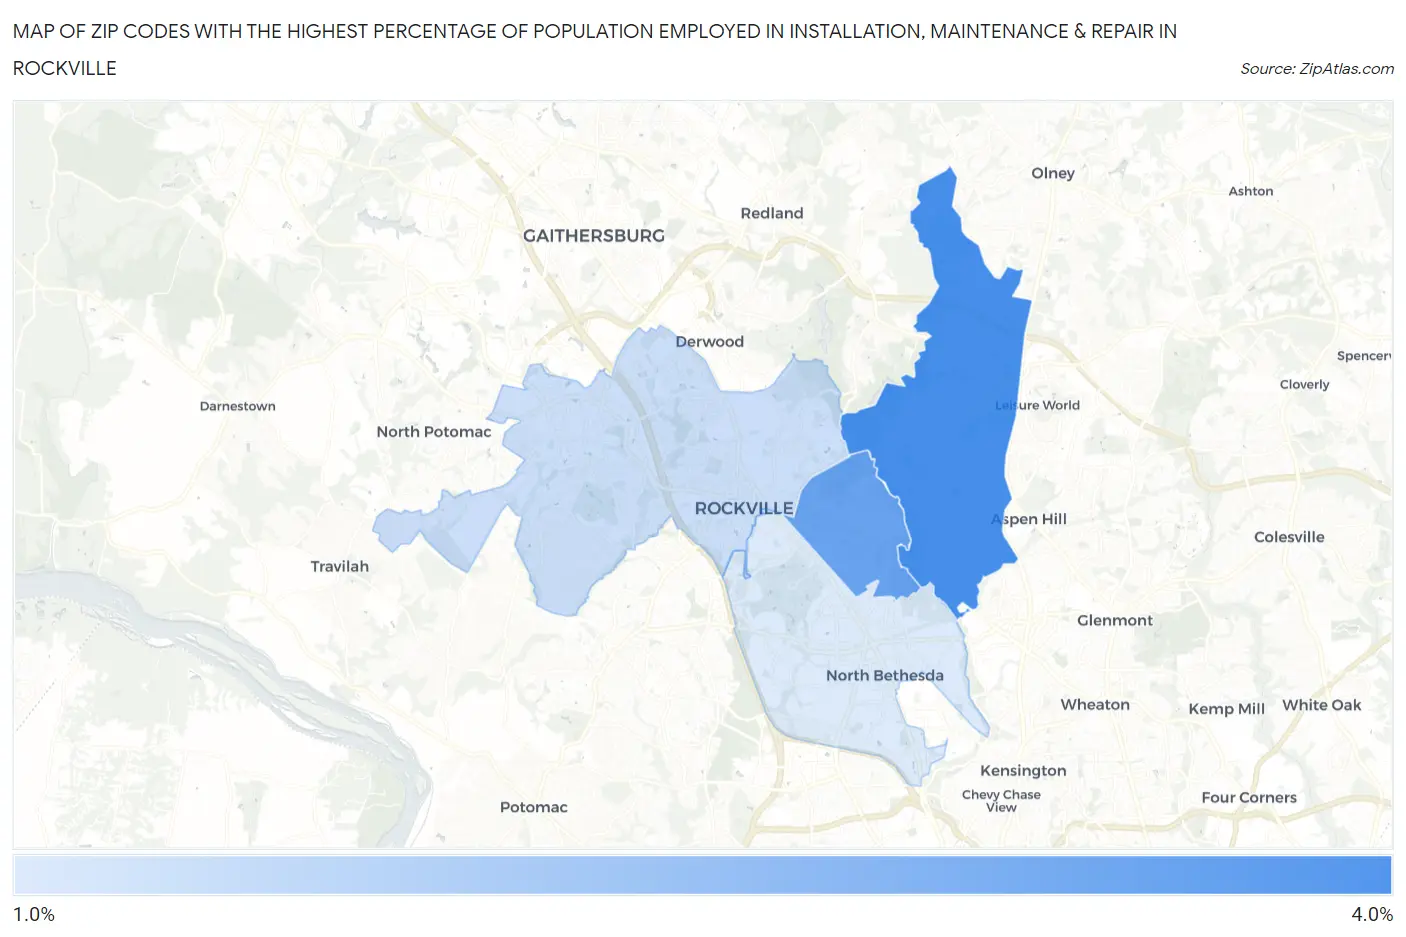
Map of Zip Codes with the Highest Percentage of Population Employed in Installation, Maintenance & Repair in Rockville
1.2%
3.4%
Zip Codes with the Highest Percentage of Population Employed in Installation, Maintenance & Repair in Rockville, MD
| Zip Code | % Employed | vs State | vs National | |
| 1. | 20853 | 3.4% | 2.8%(+0.652)#175 | 3.1%(+0.380)#14,875 |
| 2. | 20851 | 3.0% | 2.8%(+0.161)#200 | 3.1%(-0.111)#17,198 |
| 3. | 20850 | 1.5% | 2.8%(-1.34)#317 | 3.1%(-1.62)#24,361 |
| 4. | 20852 | 1.2% | 2.8%(-1.62)#337 | 3.1%(-1.89)#25,354 |
1
Common Questions
What are the Top 3 Zip Codes with the Highest Percentage of Population Employed in Installation, Maintenance & Repair in Rockville, MD?
Top 3 Zip Codes with the Highest Percentage of Population Employed in Installation, Maintenance & Repair in Rockville, MD are:
What zip code has the Highest Percentage of Population Employed in Installation, Maintenance & Repair in Rockville, MD?
20853 has the Highest Percentage of Population Employed in Installation, Maintenance & Repair in Rockville, MD with 3.4%.
What is the Percentage of Population Employed in Installation, Maintenance & Repair in Rockville, MD?
Percentage of Population Employed in Installation, Maintenance & Repair in Rockville is 1.9%.
What is the Percentage of Population Employed in Installation, Maintenance & Repair in Maryland?
Percentage of Population Employed in Installation, Maintenance & Repair in Maryland is 2.8%.
What is the Percentage of Population Employed in Installation, Maintenance & Repair in the United States?
Percentage of Population Employed in Installation, Maintenance & Repair in the United States is 3.1%.