Cordova, MD Map & Demographics
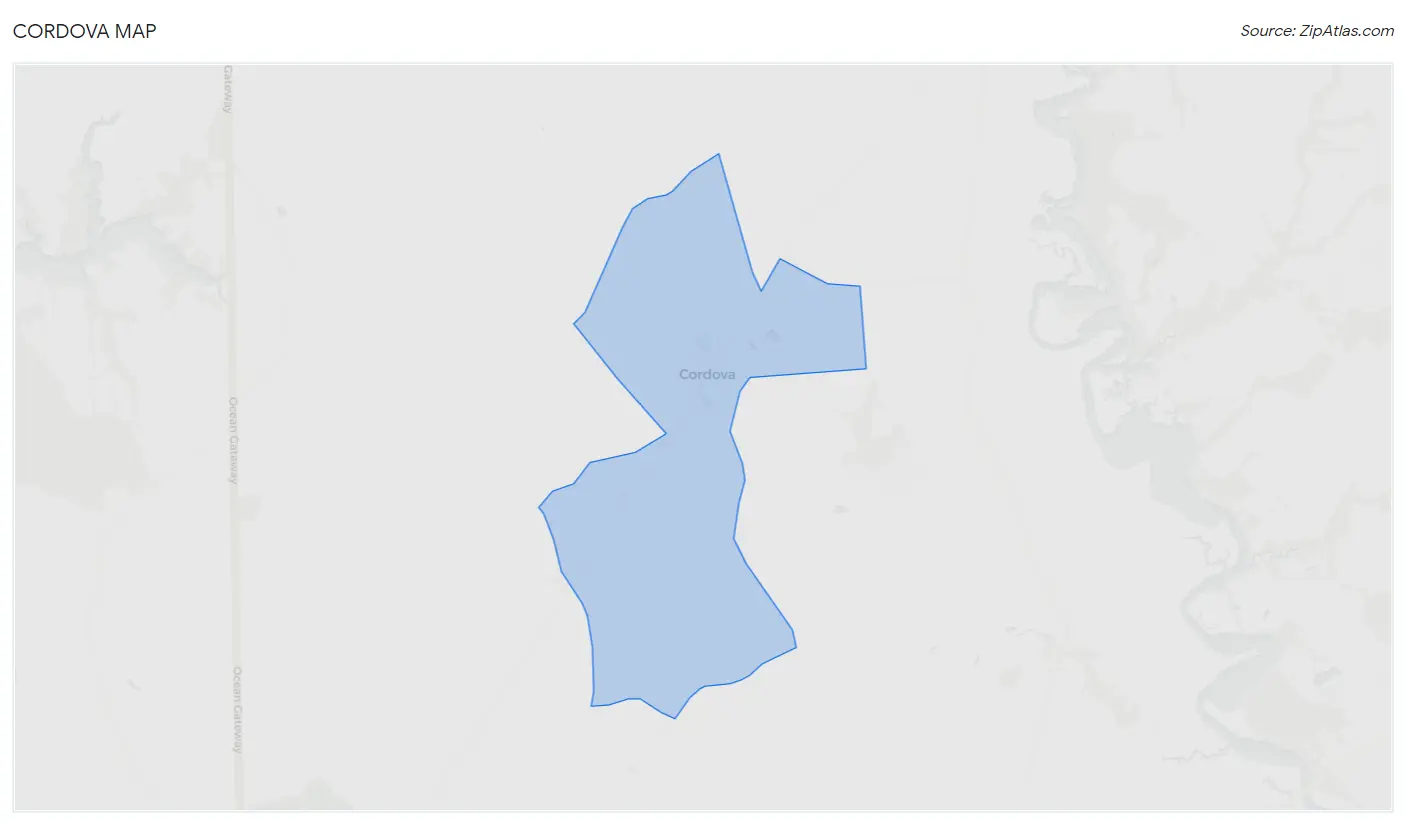
Cordova Map
Cordova Overview
$46,620
PER CAPITA INCOME
$92,171
AVG FAMILY INCOME
$100,313
AVG HOUSEHOLD INCOME
0.42
INEQUALITY / GINI INDEX
509
TOTAL POPULATION
305
MALE POPULATION
204
FEMALE POPULATION
149.51
MALES / 100 FEMALES
66.89
FEMALES / 100 MALES
46.8
MEDIAN AGE
3.4
AVG FAMILY SIZE
3.3
AVG HOUSEHOLD SIZE
191
LABOR FORCE [ PEOPLE ]
41.3%
PERCENT IN LABOR FORCE
Cordova Zip Codes
Cordova Area Codes
Income in Cordova
Income Overview in Cordova
Per Capita Income in Cordova is $46,620, while median incomes of families and households are $92,171 and $100,313 respectively.
| Characteristic | Number | Measure |
| Per Capita Income | 509 | $46,620 |
| Median Family Income | 125 | $92,171 |
| Mean Family Income | 125 | $129,022 |
| Median Household Income | 154 | $100,313 |
| Mean Household Income | 154 | $145,373 |
| Income Deficit | 125 | $0 |
| Wage / Income Gap (%) | 509 | 0.00% |
| Wage / Income Gap ($) | 509 | 100.00¢ per $1 |
| Gini / Inequality Index | 509 | 0.42 |
Earnings by Sex in Cordova
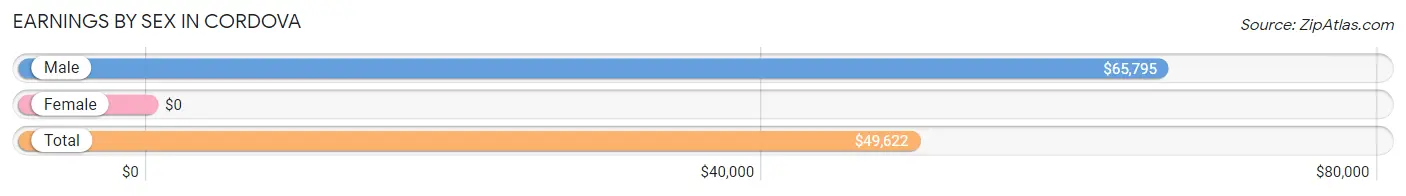
| Sex | Number | Average Earnings |
| Male | 133 (69.6%) | $65,795 |
| Female | 58 (30.4%) | $0 |
| Total | 191 (100.0%) | $49,622 |
Earnings by Sex by Income Bracket in Cordova
The most common earnings brackets in Cordova are $100,000+ for men (59 | 44.4%) and $25,000 to $29,999 for women (28 | 48.3%).
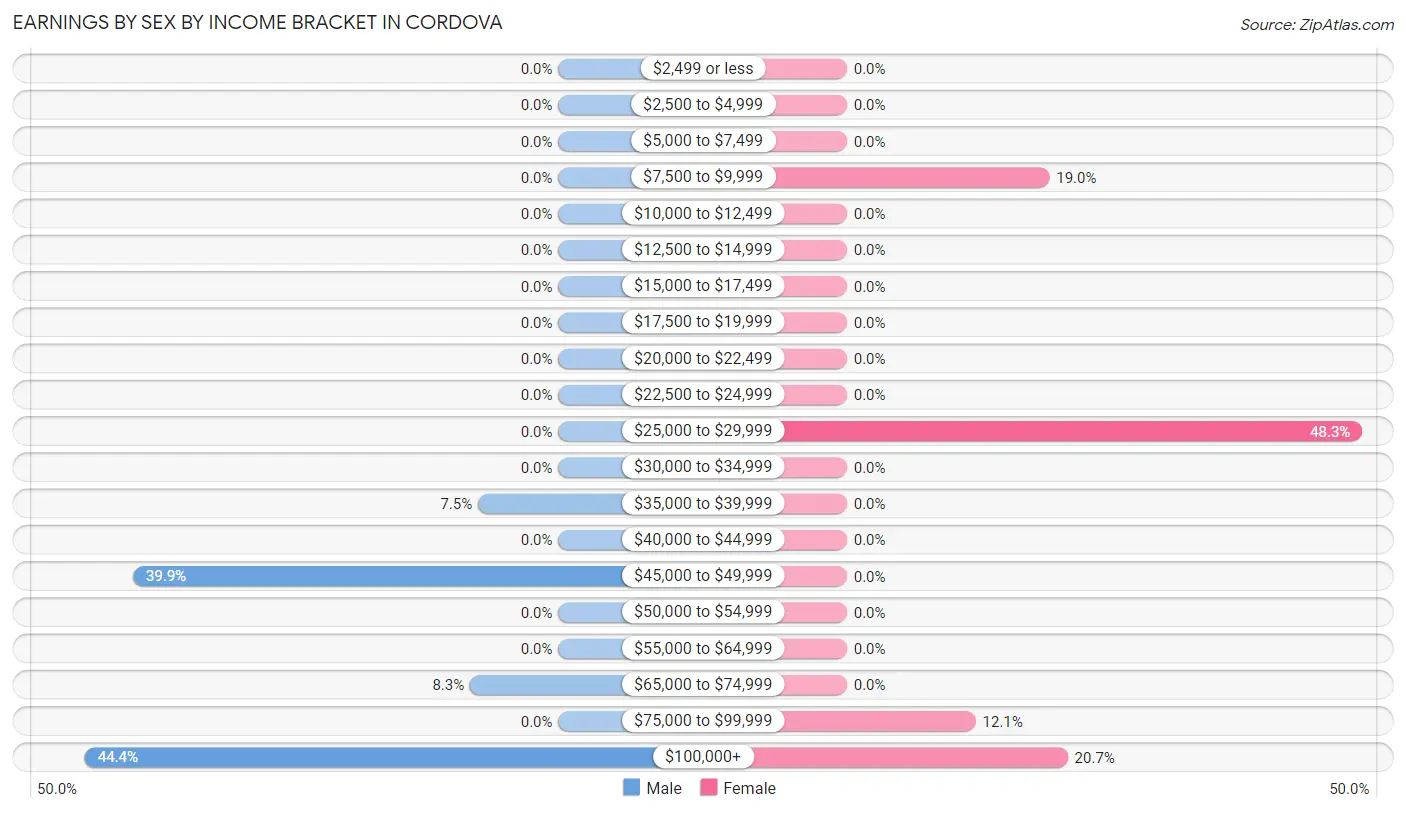
| Income | Male | Female |
| $2,499 or less | 0 (0.0%) | 0 (0.0%) |
| $2,500 to $4,999 | 0 (0.0%) | 0 (0.0%) |
| $5,000 to $7,499 | 0 (0.0%) | 0 (0.0%) |
| $7,500 to $9,999 | 0 (0.0%) | 11 (19.0%) |
| $10,000 to $12,499 | 0 (0.0%) | 0 (0.0%) |
| $12,500 to $14,999 | 0 (0.0%) | 0 (0.0%) |
| $15,000 to $17,499 | 0 (0.0%) | 0 (0.0%) |
| $17,500 to $19,999 | 0 (0.0%) | 0 (0.0%) |
| $20,000 to $22,499 | 0 (0.0%) | 0 (0.0%) |
| $22,500 to $24,999 | 0 (0.0%) | 0 (0.0%) |
| $25,000 to $29,999 | 0 (0.0%) | 28 (48.3%) |
| $30,000 to $34,999 | 0 (0.0%) | 0 (0.0%) |
| $35,000 to $39,999 | 10 (7.5%) | 0 (0.0%) |
| $40,000 to $44,999 | 0 (0.0%) | 0 (0.0%) |
| $45,000 to $49,999 | 53 (39.9%) | 0 (0.0%) |
| $50,000 to $54,999 | 0 (0.0%) | 0 (0.0%) |
| $55,000 to $64,999 | 0 (0.0%) | 0 (0.0%) |
| $65,000 to $74,999 | 11 (8.3%) | 0 (0.0%) |
| $75,000 to $99,999 | 0 (0.0%) | 7 (12.1%) |
| $100,000+ | 59 (44.4%) | 12 (20.7%) |
| Total | 133 (100.0%) | 58 (100.0%) |
Earnings by Sex by Educational Attainment in Cordova
| Educational Attainment | Male Income | Female Income |
| Less than High School | - | - |
| High School Diploma | - | - |
| College or Associate's Degree | - | - |
| Bachelor's Degree | - | - |
| Graduate Degree | - | - |
| Total | - | - |
Family Income in Cordova
Family Income Brackets in Cordova
According to the Cordova family income data, there are 53 families falling into the $75,000 to $99,999 income range, which is the most common income bracket and makes up 42.4% of all families.
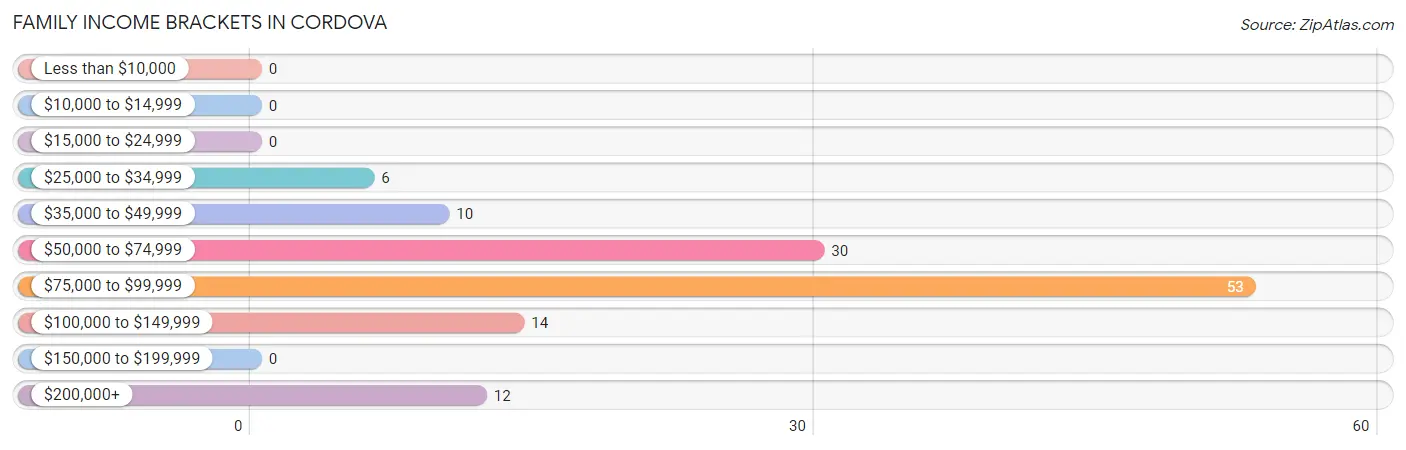
| Income Bracket | # Families | % Families |
| Less than $10,000 | 0 | 0.0% |
| $10,000 to $14,999 | 0 | 0.0% |
| $15,000 to $24,999 | 0 | 0.0% |
| $25,000 to $34,999 | 6 | 4.8% |
| $35,000 to $49,999 | 10 | 8.0% |
| $50,000 to $74,999 | 30 | 24.0% |
| $75,000 to $99,999 | 53 | 42.4% |
| $100,000 to $149,999 | 14 | 11.2% |
| $150,000 to $199,999 | 0 | 0.0% |
| $200,000+ | 12 | 9.6% |
Family Income by Famaliy Size in Cordova
2-person families (20 | 16.0%) account for the highest median family income in Cordova with $111,429 per family, while 2-person families (20 | 16.0%) have the highest median income of $55,714 per family member.
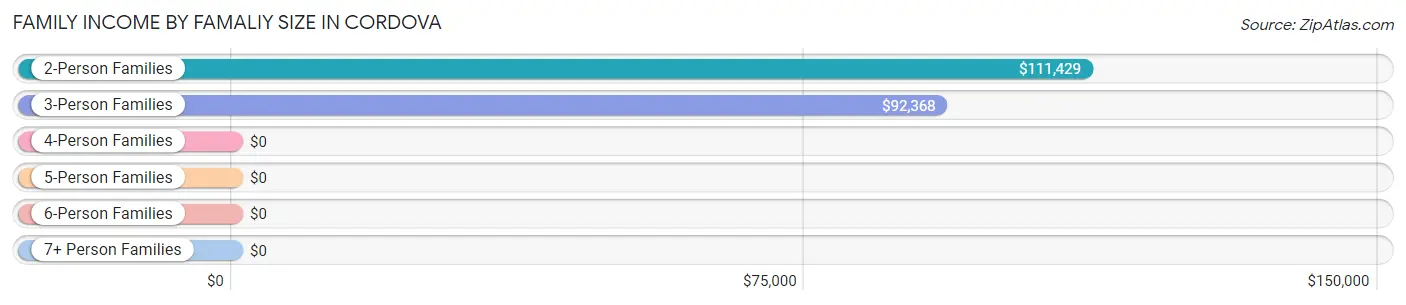
| Income Bracket | # Families | Median Income |
| 2-Person Families | 20 (16.0%) | $111,429 |
| 3-Person Families | 94 (75.2%) | $92,368 |
| 4-Person Families | 11 (8.8%) | $0 |
| 5-Person Families | 0 (0.0%) | $0 |
| 6-Person Families | 0 (0.0%) | $0 |
| 7+ Person Families | 0 (0.0%) | $0 |
| Total | 125 (100.0%) | $92,171 |
Family Income by Number of Earners in Cordova
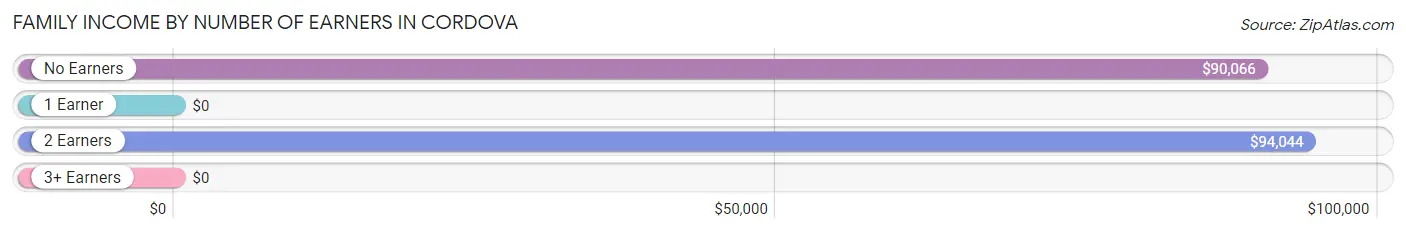
| Number of Earners | # Families | Median Income |
| No Earners | 51 (40.8%) | $90,066 |
| 1 Earner | 10 (8.0%) | $0 |
| 2 Earners | 64 (51.2%) | $94,044 |
| 3+ Earners | 0 (0.0%) | $0 |
| Total | 125 (100.0%) | $92,171 |
Household Income in Cordova
Household Income Brackets in Cordova
With 46 households falling in the category, the $200,000+ income range is the most frequent in Cordova, accounting for 29.9% of all households.
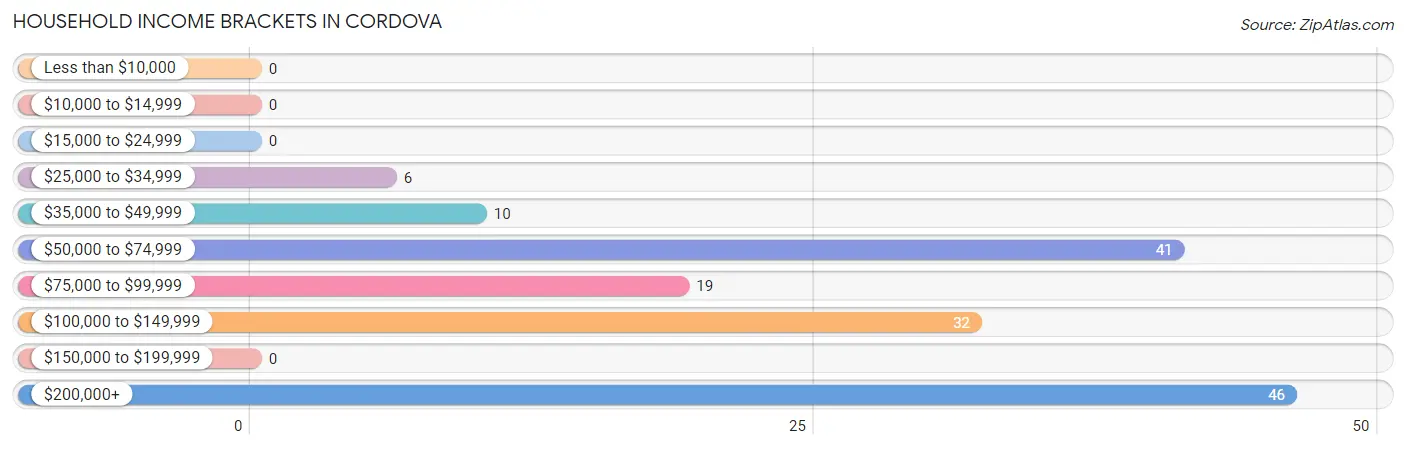
| Income Bracket | # Households | % Households |
| Less than $10,000 | 0 | 0.0% |
| $10,000 to $14,999 | 0 | 0.0% |
| $15,000 to $24,999 | 0 | 0.0% |
| $25,000 to $34,999 | 6 | 3.9% |
| $35,000 to $49,999 | 10 | 6.5% |
| $50,000 to $74,999 | 41 | 26.6% |
| $75,000 to $99,999 | 19 | 12.3% |
| $100,000 to $149,999 | 32 | 20.8% |
| $150,000 to $199,999 | 0 | 0.0% |
| $200,000+ | 46 | 29.9% |
Household Income by Householder Age in Cordova
The median household income in Cordova is $100,313, with the highest median household income of $202,721 found in the 45 to 64 years age bracket for the primary householder. A total of 62 households (40.3%) fall into this category.
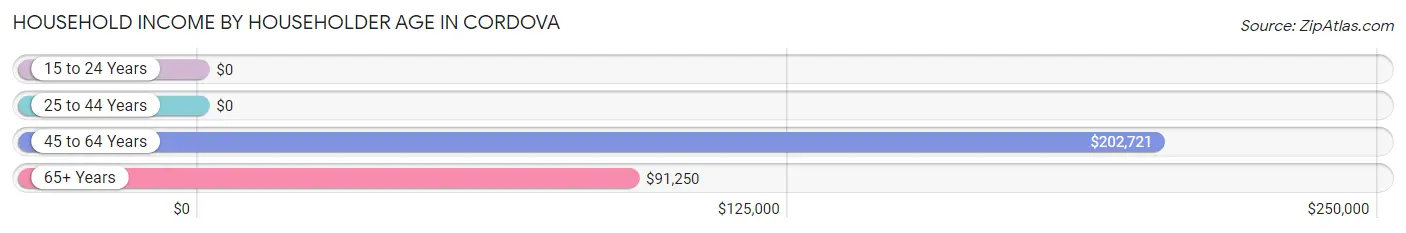
| Income Bracket | # Households | Median Income |
| 15 to 24 Years | 0 (0.0%) | $0 |
| 25 to 44 Years | 23 (14.9%) | $0 |
| 45 to 64 Years | 62 (40.3%) | $202,721 |
| 65+ Years | 69 (44.8%) | $91,250 |
| Total | 154 (100.0%) | $100,313 |
Poverty in Cordova
Income Below Poverty by Sex and Age in Cordova
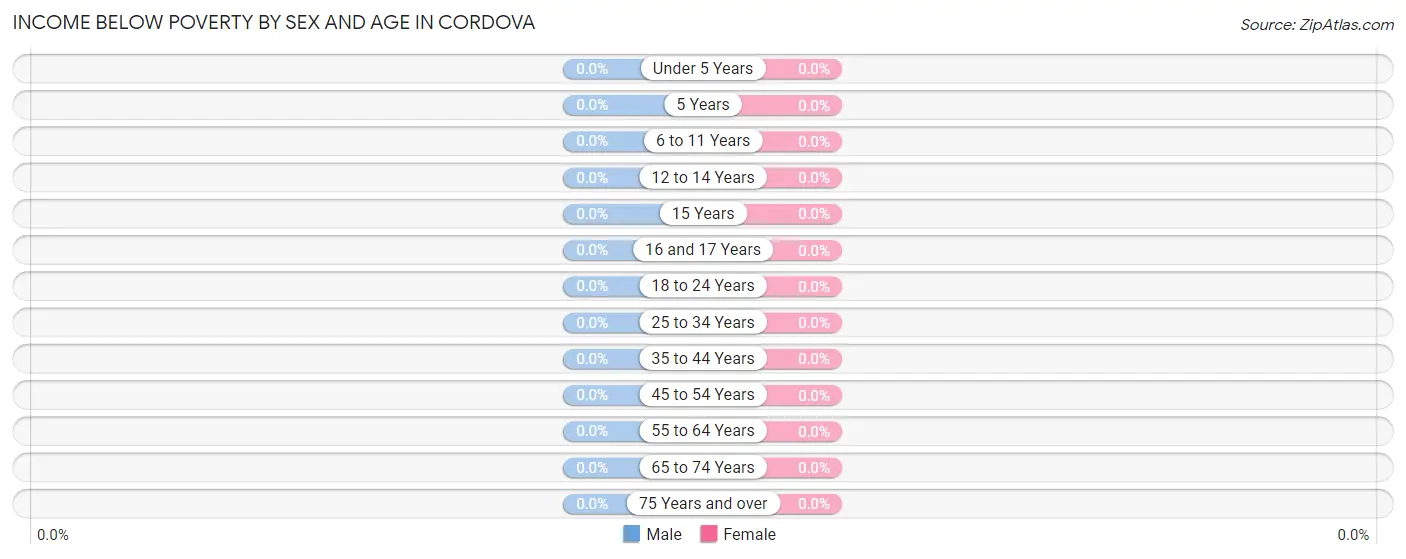
| Age Bracket | Male | Female |
| Under 5 Years | 0 (0.0%) | 0 (0.0%) |
| 5 Years | 0 (0.0%) | 0 (0.0%) |
| 6 to 11 Years | 0 (0.0%) | 0 (0.0%) |
| 12 to 14 Years | 0 (0.0%) | 0 (0.0%) |
| 15 Years | 0 (0.0%) | 0 (0.0%) |
| 16 and 17 Years | 0 (0.0%) | 0 (0.0%) |
| 18 to 24 Years | 0 (0.0%) | 0 (0.0%) |
| 25 to 34 Years | 0 (0.0%) | 0 (0.0%) |
| 35 to 44 Years | 0 (0.0%) | 0 (0.0%) |
| 45 to 54 Years | 0 (0.0%) | 0 (0.0%) |
| 55 to 64 Years | 0 (0.0%) | 0 (0.0%) |
| 65 to 74 Years | 0 (0.0%) | 0 (0.0%) |
| 75 Years and over | 0 (0.0%) | 0 (0.0%) |
| Total | 0 (0.0%) | 0 (0.0%) |
Income Above Poverty by Sex and Age in Cordova
According to the poverty statistics in Cordova, males aged under 5 years and females aged 6 to 11 years are the age groups that are most secure financially, with 100.0% of males and 100.0% of females in these age groups living above the poverty line.
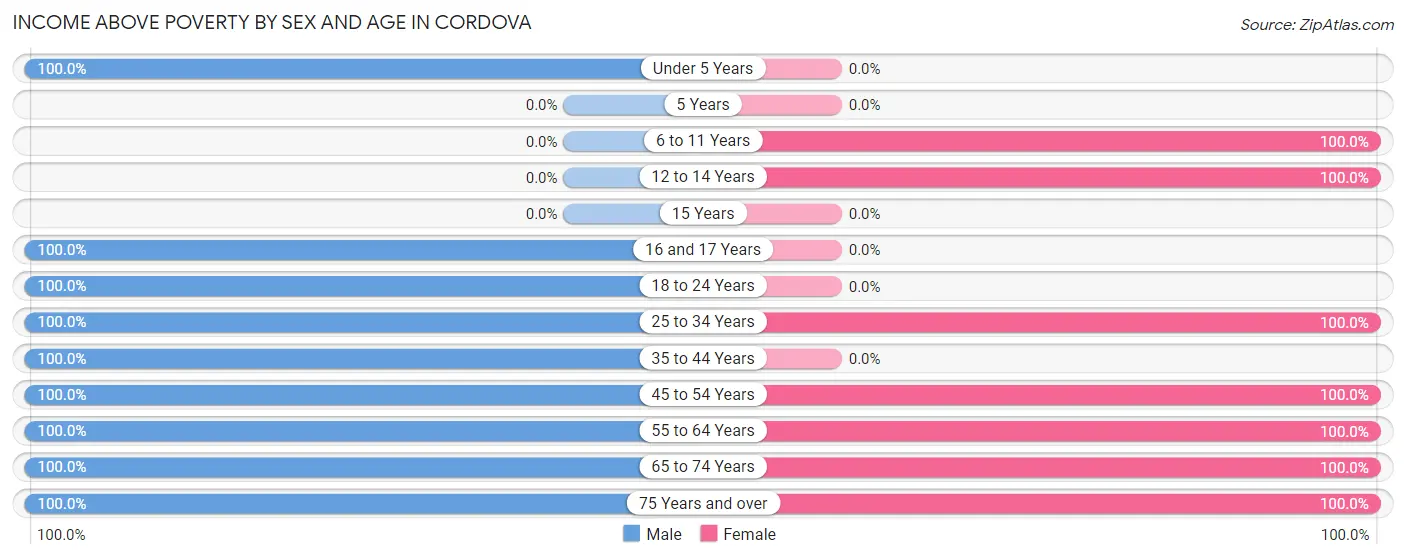
| Age Bracket | Male | Female |
| Under 5 Years | 10 (100.0%) | 0 (0.0%) |
| 5 Years | 0 (0.0%) | 0 (0.0%) |
| 6 to 11 Years | 0 (0.0%) | 19 (100.0%) |
| 12 to 14 Years | 0 (0.0%) | 18 (100.0%) |
| 15 Years | 0 (0.0%) | 0 (0.0%) |
| 16 and 17 Years | 13 (100.0%) | 0 (0.0%) |
| 18 to 24 Years | 76 (100.0%) | 0 (0.0%) |
| 25 to 34 Years | 59 (100.0%) | 40 (100.0%) |
| 35 to 44 Years | 11 (100.0%) | 0 (0.0%) |
| 45 to 54 Years | 38 (100.0%) | 11 (100.0%) |
| 55 to 64 Years | 34 (100.0%) | 41 (100.0%) |
| 65 to 74 Years | 27 (100.0%) | 36 (100.0%) |
| 75 Years and over | 37 (100.0%) | 39 (100.0%) |
| Total | 305 (100.0%) | 204 (100.0%) |
Income Below Poverty Among Married-Couple Families in Cordova
| Children | Above Poverty | Below Poverty |
| No Children | 92 (100.0%) | 0 (0.0%) |
| 1 or 2 Children | 23 (100.0%) | 0 (0.0%) |
| 3 or 4 Children | 0 (0.0%) | 0 (0.0%) |
| 5 or more Children | 0 (0.0%) | 0 (0.0%) |
| Total | 115 (100.0%) | 0 (0.0%) |
Income Below Poverty Among Single-Parent Households in Cordova
| Children | Single Father | Single Mother |
| No Children | 0 (0.0%) | 0 (0.0%) |
| 1 or 2 Children | 0 (0.0%) | 0 (0.0%) |
| 3 or 4 Children | 0 (0.0%) | 0 (0.0%) |
| 5 or more Children | 0 (0.0%) | 0 (0.0%) |
| Total | 0 (0.0%) | 0 (0.0%) |
Income Below Poverty Among Married-Couple vs Single-Parent Households in Cordova
| Children | Married-Couple Families | Single-Parent Households |
| No Children | 0 (0.0%) | 0 (0.0%) |
| 1 or 2 Children | 0 (0.0%) | 0 (0.0%) |
| 3 or 4 Children | 0 (0.0%) | 0 (0.0%) |
| 5 or more Children | 0 (0.0%) | 0 (0.0%) |
| Total | 0 (0.0%) | 0 (0.0%) |
Race in Cordova
The most populous races in Cordova are White / Caucasian (414 | 81.3%), Black / African American (58 | 11.4%), and Two or more Races (37 | 7.3%).
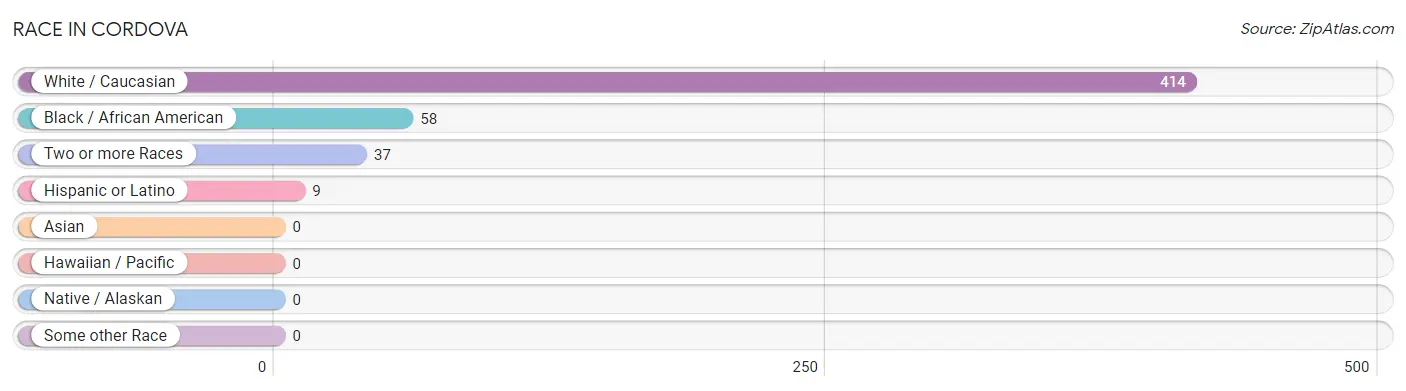
| Race | # Population | % Population |
| Asian | 0 | 0.0% |
| Black / African American | 58 | 11.4% |
| Hawaiian / Pacific | 0 | 0.0% |
| Hispanic or Latino | 9 | 1.8% |
| Native / Alaskan | 0 | 0.0% |
| White / Caucasian | 414 | 81.3% |
| Two or more Races | 37 | 7.3% |
| Some other Race | 0 | 0.0% |
| Total | 509 | 100.0% |
Ancestry in Cordova
The most populous ancestries reported in Cordova are English (143 | 28.1%), German (53 | 10.4%), Scottish (34 | 6.7%), American (14 | 2.8%), and Irish (14 | 2.8%), together accounting for 50.7% of all Cordova residents.
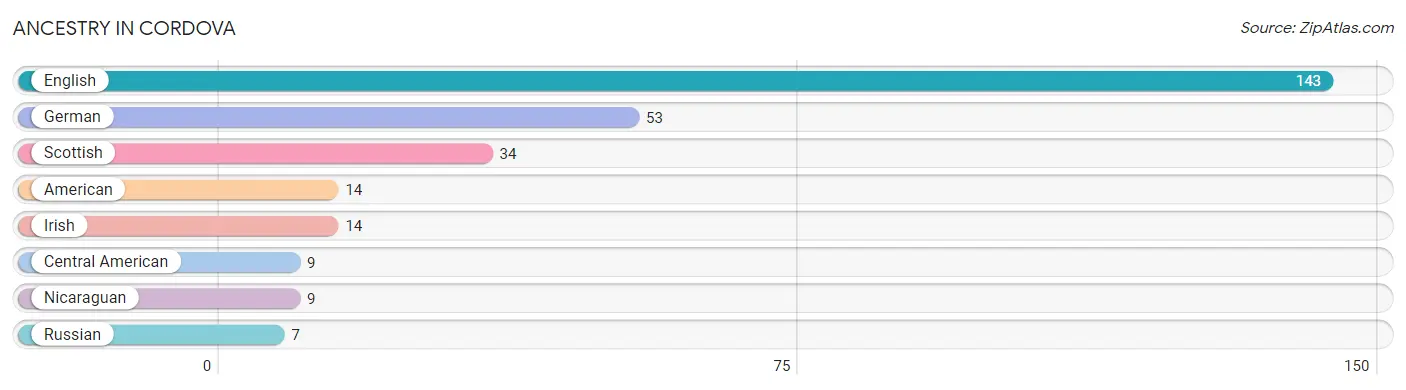
| Ancestry | # Population | % Population |
| American | 14 | 2.8% |
| Central American | 9 | 1.8% |
| English | 143 | 28.1% |
| German | 53 | 10.4% |
| Irish | 14 | 2.8% |
| Nicaraguan | 9 | 1.8% |
| Russian | 7 | 1.4% |
| Scottish | 34 | 6.7% | View All 8 Rows |
Immigrants in Cordova
The most numerous immigrant groups reported in Cordova came from Central America (9 | 1.8%), Latin America (9 | 1.8%), Nicaragua (9 | 1.8%), Eastern Europe (7 | 1.4%), and Europe (7 | 1.4%), together accounting for 8.1% of all Cordova residents.
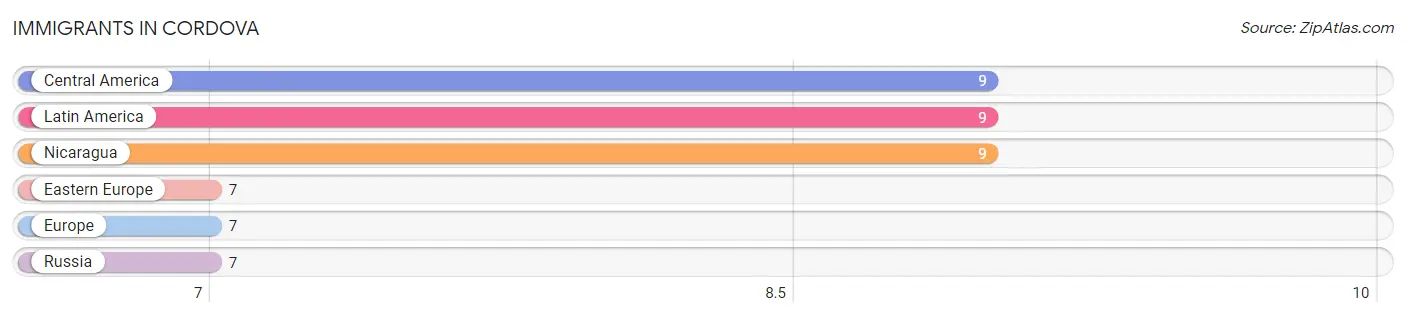
| Immigration Origin | # Population | % Population |
| Central America | 9 | 1.8% |
| Eastern Europe | 7 | 1.4% |
| Europe | 7 | 1.4% |
| Latin America | 9 | 1.8% |
| Nicaragua | 9 | 1.8% |
| Russia | 7 | 1.4% | View All 6 Rows |
Sex and Age in Cordova
Sex and Age in Cordova
The most populous age groups in Cordova are 20 to 24 Years (76 | 24.9%) for men and 55 to 59 Years (41 | 20.1%) for women.
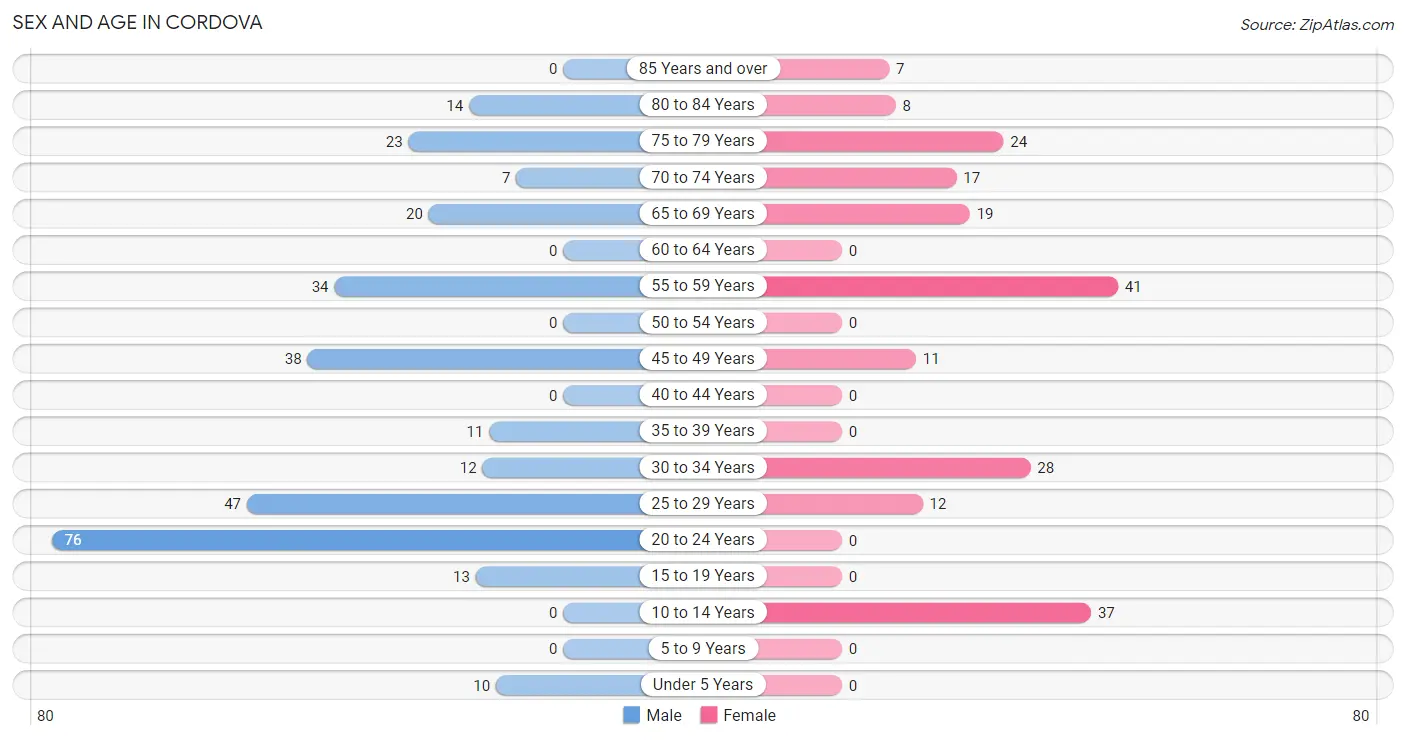
| Age Bracket | Male | Female |
| Under 5 Years | 10 (3.3%) | 0 (0.0%) |
| 5 to 9 Years | 0 (0.0%) | 0 (0.0%) |
| 10 to 14 Years | 0 (0.0%) | 37 (18.1%) |
| 15 to 19 Years | 13 (4.3%) | 0 (0.0%) |
| 20 to 24 Years | 76 (24.9%) | 0 (0.0%) |
| 25 to 29 Years | 47 (15.4%) | 12 (5.9%) |
| 30 to 34 Years | 12 (3.9%) | 28 (13.7%) |
| 35 to 39 Years | 11 (3.6%) | 0 (0.0%) |
| 40 to 44 Years | 0 (0.0%) | 0 (0.0%) |
| 45 to 49 Years | 38 (12.5%) | 11 (5.4%) |
| 50 to 54 Years | 0 (0.0%) | 0 (0.0%) |
| 55 to 59 Years | 34 (11.2%) | 41 (20.1%) |
| 60 to 64 Years | 0 (0.0%) | 0 (0.0%) |
| 65 to 69 Years | 20 (6.6%) | 19 (9.3%) |
| 70 to 74 Years | 7 (2.3%) | 17 (8.3%) |
| 75 to 79 Years | 23 (7.5%) | 24 (11.8%) |
| 80 to 84 Years | 14 (4.6%) | 8 (3.9%) |
| 85 Years and over | 0 (0.0%) | 7 (3.4%) |
| Total | 305 (100.0%) | 204 (100.0%) |
Families and Households in Cordova
Median Family Size in Cordova
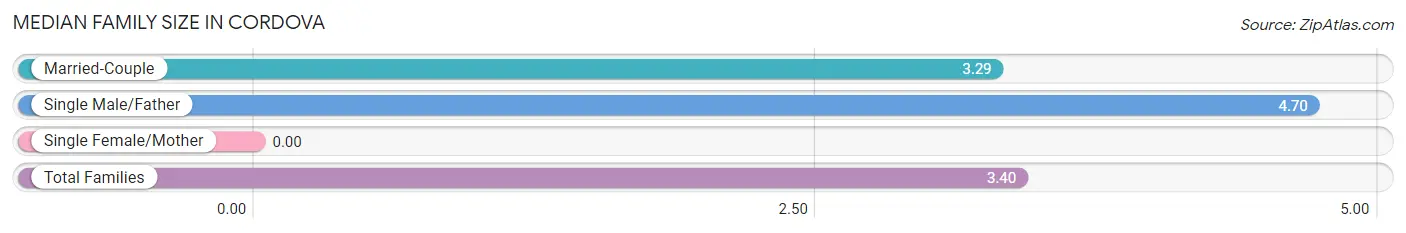
| Family Type | # Families | Family Size |
| Married-Couple | 115 (92.0%) | 3.29 |
| Single Male/Father | 10 (8.0%) | 4.70 |
| Single Female/Mother | 0 (0.0%) | - |
| Total Families | 125 (100.0%) | 3.40 |
Median Household Size in Cordova
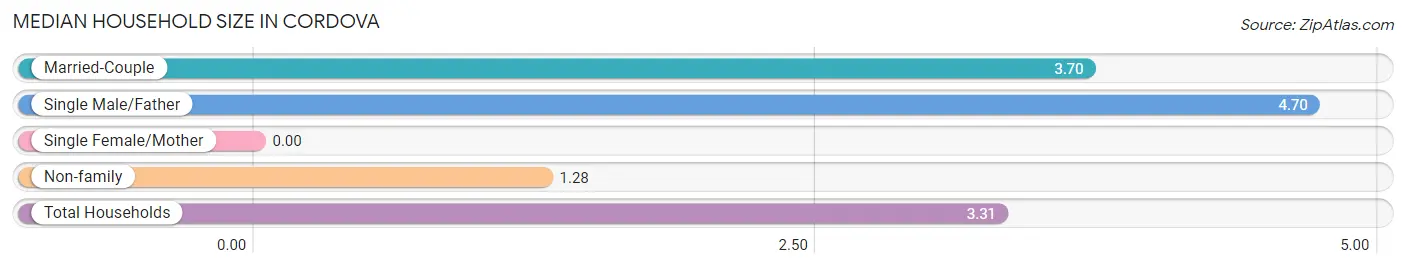
| Household Type | # Households | Household Size |
| Married-Couple | 115 (74.7%) | 3.70 |
| Single Male/Father | 10 (6.5%) | 4.70 |
| Single Female/Mother | 0 (0.0%) | - |
| Non-family | 29 (18.8%) | 1.28 |
| Total Households | 154 (100.0%) | 3.31 |
Household Size by Marriage Status in Cordova
Out of a total of 154 households in Cordova, 125 (81.2%) are family households, while 29 (18.8%) are nonfamily households. The most numerous type of family households are 3-person households, comprising 60, and the most common type of nonfamily households are 1-person households, comprising 21.
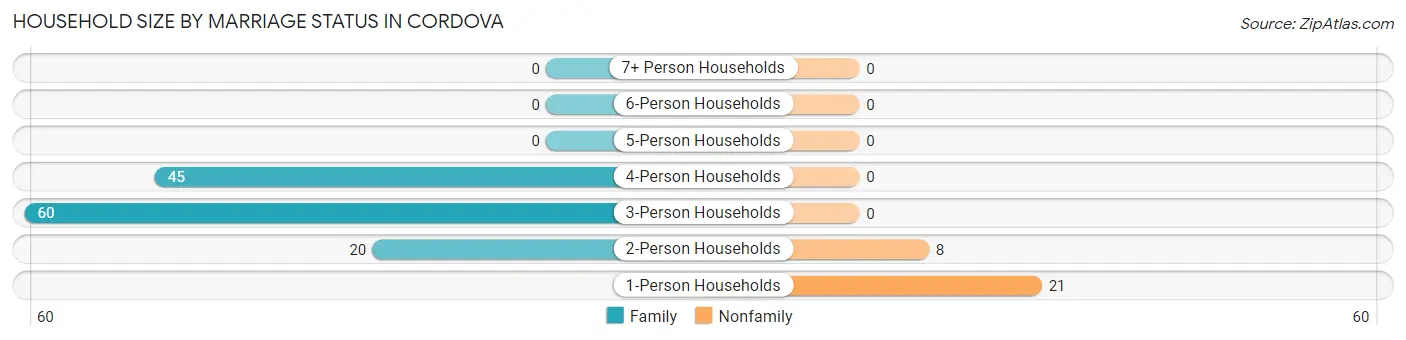
| Household Size | Family Households | Nonfamily Households |
| 1-Person Households | - | 21 (13.6%) |
| 2-Person Households | 20 (13.0%) | 8 (5.2%) |
| 3-Person Households | 60 (39.0%) | 0 (0.0%) |
| 4-Person Households | 45 (29.2%) | 0 (0.0%) |
| 5-Person Households | 0 (0.0%) | 0 (0.0%) |
| 6-Person Households | 0 (0.0%) | 0 (0.0%) |
| 7+ Person Households | 0 (0.0%) | 0 (0.0%) |
| Total | 125 (81.2%) | 29 (18.8%) |
Female Fertility in Cordova
Fertility by Age in Cordova
| Age Bracket | Women with Births | Births / 1,000 Women |
| 15 to 19 years | 0 (0.0%) | 0.0 |
| 20 to 34 years | 0 (0.0%) | 0.0 |
| 35 to 50 years | 0 (0.0%) | 0.0 |
| Total | 0 (0.0%) | 0.0 |
Fertility by Age by Marriage Status in Cordova
| Age Bracket | Married | Unmarried |
| 15 to 19 years | 0 (0.0%) | 0 (0.0%) |
| 20 to 34 years | 0 (0.0%) | 0 (0.0%) |
| 35 to 50 years | 0 (0.0%) | 0 (0.0%) |
| Total | 0 (0.0%) | 0 (0.0%) |
Fertility by Education in Cordova
| Educational Attainment | Women with Births | Births / 1,000 Women |
| Less than High School | 0 (0.0%) | 0.0 |
| High School Diploma | 0 (0.0%) | 0.0 |
| College or Associate's Degree | 0 (0.0%) | 0.0 |
| Bachelor's Degree | 0 (0.0%) | 0.0 |
| Graduate Degree | 0 (0.0%) | 0.0 |
| Total | 0 (0.0%) | 0.0 |
Fertility by Education by Marriage Status in Cordova
| Educational Attainment | Married | Unmarried |
| Less than High School | 0 (0.0%) | 0 (0.0%) |
| High School Diploma | 0 (0.0%) | 0 (0.0%) |
| College or Associate's Degree | 0 (0.0%) | 0 (0.0%) |
| Bachelor's Degree | 0 (0.0%) | 0 (0.0%) |
| Graduate Degree | 0 (0.0%) | 0 (0.0%) |
| Total | 0 (0.0%) | 0 (0.0%) |
Employment Characteristics in Cordova
Employment by Class of Employer in Cordova
Among the 191 employed individuals in Cordova, private company employees (97 | 50.8%), self-employed (not incorporated) (55 | 28.8%), and local government employees (18 | 9.4%) make up the most common classes of employment.
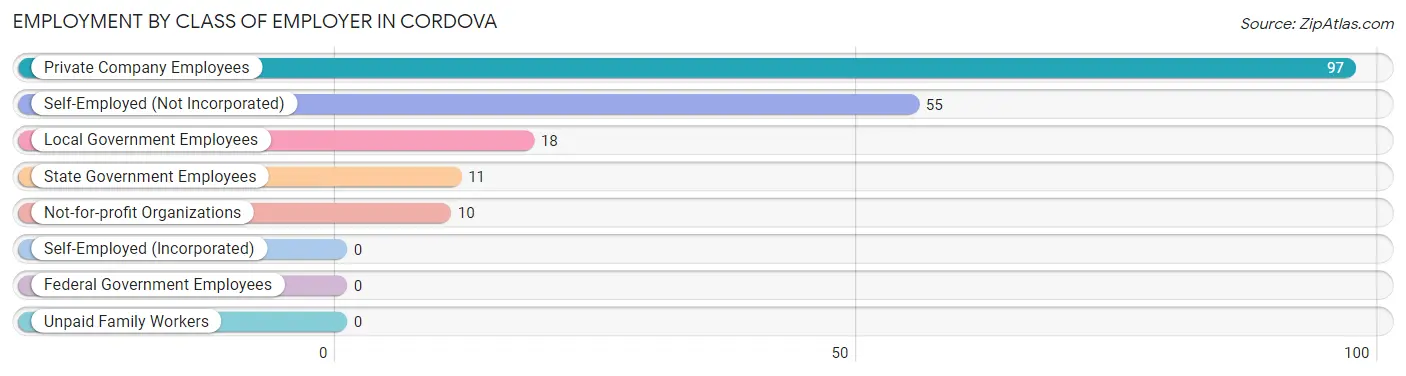
| Employer Class | # Employees | % Employees |
| Private Company Employees | 97 | 50.8% |
| Self-Employed (Incorporated) | 0 | 0.0% |
| Self-Employed (Not Incorporated) | 55 | 28.8% |
| Not-for-profit Organizations | 10 | 5.2% |
| Local Government Employees | 18 | 9.4% |
| State Government Employees | 11 | 5.8% |
| Federal Government Employees | 0 | 0.0% |
| Unpaid Family Workers | 0 | 0.0% |
| Total | 191 | 100.0% |
Employment Status by Age in Cordova
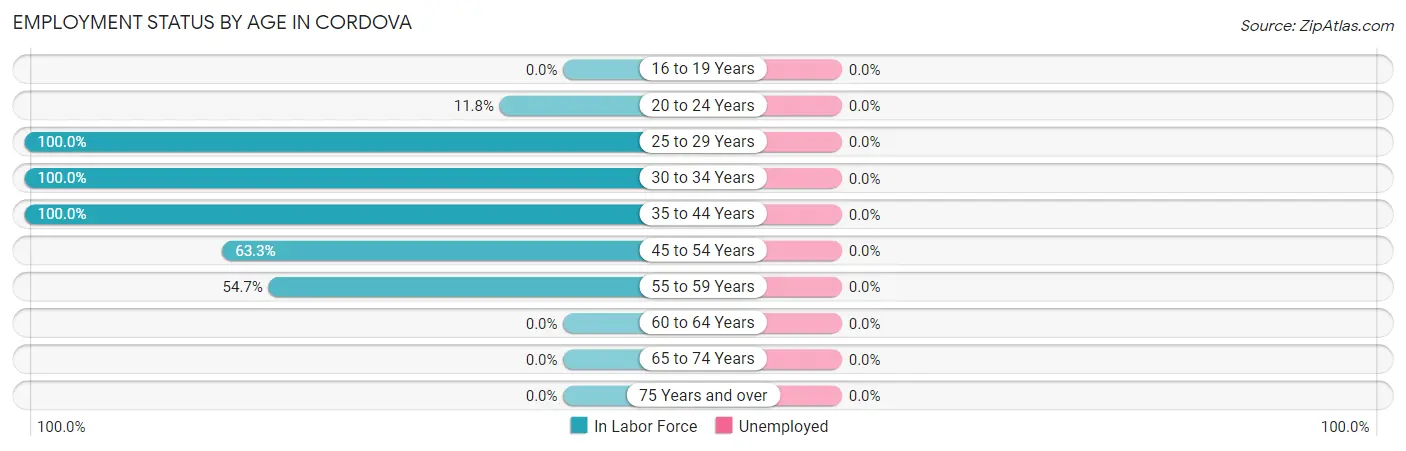
| Age Bracket | In Labor Force | Unemployed |
| 16 to 19 Years | 0 (0.0%) | 0 (0.0%) |
| 20 to 24 Years | 9 (11.8%) | 0 (0.0%) |
| 25 to 29 Years | 59 (100.0%) | 0 (0.0%) |
| 30 to 34 Years | 40 (100.0%) | 0 (0.0%) |
| 35 to 44 Years | 11 (100.0%) | 0 (0.0%) |
| 45 to 54 Years | 31 (63.3%) | 0 (0.0%) |
| 55 to 59 Years | 41 (54.7%) | 0 (0.0%) |
| 60 to 64 Years | 0 (0.0%) | 0 (0.0%) |
| 65 to 74 Years | 0 (0.0%) | 0 (0.0%) |
| 75 Years and over | 0 (0.0%) | 0 (0.0%) |
| Total | 191 (41.3%) | 0 (0.0%) |
Employment Status by Educational Attainment in Cordova
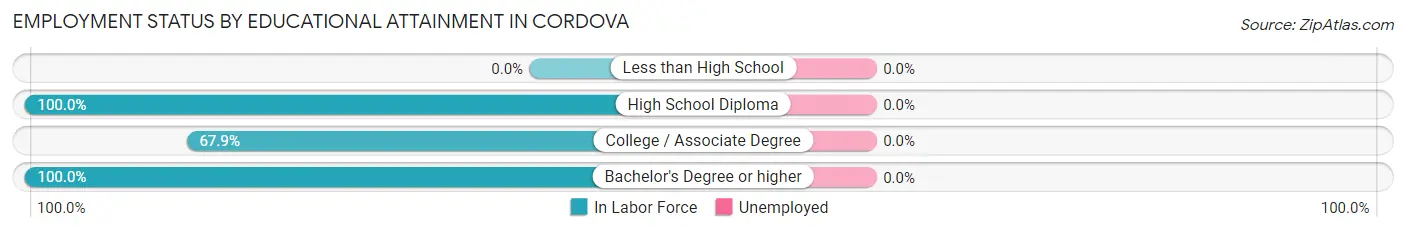
| Educational Attainment | In Labor Force | Unemployed |
| Less than High School | 0 (0.0%) | 0 (0.0%) |
| High School Diploma | 56 (100.0%) | 0 (0.0%) |
| College / Associate Degree | 72 (67.9%) | 0 (0.0%) |
| Bachelor's Degree or higher | 54 (100.0%) | 0 (0.0%) |
| Total | 182 (77.8%) | 0 (0.0%) |
Employment Occupations by Sex in Cordova
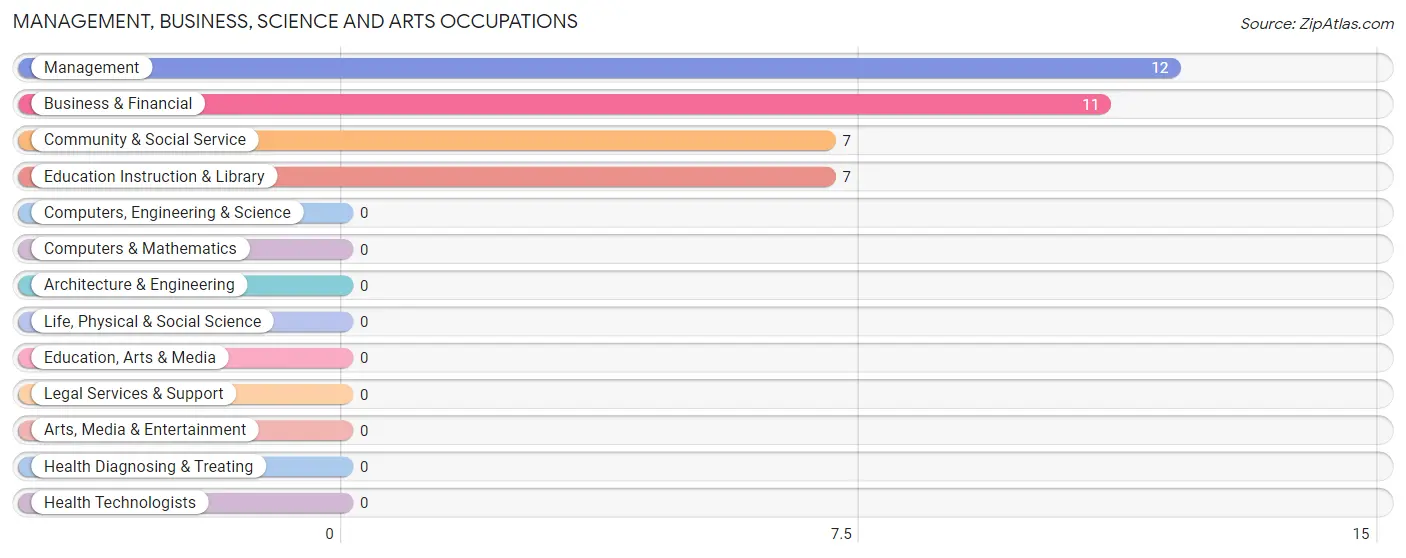
Management, Business, Science and Arts Occupations
The most common Management, Business, Science and Arts occupations in Cordova are Management (12 | 6.3%), Business & Financial (11 | 5.8%), Community & Social Service (7 | 3.7%), and Education Instruction & Library (7 | 3.7%).
Management, Business, Science and Arts Occupations by Sex
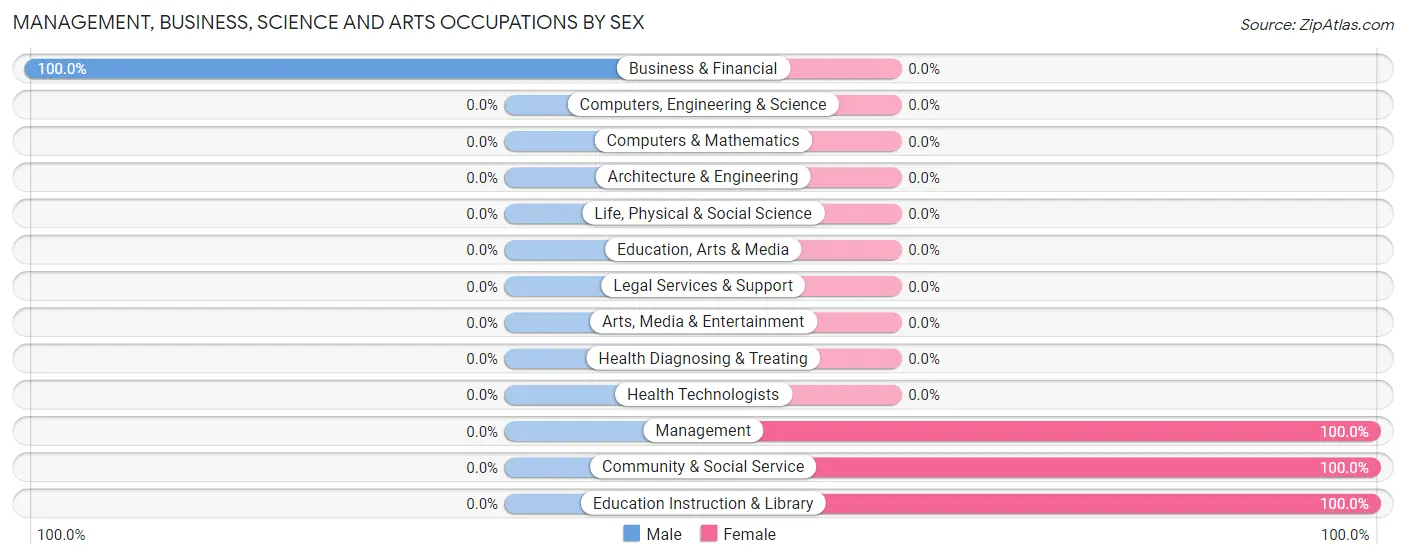
| Occupation | Male | Female |
| Management | 0 (0.0%) | 12 (100.0%) |
| Business & Financial | 11 (100.0%) | 0 (0.0%) |
| Computers, Engineering & Science | 0 (0.0%) | 0 (0.0%) |
| Computers & Mathematics | 0 (0.0%) | 0 (0.0%) |
| Architecture & Engineering | 0 (0.0%) | 0 (0.0%) |
| Life, Physical & Social Science | 0 (0.0%) | 0 (0.0%) |
| Community & Social Service | 0 (0.0%) | 7 (100.0%) |
| Education, Arts & Media | 0 (0.0%) | 0 (0.0%) |
| Legal Services & Support | 0 (0.0%) | 0 (0.0%) |
| Education Instruction & Library | 0 (0.0%) | 7 (100.0%) |
| Arts, Media & Entertainment | 0 (0.0%) | 0 (0.0%) |
| Health Diagnosing & Treating | 0 (0.0%) | 0 (0.0%) |
| Health Technologists | 0 (0.0%) | 0 (0.0%) |
| Total (Category) | 11 (36.7%) | 19 (63.3%) |
| Total (Overall) | 133 (69.6%) | 58 (30.4%) |
Services Occupations
Services Occupations by Sex
| Occupation | Male | Female |
| Healthcare Support | 0 (0.0%) | 0 (0.0%) |
| Security & Protection | 0 (0.0%) | 0 (0.0%) |
| Firefighting & Prevention | 0 (0.0%) | 0 (0.0%) |
| Law Enforcement | 0 (0.0%) | 0 (0.0%) |
| Food Preparation & Serving | 0 (0.0%) | 0 (0.0%) |
| Cleaning & Maintenance | 0 (0.0%) | 0 (0.0%) |
| Personal Care & Service | 0 (0.0%) | 0 (0.0%) |
| Total (Category) | 0 (0.0%) | 0 (0.0%) |
| Total (Overall) | 133 (69.6%) | 58 (30.4%) |
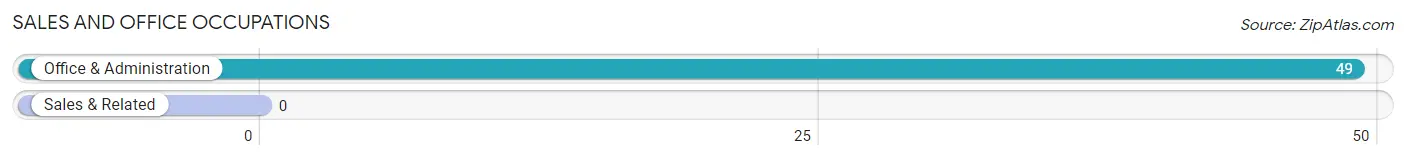
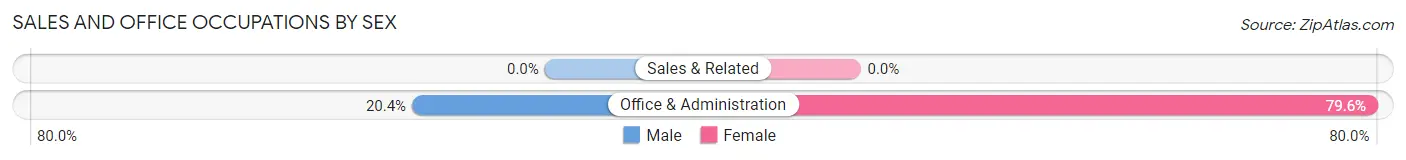
Sales and Office Occupations
The most common Sales and Office occupations in Cordova are , and Office & Administration (49 | 25.7%).
Sales and Office Occupations by Sex
| Occupation | Male | Female |
| Sales & Related | 0 (0.0%) | 0 (0.0%) |
| Office & Administration | 10 (20.4%) | 39 (79.6%) |
| Total (Category) | 10 (20.4%) | 39 (79.6%) |
| Total (Overall) | 133 (69.6%) | 58 (30.4%) |
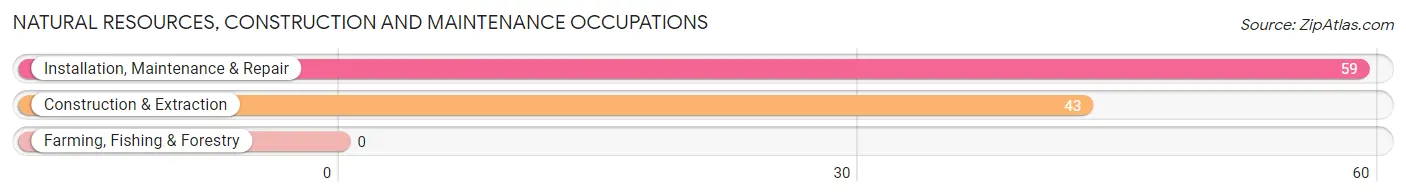
Natural Resources, Construction and Maintenance Occupations
The most common Natural Resources, Construction and Maintenance occupations in Cordova are Installation, Maintenance & Repair (59 | 30.9%), and Construction & Extraction (43 | 22.5%).
Natural Resources, Construction and Maintenance Occupations by Sex
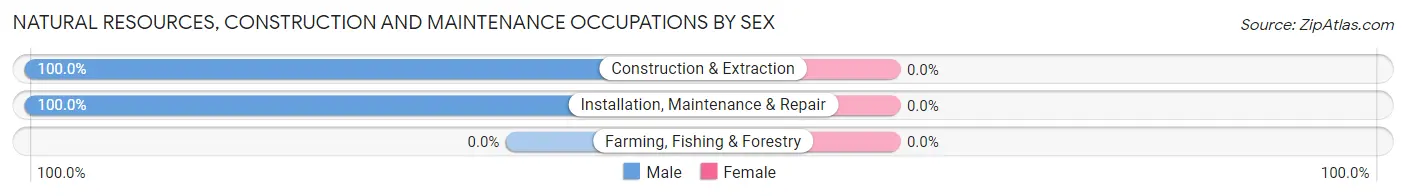
| Occupation | Male | Female |
| Farming, Fishing & Forestry | 0 (0.0%) | 0 (0.0%) |
| Construction & Extraction | 43 (100.0%) | 0 (0.0%) |
| Installation, Maintenance & Repair | 59 (100.0%) | 0 (0.0%) |
| Total (Category) | 102 (100.0%) | 0 (0.0%) |
| Total (Overall) | 133 (69.6%) | 58 (30.4%) |
Production, Transportation and Moving Occupations
The most common Production, Transportation and Moving occupations in Cordova are , and Transportation (10 | 5.2%).
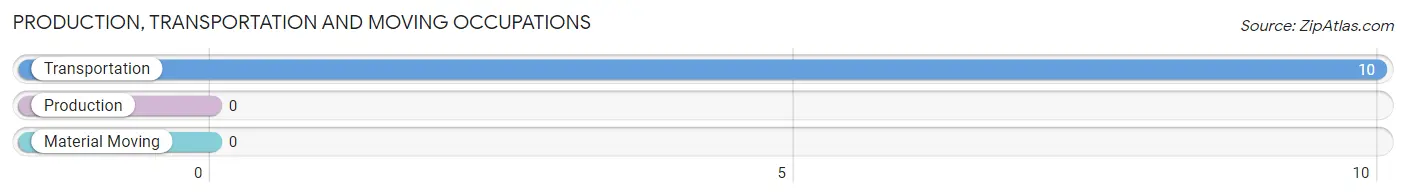
Production, Transportation and Moving Occupations by Sex
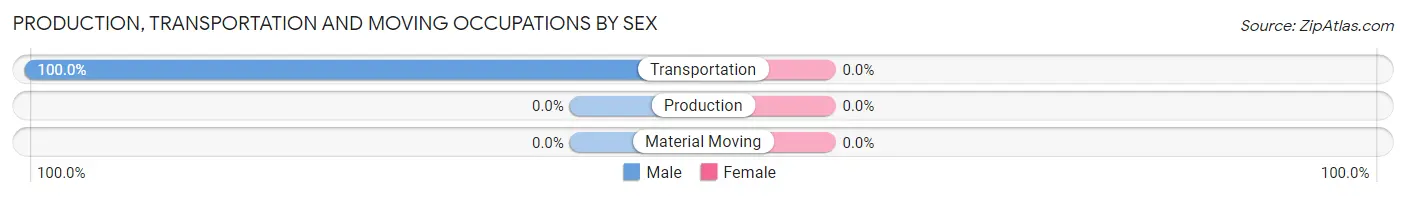
| Occupation | Male | Female |
| Production | 0 (0.0%) | 0 (0.0%) |
| Transportation | 10 (100.0%) | 0 (0.0%) |
| Material Moving | 0 (0.0%) | 0 (0.0%) |
| Total (Category) | 10 (100.0%) | 0 (0.0%) |
| Total (Overall) | 133 (69.6%) | 58 (30.4%) |
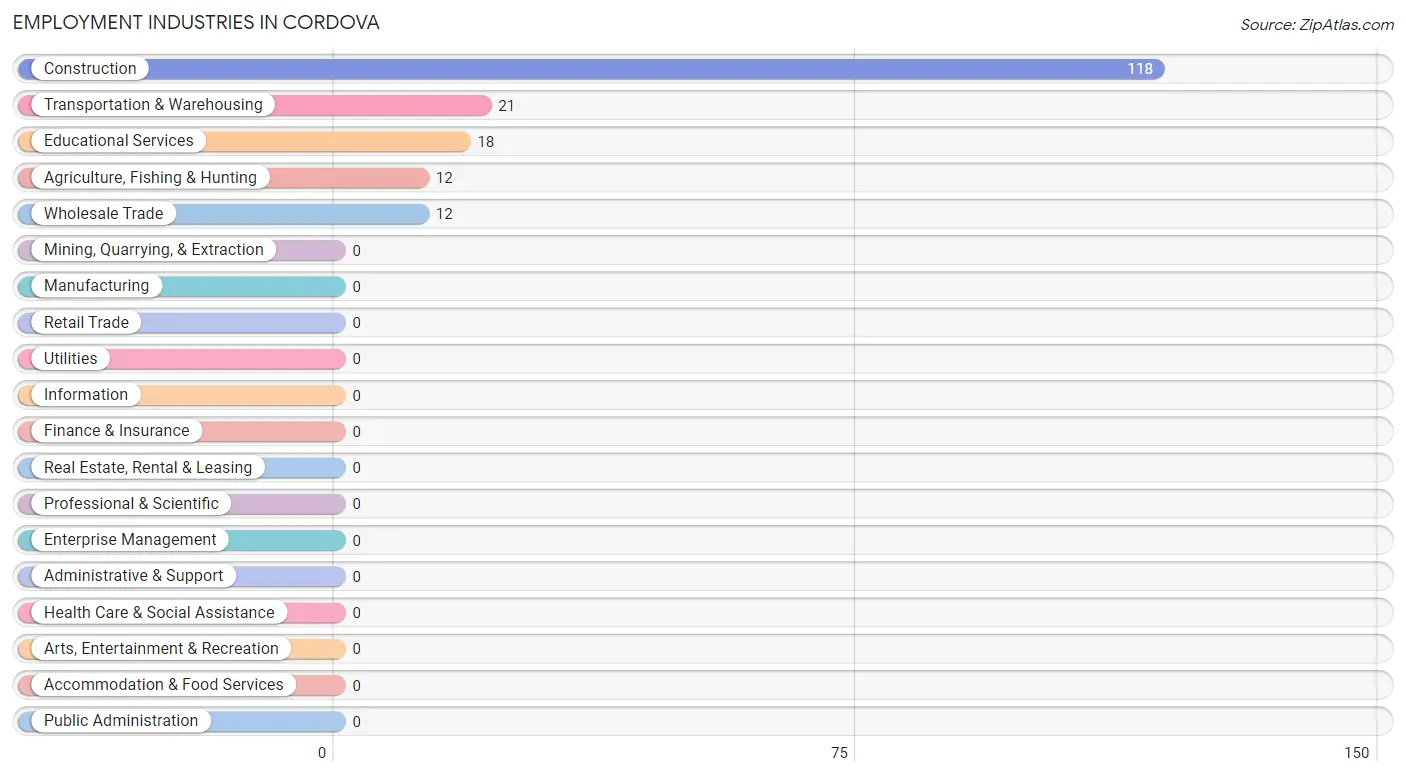
Employment Industries by Sex in Cordova
Employment Industries in Cordova
The major employment industries in Cordova include Construction (118 | 61.8%), Transportation & Warehousing (21 | 11.0%), Educational Services (18 | 9.4%), Agriculture, Fishing & Hunting (12 | 6.3%), and Wholesale Trade (12 | 6.3%).
Employment Industries by Sex in Cordova
The Cordova industries that see more men than women are Wholesale Trade (100.0%), Transportation & Warehousing (100.0%), and Construction (76.3%), whereas the industries that tend to have a higher number of women are Agriculture, Fishing & Hunting (100.0%), Educational Services (100.0%), and Construction (23.7%).
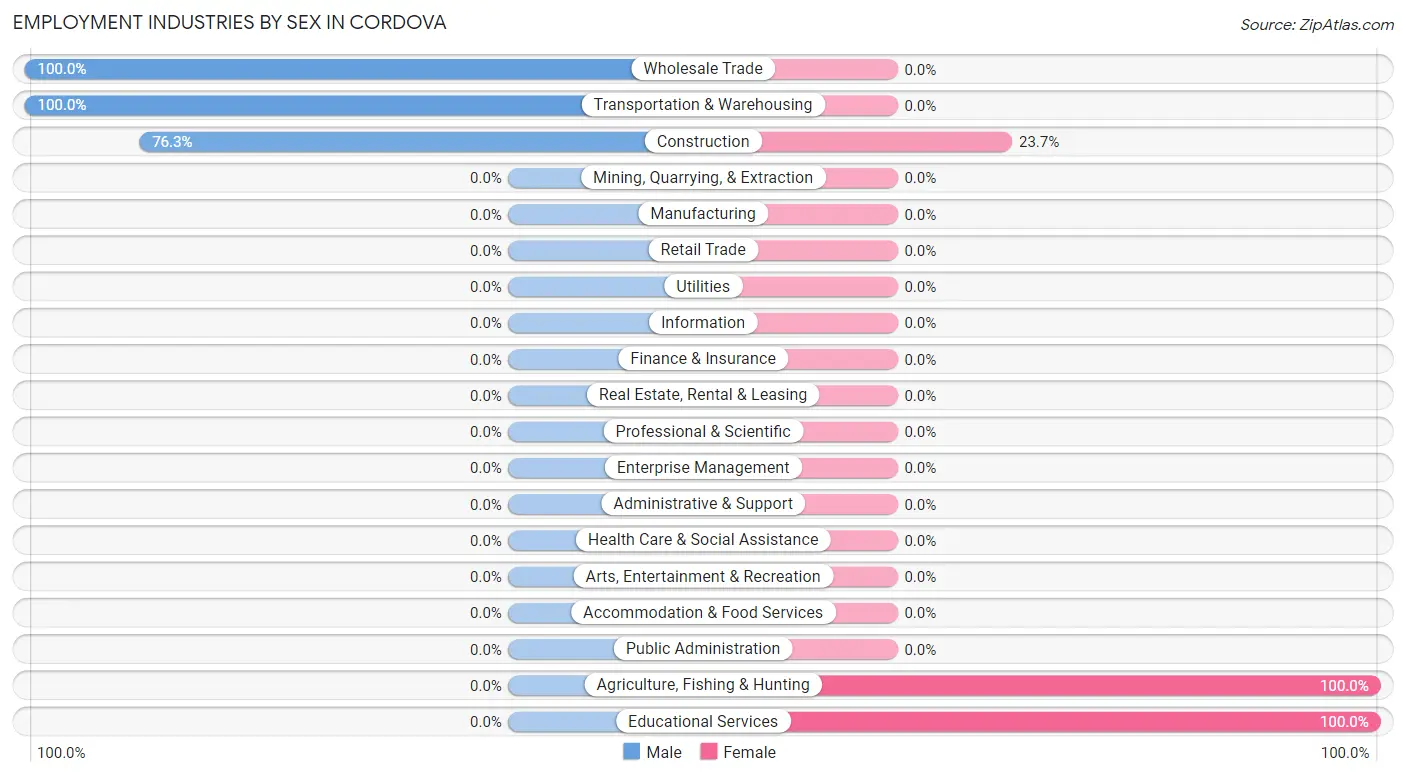
| Industry | Male | Female |
| Agriculture, Fishing & Hunting | 0 (0.0%) | 12 (100.0%) |
| Mining, Quarrying, & Extraction | 0 (0.0%) | 0 (0.0%) |
| Construction | 90 (76.3%) | 28 (23.7%) |
| Manufacturing | 0 (0.0%) | 0 (0.0%) |
| Wholesale Trade | 12 (100.0%) | 0 (0.0%) |
| Retail Trade | 0 (0.0%) | 0 (0.0%) |
| Transportation & Warehousing | 21 (100.0%) | 0 (0.0%) |
| Utilities | 0 (0.0%) | 0 (0.0%) |
| Information | 0 (0.0%) | 0 (0.0%) |
| Finance & Insurance | 0 (0.0%) | 0 (0.0%) |
| Real Estate, Rental & Leasing | 0 (0.0%) | 0 (0.0%) |
| Professional & Scientific | 0 (0.0%) | 0 (0.0%) |
| Enterprise Management | 0 (0.0%) | 0 (0.0%) |
| Administrative & Support | 0 (0.0%) | 0 (0.0%) |
| Educational Services | 0 (0.0%) | 18 (100.0%) |
| Health Care & Social Assistance | 0 (0.0%) | 0 (0.0%) |
| Arts, Entertainment & Recreation | 0 (0.0%) | 0 (0.0%) |
| Accommodation & Food Services | 0 (0.0%) | 0 (0.0%) |
| Public Administration | 0 (0.0%) | 0 (0.0%) |
| Total | 133 (69.6%) | 58 (30.4%) |
Education in Cordova
School Enrollment in Cordova
The most common levels of schooling among the 50 students in Cordova are middle school (37 | 74.0%), and high school (13 | 26.0%).
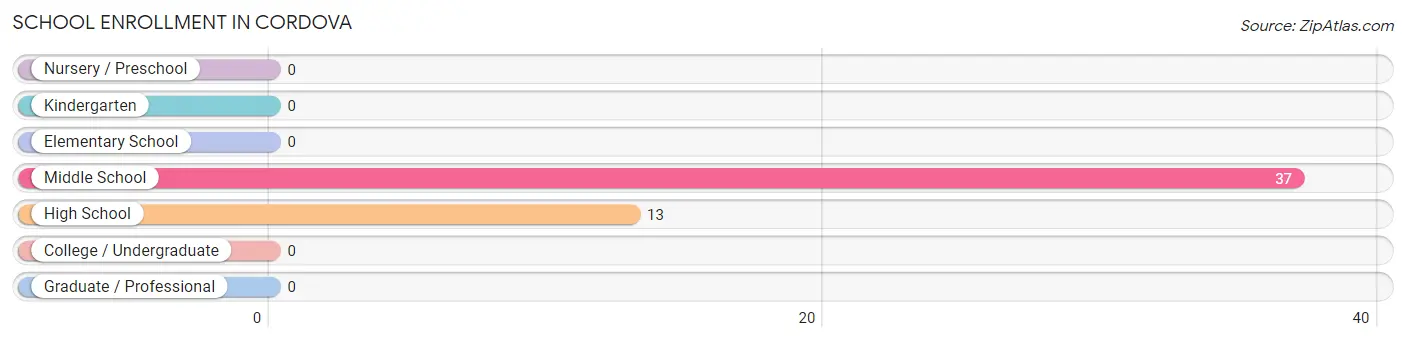
| School Level | # Students | % Students |
| Nursery / Preschool | 0 | 0.0% |
| Kindergarten | 0 | 0.0% |
| Elementary School | 0 | 0.0% |
| Middle School | 37 | 74.0% |
| High School | 13 | 26.0% |
| College / Undergraduate | 0 | 0.0% |
| Graduate / Professional | 0 | 0.0% |
| Total | 50 | 100.0% |
School Enrollment by Age by Funding Source in Cordova
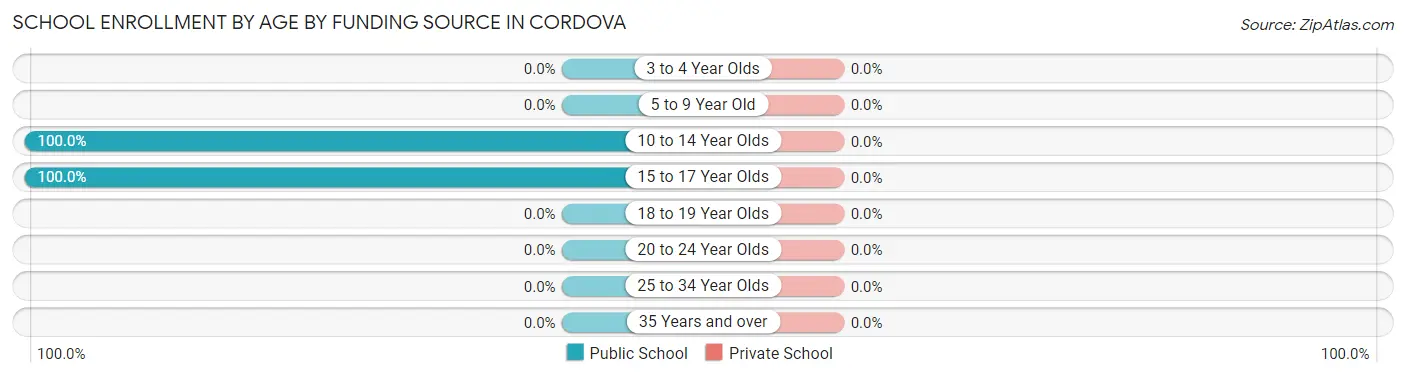
| Age Bracket | Public School | Private School |
| 3 to 4 Year Olds | 0 (0.0%) | 0 (0.0%) |
| 5 to 9 Year Old | 0 (0.0%) | 0 (0.0%) |
| 10 to 14 Year Olds | 37 (100.0%) | 0 (0.0%) |
| 15 to 17 Year Olds | 13 (100.0%) | 0 (0.0%) |
| 18 to 19 Year Olds | 0 (0.0%) | 0 (0.0%) |
| 20 to 24 Year Olds | 0 (0.0%) | 0 (0.0%) |
| 25 to 34 Year Olds | 0 (0.0%) | 0 (0.0%) |
| 35 Years and over | 0 (0.0%) | 0 (0.0%) |
| Total | 50 (100.0%) | 0 (0.0%) |
Educational Attainment by Field of Study in Cordova
Engineering (54 | 71.1%), education (15 | 19.7%), and business (7 | 9.2%) are the most common fields of study among 76 individuals in Cordova who have obtained a bachelor's degree or higher.
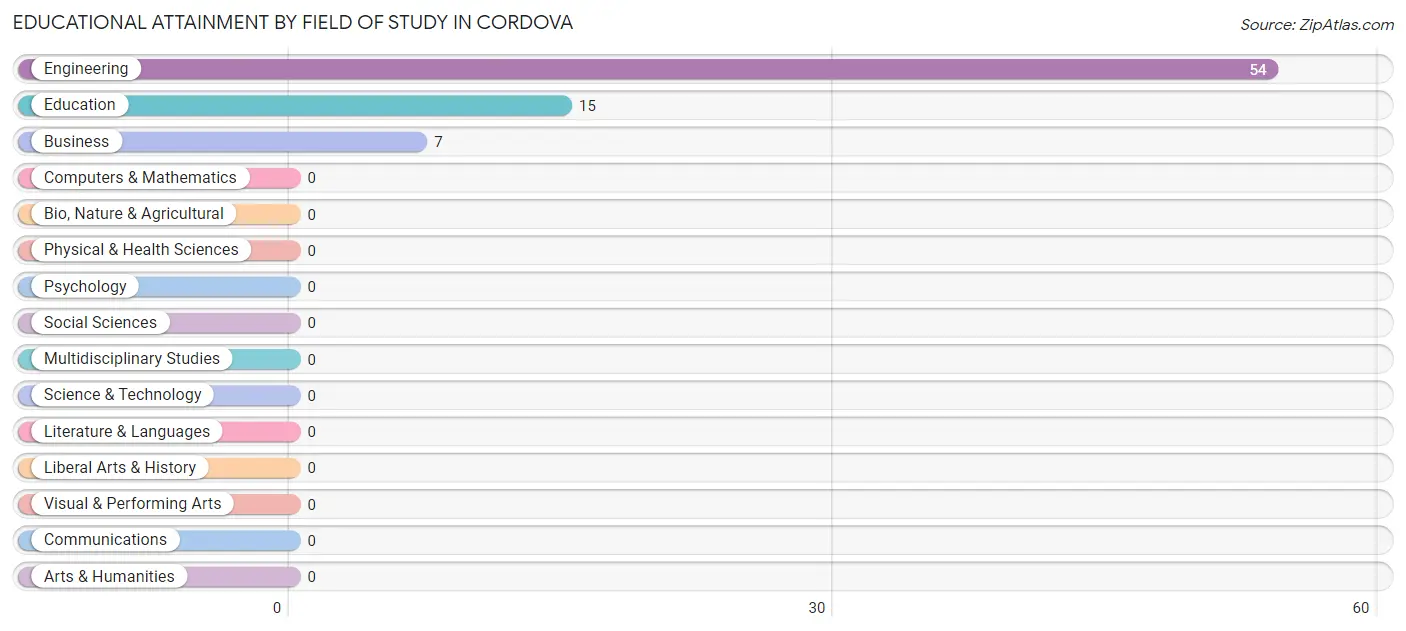
| Field of Study | # Graduates | % Graduates |
| Computers & Mathematics | 0 | 0.0% |
| Bio, Nature & Agricultural | 0 | 0.0% |
| Physical & Health Sciences | 0 | 0.0% |
| Psychology | 0 | 0.0% |
| Social Sciences | 0 | 0.0% |
| Engineering | 54 | 71.1% |
| Multidisciplinary Studies | 0 | 0.0% |
| Science & Technology | 0 | 0.0% |
| Business | 7 | 9.2% |
| Education | 15 | 19.7% |
| Literature & Languages | 0 | 0.0% |
| Liberal Arts & History | 0 | 0.0% |
| Visual & Performing Arts | 0 | 0.0% |
| Communications | 0 | 0.0% |
| Arts & Humanities | 0 | 0.0% |
| Total | 76 | 100.0% |
Transportation & Commute in Cordova
Vehicle Availability by Sex in Cordova
The most prevalent vehicle ownership categories in Cordova are males with 2 vehicles (92, accounting for 69.2%) and females with 2 vehicles (28, making up 158.6%).
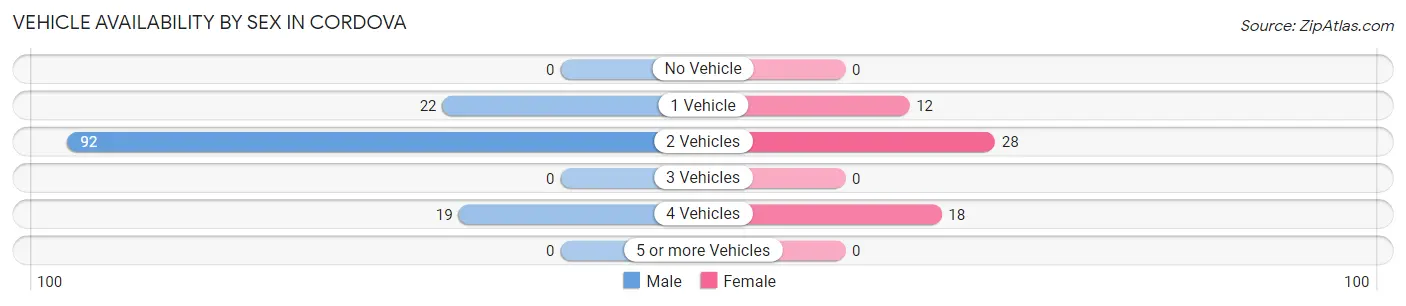
| Vehicles Available | Male | Female |
| No Vehicle | 0 (0.0%) | 0 (0.0%) |
| 1 Vehicle | 22 (16.5%) | 12 (20.7%) |
| 2 Vehicles | 92 (69.2%) | 28 (48.3%) |
| 3 Vehicles | 0 (0.0%) | 0 (0.0%) |
| 4 Vehicles | 19 (14.3%) | 18 (31.0%) |
| 5 or more Vehicles | 0 (0.0%) | 0 (0.0%) |
| Total | 133 (100.0%) | 58 (100.0%) |
Commute Time in Cordova
The most frequently occuring commute durations in Cordova are 90 or more minutes (57 commuters, 31.8%), 30 to 34 minutes (34 commuters, 19.0%), and 10 to 14 minutes (28 commuters, 15.6%).
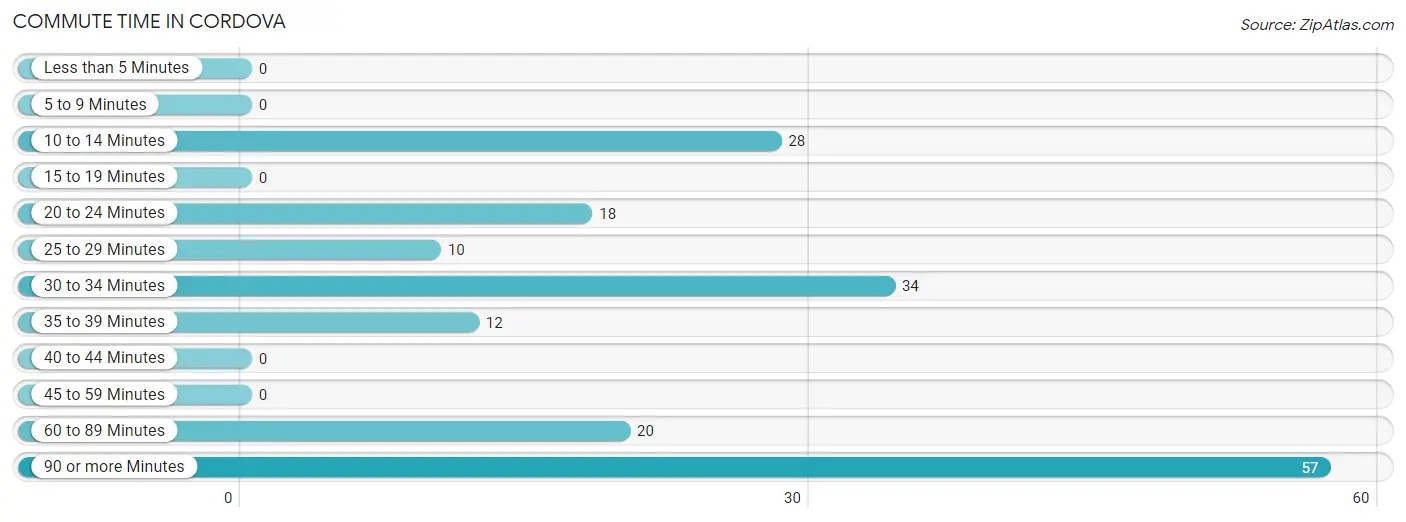
| Commute Time | # Commuters | % Commuters |
| Less than 5 Minutes | 0 | 0.0% |
| 5 to 9 Minutes | 0 | 0.0% |
| 10 to 14 Minutes | 28 | 15.6% |
| 15 to 19 Minutes | 0 | 0.0% |
| 20 to 24 Minutes | 18 | 10.1% |
| 25 to 29 Minutes | 10 | 5.6% |
| 30 to 34 Minutes | 34 | 19.0% |
| 35 to 39 Minutes | 12 | 6.7% |
| 40 to 44 Minutes | 0 | 0.0% |
| 45 to 59 Minutes | 0 | 0.0% |
| 60 to 89 Minutes | 20 | 11.2% |
| 90 or more Minutes | 57 | 31.8% |
Commute Time by Sex in Cordova
The most common commute times in Cordova are 90 or more minutes (57 commuters, 42.9%) for males and 10 to 14 minutes (28 commuters, 60.9%) for females.
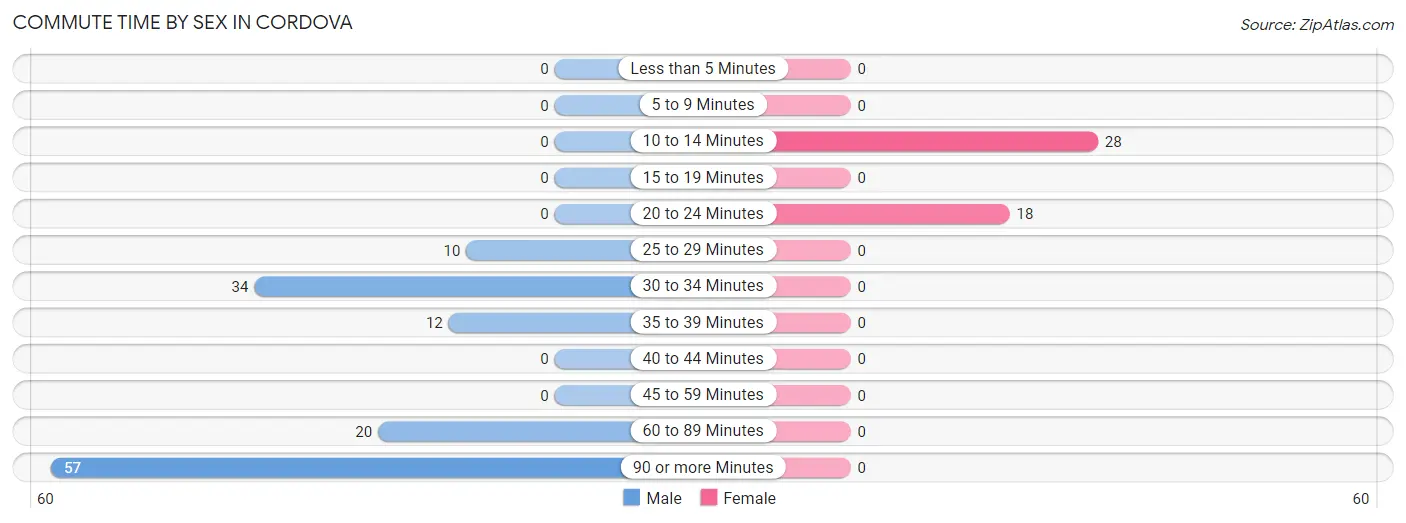
| Commute Time | Male | Female |
| Less than 5 Minutes | 0 (0.0%) | 0 (0.0%) |
| 5 to 9 Minutes | 0 (0.0%) | 0 (0.0%) |
| 10 to 14 Minutes | 0 (0.0%) | 28 (60.9%) |
| 15 to 19 Minutes | 0 (0.0%) | 0 (0.0%) |
| 20 to 24 Minutes | 0 (0.0%) | 18 (39.1%) |
| 25 to 29 Minutes | 10 (7.5%) | 0 (0.0%) |
| 30 to 34 Minutes | 34 (25.6%) | 0 (0.0%) |
| 35 to 39 Minutes | 12 (9.0%) | 0 (0.0%) |
| 40 to 44 Minutes | 0 (0.0%) | 0 (0.0%) |
| 45 to 59 Minutes | 0 (0.0%) | 0 (0.0%) |
| 60 to 89 Minutes | 20 (15.0%) | 0 (0.0%) |
| 90 or more Minutes | 57 (42.9%) | 0 (0.0%) |
Time of Departure to Work by Sex in Cordova
The most frequent times of departure to work in Cordova are 6:30 AM to 6:59 AM (101, 75.9%) for males and 8:00 AM to 8:29 AM (28, 60.9%) for females.
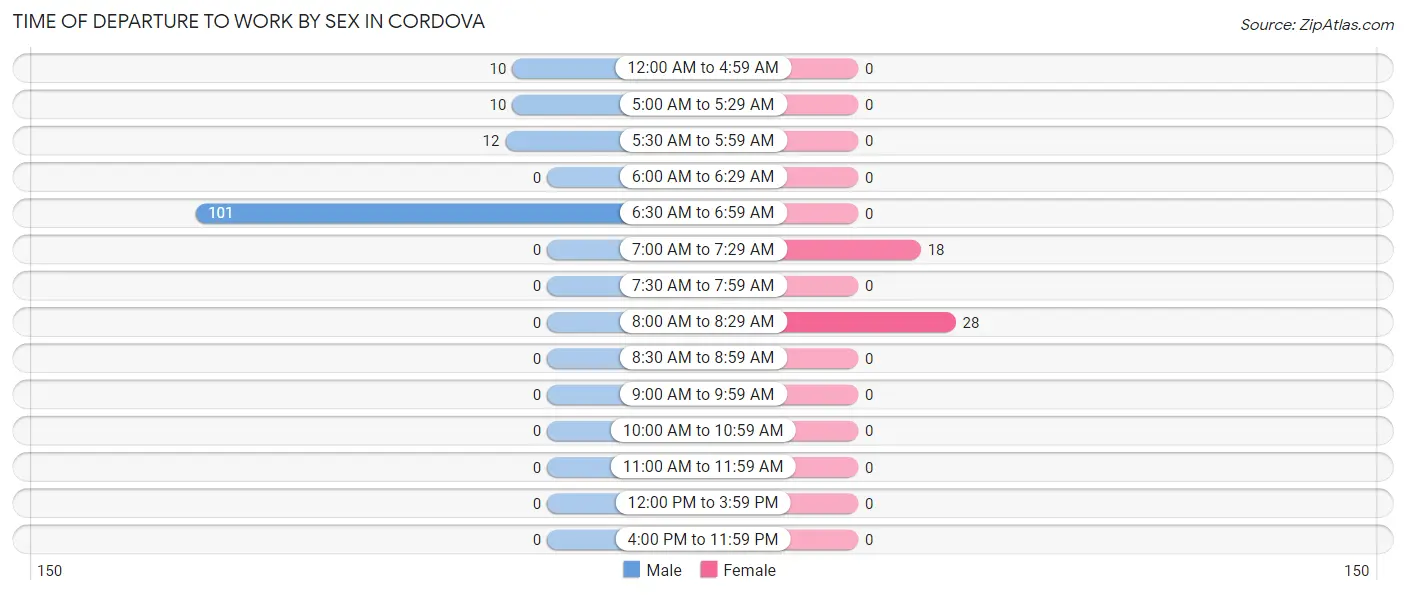
| Time of Departure | Male | Female |
| 12:00 AM to 4:59 AM | 10 (7.5%) | 0 (0.0%) |
| 5:00 AM to 5:29 AM | 10 (7.5%) | 0 (0.0%) |
| 5:30 AM to 5:59 AM | 12 (9.0%) | 0 (0.0%) |
| 6:00 AM to 6:29 AM | 0 (0.0%) | 0 (0.0%) |
| 6:30 AM to 6:59 AM | 101 (75.9%) | 0 (0.0%) |
| 7:00 AM to 7:29 AM | 0 (0.0%) | 18 (39.1%) |
| 7:30 AM to 7:59 AM | 0 (0.0%) | 0 (0.0%) |
| 8:00 AM to 8:29 AM | 0 (0.0%) | 28 (60.9%) |
| 8:30 AM to 8:59 AM | 0 (0.0%) | 0 (0.0%) |
| 9:00 AM to 9:59 AM | 0 (0.0%) | 0 (0.0%) |
| 10:00 AM to 10:59 AM | 0 (0.0%) | 0 (0.0%) |
| 11:00 AM to 11:59 AM | 0 (0.0%) | 0 (0.0%) |
| 12:00 PM to 3:59 PM | 0 (0.0%) | 0 (0.0%) |
| 4:00 PM to 11:59 PM | 0 (0.0%) | 0 (0.0%) |
| Total | 133 (100.0%) | 46 (100.0%) |
Housing Occupancy in Cordova
Occupancy by Ownership in Cordova
Of the total 154 dwellings in Cordova, owner-occupied units account for 144 (93.5%), while renter-occupied units make up 10 (6.5%).
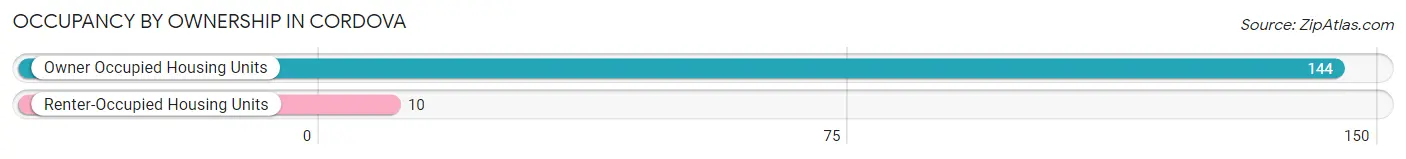
| Occupancy | # Housing Units | % Housing Units |
| Owner Occupied Housing Units | 144 | 93.5% |
| Renter-Occupied Housing Units | 10 | 6.5% |
| Total Occupied Housing Units | 154 | 100.0% |
Occupancy by Household Size in Cordova
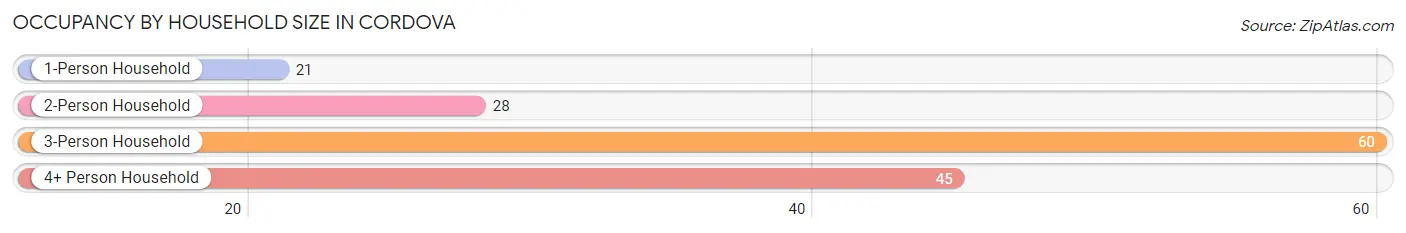
| Household Size | # Housing Units | % Housing Units |
| 1-Person Household | 21 | 13.6% |
| 2-Person Household | 28 | 18.2% |
| 3-Person Household | 60 | 39.0% |
| 4+ Person Household | 45 | 29.2% |
| Total Housing Units | 154 | 100.0% |
Occupancy by Ownership by Household Size in Cordova
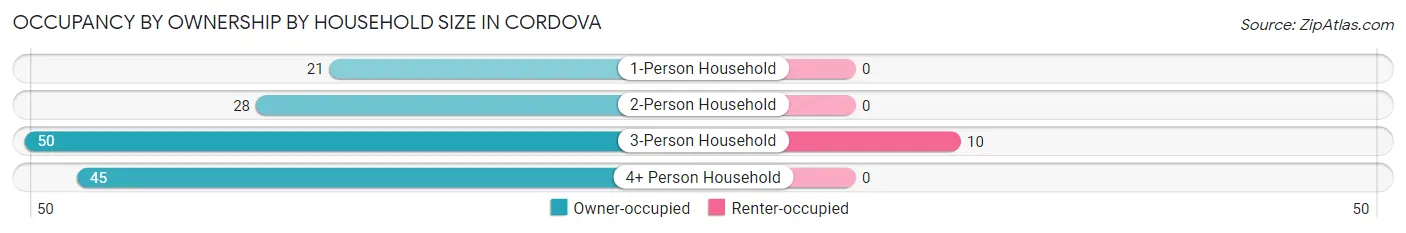
| Household Size | Owner-occupied | Renter-occupied |
| 1-Person Household | 21 (100.0%) | 0 (0.0%) |
| 2-Person Household | 28 (100.0%) | 0 (0.0%) |
| 3-Person Household | 50 (83.3%) | 10 (16.7%) |
| 4+ Person Household | 45 (100.0%) | 0 (0.0%) |
| Total Housing Units | 144 (93.5%) | 10 (6.5%) |
Occupancy by Educational Attainment in Cordova
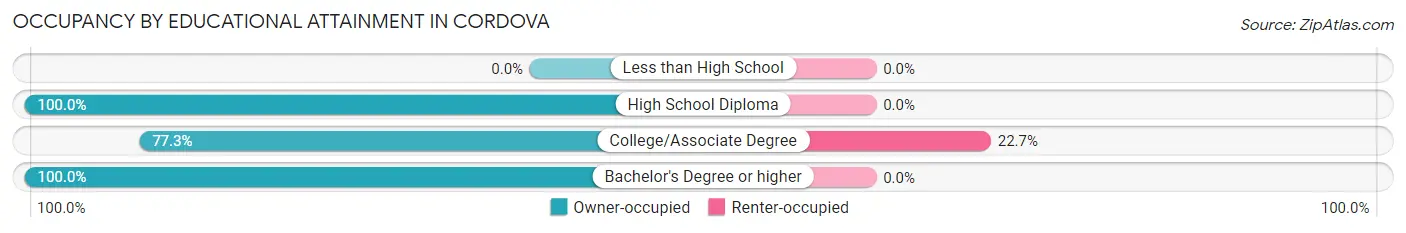
| Household Size | Owner-occupied | Renter-occupied |
| Less than High School | 0 (0.0%) | 0 (0.0%) |
| High School Diploma | 96 (100.0%) | 0 (0.0%) |
| College/Associate Degree | 34 (77.3%) | 10 (22.7%) |
| Bachelor's Degree or higher | 14 (100.0%) | 0 (0.0%) |
Occupancy by Age of Householder in Cordova
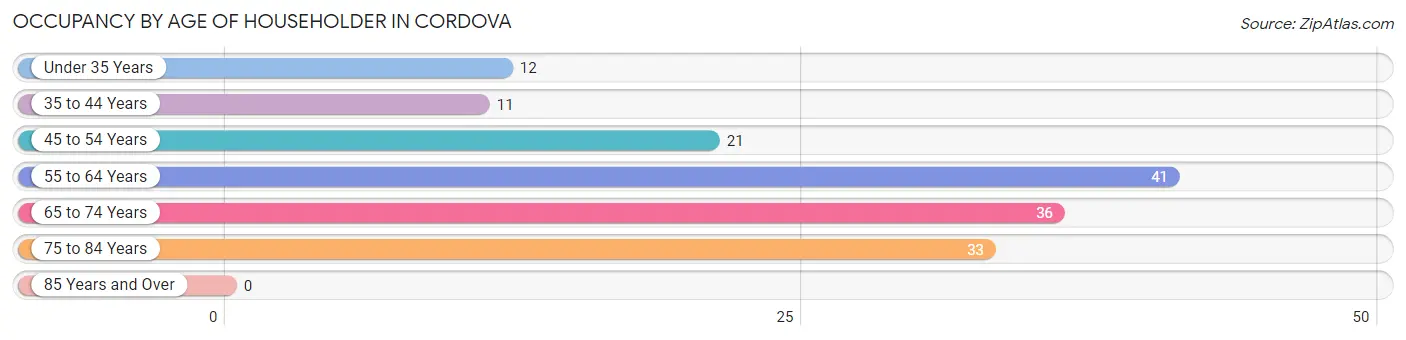
| Age Bracket | # Households | % Households |
| Under 35 Years | 12 | 7.8% |
| 35 to 44 Years | 11 | 7.1% |
| 45 to 54 Years | 21 | 13.6% |
| 55 to 64 Years | 41 | 26.6% |
| 65 to 74 Years | 36 | 23.4% |
| 75 to 84 Years | 33 | 21.4% |
| 85 Years and Over | 0 | 0.0% |
| Total | 154 | 100.0% |
Housing Finances in Cordova
Median Income by Occupancy in Cordova
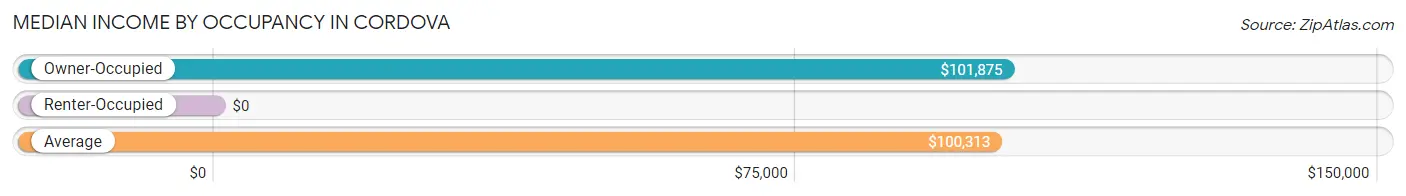
| Occupancy Type | # Households | Median Income |
| Owner-Occupied | 144 (93.5%) | $101,875 |
| Renter-Occupied | 10 (6.5%) | $0 |
| Average | 154 (100.0%) | $100,313 |
Occupancy by Householder Income Bracket in Cordova
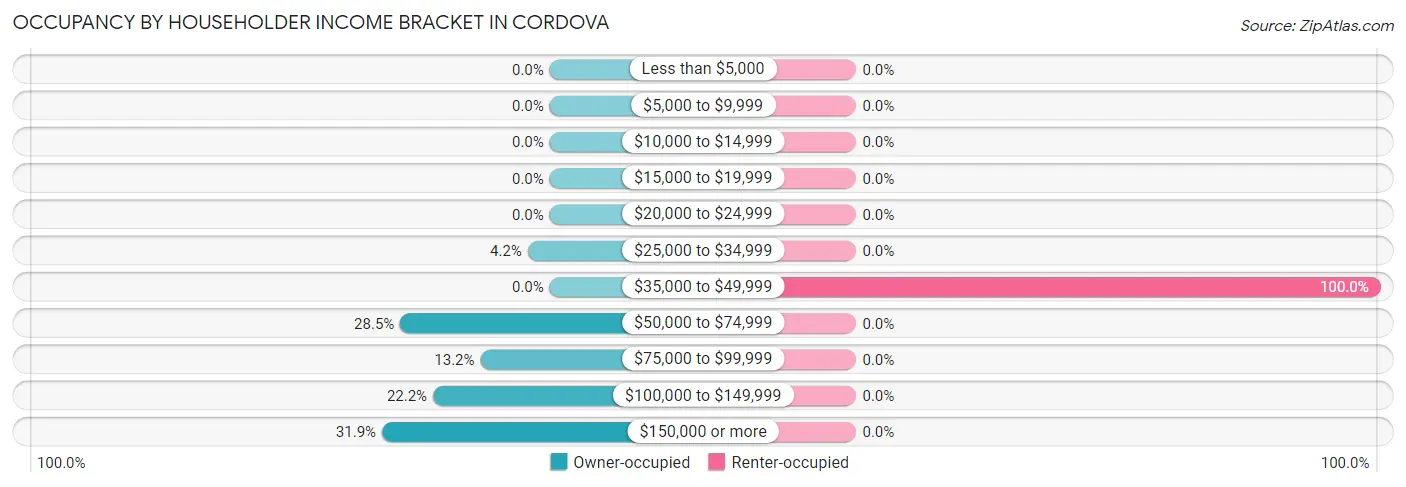
| Income Bracket | Owner-occupied | Renter-occupied |
| Less than $5,000 | 0 (0.0%) | 0 (0.0%) |
| $5,000 to $9,999 | 0 (0.0%) | 0 (0.0%) |
| $10,000 to $14,999 | 0 (0.0%) | 0 (0.0%) |
| $15,000 to $19,999 | 0 (0.0%) | 0 (0.0%) |
| $20,000 to $24,999 | 0 (0.0%) | 0 (0.0%) |
| $25,000 to $34,999 | 6 (4.2%) | 0 (0.0%) |
| $35,000 to $49,999 | 0 (0.0%) | 10 (100.0%) |
| $50,000 to $74,999 | 41 (28.5%) | 0 (0.0%) |
| $75,000 to $99,999 | 19 (13.2%) | 0 (0.0%) |
| $100,000 to $149,999 | 32 (22.2%) | 0 (0.0%) |
| $150,000 or more | 46 (31.9%) | 0 (0.0%) |
| Total | 144 (100.0%) | 10 (100.0%) |
Monthly Housing Cost Tiers in Cordova
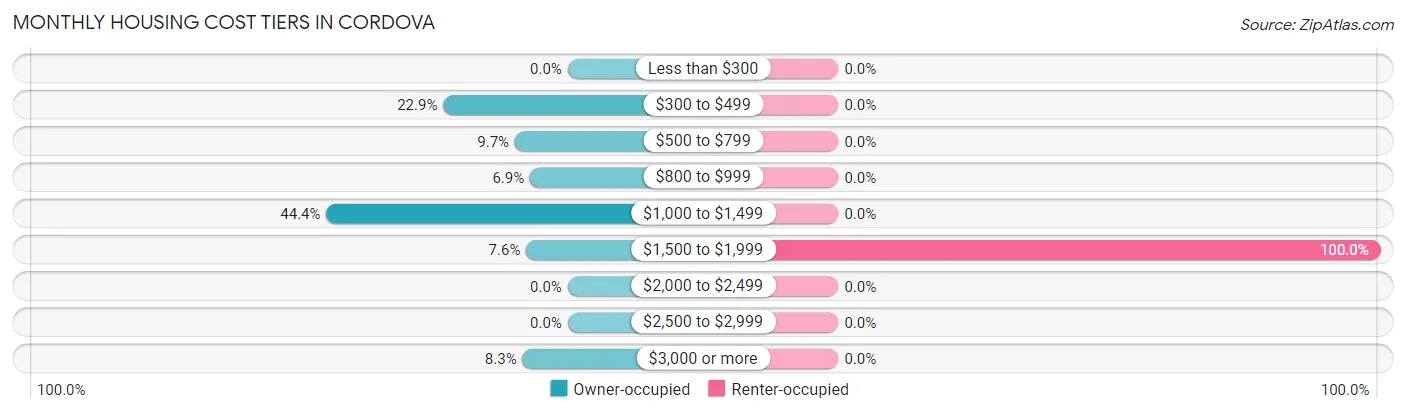
| Monthly Cost | Owner-occupied | Renter-occupied |
| Less than $300 | 0 (0.0%) | 0 (0.0%) |
| $300 to $499 | 33 (22.9%) | 0 (0.0%) |
| $500 to $799 | 14 (9.7%) | 0 (0.0%) |
| $800 to $999 | 10 (6.9%) | 0 (0.0%) |
| $1,000 to $1,499 | 64 (44.4%) | 0 (0.0%) |
| $1,500 to $1,999 | 11 (7.6%) | 10 (100.0%) |
| $2,000 to $2,499 | 0 (0.0%) | 0 (0.0%) |
| $2,500 to $2,999 | 0 (0.0%) | 0 (0.0%) |
| $3,000 or more | 12 (8.3%) | 0 (0.0%) |
| Total | 144 (100.0%) | 10 (100.0%) |
Physical Housing Characteristics in Cordova
Housing Structures in Cordova
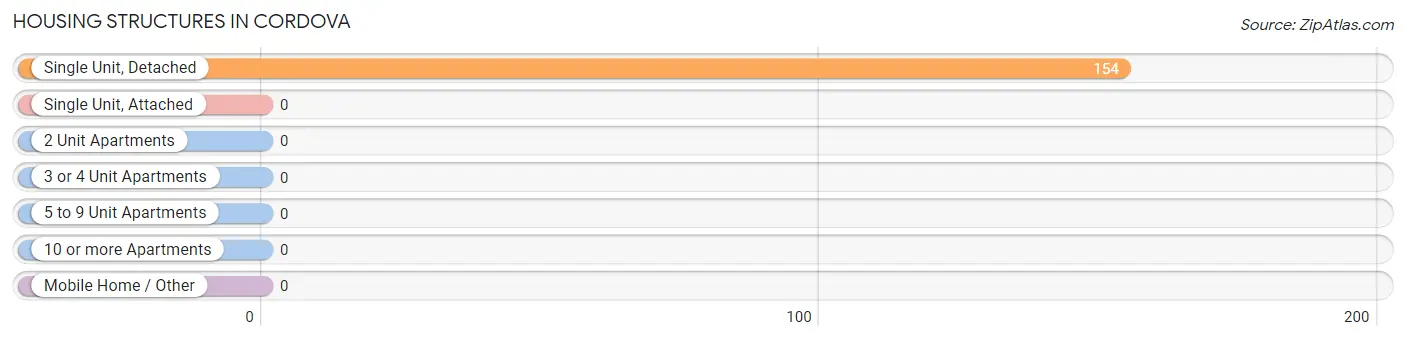
| Structure Type | # Housing Units | % Housing Units |
| Single Unit, Detached | 154 | 100.0% |
| Single Unit, Attached | 0 | 0.0% |
| 2 Unit Apartments | 0 | 0.0% |
| 3 or 4 Unit Apartments | 0 | 0.0% |
| 5 to 9 Unit Apartments | 0 | 0.0% |
| 10 or more Apartments | 0 | 0.0% |
| Mobile Home / Other | 0 | 0.0% |
| Total | 154 | 100.0% |
Housing Structures by Occupancy in Cordova
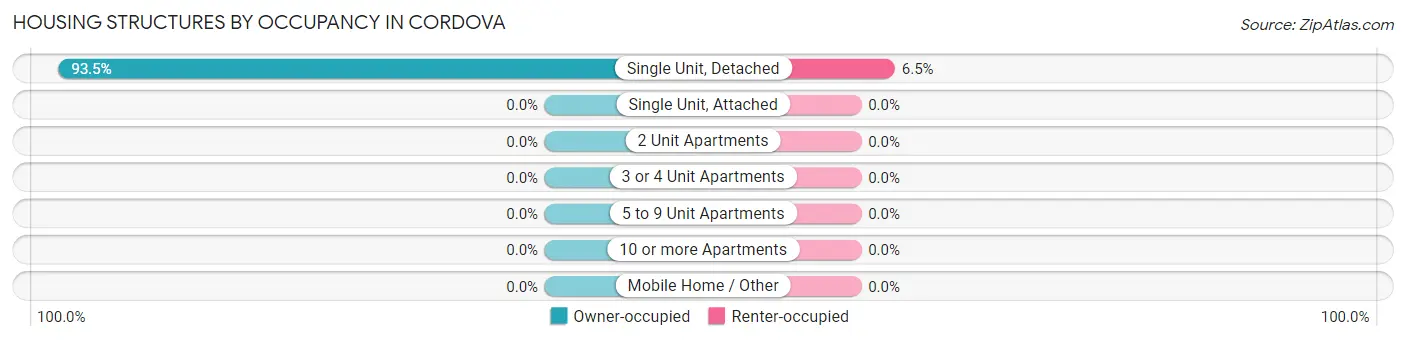
| Structure Type | Owner-occupied | Renter-occupied |
| Single Unit, Detached | 144 (93.5%) | 10 (6.5%) |
| Single Unit, Attached | 0 (0.0%) | 0 (0.0%) |
| 2 Unit Apartments | 0 (0.0%) | 0 (0.0%) |
| 3 or 4 Unit Apartments | 0 (0.0%) | 0 (0.0%) |
| 5 to 9 Unit Apartments | 0 (0.0%) | 0 (0.0%) |
| 10 or more Apartments | 0 (0.0%) | 0 (0.0%) |
| Mobile Home / Other | 0 (0.0%) | 0 (0.0%) |
| Total | 144 (93.5%) | 10 (6.5%) |
Housing Structures by Number of Rooms in Cordova
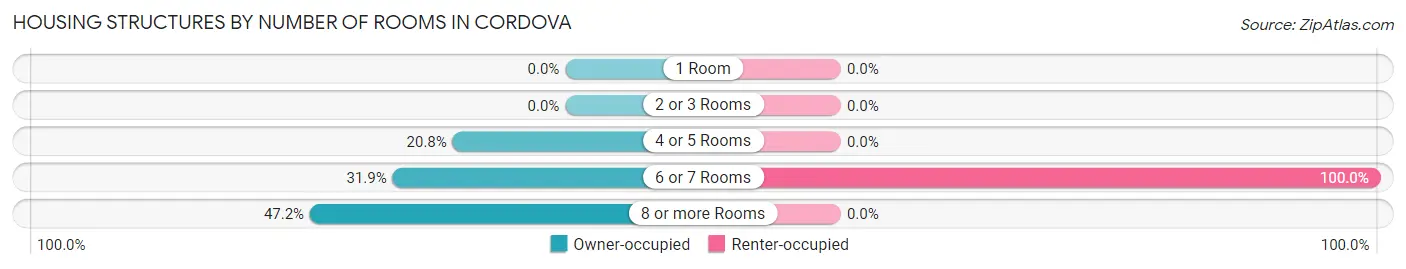
| Number of Rooms | Owner-occupied | Renter-occupied |
| 1 Room | 0 (0.0%) | 0 (0.0%) |
| 2 or 3 Rooms | 0 (0.0%) | 0 (0.0%) |
| 4 or 5 Rooms | 30 (20.8%) | 0 (0.0%) |
| 6 or 7 Rooms | 46 (31.9%) | 10 (100.0%) |
| 8 or more Rooms | 68 (47.2%) | 0 (0.0%) |
| Total | 144 (100.0%) | 10 (100.0%) |
Housing Structure by Heating Type in Cordova
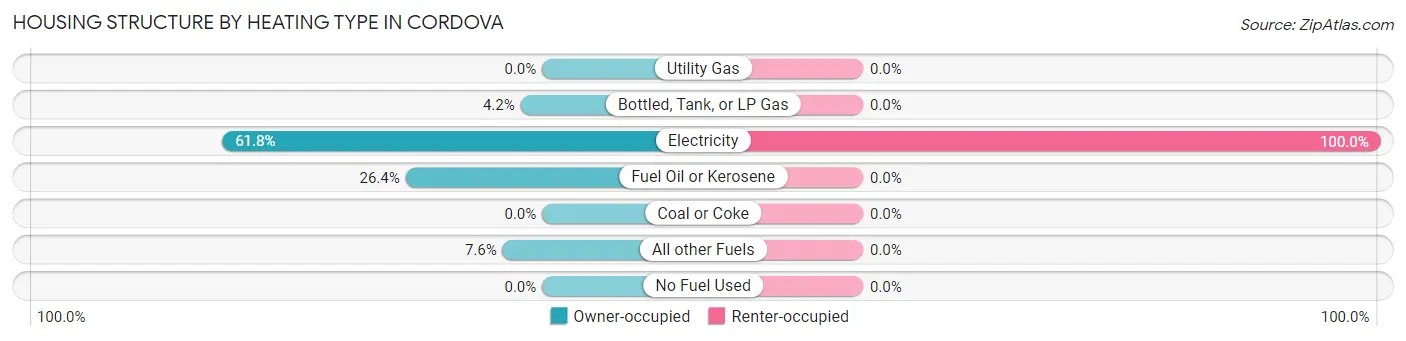
| Heating Type | Owner-occupied | Renter-occupied |
| Utility Gas | 0 (0.0%) | 0 (0.0%) |
| Bottled, Tank, or LP Gas | 6 (4.2%) | 0 (0.0%) |
| Electricity | 89 (61.8%) | 10 (100.0%) |
| Fuel Oil or Kerosene | 38 (26.4%) | 0 (0.0%) |
| Coal or Coke | 0 (0.0%) | 0 (0.0%) |
| All other Fuels | 11 (7.6%) | 0 (0.0%) |
| No Fuel Used | 0 (0.0%) | 0 (0.0%) |
| Total | 144 (100.0%) | 10 (100.0%) |
Household Vehicle Usage in Cordova
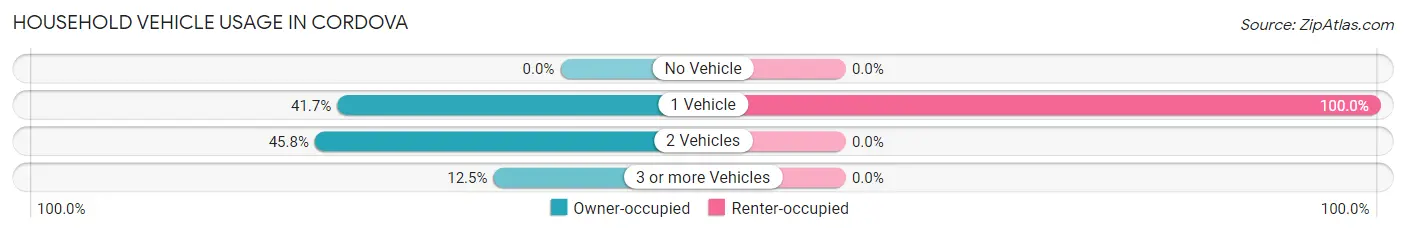
| Vehicles per Household | Owner-occupied | Renter-occupied |
| No Vehicle | 0 (0.0%) | 0 (0.0%) |
| 1 Vehicle | 60 (41.7%) | 10 (100.0%) |
| 2 Vehicles | 66 (45.8%) | 0 (0.0%) |
| 3 or more Vehicles | 18 (12.5%) | 0 (0.0%) |
| Total | 144 (100.0%) | 10 (100.0%) |
Real Estate & Mortgages in Cordova
Real Estate and Mortgage Overview in Cordova
| Characteristic | Without Mortgage | With Mortgage |
| Housing Units | 47 | 97 |
| Median Property Value | - | - |
| Median Household Income | - | - |
| Monthly Housing Costs | $465 | $12 |
| Real Estate Taxes | $788 | $0 |
Property Value by Mortgage Status in Cordova
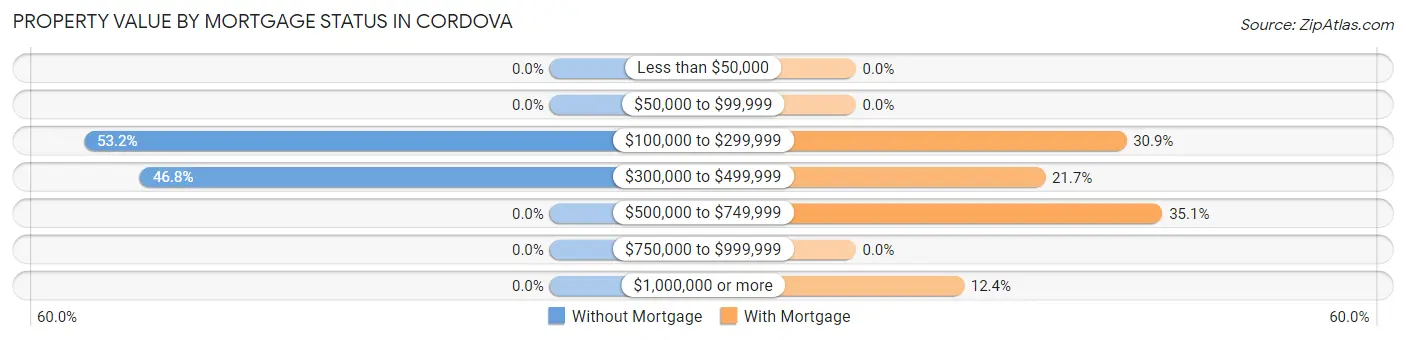
| Property Value | Without Mortgage | With Mortgage |
| Less than $50,000 | 0 (0.0%) | 0 (0.0%) |
| $50,000 to $99,999 | 0 (0.0%) | 0 (0.0%) |
| $100,000 to $299,999 | 25 (53.2%) | 30 (30.9%) |
| $300,000 to $499,999 | 22 (46.8%) | 21 (21.6%) |
| $500,000 to $749,999 | 0 (0.0%) | 34 (35.0%) |
| $750,000 to $999,999 | 0 (0.0%) | 0 (0.0%) |
| $1,000,000 or more | 0 (0.0%) | 12 (12.4%) |
| Total | 47 (100.0%) | 97 (100.0%) |
Household Income by Mortgage Status in Cordova
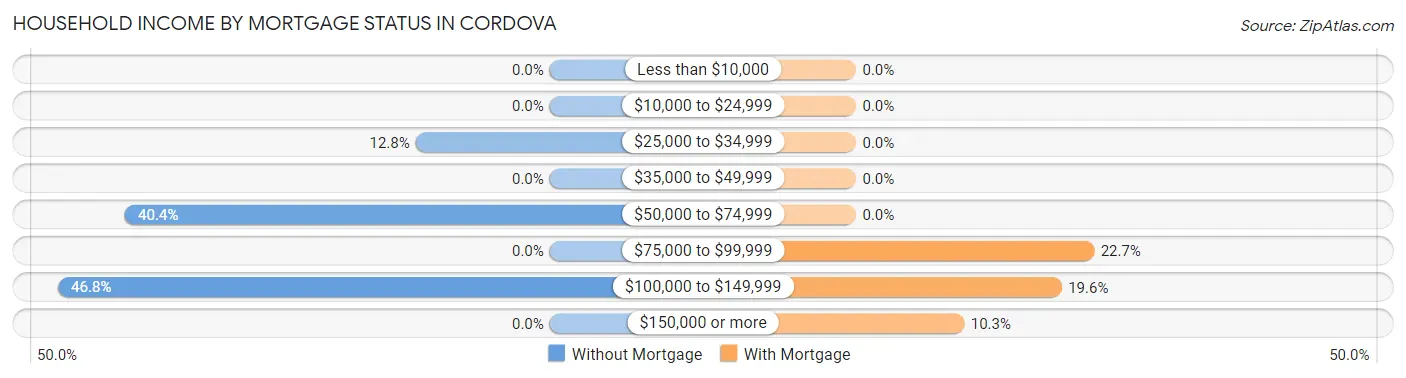
| Household Income | Without Mortgage | With Mortgage |
| Less than $10,000 | 0 (0.0%) | 0 (0.0%) |
| $10,000 to $24,999 | 0 (0.0%) | 0 (0.0%) |
| $25,000 to $34,999 | 6 (12.8%) | 0 (0.0%) |
| $35,000 to $49,999 | 0 (0.0%) | 0 (0.0%) |
| $50,000 to $74,999 | 19 (40.4%) | 0 (0.0%) |
| $75,000 to $99,999 | 0 (0.0%) | 22 (22.7%) |
| $100,000 to $149,999 | 22 (46.8%) | 19 (19.6%) |
| $150,000 or more | 0 (0.0%) | 10 (10.3%) |
| Total | 47 (100.0%) | 97 (100.0%) |
Property Value to Household Income Ratio in Cordova
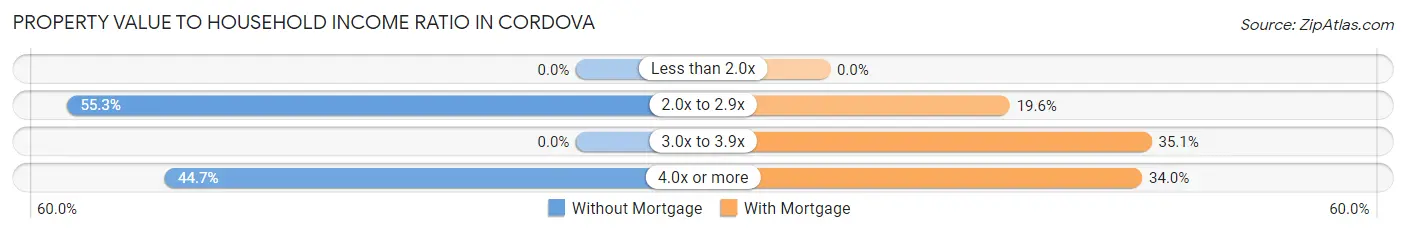
| Value-to-Income Ratio | Without Mortgage | With Mortgage |
| Less than 2.0x | 0 (0.0%) | 0 (0.0%) |
| 2.0x to 2.9x | 26 (55.3%) | 19 (19.6%) |
| 3.0x to 3.9x | 0 (0.0%) | 34 (35.0%) |
| 4.0x or more | 21 (44.7%) | 33 (34.0%) |
| Total | 47 (100.0%) | 97 (100.0%) |
Real Estate Taxes by Mortgage Status in Cordova
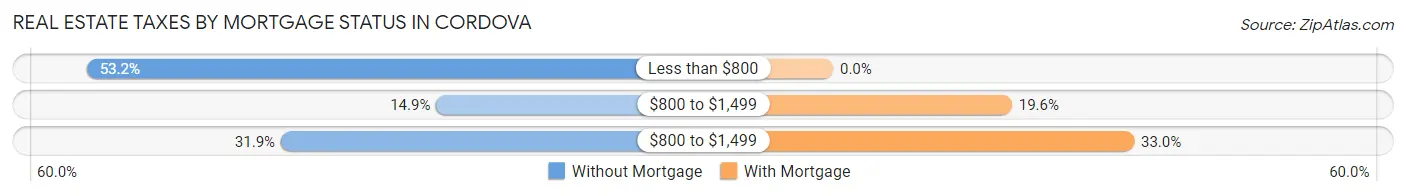
| Property Taxes | Without Mortgage | With Mortgage |
| Less than $800 | 25 (53.2%) | 0 (0.0%) |
| $800 to $1,499 | 7 (14.9%) | 19 (19.6%) |
| $800 to $1,499 | 15 (31.9%) | 32 (33.0%) |
| Total | 47 (100.0%) | 97 (100.0%) |
Health & Disability in Cordova
Health Insurance Coverage by Age in Cordova
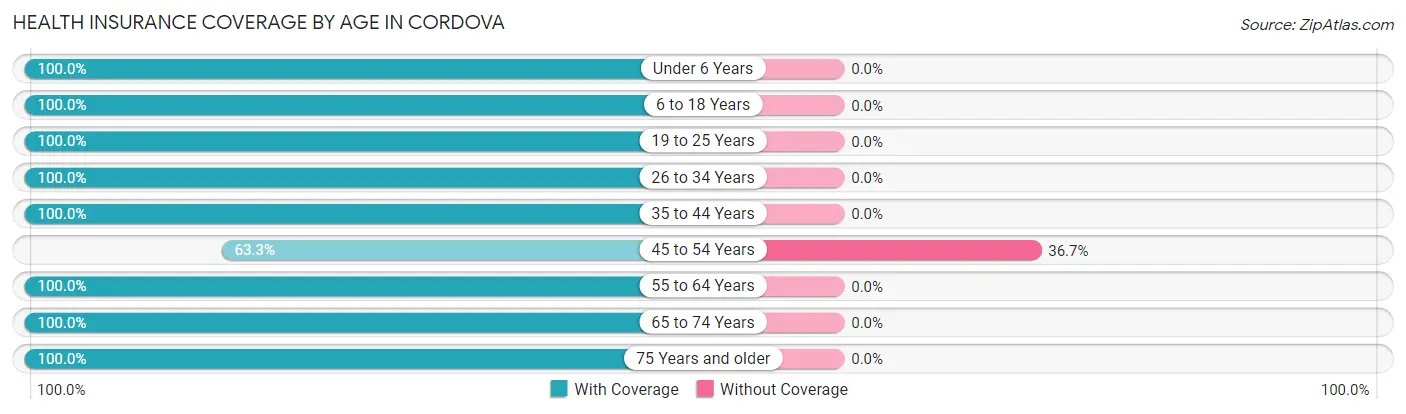
| Age Bracket | With Coverage | Without Coverage |
| Under 6 Years | 10 (100.0%) | 0 (0.0%) |
| 6 to 18 Years | 50 (100.0%) | 0 (0.0%) |
| 19 to 25 Years | 76 (100.0%) | 0 (0.0%) |
| 26 to 34 Years | 99 (100.0%) | 0 (0.0%) |
| 35 to 44 Years | 11 (100.0%) | 0 (0.0%) |
| 45 to 54 Years | 31 (63.3%) | 18 (36.7%) |
| 55 to 64 Years | 75 (100.0%) | 0 (0.0%) |
| 65 to 74 Years | 63 (100.0%) | 0 (0.0%) |
| 75 Years and older | 76 (100.0%) | 0 (0.0%) |
| Total | 491 (96.5%) | 18 (3.5%) |
Health Insurance Coverage by Citizenship Status in Cordova
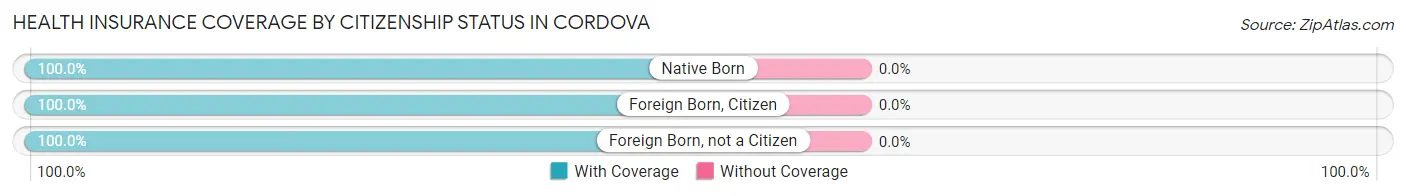
| Citizenship Status | With Coverage | Without Coverage |
| Native Born | 10 (100.0%) | 0 (0.0%) |
| Foreign Born, Citizen | 50 (100.0%) | 0 (0.0%) |
| Foreign Born, not a Citizen | 76 (100.0%) | 0 (0.0%) |
Health Insurance Coverage by Household Income in Cordova
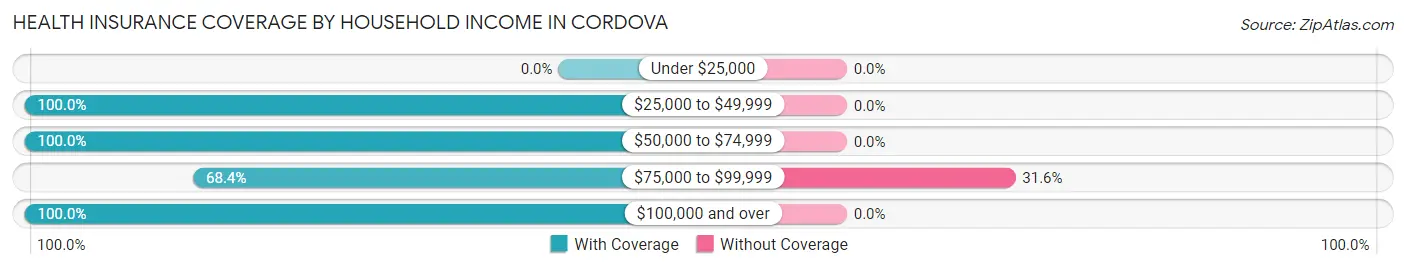
| Household Income | With Coverage | Without Coverage |
| Under $25,000 | 0 (0.0%) | 0 (0.0%) |
| $25,000 to $49,999 | 58 (100.0%) | 0 (0.0%) |
| $50,000 to $74,999 | 161 (100.0%) | 0 (0.0%) |
| $75,000 to $99,999 | 39 (68.4%) | 18 (31.6%) |
| $100,000 and over | 233 (100.0%) | 0 (0.0%) |
Public vs Private Health Insurance Coverage by Age in Cordova
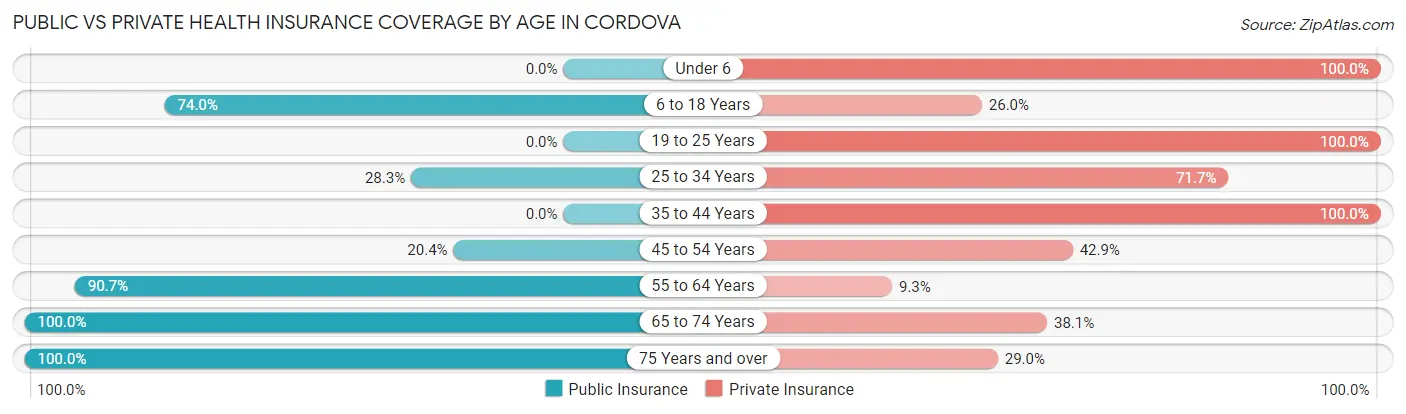
| Age Bracket | Public Insurance | Private Insurance |
| Under 6 | 0 (0.0%) | 10 (100.0%) |
| 6 to 18 Years | 37 (74.0%) | 13 (26.0%) |
| 19 to 25 Years | 0 (0.0%) | 76 (100.0%) |
| 25 to 34 Years | 28 (28.3%) | 71 (71.7%) |
| 35 to 44 Years | 0 (0.0%) | 11 (100.0%) |
| 45 to 54 Years | 10 (20.4%) | 21 (42.9%) |
| 55 to 64 Years | 68 (90.7%) | 7 (9.3%) |
| 65 to 74 Years | 63 (100.0%) | 24 (38.1%) |
| 75 Years and over | 76 (100.0%) | 22 (28.9%) |
| Total | 282 (55.4%) | 255 (50.1%) |
Disability Status by Sex by Age in Cordova
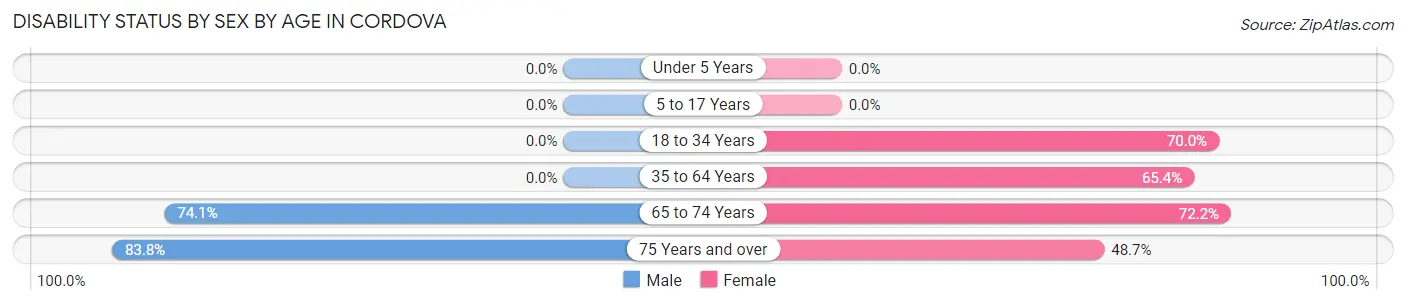
| Age Bracket | Male | Female |
| Under 5 Years | 0 (0.0%) | 0 (0.0%) |
| 5 to 17 Years | 0 (0.0%) | 0 (0.0%) |
| 18 to 34 Years | 0 (0.0%) | 28 (70.0%) |
| 35 to 64 Years | 0 (0.0%) | 34 (65.4%) |
| 65 to 74 Years | 20 (74.1%) | 26 (72.2%) |
| 75 Years and over | 31 (83.8%) | 19 (48.7%) |
Disability Class by Sex by Age in Cordova
Disability Class: Hearing Difficulty
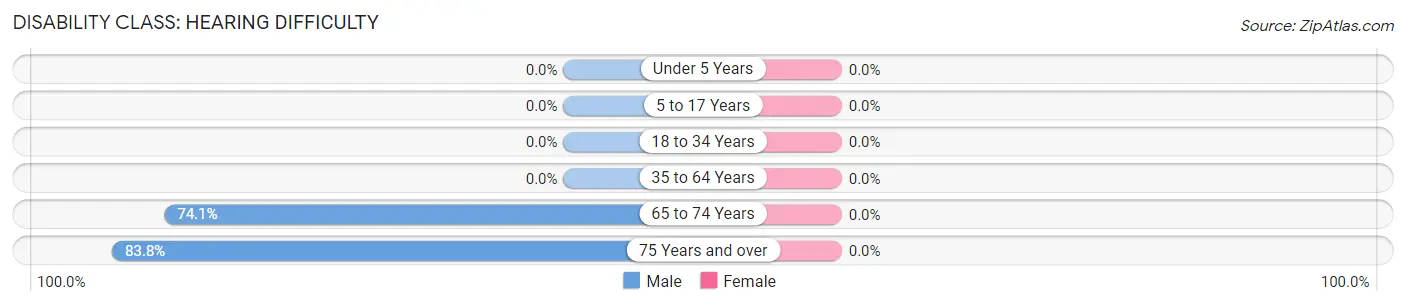
| Age Bracket | Male | Female |
| Under 5 Years | 0 (0.0%) | 0 (0.0%) |
| 5 to 17 Years | 0 (0.0%) | 0 (0.0%) |
| 18 to 34 Years | 0 (0.0%) | 0 (0.0%) |
| 35 to 64 Years | 0 (0.0%) | 0 (0.0%) |
| 65 to 74 Years | 20 (74.1%) | 0 (0.0%) |
| 75 Years and over | 31 (83.8%) | 0 (0.0%) |
Disability Class: Vision Difficulty
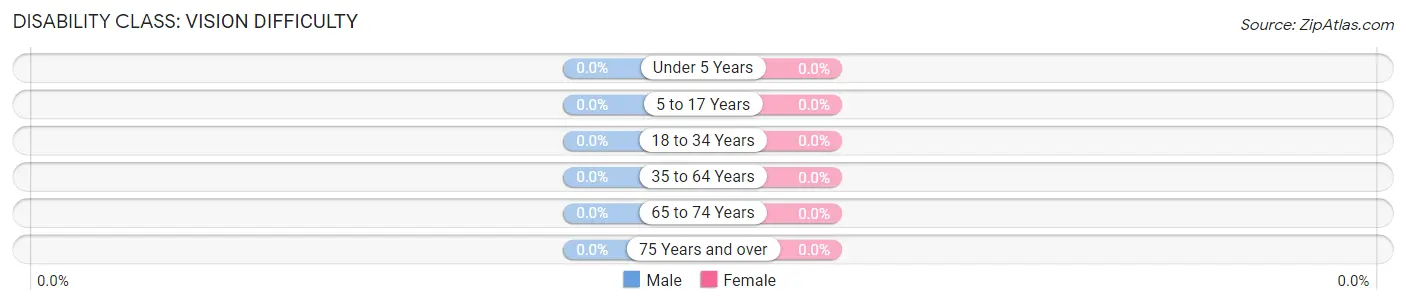
| Age Bracket | Male | Female |
| Under 5 Years | 0 (0.0%) | 0 (0.0%) |
| 5 to 17 Years | 0 (0.0%) | 0 (0.0%) |
| 18 to 34 Years | 0 (0.0%) | 0 (0.0%) |
| 35 to 64 Years | 0 (0.0%) | 0 (0.0%) |
| 65 to 74 Years | 0 (0.0%) | 0 (0.0%) |
| 75 Years and over | 0 (0.0%) | 0 (0.0%) |
Disability Class: Cognitive Difficulty
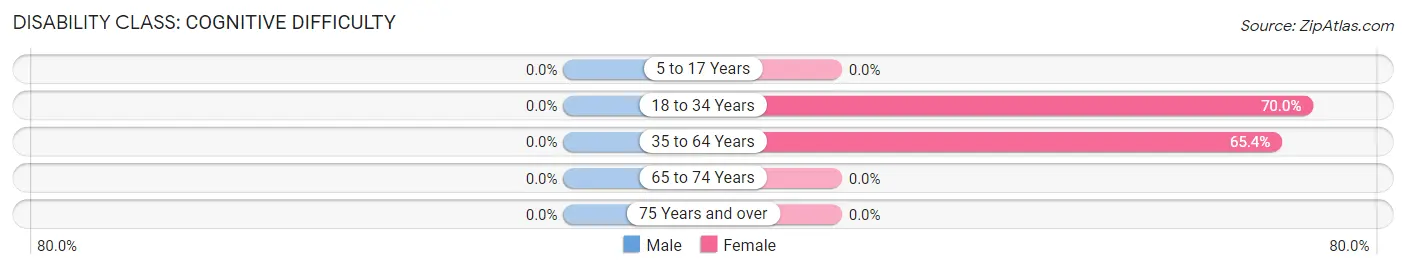
| Age Bracket | Male | Female |
| 5 to 17 Years | 0 (0.0%) | 0 (0.0%) |
| 18 to 34 Years | 0 (0.0%) | 28 (70.0%) |
| 35 to 64 Years | 0 (0.0%) | 34 (65.4%) |
| 65 to 74 Years | 0 (0.0%) | 0 (0.0%) |
| 75 Years and over | 0 (0.0%) | 0 (0.0%) |
Disability Class: Ambulatory Difficulty
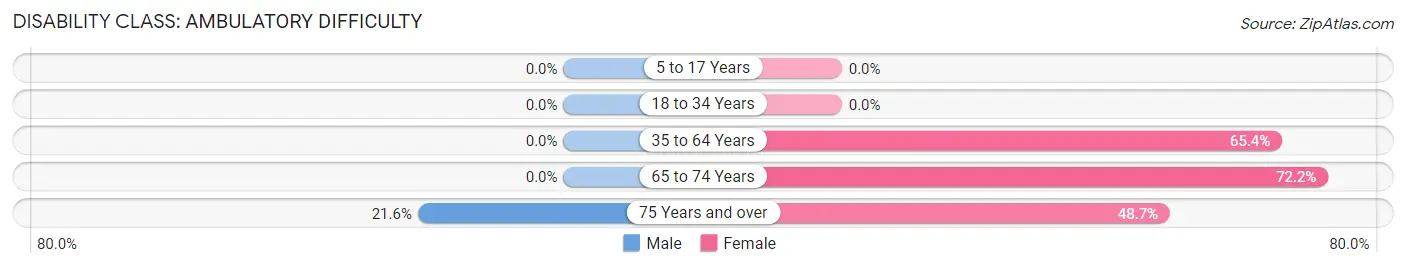
| Age Bracket | Male | Female |
| 5 to 17 Years | 0 (0.0%) | 0 (0.0%) |
| 18 to 34 Years | 0 (0.0%) | 0 (0.0%) |
| 35 to 64 Years | 0 (0.0%) | 34 (65.4%) |
| 65 to 74 Years | 0 (0.0%) | 26 (72.2%) |
| 75 Years and over | 8 (21.6%) | 19 (48.7%) |
Disability Class: Self-Care Difficulty
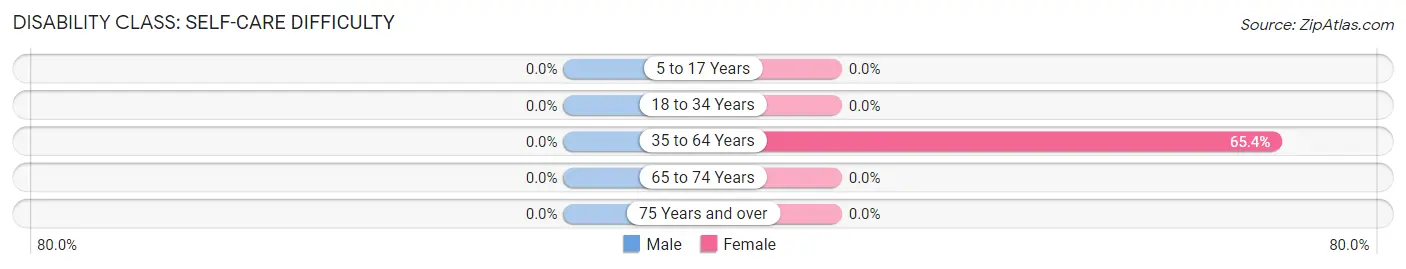
| Age Bracket | Male | Female |
| 5 to 17 Years | 0 (0.0%) | 0 (0.0%) |
| 18 to 34 Years | 0 (0.0%) | 0 (0.0%) |
| 35 to 64 Years | 0 (0.0%) | 34 (65.4%) |
| 65 to 74 Years | 0 (0.0%) | 0 (0.0%) |
| 75 Years and over | 0 (0.0%) | 0 (0.0%) |
Technology Access in Cordova
Computing Device Access in Cordova
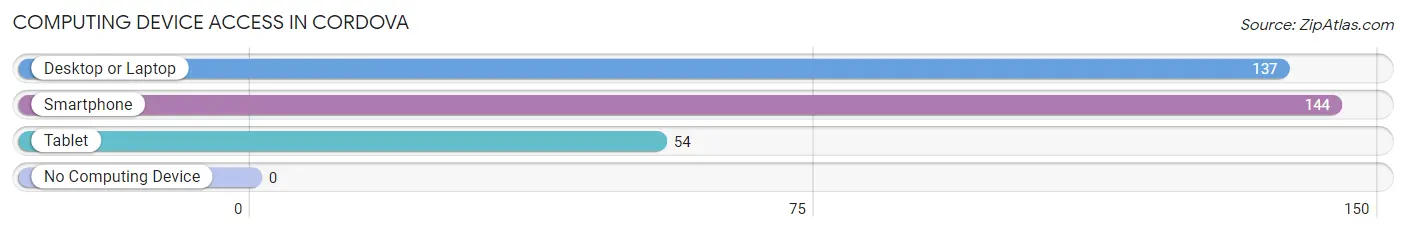
| Device Type | # Households | % Households |
| Desktop or Laptop | 137 | 89.0% |
| Smartphone | 144 | 93.5% |
| Tablet | 54 | 35.1% |
| No Computing Device | 0 | 0.0% |
| Total | 154 | 100.0% |
Internet Access in Cordova
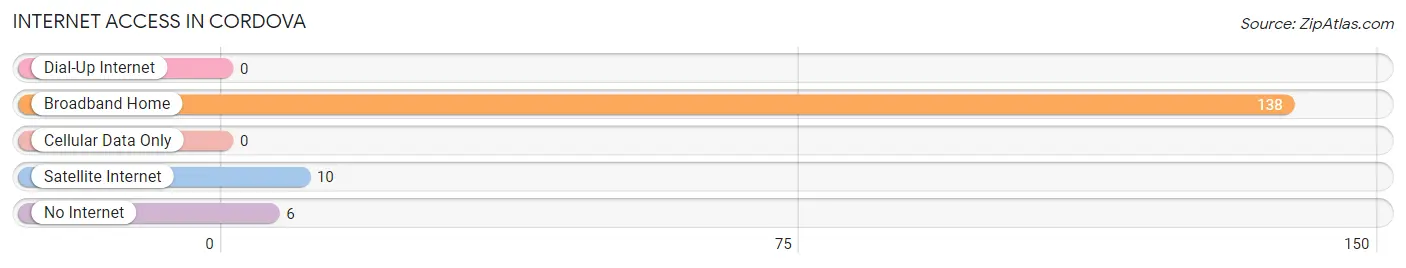
| Internet Type | # Households | % Households |
| Dial-Up Internet | 0 | 0.0% |
| Broadband Home | 138 | 89.6% |
| Cellular Data Only | 0 | 0.0% |
| Satellite Internet | 10 | 6.5% |
| No Internet | 6 | 3.9% |
| Total | 154 | 100.0% |
Cordova Summary
Cordova, Maryland is a small town located in Talbot County on the Eastern Shore of Maryland. It is situated on the Choptank River, about 25 miles east of Easton, the county seat. The town was founded in 1706 and is one of the oldest towns in the state. The population of Cordova was 1,845 in the 2000 census.
History
Cordova was founded in 1706 by a group of English settlers led by William Cordova. The town was originally known as “Cordova’s Town” and was located on the Choptank River. The town was named after William Cordova, who was a prominent landowner in the area. The town was incorporated in 1790 and was the first town in Talbot County to be incorporated.
In the early 19th century, Cordova was a thriving port town. It was a major center for the shipping of tobacco, grain, and other goods. The town was also home to several shipbuilding yards and a number of warehouses.
In the late 19th century, Cordova began to decline as a port town. The railroad bypassed the town and the shipping industry moved elsewhere. The town’s economy shifted to agriculture and the town became a center for the production of corn, wheat, and other crops.
Geography
Cordova is located in Talbot County on the Eastern Shore of Maryland. It is situated on the Choptank River, about 25 miles east of Easton, the county seat. The town is located in a rural area and is surrounded by farmland. The town is located at an elevation of 25 feet above sea level.
The climate in Cordova is humid subtropical, with hot, humid summers and mild winters. The average annual temperature is around 60 degrees Fahrenheit. The average annual precipitation is around 40 inches.
Economy
The economy of Cordova is largely based on agriculture. The town is home to several farms that produce corn, wheat, soybeans, and other crops. The town is also home to several seafood processing plants.
The town is also home to several small businesses, including restaurants, shops, and other services. The town is also home to a number of bed and breakfasts and other tourist attractions.
Demographics
As of the 2000 census, the population of Cordova was 1,845. The racial makeup of the town was 94.3% White, 3.2% African American, 0.3% Native American, 0.2% Asian, 0.1% Pacific Islander, 0.7% from other races, and 1.4% from two or more races. Hispanic or Latino of any race were 1.7% of the population.
The median income for a household in Cordova was $37,500, and the median income for a family was $45,000. The per capita income for the town was $19,845. About 11.2% of families and 13.2% of the population were below the poverty line, including 17.2% of those under age 18 and 8.2% of those age 65 or over.
Common Questions
What is Per Capita Income in Cordova?
Per Capita income in Cordova is $46,620.
What is the Median Family Income in Cordova?
Median Family Income in Cordova is $92,171.
What is the Median Household income in Cordova?
Median Household Income in Cordova is $100,313.
What is Inequality or Gini Index in Cordova?
Inequality or Gini Index in Cordova is 0.42.
What is the Total Population of Cordova?
Total Population of Cordova is 509.
What is the Total Male Population of Cordova?
Total Male Population of Cordova is 305.
What is the Total Female Population of Cordova?
Total Female Population of Cordova is 204.
What is the Ratio of Males per 100 Females in Cordova?
There are 149.51 Males per 100 Females in Cordova.
What is the Ratio of Females per 100 Males in Cordova?
There are 66.89 Females per 100 Males in Cordova.
What is the Median Population Age in Cordova?
Median Population Age in Cordova is 46.8 Years.
What is the Average Family Size in Cordova
Average Family Size in Cordova is 3.4 People.
What is the Average Household Size in Cordova
Average Household Size in Cordova is 3.3 People.
How Large is the Labor Force in Cordova?
There are 191 People in the Labor Forcein in Cordova.
What is the Percentage of People in the Labor Force in Cordova?
41.3% of People are in the Labor Force in Cordova.