Piney Point, MD Map & Demographics
Piney Point Map
Piney Point Overview
$44,819
PER CAPITA INCOME
$92,656
AVG FAMILY INCOME
$100,313
AVG HOUSEHOLD INCOME
0.35
INEQUALITY / GINI INDEX
1,033
TOTAL POPULATION
472
MALE POPULATION
561
FEMALE POPULATION
84.14
MALES / 100 FEMALES
118.86
FEMALES / 100 MALES
48.4
MEDIAN AGE
2.6
AVG FAMILY SIZE
2.6
AVG HOUSEHOLD SIZE
486
LABOR FORCE [ PEOPLE ]
58.6%
PERCENT IN LABOR FORCE
11.1%
UNEMPLOYMENT RATE
Piney Point Zip Codes
Piney Point Area Codes
Income in Piney Point
Income Overview in Piney Point
Per Capita Income in Piney Point is $44,819, while median incomes of families and households are $92,656 and $100,313 respectively.
| Characteristic | Number | Measure |
| Per Capita Income | 1,033 | $44,819 |
| Median Family Income | 345 | $92,656 |
| Mean Family Income | 345 | $109,434 |
| Median Household Income | 396 | $100,313 |
| Mean Household Income | 396 | $117,331 |
| Income Deficit | 345 | $0 |
| Wage / Income Gap (%) | 1,033 | 0.00% |
| Wage / Income Gap ($) | 1,033 | 100.00¢ per $1 |
| Gini / Inequality Index | 1,033 | 0.35 |
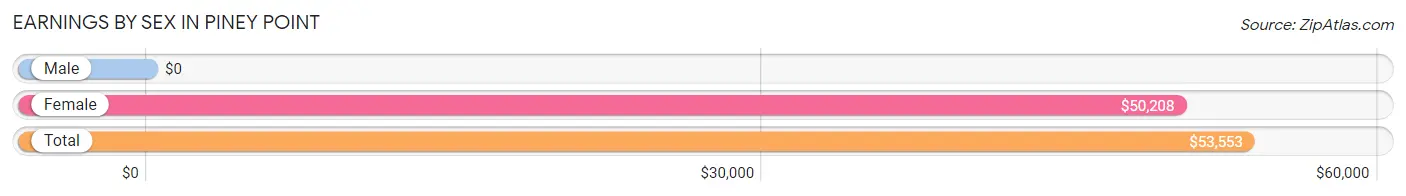
Earnings by Sex in Piney Point
| Sex | Number | Average Earnings |
| Male | 229 (47.1%) | $0 |
| Female | 257 (52.9%) | $50,208 |
| Total | 486 (100.0%) | $53,553 |
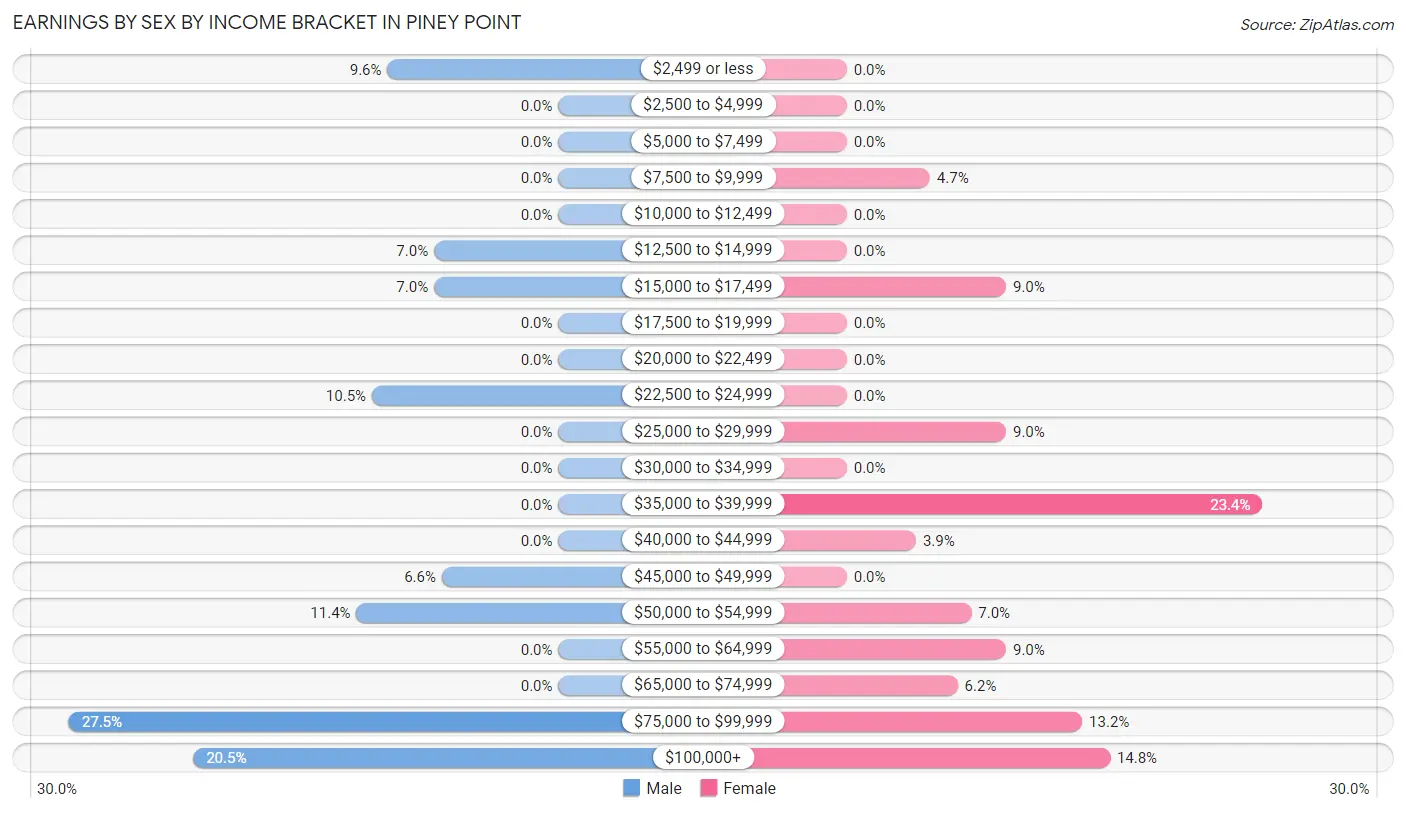
Earnings by Sex by Income Bracket in Piney Point
The most common earnings brackets in Piney Point are $75,000 to $99,999 for men (63 | 27.5%) and $35,000 to $39,999 for women (60 | 23.4%).
| Income | Male | Female |
| $2,499 or less | 22 (9.6%) | 0 (0.0%) |
| $2,500 to $4,999 | 0 (0.0%) | 0 (0.0%) |
| $5,000 to $7,499 | 0 (0.0%) | 0 (0.0%) |
| $7,500 to $9,999 | 0 (0.0%) | 12 (4.7%) |
| $10,000 to $12,499 | 0 (0.0%) | 0 (0.0%) |
| $12,500 to $14,999 | 16 (7.0%) | 0 (0.0%) |
| $15,000 to $17,499 | 16 (7.0%) | 23 (8.9%) |
| $17,500 to $19,999 | 0 (0.0%) | 0 (0.0%) |
| $20,000 to $22,499 | 0 (0.0%) | 0 (0.0%) |
| $22,500 to $24,999 | 24 (10.5%) | 0 (0.0%) |
| $25,000 to $29,999 | 0 (0.0%) | 23 (8.9%) |
| $30,000 to $34,999 | 0 (0.0%) | 0 (0.0%) |
| $35,000 to $39,999 | 0 (0.0%) | 60 (23.4%) |
| $40,000 to $44,999 | 0 (0.0%) | 10 (3.9%) |
| $45,000 to $49,999 | 15 (6.6%) | 0 (0.0%) |
| $50,000 to $54,999 | 26 (11.4%) | 18 (7.0%) |
| $55,000 to $64,999 | 0 (0.0%) | 23 (8.9%) |
| $65,000 to $74,999 | 0 (0.0%) | 16 (6.2%) |
| $75,000 to $99,999 | 63 (27.5%) | 34 (13.2%) |
| $100,000+ | 47 (20.5%) | 38 (14.8%) |
| Total | 229 (100.0%) | 257 (100.0%) |
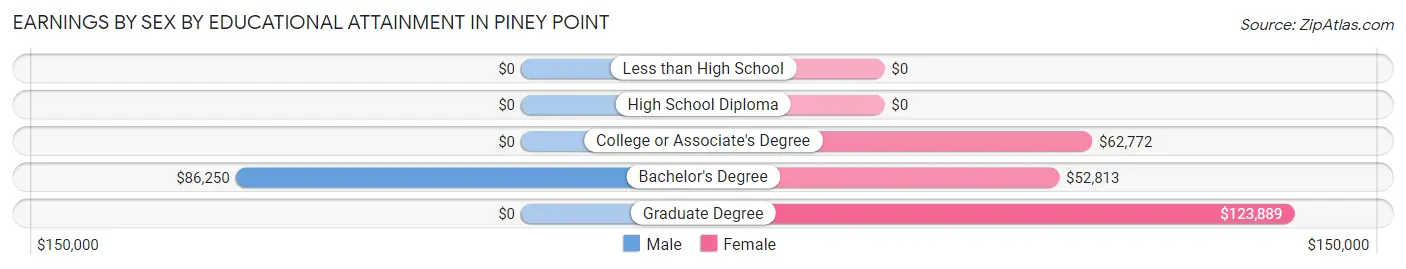
Earnings by Sex by Educational Attainment in Piney Point
| Educational Attainment | Male Income | Female Income |
| Less than High School | - | - |
| High School Diploma | - | - |
| College or Associate's Degree | - | - |
| Bachelor's Degree | $86,250 | $52,813 |
| Graduate Degree | - | - |
| Total | - | - |
Family Income in Piney Point
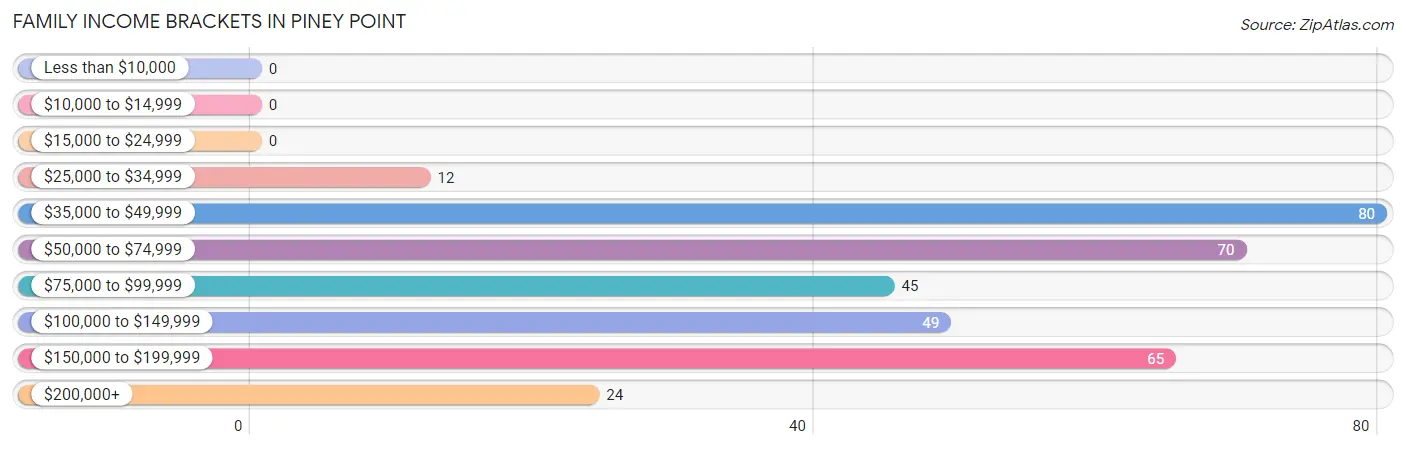
Family Income Brackets in Piney Point
According to the Piney Point family income data, there are 80 families falling into the $35,000 to $49,999 income range, which is the most common income bracket and makes up 23.2% of all families.
| Income Bracket | # Families | % Families |
| Less than $10,000 | 0 | 0.0% |
| $10,000 to $14,999 | 0 | 0.0% |
| $15,000 to $24,999 | 0 | 0.0% |
| $25,000 to $34,999 | 12 | 3.5% |
| $35,000 to $49,999 | 80 | 23.2% |
| $50,000 to $74,999 | 70 | 20.3% |
| $75,000 to $99,999 | 45 | 13.0% |
| $100,000 to $149,999 | 49 | 14.2% |
| $150,000 to $199,999 | 65 | 18.8% |
| $200,000+ | 24 | 7.0% |
Family Income by Famaliy Size in Piney Point
| Income Bracket | # Families | Median Income |
| 2-Person Families | 207 (60.0%) | $0 |
| 3-Person Families | 112 (32.5%) | $0 |
| 4-Person Families | 14 (4.1%) | $0 |
| 5-Person Families | 12 (3.5%) | $0 |
| 6-Person Families | 0 (0.0%) | $0 |
| 7+ Person Families | 0 (0.0%) | $0 |
| Total | 345 (100.0%) | $92,656 |
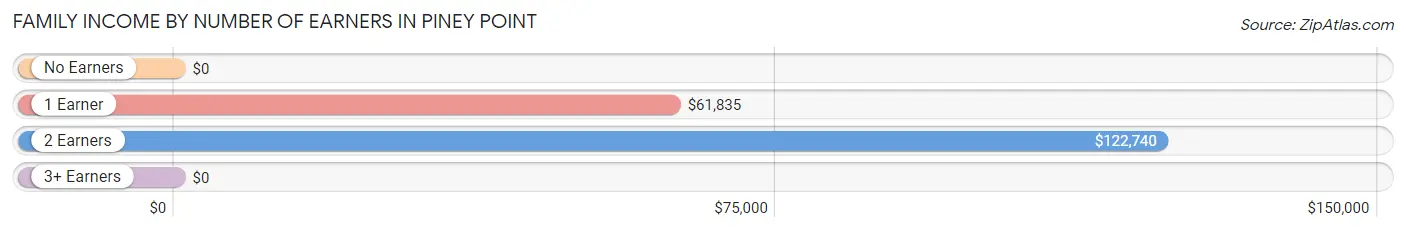
Family Income by Number of Earners in Piney Point
| Number of Earners | # Families | Median Income |
| No Earners | 94 (27.3%) | $0 |
| 1 Earner | 81 (23.5%) | $61,835 |
| 2 Earners | 165 (47.8%) | $122,740 |
| 3+ Earners | 5 (1.5%) | $0 |
| Total | 345 (100.0%) | $92,656 |
Household Income in Piney Point
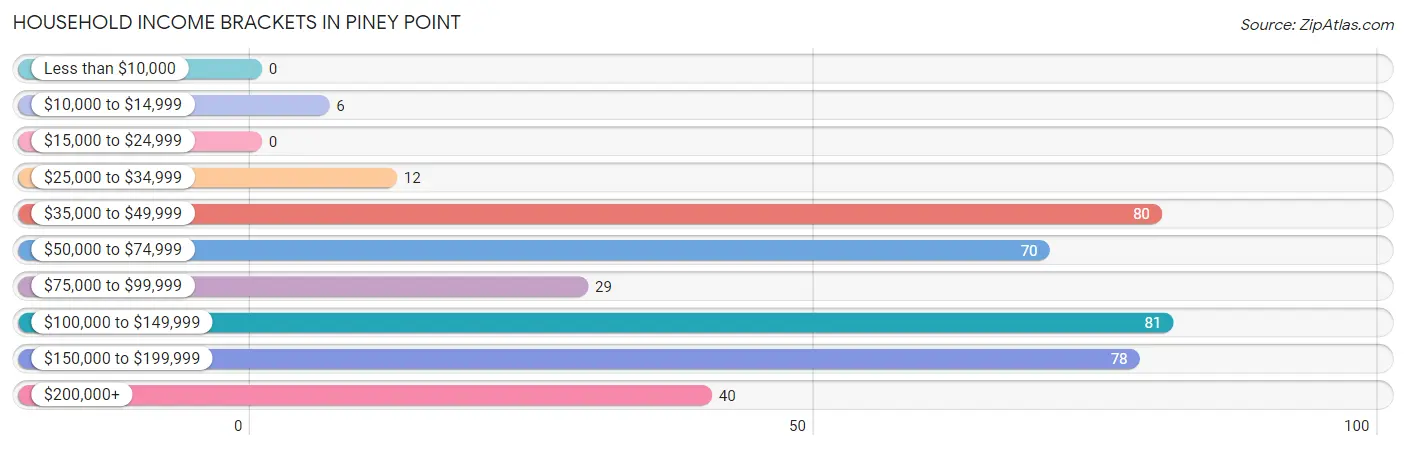
Household Income Brackets in Piney Point
With 81 households falling in the category, the $100,000 to $149,999 income range is the most frequent in Piney Point, accounting for 20.4% of all households.
| Income Bracket | # Households | % Households |
| Less than $10,000 | 0 | 0.0% |
| $10,000 to $14,999 | 6 | 1.5% |
| $15,000 to $24,999 | 0 | 0.0% |
| $25,000 to $34,999 | 12 | 3.0% |
| $35,000 to $49,999 | 80 | 20.2% |
| $50,000 to $74,999 | 70 | 17.7% |
| $75,000 to $99,999 | 29 | 7.3% |
| $100,000 to $149,999 | 81 | 20.5% |
| $150,000 to $199,999 | 78 | 19.7% |
| $200,000+ | 40 | 10.1% |
Household Income by Householder Age in Piney Point
The median household income in Piney Point is $100,313, with the highest median household income of $123,606 found in the 45 to 64 years age bracket for the primary householder. A total of 157 households (39.7%) fall into this category. Meanwhile, the 15 to 24 years age bracket for the primary householder has the lowest median household income of $0, with 6 households (1.5%) in this group.
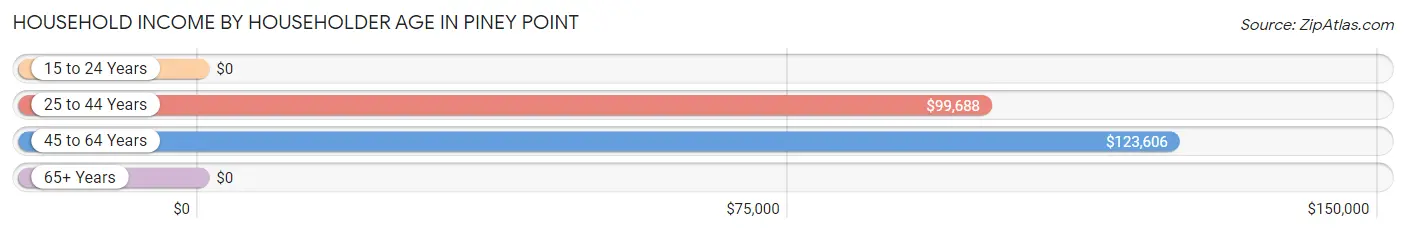
| Income Bracket | # Households | Median Income |
| 15 to 24 Years | 6 (1.5%) | $0 |
| 25 to 44 Years | 129 (32.6%) | $99,688 |
| 45 to 64 Years | 157 (39.7%) | $123,606 |
| 65+ Years | 104 (26.3%) | $0 |
| Total | 396 (100.0%) | $100,313 |
Poverty in Piney Point
Income Below Poverty by Sex and Age in Piney Point
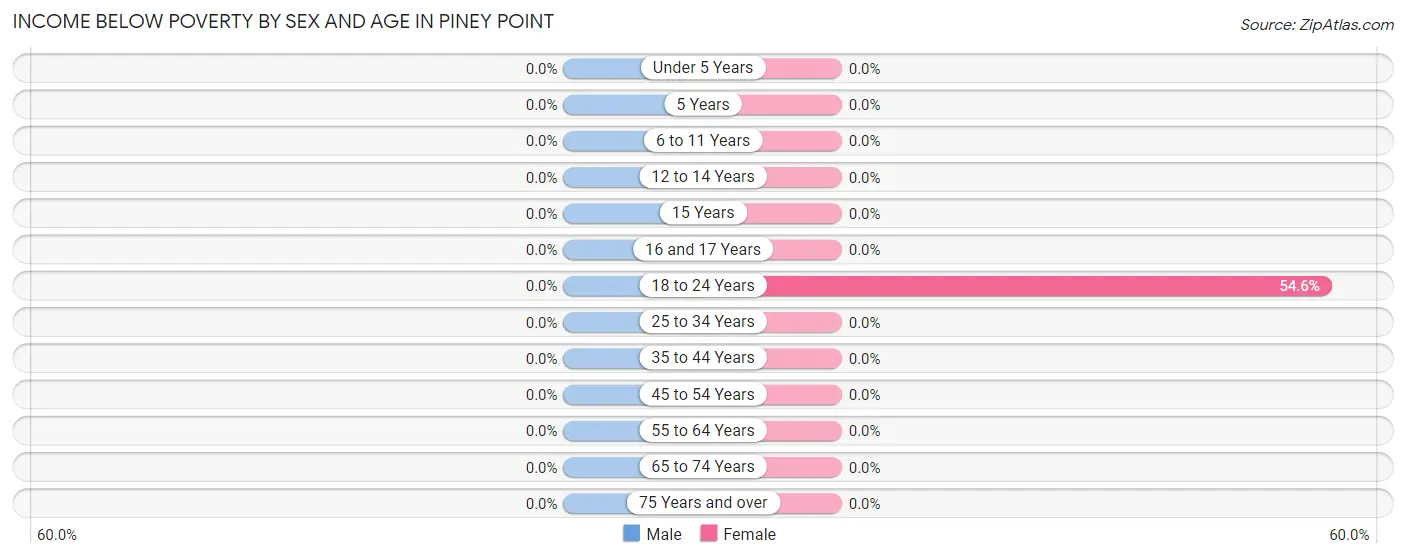
| Age Bracket | Male | Female |
| Under 5 Years | 0 (0.0%) | 0 (0.0%) |
| 5 Years | 0 (0.0%) | 0 (0.0%) |
| 6 to 11 Years | 0 (0.0%) | 0 (0.0%) |
| 12 to 14 Years | 0 (0.0%) | 0 (0.0%) |
| 15 Years | 0 (0.0%) | 0 (0.0%) |
| 16 and 17 Years | 0 (0.0%) | 0 (0.0%) |
| 18 to 24 Years | 0 (0.0%) | 6 (54.5%) |
| 25 to 34 Years | 0 (0.0%) | 0 (0.0%) |
| 35 to 44 Years | 0 (0.0%) | 0 (0.0%) |
| 45 to 54 Years | 0 (0.0%) | 0 (0.0%) |
| 55 to 64 Years | 0 (0.0%) | 0 (0.0%) |
| 65 to 74 Years | 0 (0.0%) | 0 (0.0%) |
| 75 Years and over | 0 (0.0%) | 0 (0.0%) |
| Total | 0 (0.0%) | 6 (1.1%) |
Income Above Poverty by Sex and Age in Piney Point
According to the poverty statistics in Piney Point, males aged under 5 years and females aged under 5 years are the age groups that are most secure financially, with 100.0% of males and 100.0% of females in these age groups living above the poverty line.
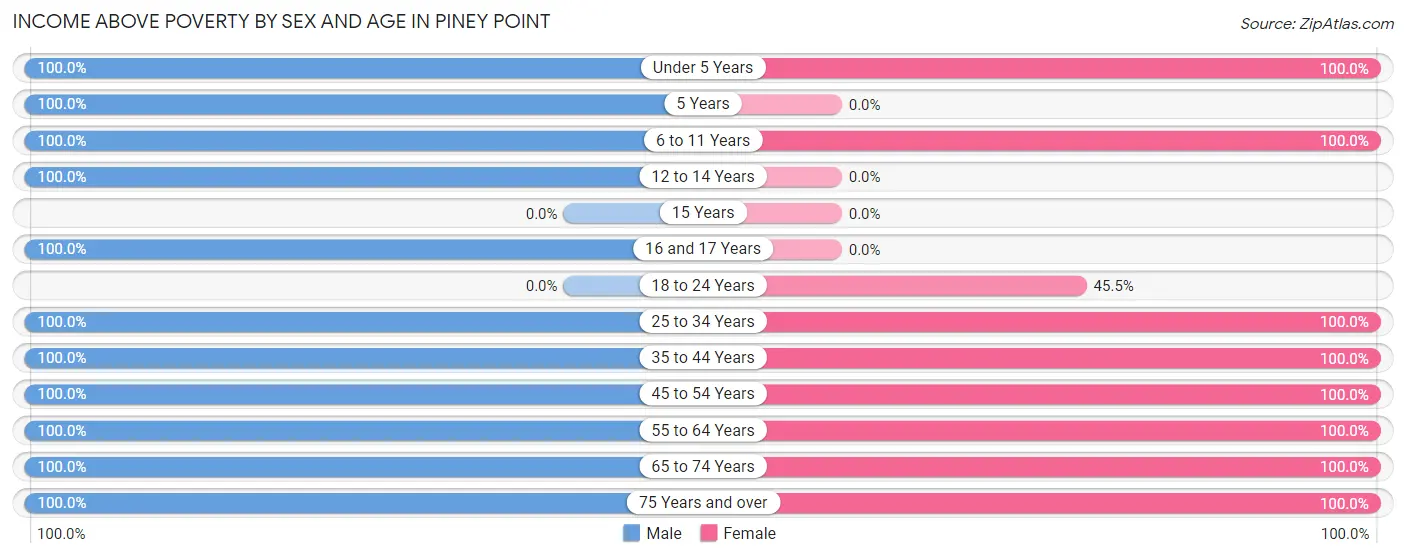
| Age Bracket | Male | Female |
| Under 5 Years | 14 (100.0%) | 82 (100.0%) |
| 5 Years | 12 (100.0%) | 0 (0.0%) |
| 6 to 11 Years | 5 (100.0%) | 6 (100.0%) |
| 12 to 14 Years | 26 (100.0%) | 0 (0.0%) |
| 15 Years | 0 (0.0%) | 0 (0.0%) |
| 16 and 17 Years | 8 (100.0%) | 0 (0.0%) |
| 18 to 24 Years | 0 (0.0%) | 5 (45.5%) |
| 25 to 34 Years | 68 (100.0%) | 100 (100.0%) |
| 35 to 44 Years | 83 (100.0%) | 30 (100.0%) |
| 45 to 54 Years | 60 (100.0%) | 53 (100.0%) |
| 55 to 64 Years | 25 (100.0%) | 69 (100.0%) |
| 65 to 74 Years | 60 (100.0%) | 157 (100.0%) |
| 75 Years and over | 68 (100.0%) | 37 (100.0%) |
| Total | 429 (100.0%) | 539 (98.9%) |
Income Below Poverty Among Married-Couple Families in Piney Point
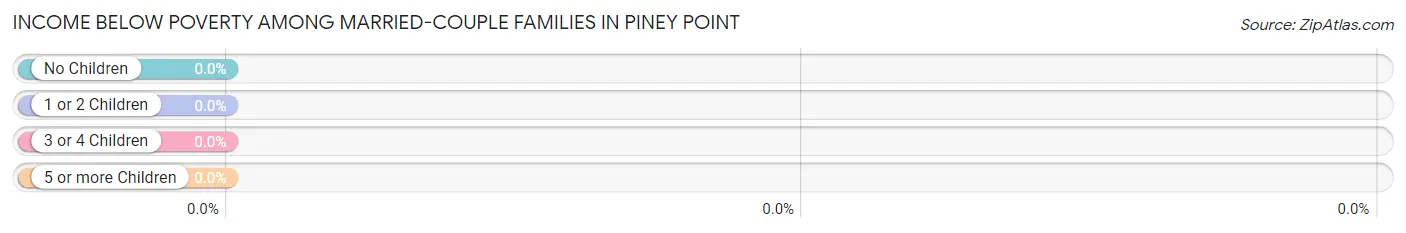
| Children | Above Poverty | Below Poverty |
| No Children | 193 (100.0%) | 0 (0.0%) |
| 1 or 2 Children | 51 (100.0%) | 0 (0.0%) |
| 3 or 4 Children | 12 (100.0%) | 0 (0.0%) |
| 5 or more Children | 0 (0.0%) | 0 (0.0%) |
| Total | 256 (100.0%) | 0 (0.0%) |
Income Below Poverty Among Single-Parent Households in Piney Point
| Children | Single Father | Single Mother |
| No Children | 0 (0.0%) | 0 (0.0%) |
| 1 or 2 Children | 0 (0.0%) | 0 (0.0%) |
| 3 or 4 Children | 0 (0.0%) | 0 (0.0%) |
| 5 or more Children | 0 (0.0%) | 0 (0.0%) |
| Total | 0 (0.0%) | 0 (0.0%) |
Income Below Poverty Among Married-Couple vs Single-Parent Households in Piney Point
| Children | Married-Couple Families | Single-Parent Households |
| No Children | 0 (0.0%) | 0 (0.0%) |
| 1 or 2 Children | 0 (0.0%) | 0 (0.0%) |
| 3 or 4 Children | 0 (0.0%) | 0 (0.0%) |
| 5 or more Children | 0 (0.0%) | 0 (0.0%) |
| Total | 0 (0.0%) | 0 (0.0%) |
Race in Piney Point
The most populous races in Piney Point are White / Caucasian (808 | 78.2%), Black / African American (125 | 12.1%), and Two or more Races (77 | 7.4%).
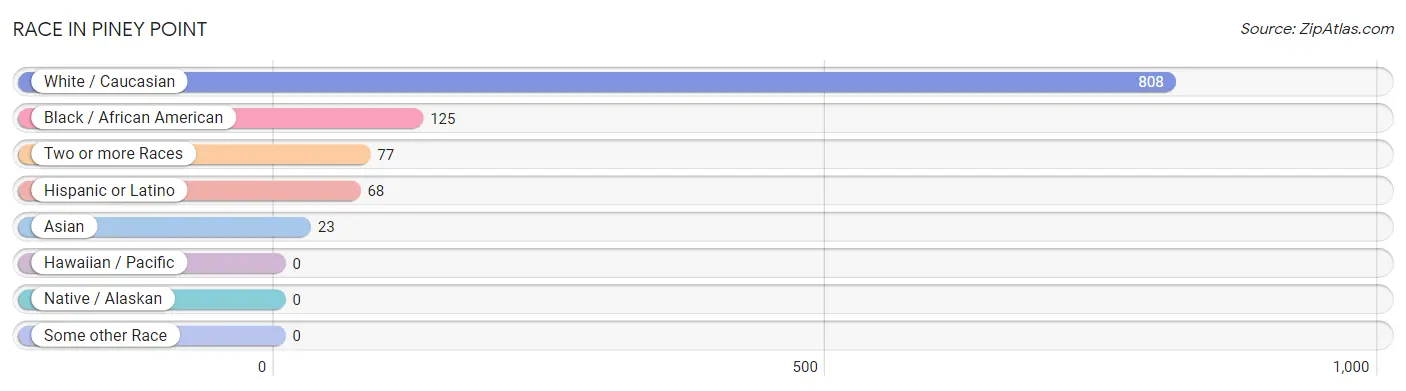
| Race | # Population | % Population |
| Asian | 23 | 2.2% |
| Black / African American | 125 | 12.1% |
| Hawaiian / Pacific | 0 | 0.0% |
| Hispanic or Latino | 68 | 6.6% |
| Native / Alaskan | 0 | 0.0% |
| White / Caucasian | 808 | 78.2% |
| Two or more Races | 77 | 7.4% |
| Some other Race | 0 | 0.0% |
| Total | 1,033 | 100.0% |
Ancestry in Piney Point
The most populous ancestries reported in Piney Point are English (287 | 27.8%), German (113 | 10.9%), Irish (87 | 8.4%), European (69 | 6.7%), and Belgian (51 | 4.9%), together accounting for 58.8% of all Piney Point residents.
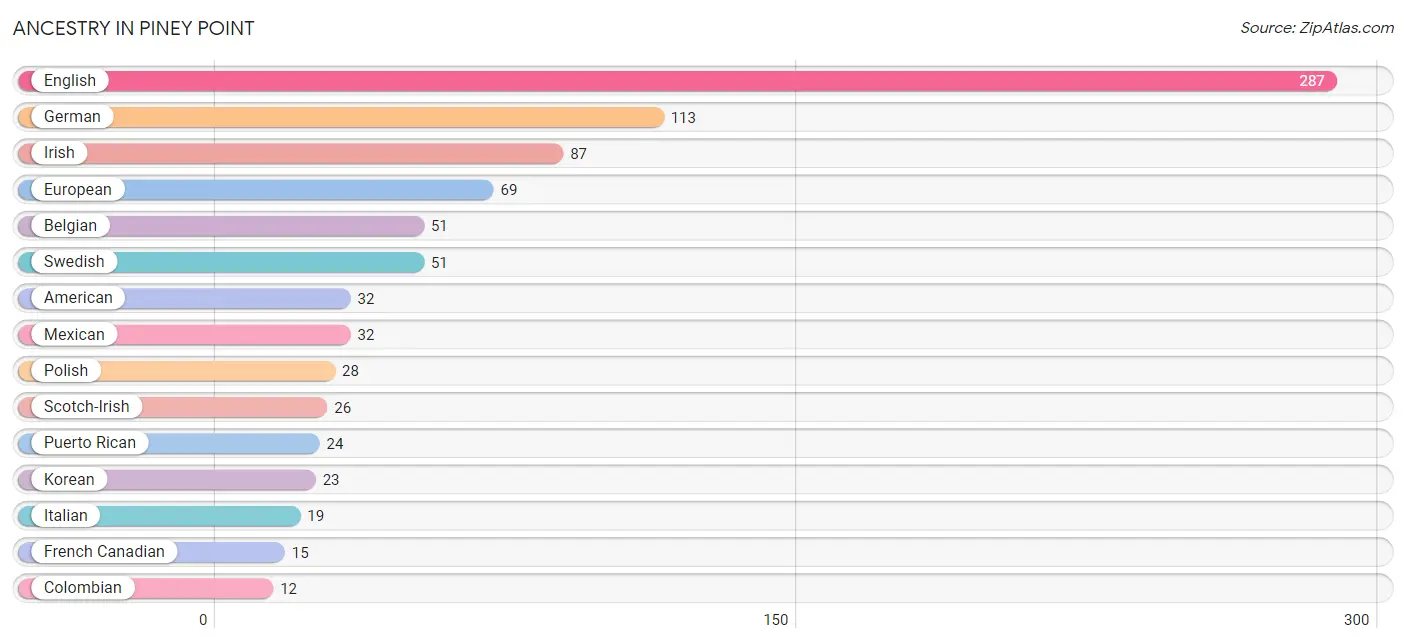
| Ancestry | # Population | % Population |
| American | 32 | 3.1% |
| Belgian | 51 | 4.9% |
| British | 10 | 1.0% |
| Chippewa | 5 | 0.5% |
| Colombian | 12 | 1.2% |
| English | 287 | 27.8% |
| European | 69 | 6.7% |
| French Canadian | 15 | 1.5% |
| German | 113 | 10.9% |
| Irish | 87 | 8.4% |
| Italian | 19 | 1.8% |
| Korean | 23 | 2.2% |
| Mexican | 32 | 3.1% |
| Polish | 28 | 2.7% |
| Puerto Rican | 24 | 2.3% |
| Scotch-Irish | 26 | 2.5% |
| South American | 12 | 1.2% |
| Swedish | 51 | 4.9% | View All 18 Rows |
Immigrants in Piney Point
The most numerous immigrant groups reported in Piney Point came from , and Canada (15 | 1.5%), together accounting for 1.5% of all Piney Point residents.

| Immigration Origin | # Population | % Population |
| Canada | 15 | 1.5% | View All 1 Rows |
Sex and Age in Piney Point
Sex and Age in Piney Point
The most populous age groups in Piney Point are 10 to 14 Years (69 | 14.6%) for men and 65 to 69 Years (84 | 15.0%) for women.
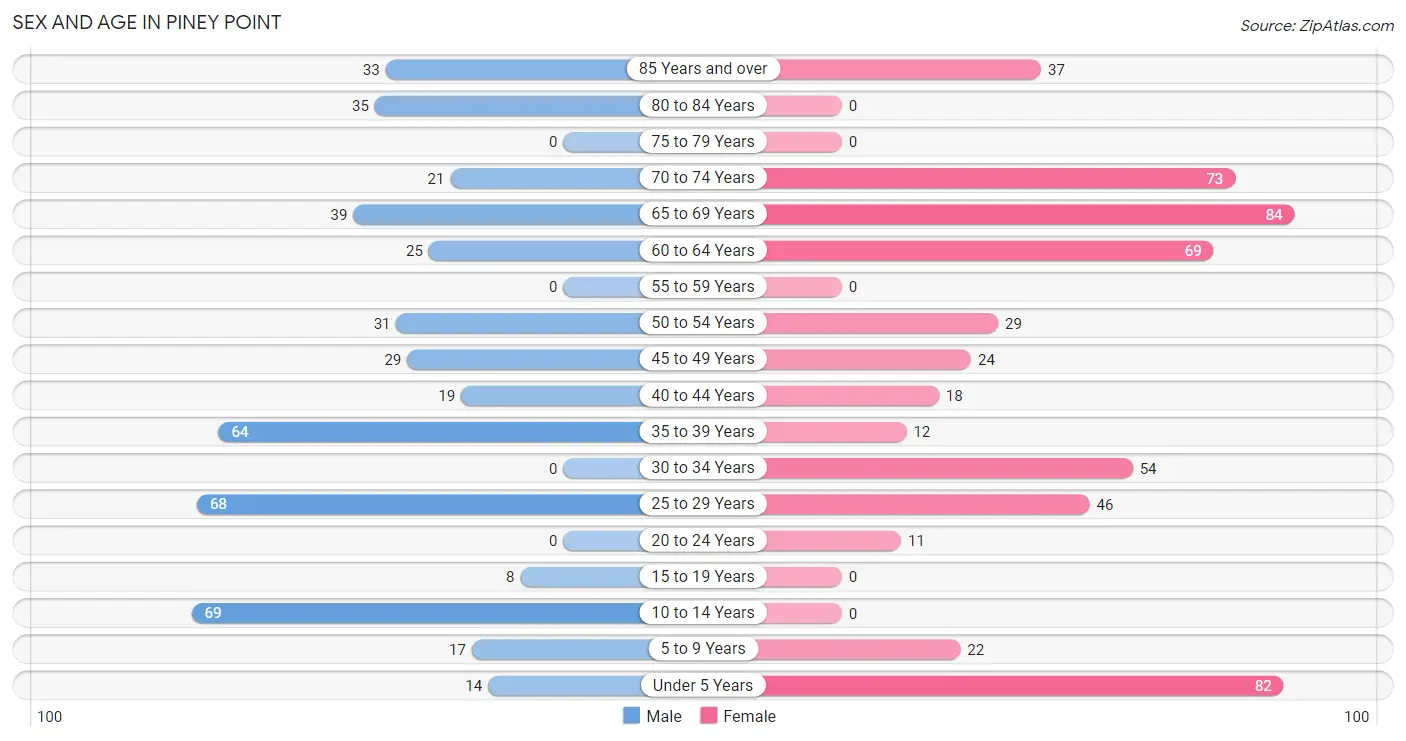
| Age Bracket | Male | Female |
| Under 5 Years | 14 (3.0%) | 82 (14.6%) |
| 5 to 9 Years | 17 (3.6%) | 22 (3.9%) |
| 10 to 14 Years | 69 (14.6%) | 0 (0.0%) |
| 15 to 19 Years | 8 (1.7%) | 0 (0.0%) |
| 20 to 24 Years | 0 (0.0%) | 11 (2.0%) |
| 25 to 29 Years | 68 (14.4%) | 46 (8.2%) |
| 30 to 34 Years | 0 (0.0%) | 54 (9.6%) |
| 35 to 39 Years | 64 (13.6%) | 12 (2.1%) |
| 40 to 44 Years | 19 (4.0%) | 18 (3.2%) |
| 45 to 49 Years | 29 (6.1%) | 24 (4.3%) |
| 50 to 54 Years | 31 (6.6%) | 29 (5.2%) |
| 55 to 59 Years | 0 (0.0%) | 0 (0.0%) |
| 60 to 64 Years | 25 (5.3%) | 69 (12.3%) |
| 65 to 69 Years | 39 (8.3%) | 84 (15.0%) |
| 70 to 74 Years | 21 (4.4%) | 73 (13.0%) |
| 75 to 79 Years | 0 (0.0%) | 0 (0.0%) |
| 80 to 84 Years | 35 (7.4%) | 0 (0.0%) |
| 85 Years and over | 33 (7.0%) | 37 (6.6%) |
| Total | 472 (100.0%) | 561 (100.0%) |
Families and Households in Piney Point
Median Family Size in Piney Point
The median family size in Piney Point is 2.61 persons per family, with single female/mother families (83 | 24.1%) accounting for the largest median family size of 2.83 persons per family. On the other hand, single male/father families (6 | 1.7%) represent the smallest median family size with 1.83 persons per family.
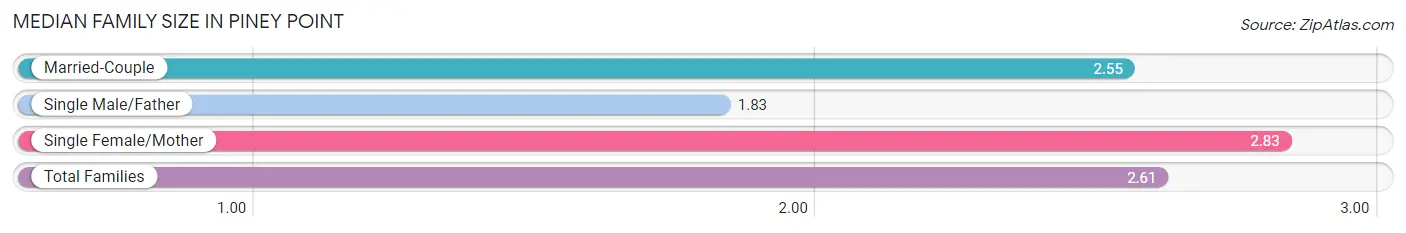
| Family Type | # Families | Family Size |
| Married-Couple | 256 (74.2%) | 2.55 |
| Single Male/Father | 6 (1.7%) | 1.83 |
| Single Female/Mother | 83 (24.1%) | 2.83 |
| Total Families | 345 (100.0%) | 2.61 |
Median Household Size in Piney Point
The median household size in Piney Point is 2.61 persons per household, with single female/mother households (83 | 21.0%) accounting for the largest median household size of 3.67 persons per household. non-family households (51 | 12.9%) represent the smallest median household size with 1.25 persons per household.
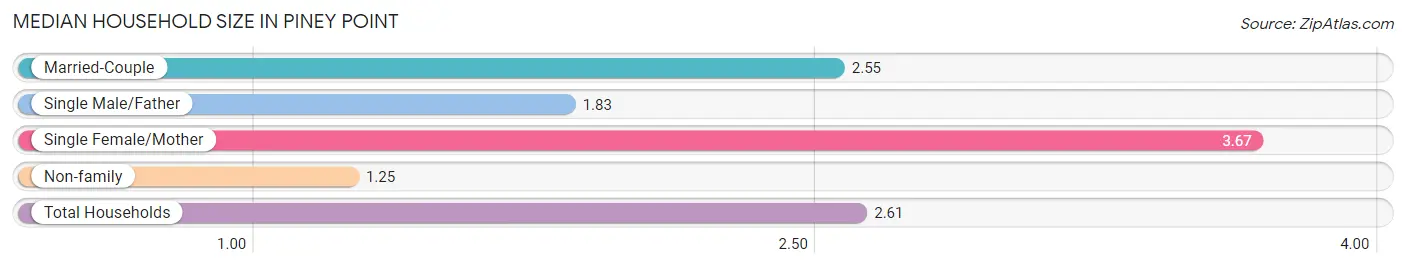
| Household Type | # Households | Household Size |
| Married-Couple | 256 (64.6%) | 2.55 |
| Single Male/Father | 6 (1.5%) | 1.83 |
| Single Female/Mother | 83 (21.0%) | 3.67 |
| Non-family | 51 (12.9%) | 1.25 |
| Total Households | 396 (100.0%) | 2.61 |
Household Size by Marriage Status in Piney Point
Out of a total of 396 households in Piney Point, 345 (87.1%) are family households, while 51 (12.9%) are nonfamily households. The most numerous type of family households are 2-person households, comprising 207, and the most common type of nonfamily households are 1-person households, comprising 39.
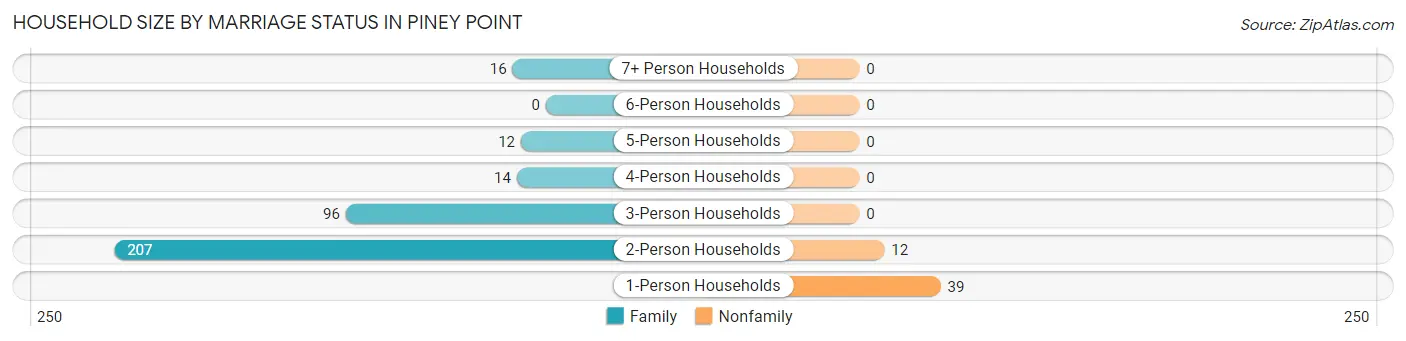
| Household Size | Family Households | Nonfamily Households |
| 1-Person Households | - | 39 (9.9%) |
| 2-Person Households | 207 (52.3%) | 12 (3.0%) |
| 3-Person Households | 96 (24.2%) | 0 (0.0%) |
| 4-Person Households | 14 (3.5%) | 0 (0.0%) |
| 5-Person Households | 12 (3.0%) | 0 (0.0%) |
| 6-Person Households | 0 (0.0%) | 0 (0.0%) |
| 7+ Person Households | 16 (4.0%) | 0 (0.0%) |
| Total | 345 (87.1%) | 51 (12.9%) |
Female Fertility in Piney Point
Fertility by Age in Piney Point
Average fertility rate in Piney Point is 182.0 births per 1,000 women. Women in the age bracket of 35 to 50 years have the highest fertility rate with 333.0 births per 1,000 women. Women in the age bracket of 35 to 50 years acount for 60.0% of all women with births.
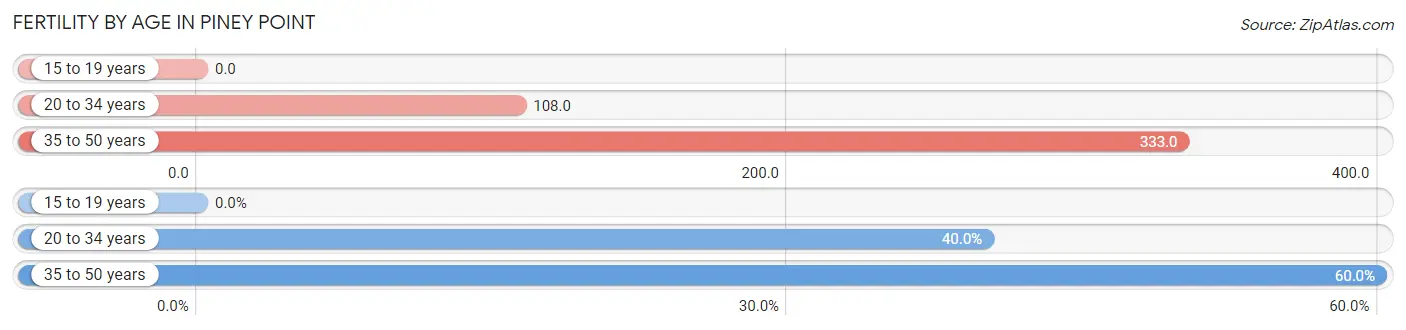
| Age Bracket | Women with Births | Births / 1,000 Women |
| 15 to 19 years | 0 (0.0%) | 0.0 |
| 20 to 34 years | 12 (40.0%) | 108.0 |
| 35 to 50 years | 18 (60.0%) | 333.0 |
| Total | 30 (100.0%) | 182.0 |
Fertility by Age by Marriage Status in Piney Point
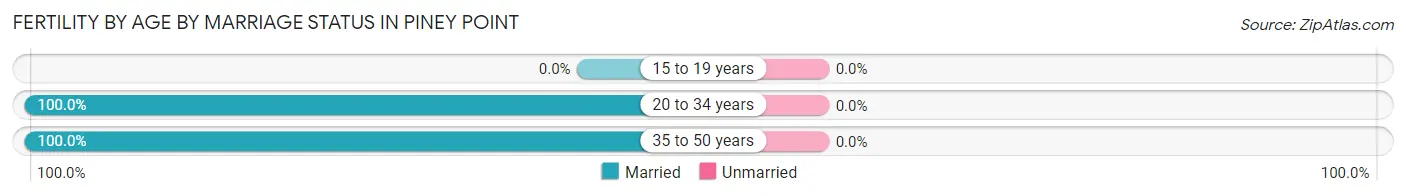
| Age Bracket | Married | Unmarried |
| 15 to 19 years | 0 (0.0%) | 0 (0.0%) |
| 20 to 34 years | 12 (100.0%) | 0 (0.0%) |
| 35 to 50 years | 18 (100.0%) | 0 (0.0%) |
| Total | 30 (100.0%) | 0 (0.0%) |
Fertility by Education in Piney Point
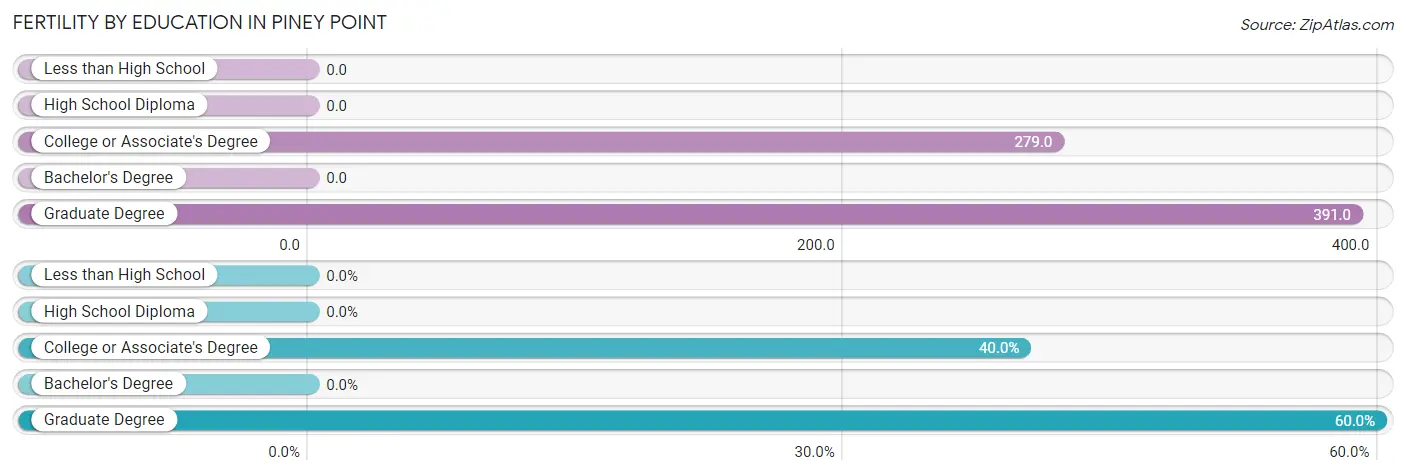
| Educational Attainment | Women with Births | Births / 1,000 Women |
| Less than High School | 0 (0.0%) | 0.0 |
| High School Diploma | 0 (0.0%) | 0.0 |
| College or Associate's Degree | 12 (40.0%) | 279.0 |
| Bachelor's Degree | 0 (0.0%) | 0.0 |
| Graduate Degree | 18 (60.0%) | 391.0 |
| Total | 30 (100.0%) | 182.0 |
Fertility by Education by Marriage Status in Piney Point
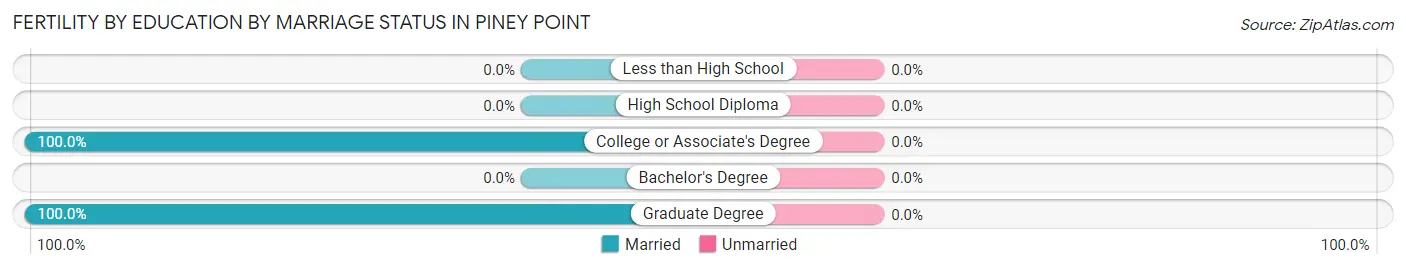
| Educational Attainment | Married | Unmarried |
| Less than High School | 0 (0.0%) | 0 (0.0%) |
| High School Diploma | 0 (0.0%) | 0 (0.0%) |
| College or Associate's Degree | 12 (100.0%) | 0 (0.0%) |
| Bachelor's Degree | 0 (0.0%) | 0 (0.0%) |
| Graduate Degree | 18 (100.0%) | 0 (0.0%) |
| Total | 30 (100.0%) | 0 (0.0%) |
Employment Characteristics in Piney Point
Employment by Class of Employer in Piney Point
Among the 434 employed individuals in Piney Point, private company employees (238 | 54.8%), federal government employees (68 | 15.7%), and not-for-profit organizations (39 | 9.0%) make up the most common classes of employment.
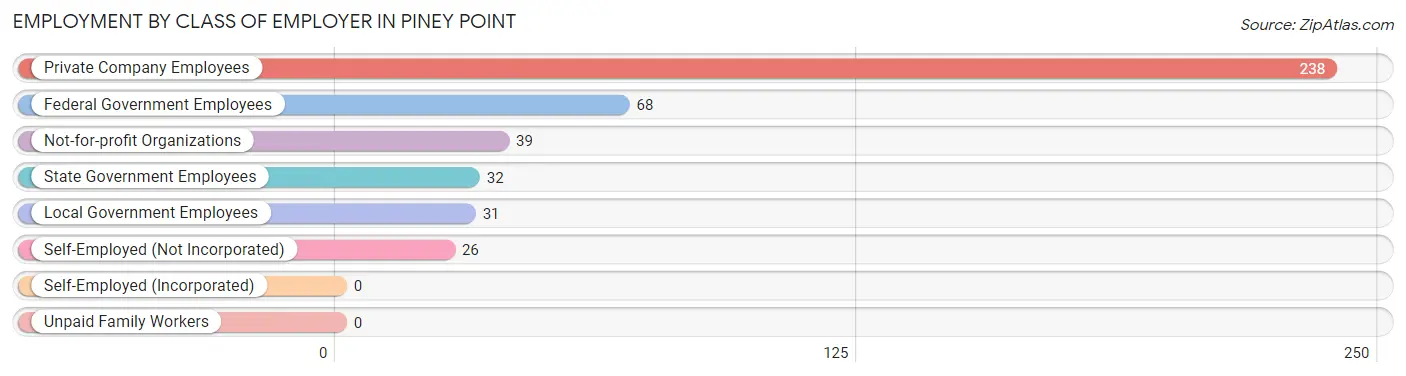
| Employer Class | # Employees | % Employees |
| Private Company Employees | 238 | 54.8% |
| Self-Employed (Incorporated) | 0 | 0.0% |
| Self-Employed (Not Incorporated) | 26 | 6.0% |
| Not-for-profit Organizations | 39 | 9.0% |
| Local Government Employees | 31 | 7.1% |
| State Government Employees | 32 | 7.4% |
| Federal Government Employees | 68 | 15.7% |
| Unpaid Family Workers | 0 | 0.0% |
| Total | 434 | 100.0% |
Employment Status by Age in Piney Point
According to the labor force statistics for Piney Point, out of the total population over 16 years of age (829), 58.6% or 486 individuals are in the labor force, with 11.1% or 54 of them unemployed. The age group with the highest labor force participation rate is 16 to 19 years, with 100.0% or 8 individuals in the labor force. Within the labor force, the 35 to 44 years age range has the highest percentage of unemployed individuals, with 40.7% or 46 of them being unemployed.
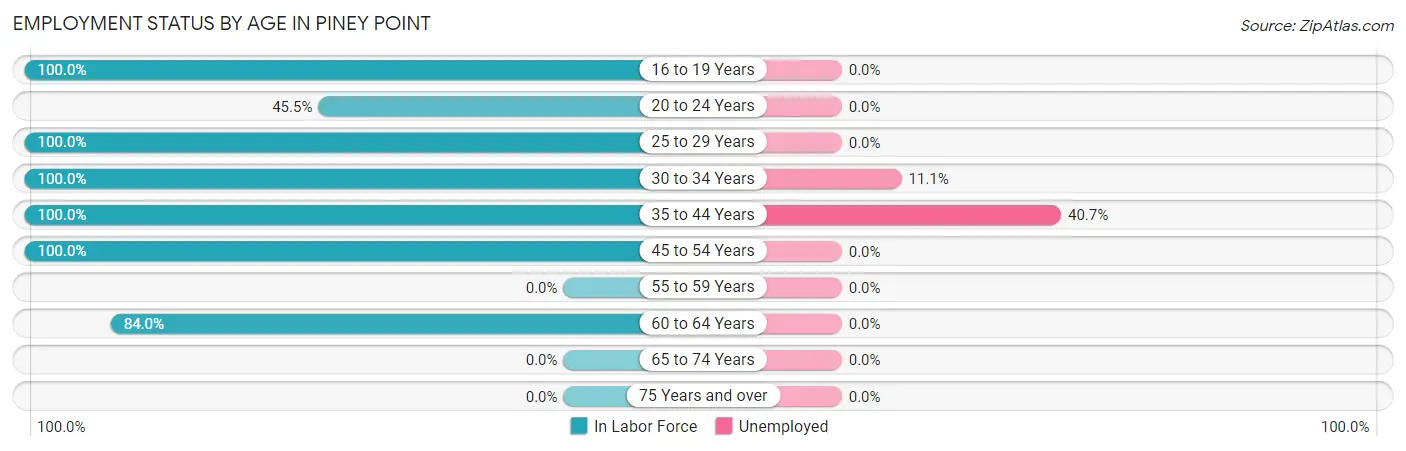
| Age Bracket | In Labor Force | Unemployed |
| 16 to 19 Years | 8 (100.0%) | 0 (0.0%) |
| 20 to 24 Years | 5 (45.5%) | 0 (0.0%) |
| 25 to 29 Years | 114 (100.0%) | 0 (0.0%) |
| 30 to 34 Years | 54 (100.0%) | 6 (11.1%) |
| 35 to 44 Years | 113 (100.0%) | 46 (40.7%) |
| 45 to 54 Years | 113 (100.0%) | 0 (0.0%) |
| 55 to 59 Years | 0 (0.0%) | 0 (0.0%) |
| 60 to 64 Years | 79 (84.0%) | 0 (0.0%) |
| 65 to 74 Years | 0 (0.0%) | 0 (0.0%) |
| 75 Years and over | 0 (0.0%) | 0 (0.0%) |
| Total | 486 (58.6%) | 54 (11.1%) |
Employment Status by Educational Attainment in Piney Point
According to labor force statistics for Piney Point, 96.9% of individuals (473) out of the total population between 25 and 64 years of age (488) are in the labor force, with 11.5% or 54 of them being unemployed. The group with the highest labor force participation rate are those with the educational attainment of less than high school, with 100.0% or 14 individuals in the labor force. Within the labor force, individuals with less than high school education have the highest percentage of unemployment, with 100.0% or 14 of them being unemployed.
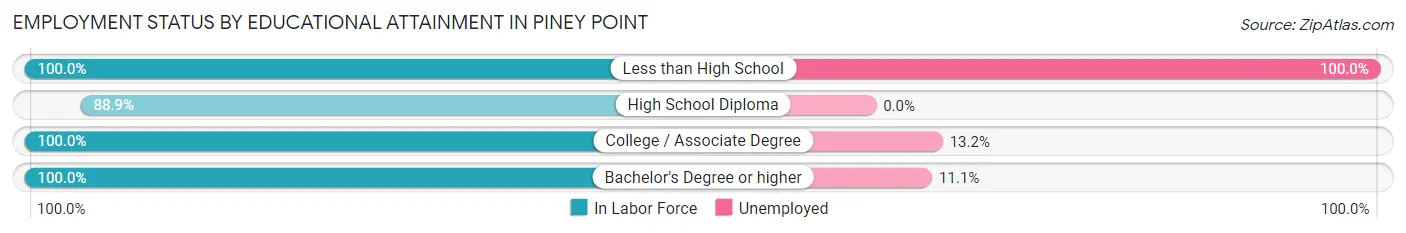
| Educational Attainment | In Labor Force | Unemployed |
| Less than High School | 14 (100.0%) | 14 (100.0%) |
| High School Diploma | 120 (88.9%) | 0 (0.0%) |
| College / Associate Degree | 140 (100.0%) | 18 (13.2%) |
| Bachelor's Degree or higher | 199 (100.0%) | 22 (11.1%) |
| Total | 473 (96.9%) | 56 (11.5%) |
Employment Occupations by Sex in Piney Point
Management, Business, Science and Arts Occupations
The most common Management, Business, Science and Arts occupations in Piney Point are Community & Social Service (87 | 21.0%), Management (84 | 20.2%), Education Instruction & Library (75 | 18.1%), Business & Financial (23 | 5.5%), and Computers, Engineering & Science (18 | 4.3%).
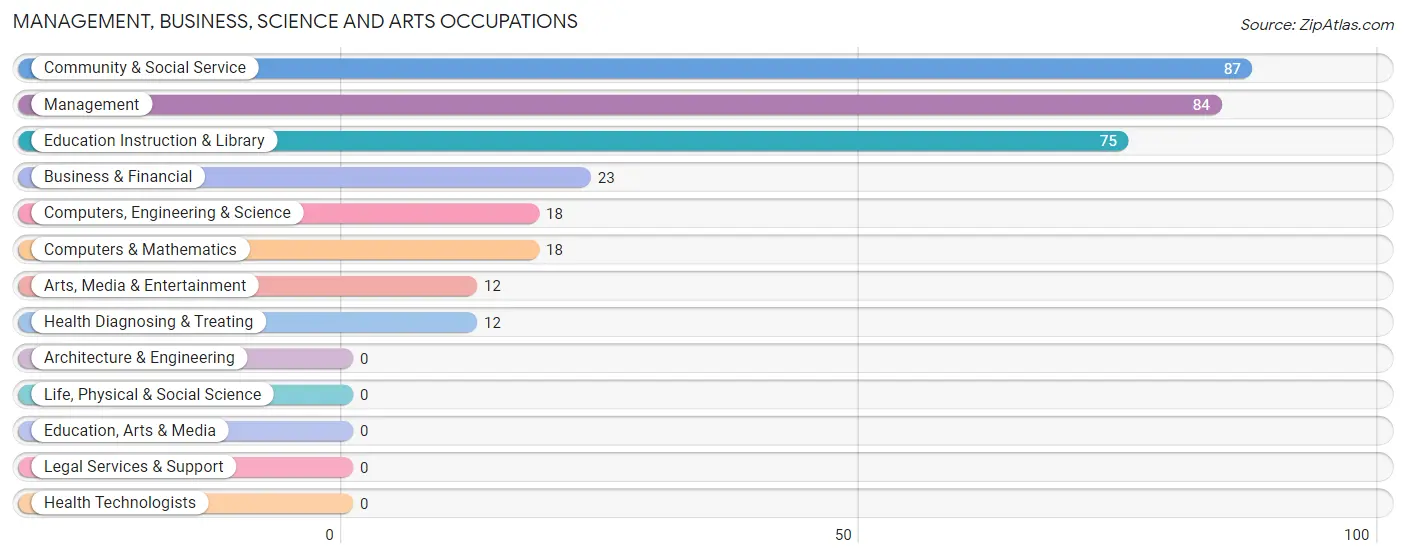
Management, Business, Science and Arts Occupations by Sex
Within the Management, Business, Science and Arts occupations in Piney Point, the most male-oriented occupations are Computers, Engineering & Science (100.0%), Computers & Mathematics (100.0%), and Arts, Media & Entertainment (100.0%), while the most female-oriented occupations are Health Diagnosing & Treating (100.0%), Education Instruction & Library (78.7%), and Business & Financial (78.3%).
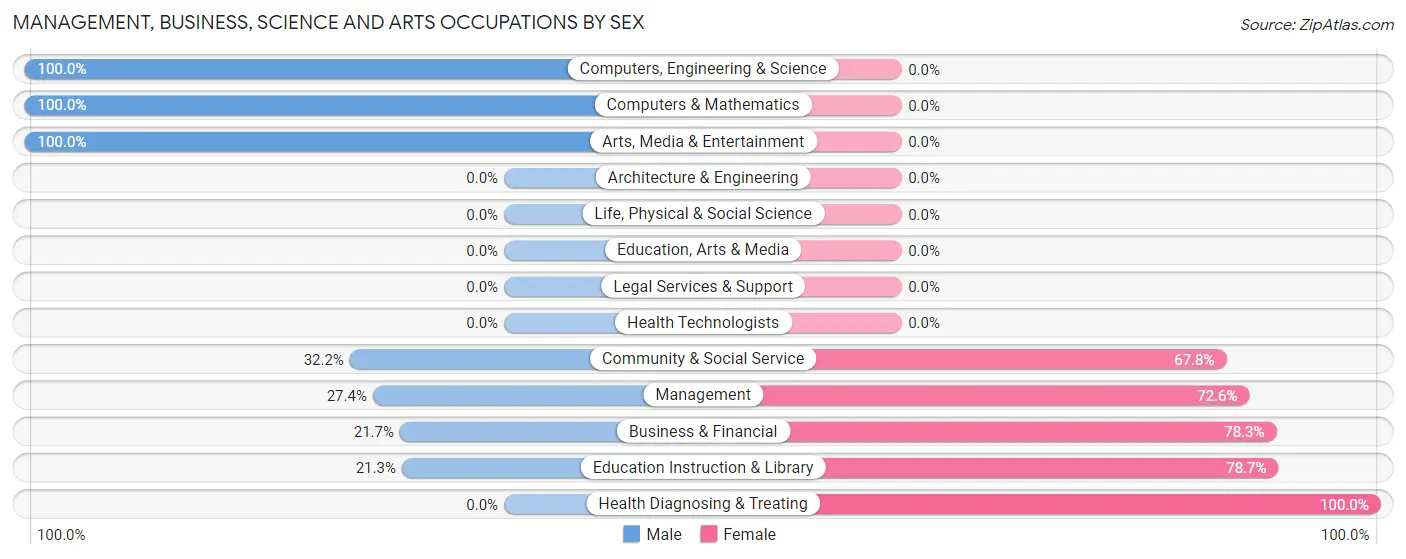
| Occupation | Male | Female |
| Management | 23 (27.4%) | 61 (72.6%) |
| Business & Financial | 5 (21.7%) | 18 (78.3%) |
| Computers, Engineering & Science | 18 (100.0%) | 0 (0.0%) |
| Computers & Mathematics | 18 (100.0%) | 0 (0.0%) |
| Architecture & Engineering | 0 (0.0%) | 0 (0.0%) |
| Life, Physical & Social Science | 0 (0.0%) | 0 (0.0%) |
| Community & Social Service | 28 (32.2%) | 59 (67.8%) |
| Education, Arts & Media | 0 (0.0%) | 0 (0.0%) |
| Legal Services & Support | 0 (0.0%) | 0 (0.0%) |
| Education Instruction & Library | 16 (21.3%) | 59 (78.7%) |
| Arts, Media & Entertainment | 12 (100.0%) | 0 (0.0%) |
| Health Diagnosing & Treating | 0 (0.0%) | 12 (100.0%) |
| Health Technologists | 0 (0.0%) | 0 (0.0%) |
| Total (Category) | 74 (33.0%) | 150 (67.0%) |
| Total (Overall) | 174 (41.9%) | 241 (58.1%) |
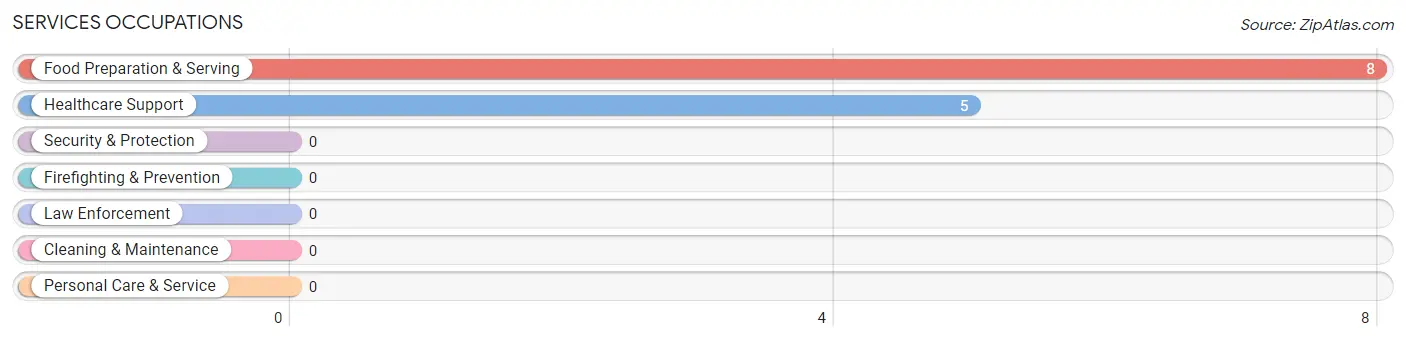
Services Occupations
The most common Services occupations in Piney Point are Food Preparation & Serving (8 | 1.9%), and Healthcare Support (5 | 1.2%).
Services Occupations by Sex
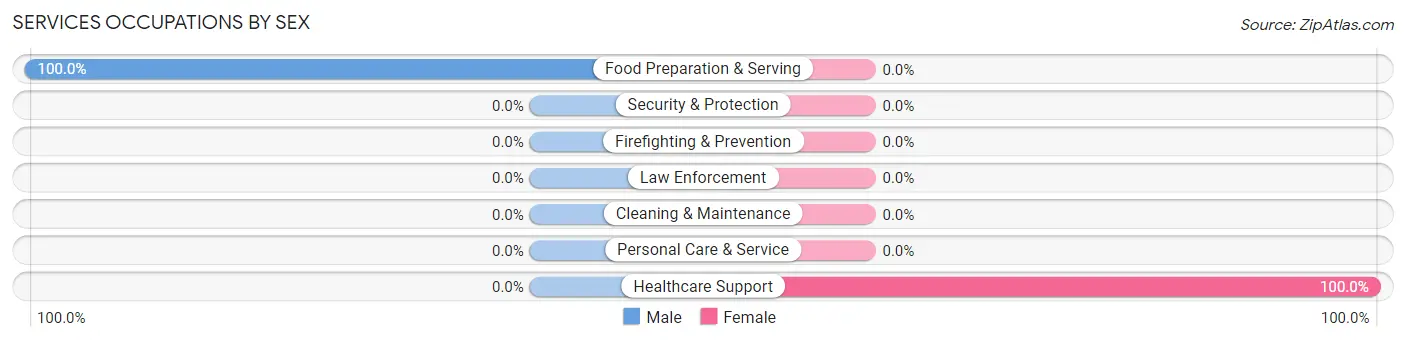
| Occupation | Male | Female |
| Healthcare Support | 0 (0.0%) | 5 (100.0%) |
| Security & Protection | 0 (0.0%) | 0 (0.0%) |
| Firefighting & Prevention | 0 (0.0%) | 0 (0.0%) |
| Law Enforcement | 0 (0.0%) | 0 (0.0%) |
| Food Preparation & Serving | 8 (100.0%) | 0 (0.0%) |
| Cleaning & Maintenance | 0 (0.0%) | 0 (0.0%) |
| Personal Care & Service | 0 (0.0%) | 0 (0.0%) |
| Total (Category) | 8 (61.5%) | 5 (38.5%) |
| Total (Overall) | 174 (41.9%) | 241 (58.1%) |
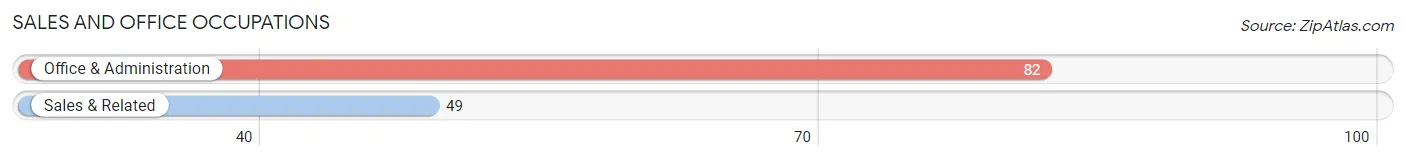
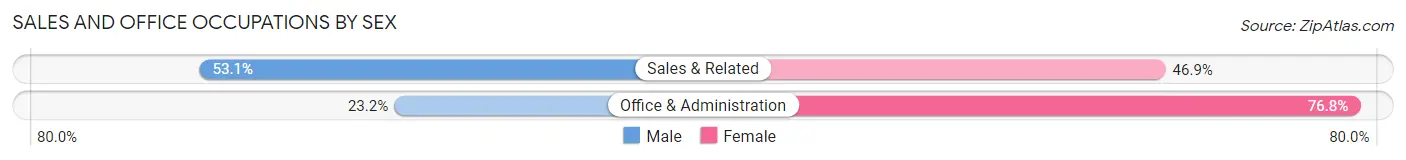
Sales and Office Occupations
The most common Sales and Office occupations in Piney Point are Office & Administration (82 | 19.8%), and Sales & Related (49 | 11.8%).
Sales and Office Occupations by Sex
| Occupation | Male | Female |
| Sales & Related | 26 (53.1%) | 23 (46.9%) |
| Office & Administration | 19 (23.2%) | 63 (76.8%) |
| Total (Category) | 45 (34.4%) | 86 (65.6%) |
| Total (Overall) | 174 (41.9%) | 241 (58.1%) |
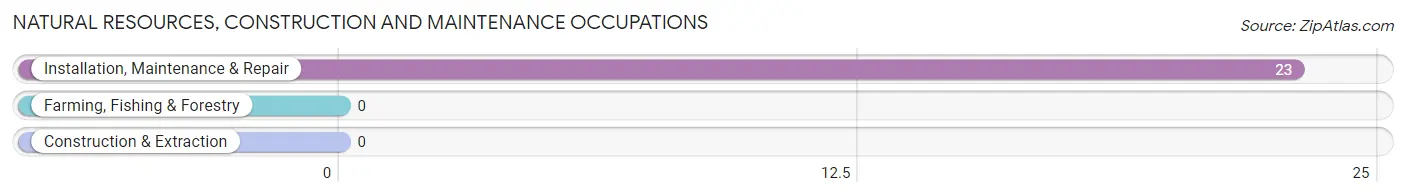
Natural Resources, Construction and Maintenance Occupations
The most common Natural Resources, Construction and Maintenance occupations in Piney Point are , and Installation, Maintenance & Repair (23 | 5.5%).
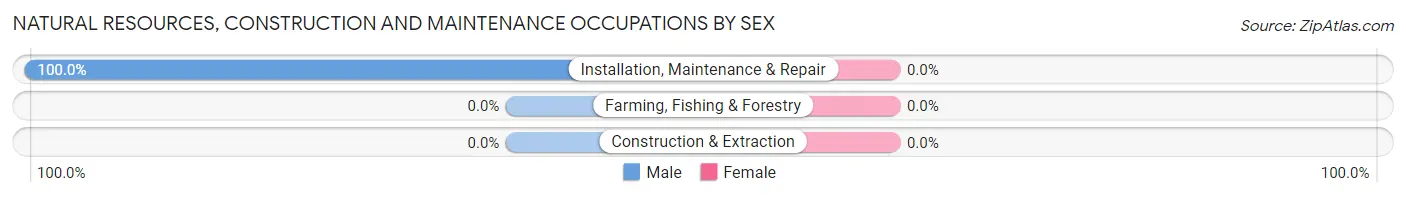
Natural Resources, Construction and Maintenance Occupations by Sex
| Occupation | Male | Female |
| Farming, Fishing & Forestry | 0 (0.0%) | 0 (0.0%) |
| Construction & Extraction | 0 (0.0%) | 0 (0.0%) |
| Installation, Maintenance & Repair | 23 (100.0%) | 0 (0.0%) |
| Total (Category) | 23 (100.0%) | 0 (0.0%) |
| Total (Overall) | 174 (41.9%) | 241 (58.1%) |
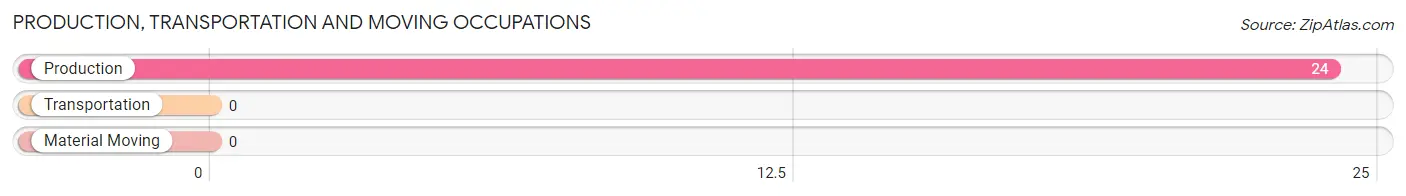
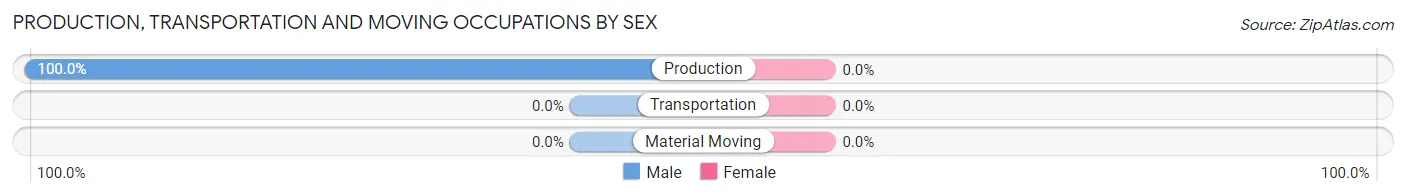
Production, Transportation and Moving Occupations
The most common Production, Transportation and Moving occupations in Piney Point are , and Production (24 | 5.8%).
Production, Transportation and Moving Occupations by Sex
| Occupation | Male | Female |
| Production | 24 (100.0%) | 0 (0.0%) |
| Transportation | 0 (0.0%) | 0 (0.0%) |
| Material Moving | 0 (0.0%) | 0 (0.0%) |
| Total (Category) | 24 (100.0%) | 0 (0.0%) |
| Total (Overall) | 174 (41.9%) | 241 (58.1%) |
Employment Industries by Sex in Piney Point
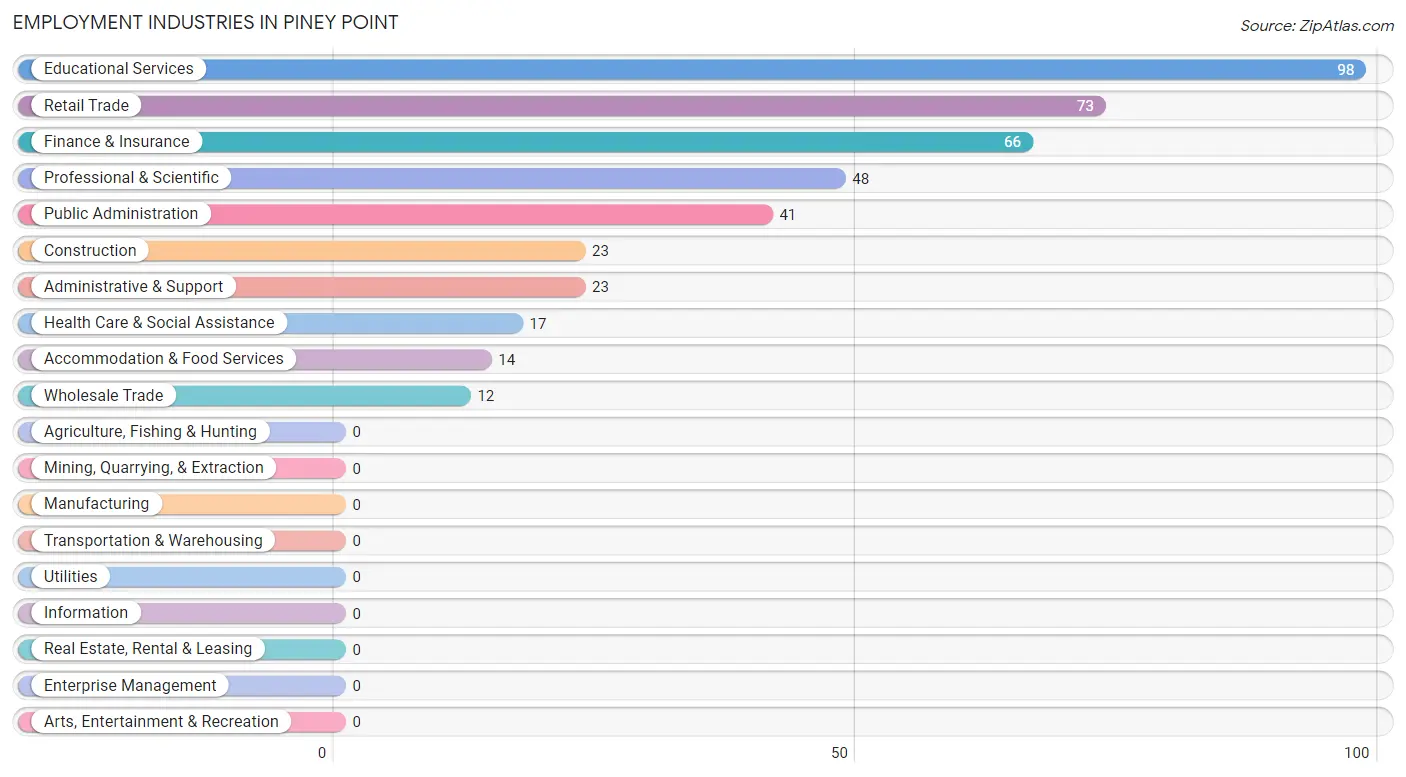
Employment Industries in Piney Point
The major employment industries in Piney Point include Educational Services (98 | 23.6%), Retail Trade (73 | 17.6%), Finance & Insurance (66 | 15.9%), Professional & Scientific (48 | 11.6%), and Public Administration (41 | 9.9%).
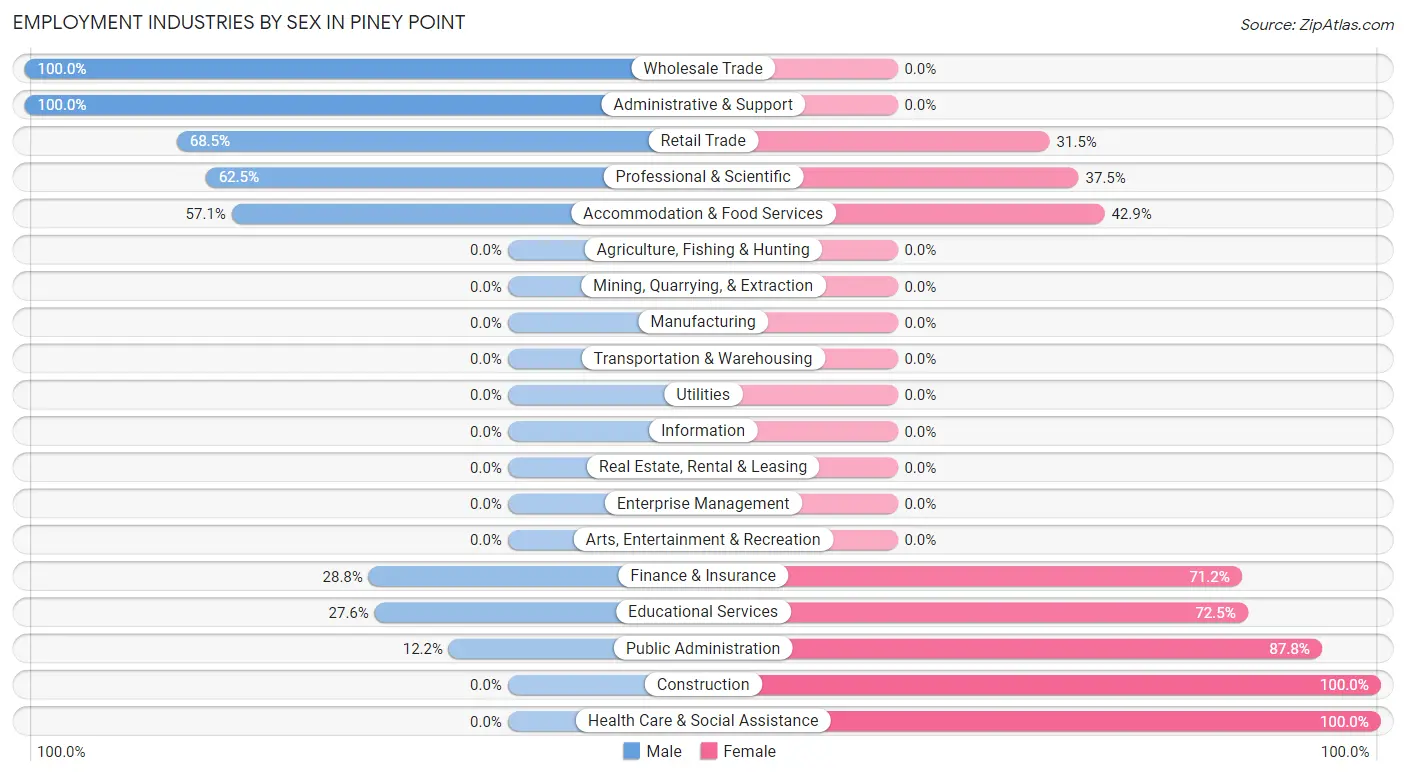
Employment Industries by Sex in Piney Point
The Piney Point industries that see more men than women are Wholesale Trade (100.0%), Administrative & Support (100.0%), and Retail Trade (68.5%), whereas the industries that tend to have a higher number of women are Construction (100.0%), Health Care & Social Assistance (100.0%), and Public Administration (87.8%).
| Industry | Male | Female |
| Agriculture, Fishing & Hunting | 0 (0.0%) | 0 (0.0%) |
| Mining, Quarrying, & Extraction | 0 (0.0%) | 0 (0.0%) |
| Construction | 0 (0.0%) | 23 (100.0%) |
| Manufacturing | 0 (0.0%) | 0 (0.0%) |
| Wholesale Trade | 12 (100.0%) | 0 (0.0%) |
| Retail Trade | 50 (68.5%) | 23 (31.5%) |
| Transportation & Warehousing | 0 (0.0%) | 0 (0.0%) |
| Utilities | 0 (0.0%) | 0 (0.0%) |
| Information | 0 (0.0%) | 0 (0.0%) |
| Finance & Insurance | 19 (28.8%) | 47 (71.2%) |
| Real Estate, Rental & Leasing | 0 (0.0%) | 0 (0.0%) |
| Professional & Scientific | 30 (62.5%) | 18 (37.5%) |
| Enterprise Management | 0 (0.0%) | 0 (0.0%) |
| Administrative & Support | 23 (100.0%) | 0 (0.0%) |
| Educational Services | 27 (27.6%) | 71 (72.5%) |
| Health Care & Social Assistance | 0 (0.0%) | 17 (100.0%) |
| Arts, Entertainment & Recreation | 0 (0.0%) | 0 (0.0%) |
| Accommodation & Food Services | 8 (57.1%) | 6 (42.9%) |
| Public Administration | 5 (12.2%) | 36 (87.8%) |
| Total | 174 (41.9%) | 241 (58.1%) |
Education in Piney Point
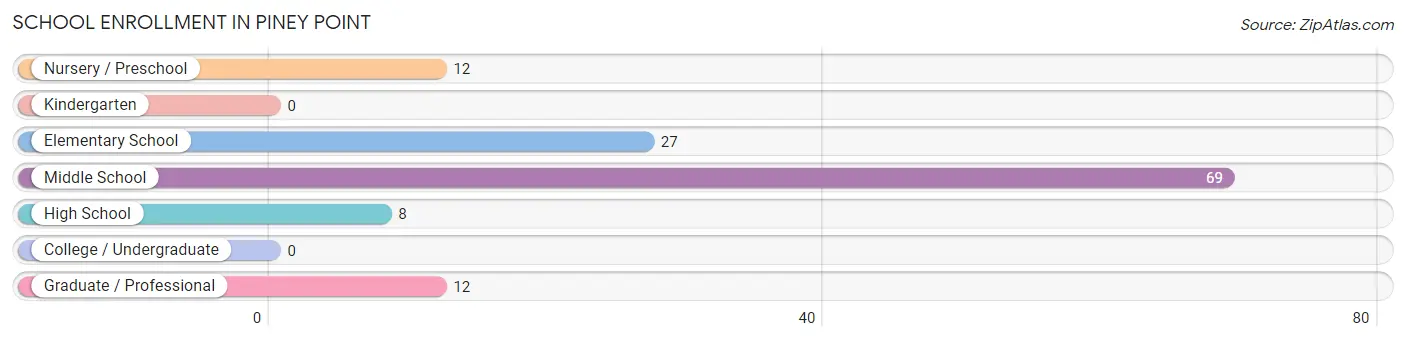
School Enrollment in Piney Point
The most common levels of schooling among the 128 students in Piney Point are middle school (69 | 53.9%), elementary school (27 | 21.1%), and nursery / preschool (12 | 9.4%).
| School Level | # Students | % Students |
| Nursery / Preschool | 12 | 9.4% |
| Kindergarten | 0 | 0.0% |
| Elementary School | 27 | 21.1% |
| Middle School | 69 | 53.9% |
| High School | 8 | 6.2% |
| College / Undergraduate | 0 | 0.0% |
| Graduate / Professional | 12 | 9.4% |
| Total | 128 | 100.0% |
School Enrollment by Age by Funding Source in Piney Point
Out of a total of 128 students who are enrolled in schools in Piney Point, 18 (14.1%) attend a private institution, while the remaining 110 (85.9%) are enrolled in public schools. The age group of 5 to 9 year old has the highest likelihood of being enrolled in private schools, with 12 (30.8% in the age bracket) enrolled. Conversely, the age group of 15 to 17 year olds has the lowest likelihood of being enrolled in a private school, with 8 (100.0% in the age bracket) attending a public institution.
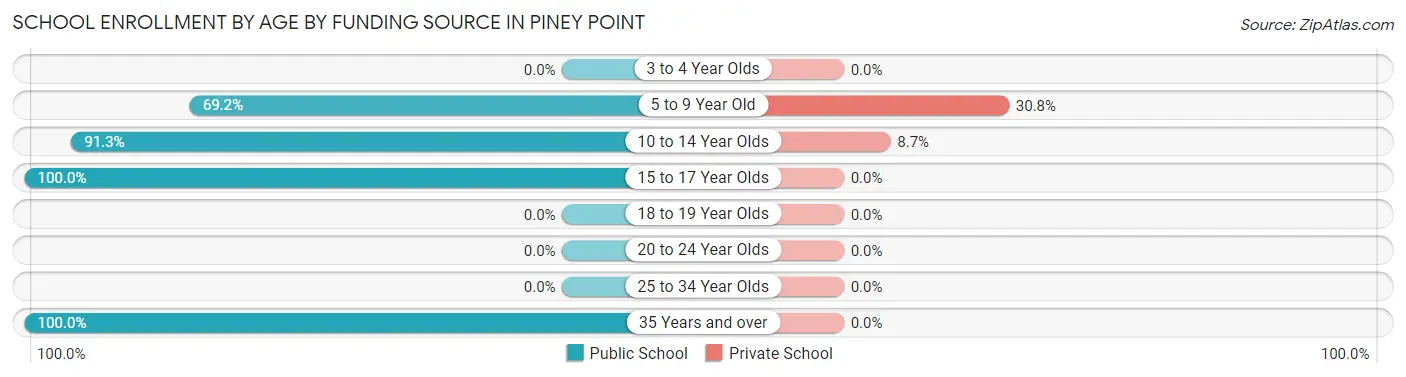
| Age Bracket | Public School | Private School |
| 3 to 4 Year Olds | 0 (0.0%) | 0 (0.0%) |
| 5 to 9 Year Old | 27 (69.2%) | 12 (30.8%) |
| 10 to 14 Year Olds | 63 (91.3%) | 6 (8.7%) |
| 15 to 17 Year Olds | 8 (100.0%) | 0 (0.0%) |
| 18 to 19 Year Olds | 0 (0.0%) | 0 (0.0%) |
| 20 to 24 Year Olds | 0 (0.0%) | 0 (0.0%) |
| 25 to 34 Year Olds | 0 (0.0%) | 0 (0.0%) |
| 35 Years and over | 12 (100.0%) | 0 (0.0%) |
| Total | 110 (85.9%) | 18 (14.1%) |
Educational Attainment by Field of Study in Piney Point
Education (69 | 27.6%), engineering (36 | 14.4%), business (36 | 14.4%), bio, nature & agricultural (27 | 10.8%), and visual & performing arts (16 | 6.4%) are the most common fields of study among 250 individuals in Piney Point who have obtained a bachelor's degree or higher.
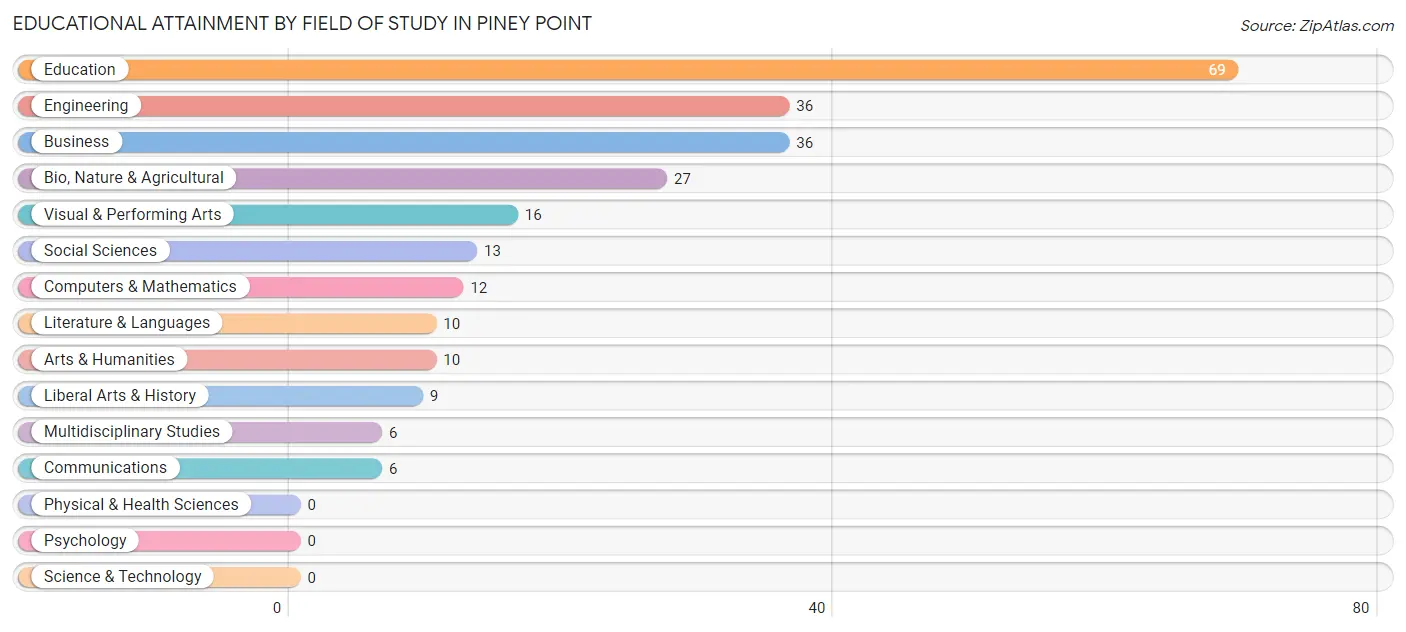
| Field of Study | # Graduates | % Graduates |
| Computers & Mathematics | 12 | 4.8% |
| Bio, Nature & Agricultural | 27 | 10.8% |
| Physical & Health Sciences | 0 | 0.0% |
| Psychology | 0 | 0.0% |
| Social Sciences | 13 | 5.2% |
| Engineering | 36 | 14.4% |
| Multidisciplinary Studies | 6 | 2.4% |
| Science & Technology | 0 | 0.0% |
| Business | 36 | 14.4% |
| Education | 69 | 27.6% |
| Literature & Languages | 10 | 4.0% |
| Liberal Arts & History | 9 | 3.6% |
| Visual & Performing Arts | 16 | 6.4% |
| Communications | 6 | 2.4% |
| Arts & Humanities | 10 | 4.0% |
| Total | 250 | 100.0% |
Transportation & Commute in Piney Point
Vehicle Availability by Sex in Piney Point
The most prevalent vehicle ownership categories in Piney Point are males with 2 vehicles (131, accounting for 71.6%) and females with 2 vehicles (148, making up 52.2%).
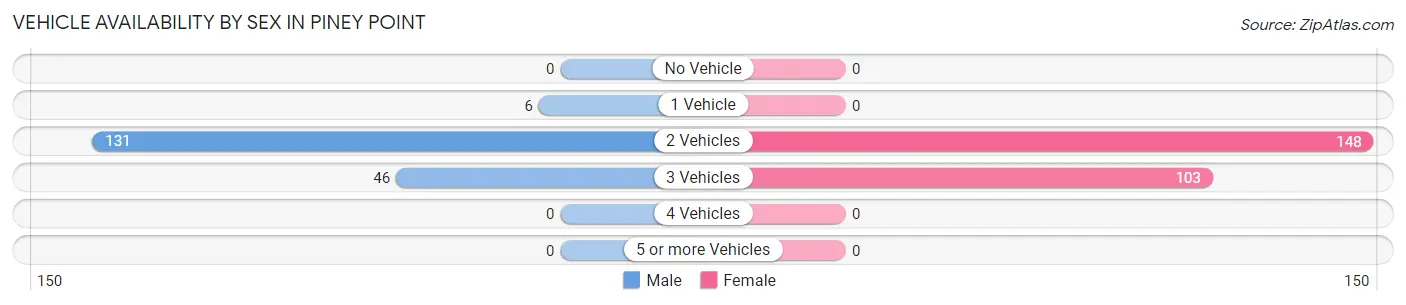
| Vehicles Available | Male | Female |
| No Vehicle | 0 (0.0%) | 0 (0.0%) |
| 1 Vehicle | 6 (3.3%) | 0 (0.0%) |
| 2 Vehicles | 131 (71.6%) | 148 (59.0%) |
| 3 Vehicles | 46 (25.1%) | 103 (41.0%) |
| 4 Vehicles | 0 (0.0%) | 0 (0.0%) |
| 5 or more Vehicles | 0 (0.0%) | 0 (0.0%) |
| Total | 183 (100.0%) | 251 (100.0%) |
Commute Time in Piney Point
The most frequently occuring commute durations in Piney Point are 30 to 34 minutes (151 commuters, 40.2%), 20 to 24 minutes (55 commuters, 14.6%), and 25 to 29 minutes (53 commuters, 14.1%).
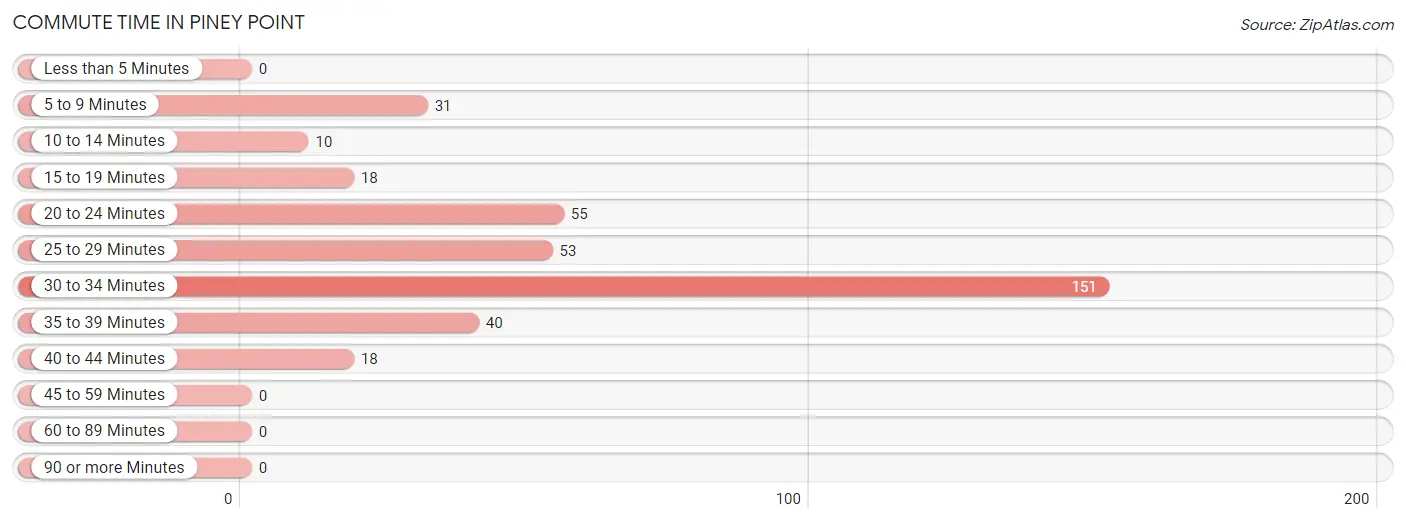
| Commute Time | # Commuters | % Commuters |
| Less than 5 Minutes | 0 | 0.0% |
| 5 to 9 Minutes | 31 | 8.2% |
| 10 to 14 Minutes | 10 | 2.7% |
| 15 to 19 Minutes | 18 | 4.8% |
| 20 to 24 Minutes | 55 | 14.6% |
| 25 to 29 Minutes | 53 | 14.1% |
| 30 to 34 Minutes | 151 | 40.2% |
| 35 to 39 Minutes | 40 | 10.6% |
| 40 to 44 Minutes | 18 | 4.8% |
| 45 to 59 Minutes | 0 | 0.0% |
| 60 to 89 Minutes | 0 | 0.0% |
| 90 or more Minutes | 0 | 0.0% |
Commute Time by Sex in Piney Point
The most common commute times in Piney Point are 30 to 34 minutes (52 commuters, 34.4%) for males and 30 to 34 minutes (99 commuters, 44.0%) for females.
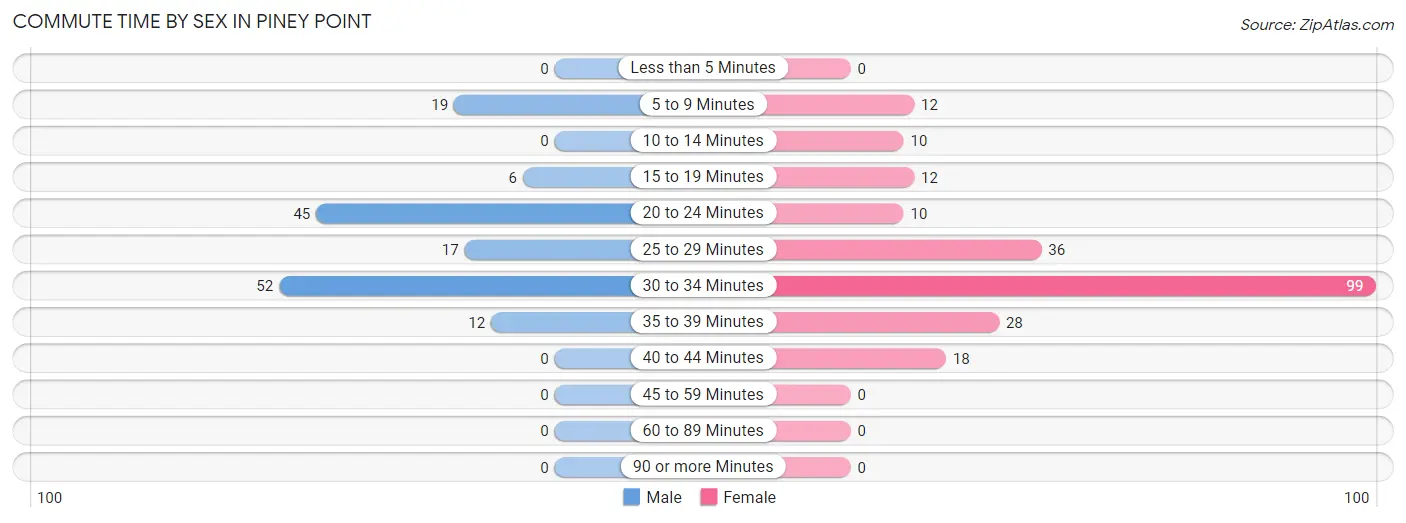
| Commute Time | Male | Female |
| Less than 5 Minutes | 0 (0.0%) | 0 (0.0%) |
| 5 to 9 Minutes | 19 (12.6%) | 12 (5.3%) |
| 10 to 14 Minutes | 0 (0.0%) | 10 (4.4%) |
| 15 to 19 Minutes | 6 (4.0%) | 12 (5.3%) |
| 20 to 24 Minutes | 45 (29.8%) | 10 (4.4%) |
| 25 to 29 Minutes | 17 (11.3%) | 36 (16.0%) |
| 30 to 34 Minutes | 52 (34.4%) | 99 (44.0%) |
| 35 to 39 Minutes | 12 (8.0%) | 28 (12.4%) |
| 40 to 44 Minutes | 0 (0.0%) | 18 (8.0%) |
| 45 to 59 Minutes | 0 (0.0%) | 0 (0.0%) |
| 60 to 89 Minutes | 0 (0.0%) | 0 (0.0%) |
| 90 or more Minutes | 0 (0.0%) | 0 (0.0%) |
Time of Departure to Work by Sex in Piney Point
The most frequent times of departure to work in Piney Point are 7:00 AM to 7:29 AM (38, 25.2%) for males and 7:30 AM to 7:59 AM (86, 38.2%) for females.
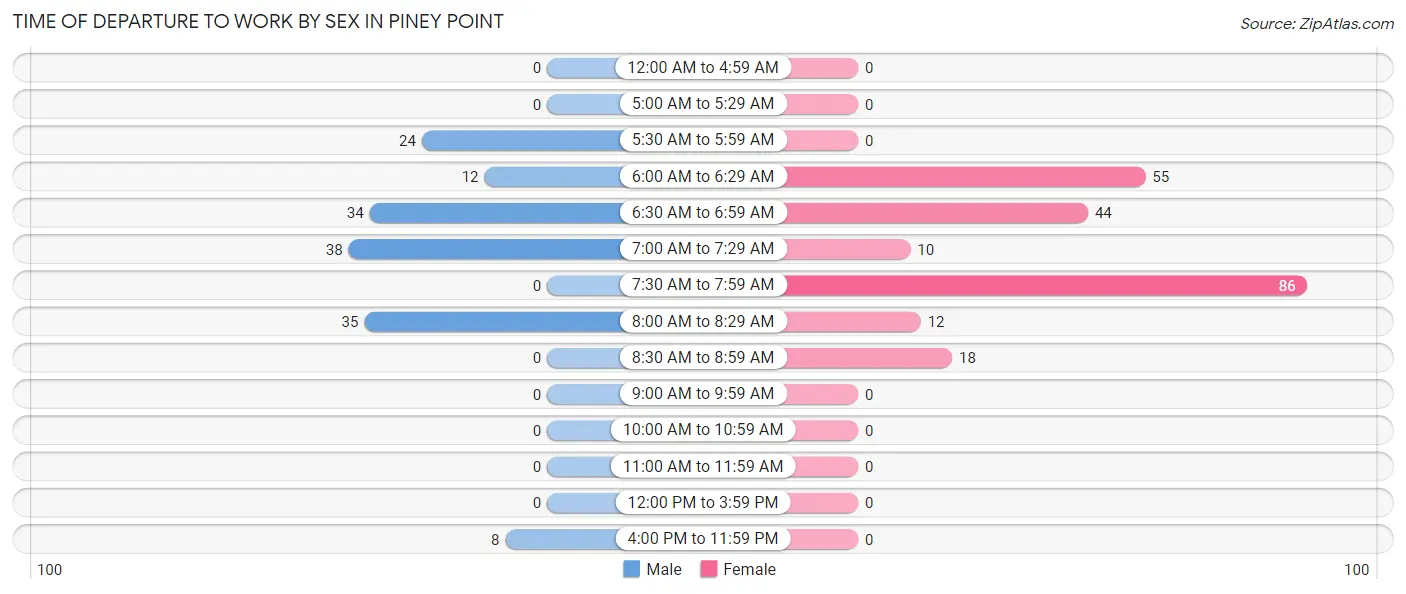
| Time of Departure | Male | Female |
| 12:00 AM to 4:59 AM | 0 (0.0%) | 0 (0.0%) |
| 5:00 AM to 5:29 AM | 0 (0.0%) | 0 (0.0%) |
| 5:30 AM to 5:59 AM | 24 (15.9%) | 0 (0.0%) |
| 6:00 AM to 6:29 AM | 12 (8.0%) | 55 (24.4%) |
| 6:30 AM to 6:59 AM | 34 (22.5%) | 44 (19.6%) |
| 7:00 AM to 7:29 AM | 38 (25.2%) | 10 (4.4%) |
| 7:30 AM to 7:59 AM | 0 (0.0%) | 86 (38.2%) |
| 8:00 AM to 8:29 AM | 35 (23.2%) | 12 (5.3%) |
| 8:30 AM to 8:59 AM | 0 (0.0%) | 18 (8.0%) |
| 9:00 AM to 9:59 AM | 0 (0.0%) | 0 (0.0%) |
| 10:00 AM to 10:59 AM | 0 (0.0%) | 0 (0.0%) |
| 11:00 AM to 11:59 AM | 0 (0.0%) | 0 (0.0%) |
| 12:00 PM to 3:59 PM | 0 (0.0%) | 0 (0.0%) |
| 4:00 PM to 11:59 PM | 8 (5.3%) | 0 (0.0%) |
| Total | 151 (100.0%) | 225 (100.0%) |
Housing Occupancy in Piney Point
Occupancy by Ownership in Piney Point
Of the total 396 dwellings in Piney Point, owner-occupied units account for 282 (71.2%), while renter-occupied units make up 114 (28.8%).
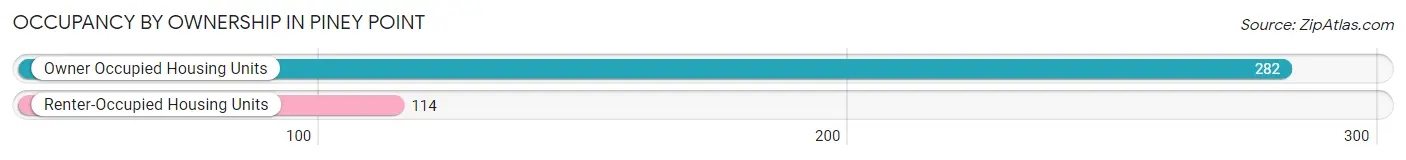
| Occupancy | # Housing Units | % Housing Units |
| Owner Occupied Housing Units | 282 | 71.2% |
| Renter-Occupied Housing Units | 114 | 28.8% |
| Total Occupied Housing Units | 396 | 100.0% |
Occupancy by Household Size in Piney Point
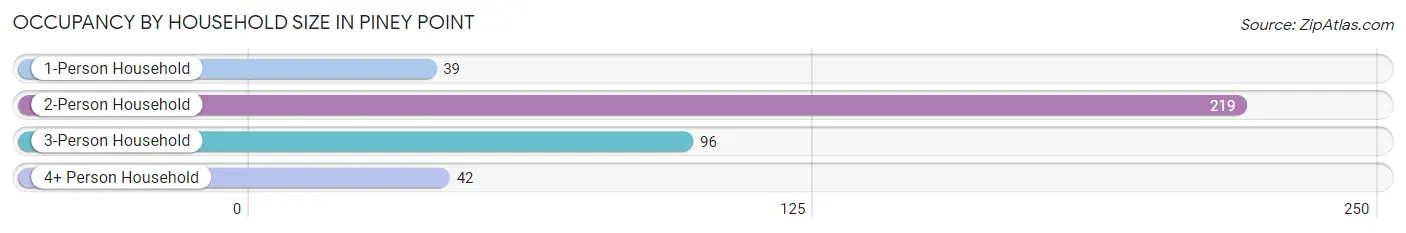
| Household Size | # Housing Units | % Housing Units |
| 1-Person Household | 39 | 9.9% |
| 2-Person Household | 219 | 55.3% |
| 3-Person Household | 96 | 24.2% |
| 4+ Person Household | 42 | 10.6% |
| Total Housing Units | 396 | 100.0% |
Occupancy by Ownership by Household Size in Piney Point
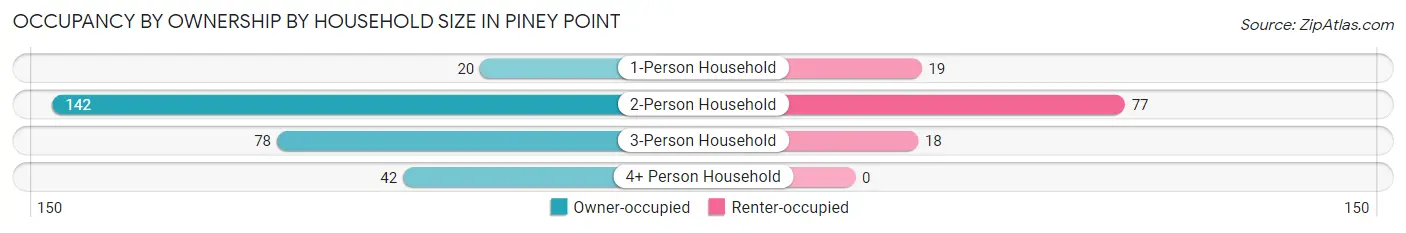
| Household Size | Owner-occupied | Renter-occupied |
| 1-Person Household | 20 (51.3%) | 19 (48.7%) |
| 2-Person Household | 142 (64.8%) | 77 (35.2%) |
| 3-Person Household | 78 (81.2%) | 18 (18.8%) |
| 4+ Person Household | 42 (100.0%) | 0 (0.0%) |
| Total Housing Units | 282 (71.2%) | 114 (28.8%) |
Occupancy by Educational Attainment in Piney Point
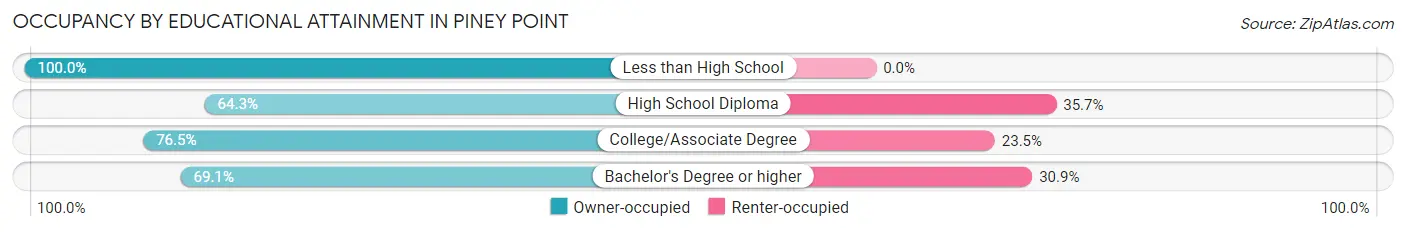
| Household Size | Owner-occupied | Renter-occupied |
| Less than High School | 35 (100.0%) | 0 (0.0%) |
| High School Diploma | 99 (64.3%) | 55 (35.7%) |
| College/Associate Degree | 52 (76.5%) | 16 (23.5%) |
| Bachelor's Degree or higher | 96 (69.1%) | 43 (30.9%) |
Occupancy by Age of Householder in Piney Point
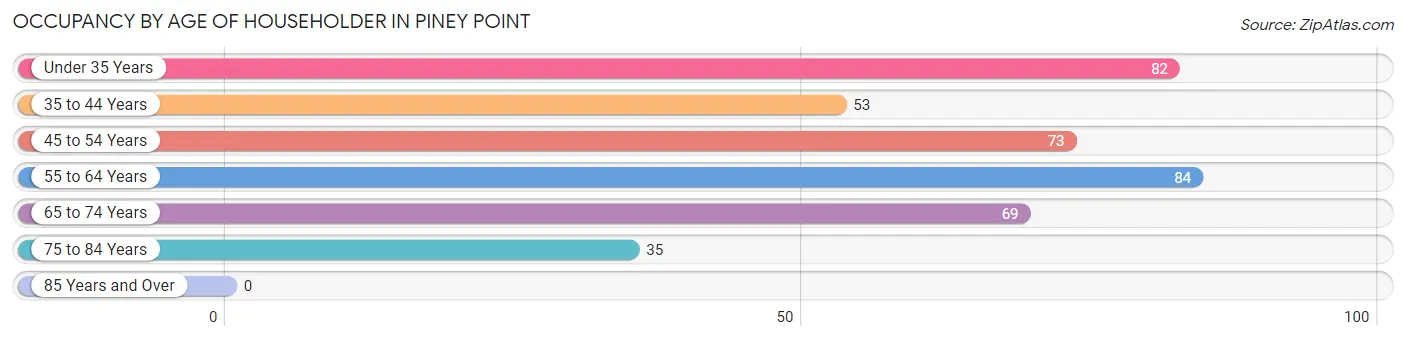
| Age Bracket | # Households | % Households |
| Under 35 Years | 82 | 20.7% |
| 35 to 44 Years | 53 | 13.4% |
| 45 to 54 Years | 73 | 18.4% |
| 55 to 64 Years | 84 | 21.2% |
| 65 to 74 Years | 69 | 17.4% |
| 75 to 84 Years | 35 | 8.8% |
| 85 Years and Over | 0 | 0.0% |
| Total | 396 | 100.0% |
Housing Finances in Piney Point
Median Income by Occupancy in Piney Point
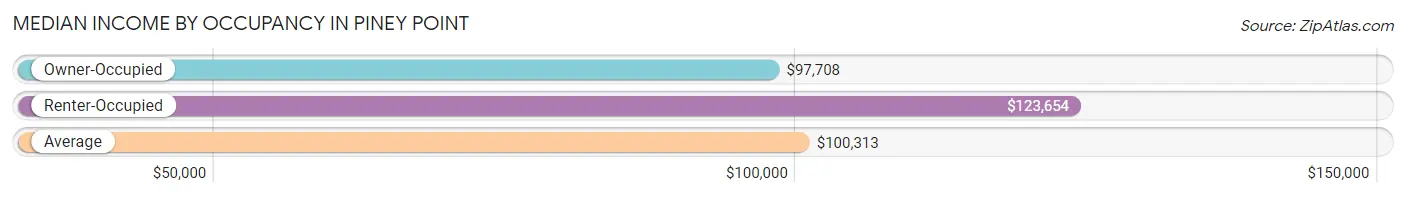
| Occupancy Type | # Households | Median Income |
| Owner-Occupied | 282 (71.2%) | $97,708 |
| Renter-Occupied | 114 (28.8%) | $123,654 |
| Average | 396 (100.0%) | $100,313 |
Occupancy by Householder Income Bracket in Piney Point
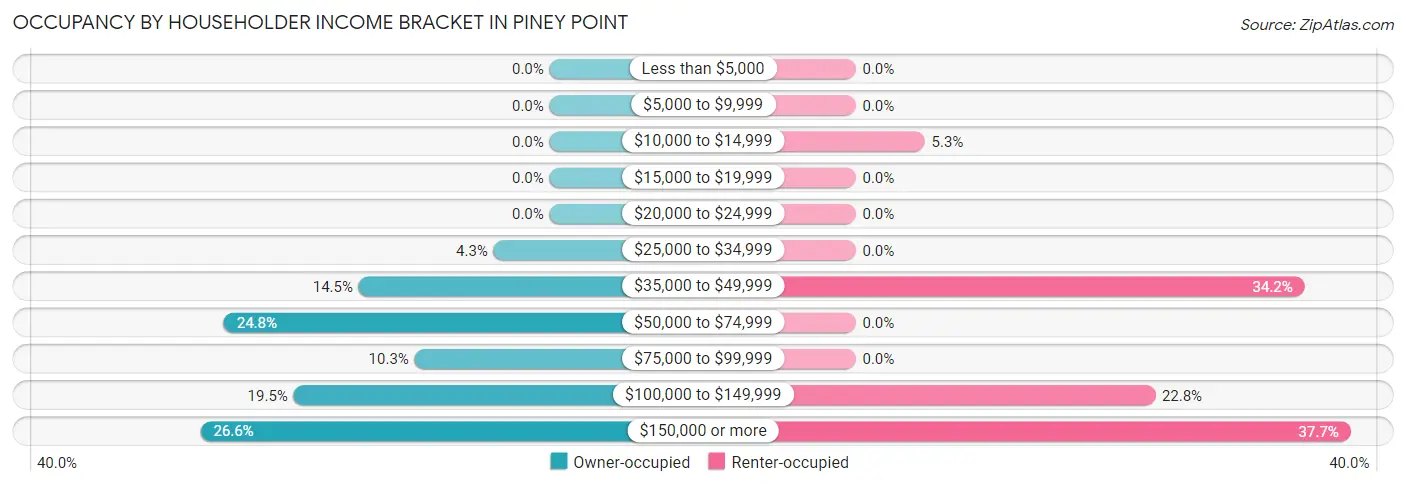
| Income Bracket | Owner-occupied | Renter-occupied |
| Less than $5,000 | 0 (0.0%) | 0 (0.0%) |
| $5,000 to $9,999 | 0 (0.0%) | 0 (0.0%) |
| $10,000 to $14,999 | 0 (0.0%) | 6 (5.3%) |
| $15,000 to $19,999 | 0 (0.0%) | 0 (0.0%) |
| $20,000 to $24,999 | 0 (0.0%) | 0 (0.0%) |
| $25,000 to $34,999 | 12 (4.3%) | 0 (0.0%) |
| $35,000 to $49,999 | 41 (14.5%) | 39 (34.2%) |
| $50,000 to $74,999 | 70 (24.8%) | 0 (0.0%) |
| $75,000 to $99,999 | 29 (10.3%) | 0 (0.0%) |
| $100,000 to $149,999 | 55 (19.5%) | 26 (22.8%) |
| $150,000 or more | 75 (26.6%) | 43 (37.7%) |
| Total | 282 (100.0%) | 114 (100.0%) |
Monthly Housing Cost Tiers in Piney Point
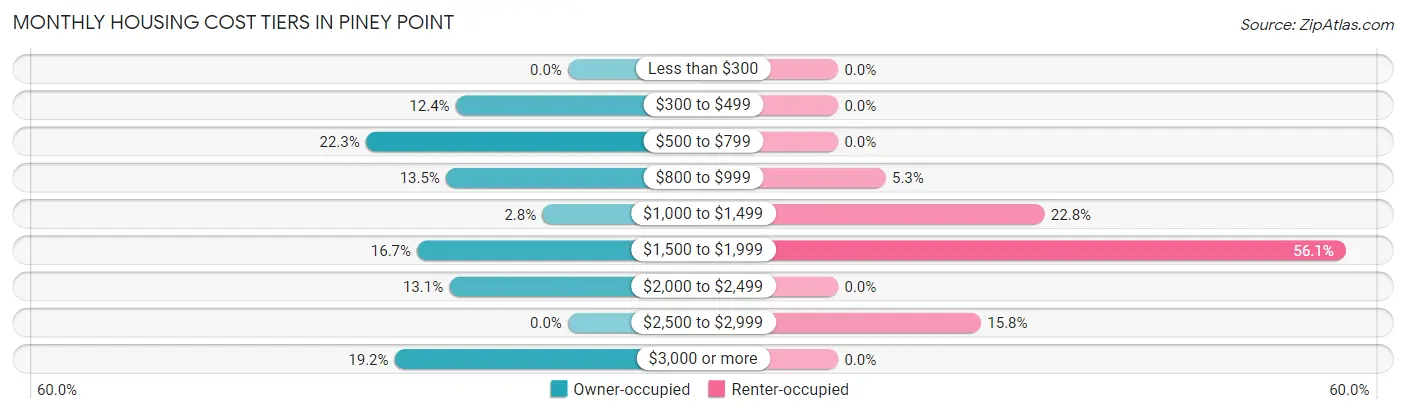
| Monthly Cost | Owner-occupied | Renter-occupied |
| Less than $300 | 0 (0.0%) | 0 (0.0%) |
| $300 to $499 | 35 (12.4%) | 0 (0.0%) |
| $500 to $799 | 63 (22.3%) | 0 (0.0%) |
| $800 to $999 | 38 (13.5%) | 6 (5.3%) |
| $1,000 to $1,499 | 8 (2.8%) | 26 (22.8%) |
| $1,500 to $1,999 | 47 (16.7%) | 64 (56.1%) |
| $2,000 to $2,499 | 37 (13.1%) | 0 (0.0%) |
| $2,500 to $2,999 | 0 (0.0%) | 18 (15.8%) |
| $3,000 or more | 54 (19.2%) | 0 (0.0%) |
| Total | 282 (100.0%) | 114 (100.0%) |
Physical Housing Characteristics in Piney Point
Housing Structures in Piney Point
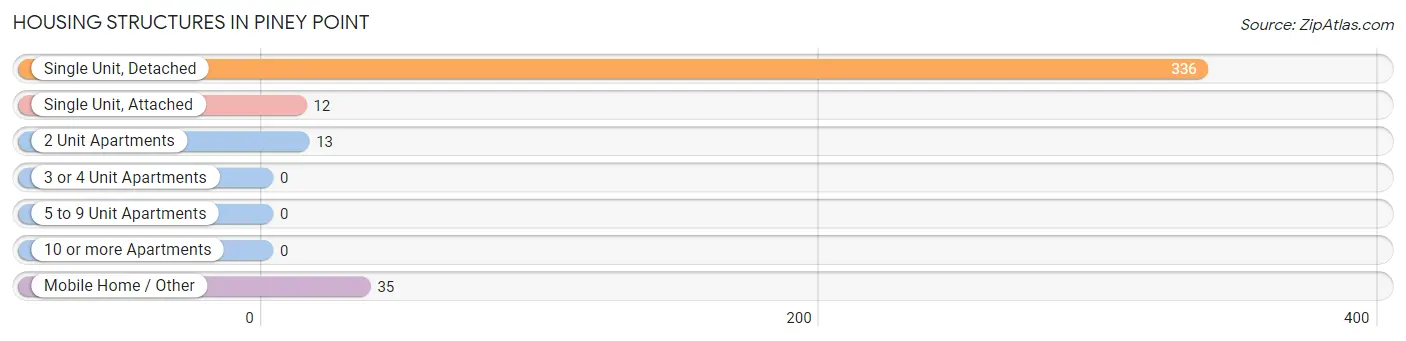
| Structure Type | # Housing Units | % Housing Units |
| Single Unit, Detached | 336 | 84.9% |
| Single Unit, Attached | 12 | 3.0% |
| 2 Unit Apartments | 13 | 3.3% |
| 3 or 4 Unit Apartments | 0 | 0.0% |
| 5 to 9 Unit Apartments | 0 | 0.0% |
| 10 or more Apartments | 0 | 0.0% |
| Mobile Home / Other | 35 | 8.8% |
| Total | 396 | 100.0% |
Housing Structures by Occupancy in Piney Point
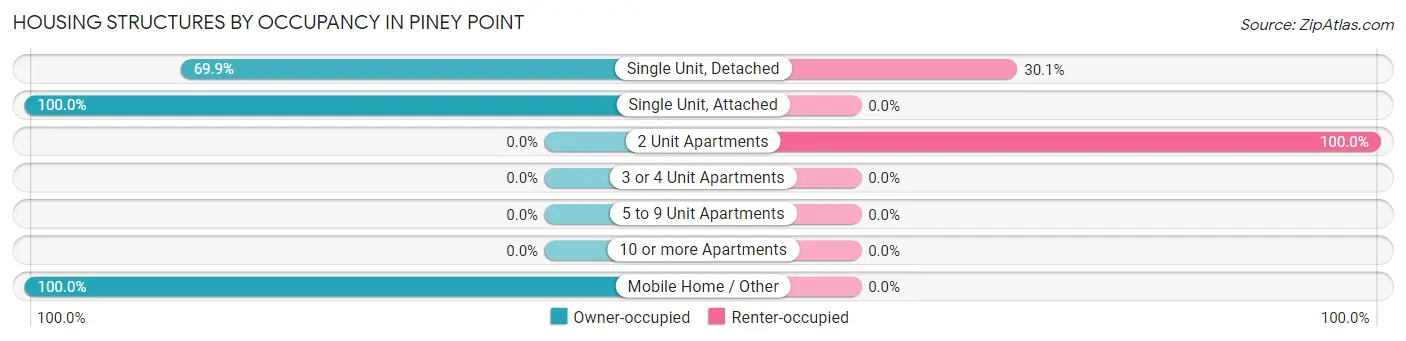
| Structure Type | Owner-occupied | Renter-occupied |
| Single Unit, Detached | 235 (69.9%) | 101 (30.1%) |
| Single Unit, Attached | 12 (100.0%) | 0 (0.0%) |
| 2 Unit Apartments | 0 (0.0%) | 13 (100.0%) |
| 3 or 4 Unit Apartments | 0 (0.0%) | 0 (0.0%) |
| 5 to 9 Unit Apartments | 0 (0.0%) | 0 (0.0%) |
| 10 or more Apartments | 0 (0.0%) | 0 (0.0%) |
| Mobile Home / Other | 35 (100.0%) | 0 (0.0%) |
| Total | 282 (71.2%) | 114 (28.8%) |
Housing Structures by Number of Rooms in Piney Point
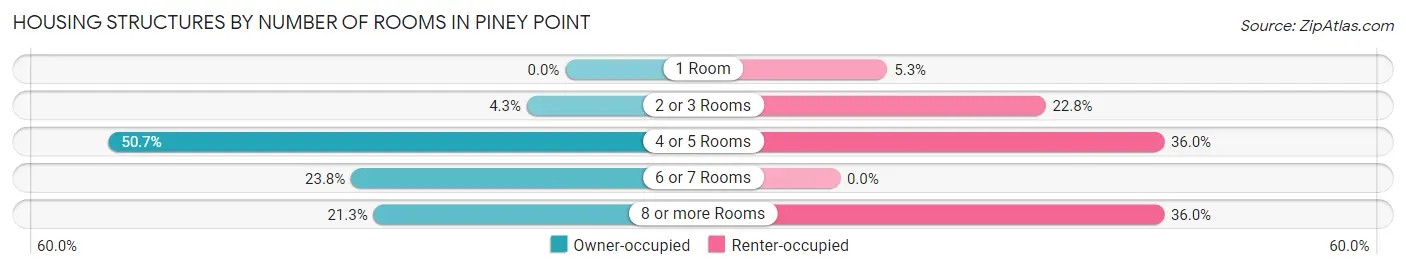
| Number of Rooms | Owner-occupied | Renter-occupied |
| 1 Room | 0 (0.0%) | 6 (5.3%) |
| 2 or 3 Rooms | 12 (4.3%) | 26 (22.8%) |
| 4 or 5 Rooms | 143 (50.7%) | 41 (36.0%) |
| 6 or 7 Rooms | 67 (23.8%) | 0 (0.0%) |
| 8 or more Rooms | 60 (21.3%) | 41 (36.0%) |
| Total | 282 (100.0%) | 114 (100.0%) |
Housing Structure by Heating Type in Piney Point
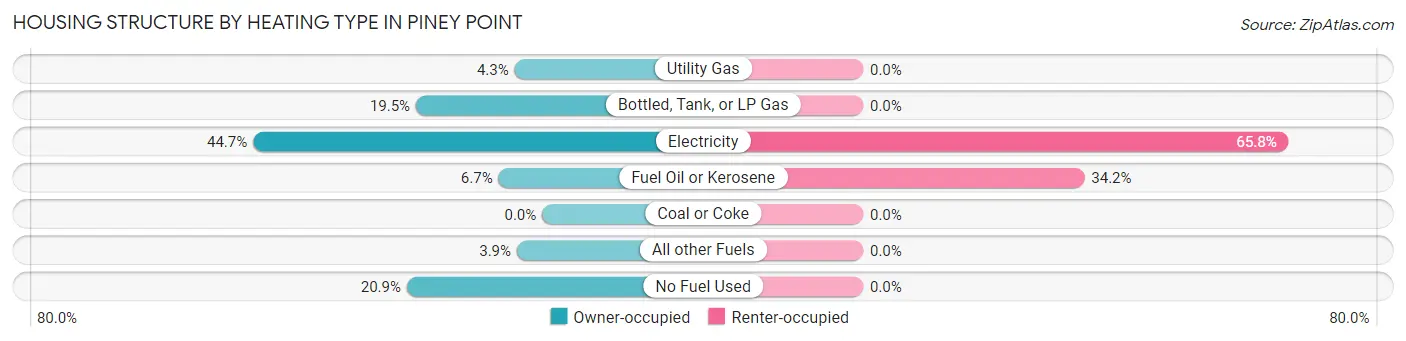
| Heating Type | Owner-occupied | Renter-occupied |
| Utility Gas | 12 (4.3%) | 0 (0.0%) |
| Bottled, Tank, or LP Gas | 55 (19.5%) | 0 (0.0%) |
| Electricity | 126 (44.7%) | 75 (65.8%) |
| Fuel Oil or Kerosene | 19 (6.7%) | 39 (34.2%) |
| Coal or Coke | 0 (0.0%) | 0 (0.0%) |
| All other Fuels | 11 (3.9%) | 0 (0.0%) |
| No Fuel Used | 59 (20.9%) | 0 (0.0%) |
| Total | 282 (100.0%) | 114 (100.0%) |
Household Vehicle Usage in Piney Point
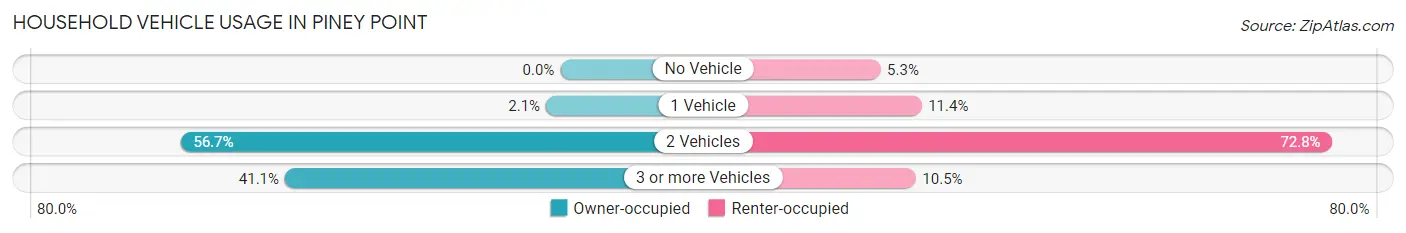
| Vehicles per Household | Owner-occupied | Renter-occupied |
| No Vehicle | 0 (0.0%) | 6 (5.3%) |
| 1 Vehicle | 6 (2.1%) | 13 (11.4%) |
| 2 Vehicles | 160 (56.7%) | 83 (72.8%) |
| 3 or more Vehicles | 116 (41.1%) | 12 (10.5%) |
| Total | 282 (100.0%) | 114 (100.0%) |
Real Estate & Mortgages in Piney Point
Real Estate and Mortgage Overview in Piney Point
| Characteristic | Without Mortgage | With Mortgage |
| Housing Units | 144 | 138 |
| Median Property Value | $289,400 | $411,100 |
| Median Household Income | $60,745 | $59 |
| Monthly Housing Costs | $645 | $54 |
| Real Estate Taxes | $4,564 | $24 |
Property Value by Mortgage Status in Piney Point
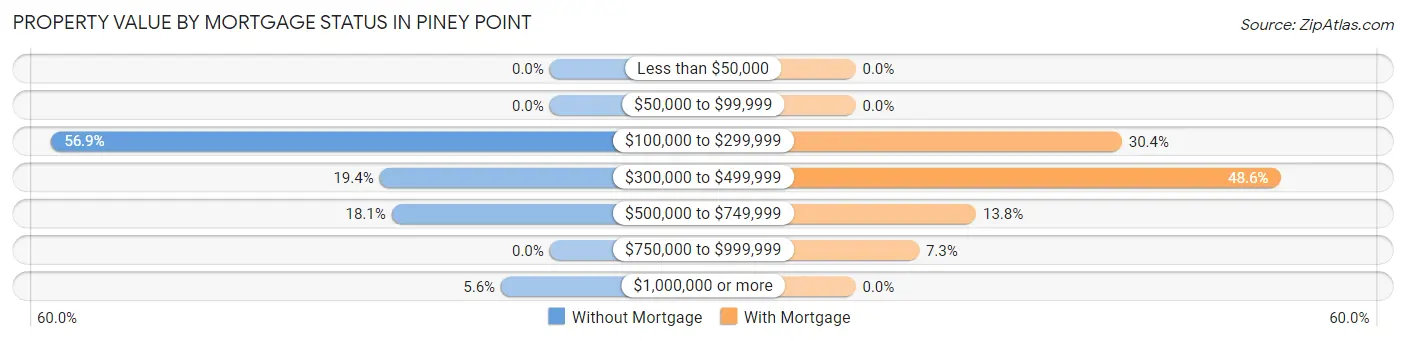
| Property Value | Without Mortgage | With Mortgage |
| Less than $50,000 | 0 (0.0%) | 0 (0.0%) |
| $50,000 to $99,999 | 0 (0.0%) | 0 (0.0%) |
| $100,000 to $299,999 | 82 (56.9%) | 42 (30.4%) |
| $300,000 to $499,999 | 28 (19.4%) | 67 (48.5%) |
| $500,000 to $749,999 | 26 (18.1%) | 19 (13.8%) |
| $750,000 to $999,999 | 0 (0.0%) | 10 (7.2%) |
| $1,000,000 or more | 8 (5.6%) | 0 (0.0%) |
| Total | 144 (100.0%) | 138 (100.0%) |
Household Income by Mortgage Status in Piney Point
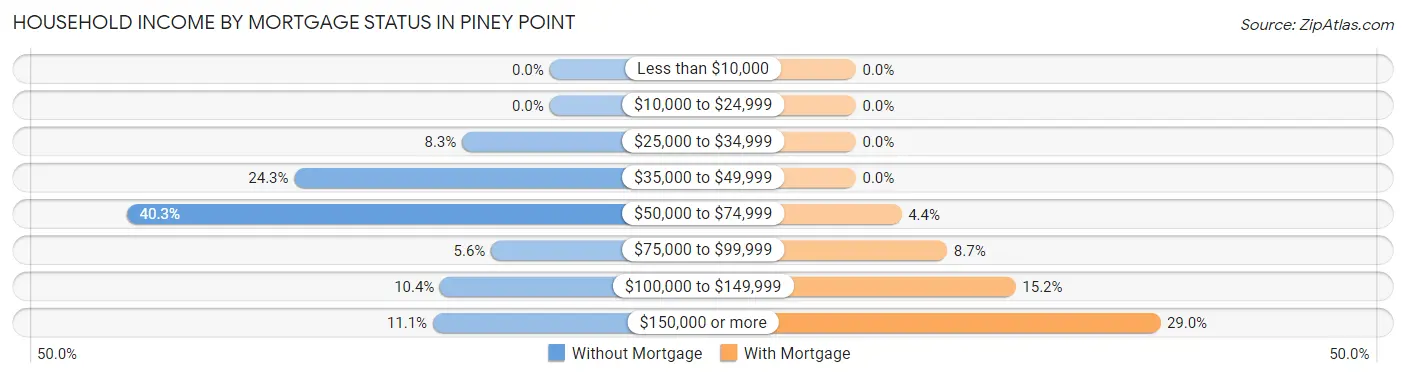
| Household Income | Without Mortgage | With Mortgage |
| Less than $10,000 | 0 (0.0%) | 0 (0.0%) |
| $10,000 to $24,999 | 0 (0.0%) | 0 (0.0%) |
| $25,000 to $34,999 | 12 (8.3%) | 0 (0.0%) |
| $35,000 to $49,999 | 35 (24.3%) | 0 (0.0%) |
| $50,000 to $74,999 | 58 (40.3%) | 6 (4.3%) |
| $75,000 to $99,999 | 8 (5.6%) | 12 (8.7%) |
| $100,000 to $149,999 | 15 (10.4%) | 21 (15.2%) |
| $150,000 or more | 16 (11.1%) | 40 (29.0%) |
| Total | 144 (100.0%) | 138 (100.0%) |
Property Value to Household Income Ratio in Piney Point
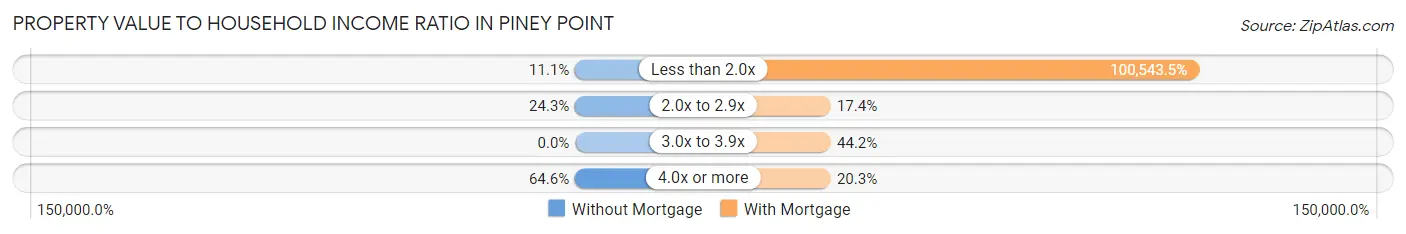
| Value-to-Income Ratio | Without Mortgage | With Mortgage |
| Less than 2.0x | 16 (11.1%) | 138,750 (100,543.5%) |
| 2.0x to 2.9x | 35 (24.3%) | 24 (17.4%) |
| 3.0x to 3.9x | 0 (0.0%) | 61 (44.2%) |
| 4.0x or more | 93 (64.6%) | 28 (20.3%) |
| Total | 144 (100.0%) | 138 (100.0%) |
Real Estate Taxes by Mortgage Status in Piney Point
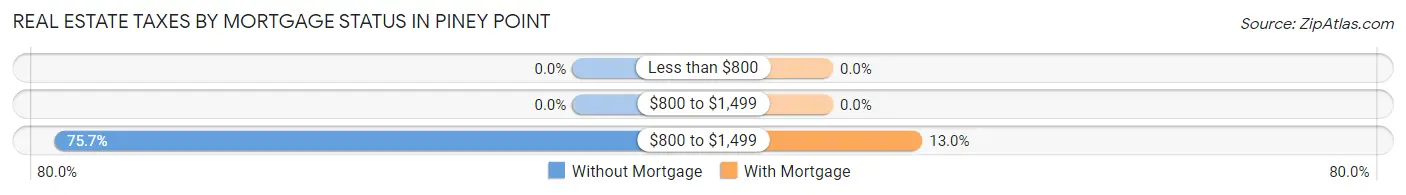
| Property Taxes | Without Mortgage | With Mortgage |
| Less than $800 | 0 (0.0%) | 0 (0.0%) |
| $800 to $1,499 | 0 (0.0%) | 0 (0.0%) |
| $800 to $1,499 | 109 (75.7%) | 18 (13.0%) |
| Total | 144 (100.0%) | 138 (100.0%) |
Health & Disability in Piney Point
Health Insurance Coverage by Age in Piney Point
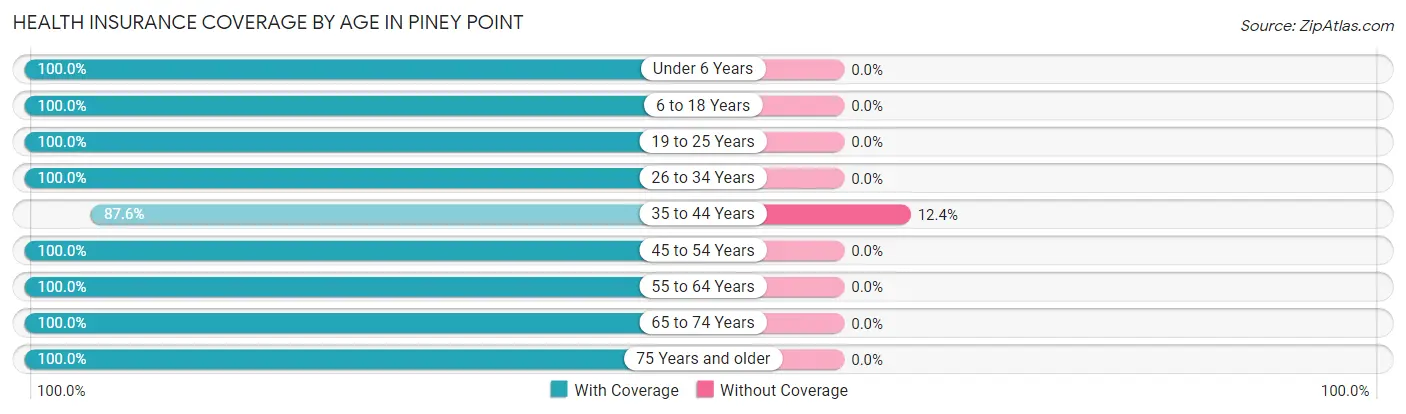
| Age Bracket | With Coverage | Without Coverage |
| Under 6 Years | 108 (100.0%) | 0 (0.0%) |
| 6 to 18 Years | 104 (100.0%) | 0 (0.0%) |
| 19 to 25 Years | 11 (100.0%) | 0 (0.0%) |
| 26 to 34 Years | 149 (100.0%) | 0 (0.0%) |
| 35 to 44 Years | 99 (87.6%) | 14 (12.4%) |
| 45 to 54 Years | 113 (100.0%) | 0 (0.0%) |
| 55 to 64 Years | 94 (100.0%) | 0 (0.0%) |
| 65 to 74 Years | 217 (100.0%) | 0 (0.0%) |
| 75 Years and older | 105 (100.0%) | 0 (0.0%) |
| Total | 1,000 (98.6%) | 14 (1.4%) |
Health Insurance Coverage by Citizenship Status in Piney Point
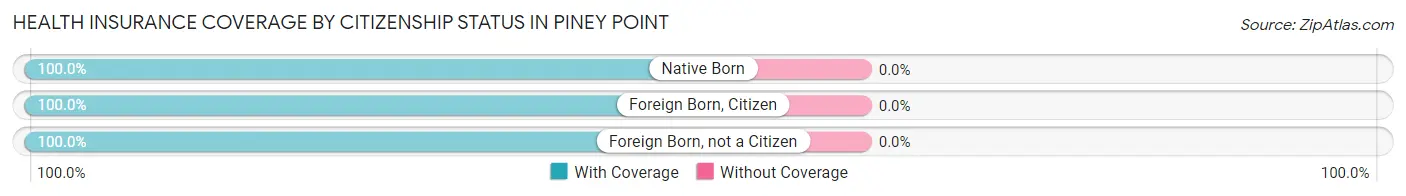
| Citizenship Status | With Coverage | Without Coverage |
| Native Born | 108 (100.0%) | 0 (0.0%) |
| Foreign Born, Citizen | 104 (100.0%) | 0 (0.0%) |
| Foreign Born, not a Citizen | 11 (100.0%) | 0 (0.0%) |
Health Insurance Coverage by Household Income in Piney Point
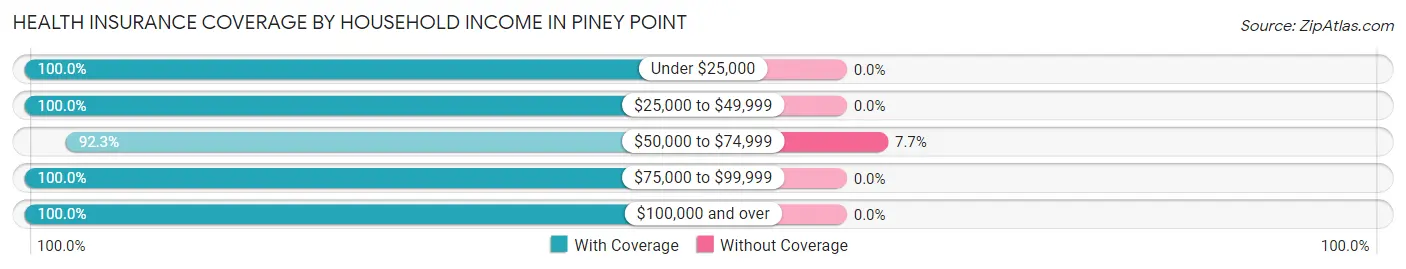
| Household Income | With Coverage | Without Coverage |
| Under $25,000 | 6 (100.0%) | 0 (0.0%) |
| $25,000 to $49,999 | 180 (100.0%) | 0 (0.0%) |
| $50,000 to $74,999 | 167 (92.3%) | 14 (7.7%) |
| $75,000 to $99,999 | 116 (100.0%) | 0 (0.0%) |
| $100,000 and over | 531 (100.0%) | 0 (0.0%) |
Public vs Private Health Insurance Coverage by Age in Piney Point
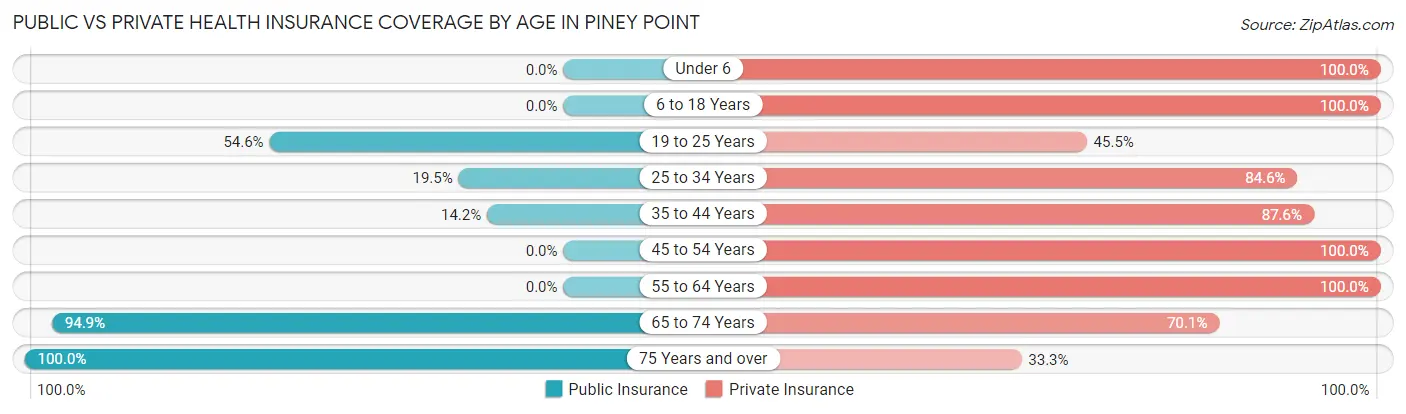
| Age Bracket | Public Insurance | Private Insurance |
| Under 6 | 0 (0.0%) | 108 (100.0%) |
| 6 to 18 Years | 0 (0.0%) | 104 (100.0%) |
| 19 to 25 Years | 6 (54.5%) | 5 (45.5%) |
| 25 to 34 Years | 29 (19.5%) | 126 (84.6%) |
| 35 to 44 Years | 16 (14.2%) | 99 (87.6%) |
| 45 to 54 Years | 0 (0.0%) | 113 (100.0%) |
| 55 to 64 Years | 0 (0.0%) | 94 (100.0%) |
| 65 to 74 Years | 206 (94.9%) | 152 (70.1%) |
| 75 Years and over | 105 (100.0%) | 35 (33.3%) |
| Total | 362 (35.7%) | 836 (82.5%) |
Disability Status by Sex by Age in Piney Point
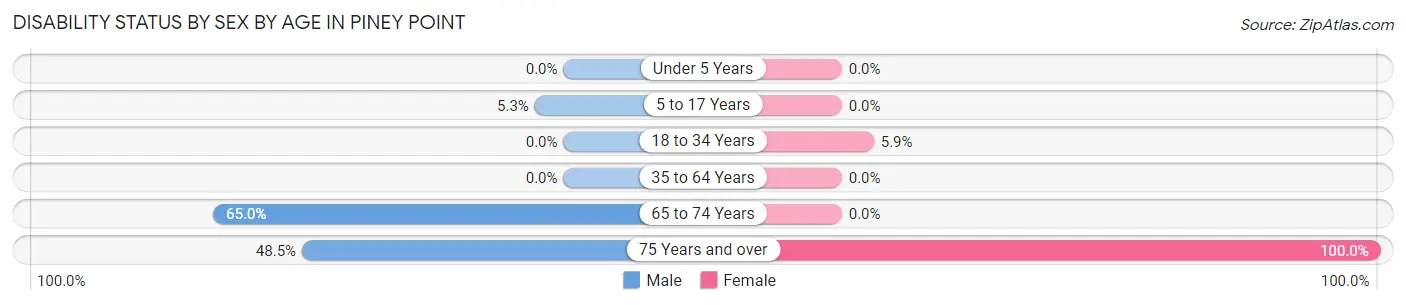
| Age Bracket | Male | Female |
| Under 5 Years | 0 (0.0%) | 0 (0.0%) |
| 5 to 17 Years | 5 (5.3%) | 0 (0.0%) |
| 18 to 34 Years | 0 (0.0%) | 6 (5.9%) |
| 35 to 64 Years | 0 (0.0%) | 0 (0.0%) |
| 65 to 74 Years | 39 (65.0%) | 0 (0.0%) |
| 75 Years and over | 33 (48.5%) | 37 (100.0%) |
Disability Class by Sex by Age in Piney Point
Disability Class: Hearing Difficulty
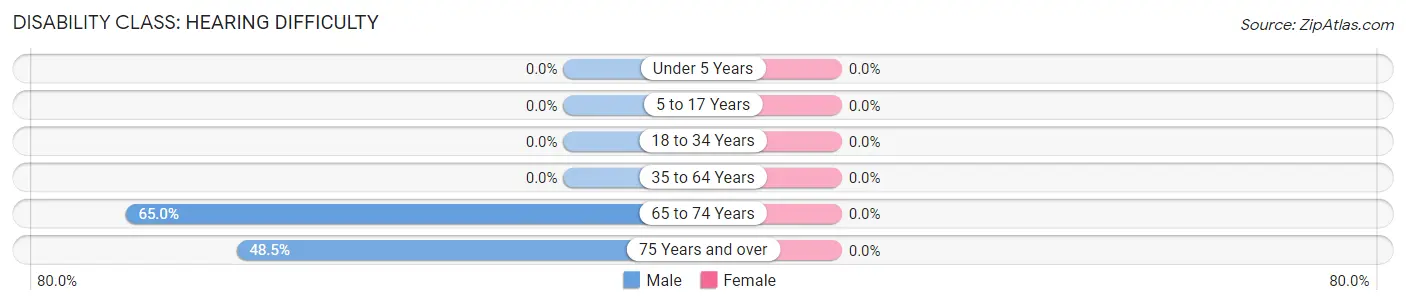
| Age Bracket | Male | Female |
| Under 5 Years | 0 (0.0%) | 0 (0.0%) |
| 5 to 17 Years | 0 (0.0%) | 0 (0.0%) |
| 18 to 34 Years | 0 (0.0%) | 0 (0.0%) |
| 35 to 64 Years | 0 (0.0%) | 0 (0.0%) |
| 65 to 74 Years | 39 (65.0%) | 0 (0.0%) |
| 75 Years and over | 33 (48.5%) | 0 (0.0%) |
Disability Class: Vision Difficulty
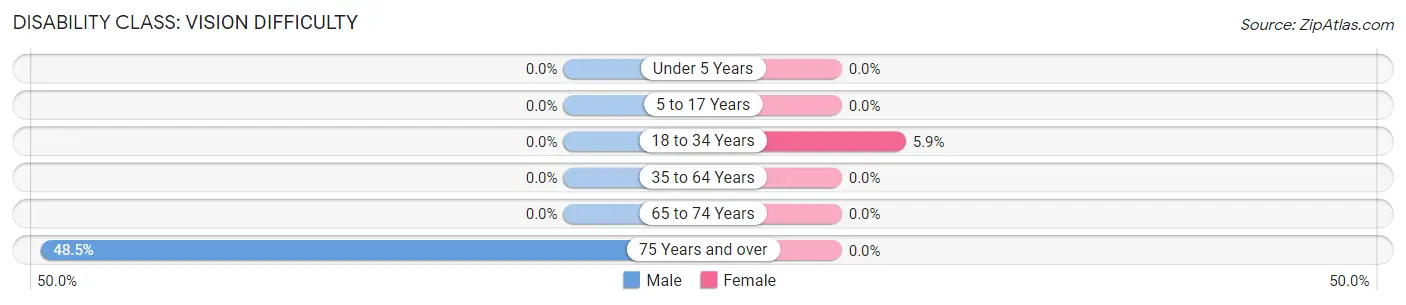
| Age Bracket | Male | Female |
| Under 5 Years | 0 (0.0%) | 0 (0.0%) |
| 5 to 17 Years | 0 (0.0%) | 0 (0.0%) |
| 18 to 34 Years | 0 (0.0%) | 6 (5.9%) |
| 35 to 64 Years | 0 (0.0%) | 0 (0.0%) |
| 65 to 74 Years | 0 (0.0%) | 0 (0.0%) |
| 75 Years and over | 33 (48.5%) | 0 (0.0%) |
Disability Class: Cognitive Difficulty
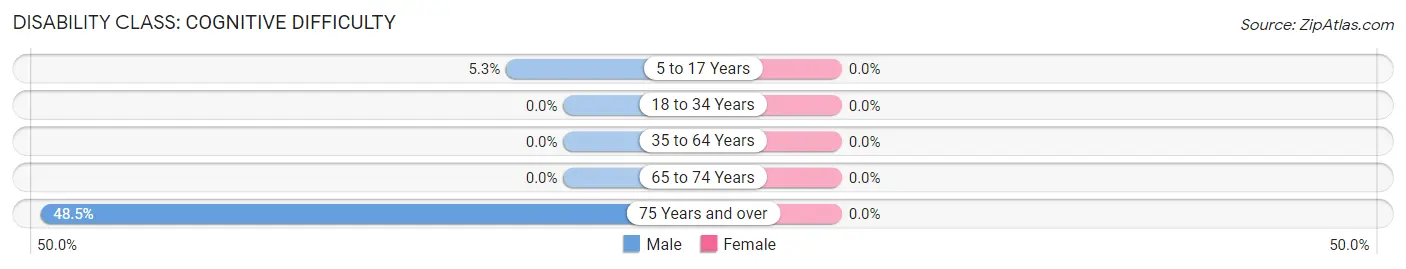
| Age Bracket | Male | Female |
| 5 to 17 Years | 5 (5.3%) | 0 (0.0%) |
| 18 to 34 Years | 0 (0.0%) | 0 (0.0%) |
| 35 to 64 Years | 0 (0.0%) | 0 (0.0%) |
| 65 to 74 Years | 0 (0.0%) | 0 (0.0%) |
| 75 Years and over | 33 (48.5%) | 0 (0.0%) |
Disability Class: Ambulatory Difficulty
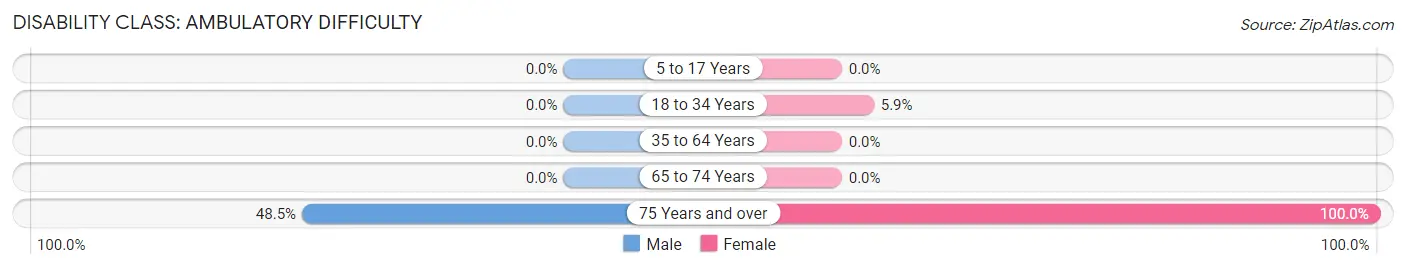
| Age Bracket | Male | Female |
| 5 to 17 Years | 0 (0.0%) | 0 (0.0%) |
| 18 to 34 Years | 0 (0.0%) | 6 (5.9%) |
| 35 to 64 Years | 0 (0.0%) | 0 (0.0%) |
| 65 to 74 Years | 0 (0.0%) | 0 (0.0%) |
| 75 Years and over | 33 (48.5%) | 37 (100.0%) |
Disability Class: Self-Care Difficulty
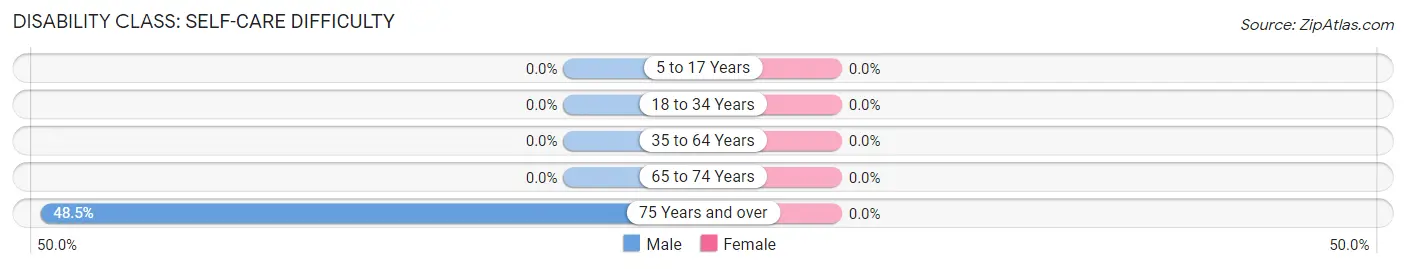
| Age Bracket | Male | Female |
| 5 to 17 Years | 0 (0.0%) | 0 (0.0%) |
| 18 to 34 Years | 0 (0.0%) | 0 (0.0%) |
| 35 to 64 Years | 0 (0.0%) | 0 (0.0%) |
| 65 to 74 Years | 0 (0.0%) | 0 (0.0%) |
| 75 Years and over | 33 (48.5%) | 0 (0.0%) |
Technology Access in Piney Point
Computing Device Access in Piney Point
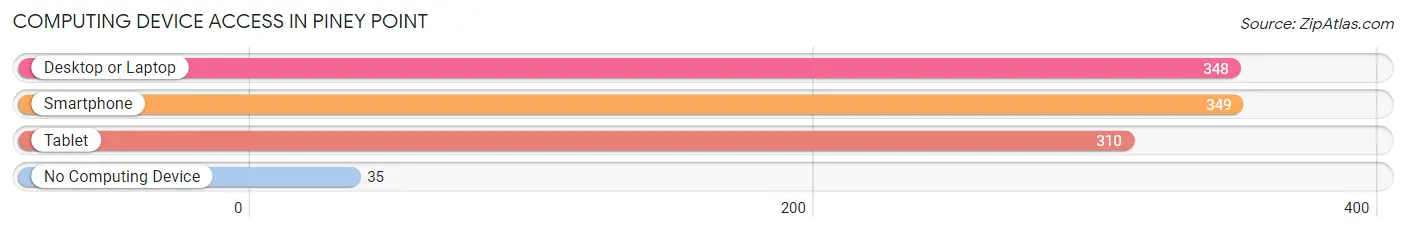
| Device Type | # Households | % Households |
| Desktop or Laptop | 348 | 87.9% |
| Smartphone | 349 | 88.1% |
| Tablet | 310 | 78.3% |
| No Computing Device | 35 | 8.8% |
| Total | 396 | 100.0% |
Internet Access in Piney Point
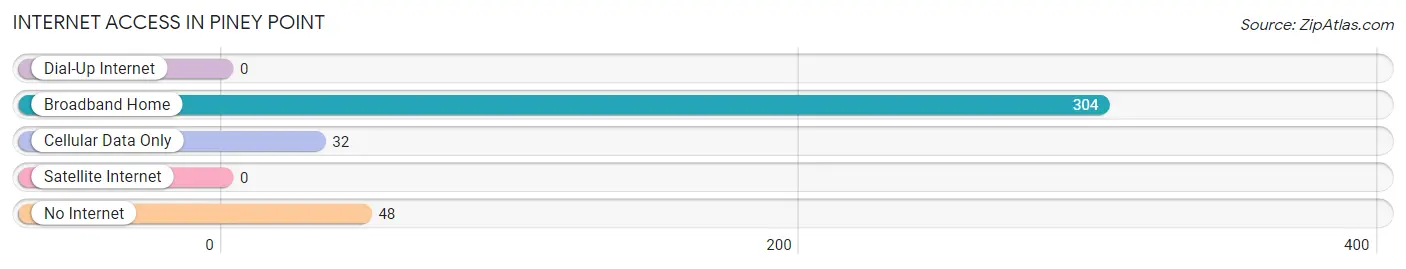
| Internet Type | # Households | % Households |
| Dial-Up Internet | 0 | 0.0% |
| Broadband Home | 304 | 76.8% |
| Cellular Data Only | 32 | 8.1% |
| Satellite Internet | 0 | 0.0% |
| No Internet | 48 | 12.1% |
| Total | 396 | 100.0% |
Piney Point Summary
Piney Point is a small unincorporated community located in St. Mary’s County, Maryland. It is situated on the western shore of the Chesapeake Bay, approximately 25 miles south of Washington, D.C. The community is home to a population of approximately 1,000 people, and is known for its rich history, beautiful scenery, and vibrant economy.
History
Piney Point has a long and storied history. The area was first settled in the early 1700s by English colonists, who established a small fishing village. The village was named after the abundance of pine trees in the area, and the point of land that jutted out into the bay. In the late 1700s, the area was home to a bustling port, with ships coming and going from the Chesapeake Bay. The port was a major hub for the shipping of tobacco, lumber, and other goods.
In the early 1800s, the area was home to a large number of oystermen, who harvested oysters from the bay. The oystermen were a major source of income for the area, and the oyster beds were a major source of food for the local population.
In the late 1800s, the area was home to a large number of farmers, who grew a variety of crops, including corn, wheat, and tobacco. The farmers also raised livestock, such as cows, pigs, and chickens.
In the early 1900s, the area was home to a large number of crabbers, who harvested crabs from the bay. The crabbers were a major source of income for the area, and the crabs were a major source of food for the local population.
In the mid-1900s, the area was home to a large number of shrimpers, who harvested shrimp from the bay. The shrimpers were a major source of income for the area, and the shrimp were a major source of food for the local population.
Geography
Piney Point is located on the western shore of the Chesapeake Bay, approximately 25 miles south of Washington, D.C. The area is characterized by rolling hills, lush forests, and a variety of waterways. The area is home to a number of parks and nature preserves, including the Piney Point Lighthouse State Park, which is a popular destination for visitors.
Economy
Piney Point’s economy is largely based on tourism and fishing. The area is home to a number of marinas, which attract visitors from all over the world. The area is also home to a number of seafood restaurants, which serve a variety of fresh seafood dishes.
The area is also home to a number of small businesses, including boat repair shops, bait and tackle shops, and charter fishing services. The area is also home to a number of art galleries, which feature the work of local artists.
Demographics
As of the 2010 census, the population of Piney Point was 1,000. The population is largely white (90%), with a small percentage of African Americans (5%) and Hispanics (3%). The median household income is $50,000, and the median age is 44.
Conclusion
Piney Point is a small unincorporated community located in St. Mary’s County, Maryland. It is situated on the western shore of the Chesapeake Bay, approximately 25 miles south of Washington, D.C. The community is home to a population of approximately 1,000 people, and is known for its rich history, beautiful scenery, and vibrant economy. The area is largely based on tourism and fishing, and is home to a number of small businesses, including boat repair shops, bait and tackle shops, and charter fishing services. The area is also home to a number of art galleries, which feature the work of local artists. The population is largely white (90%), with a small percentage of African Americans (5%) and Hispanics (3%). The median household income is $50,000, and the median age is 44.
Common Questions
What is Per Capita Income in Piney Point?
Per Capita income in Piney Point is $44,819.
What is the Median Family Income in Piney Point?
Median Family Income in Piney Point is $92,656.
What is the Median Household income in Piney Point?
Median Household Income in Piney Point is $100,313.
What is Inequality or Gini Index in Piney Point?
Inequality or Gini Index in Piney Point is 0.35.
What is the Total Population of Piney Point?
Total Population of Piney Point is 1,033.
What is the Total Male Population of Piney Point?
Total Male Population of Piney Point is 472.
What is the Total Female Population of Piney Point?
Total Female Population of Piney Point is 561.
What is the Ratio of Males per 100 Females in Piney Point?
There are 84.14 Males per 100 Females in Piney Point.
What is the Ratio of Females per 100 Males in Piney Point?
There are 118.86 Females per 100 Males in Piney Point.
What is the Median Population Age in Piney Point?
Median Population Age in Piney Point is 48.4 Years.
What is the Average Family Size in Piney Point
Average Family Size in Piney Point is 2.6 People.
What is the Average Household Size in Piney Point
Average Household Size in Piney Point is 2.6 People.
How Large is the Labor Force in Piney Point?
There are 486 People in the Labor Forcein in Piney Point.
What is the Percentage of People in the Labor Force in Piney Point?
58.6% of People are in the Labor Force in Piney Point.
What is the Unemployment Rate in Piney Point?
Unemployment Rate in Piney Point is 11.1%.