Zip Codes with the Highest Percentage of Population Employed in Installation, Maintenance & Repair in Gaithersburg, MD
RELATED REPORTS & OPTIONS
Installation, Maintenance & Repair
Gaithersburg
Compare Zip Codes
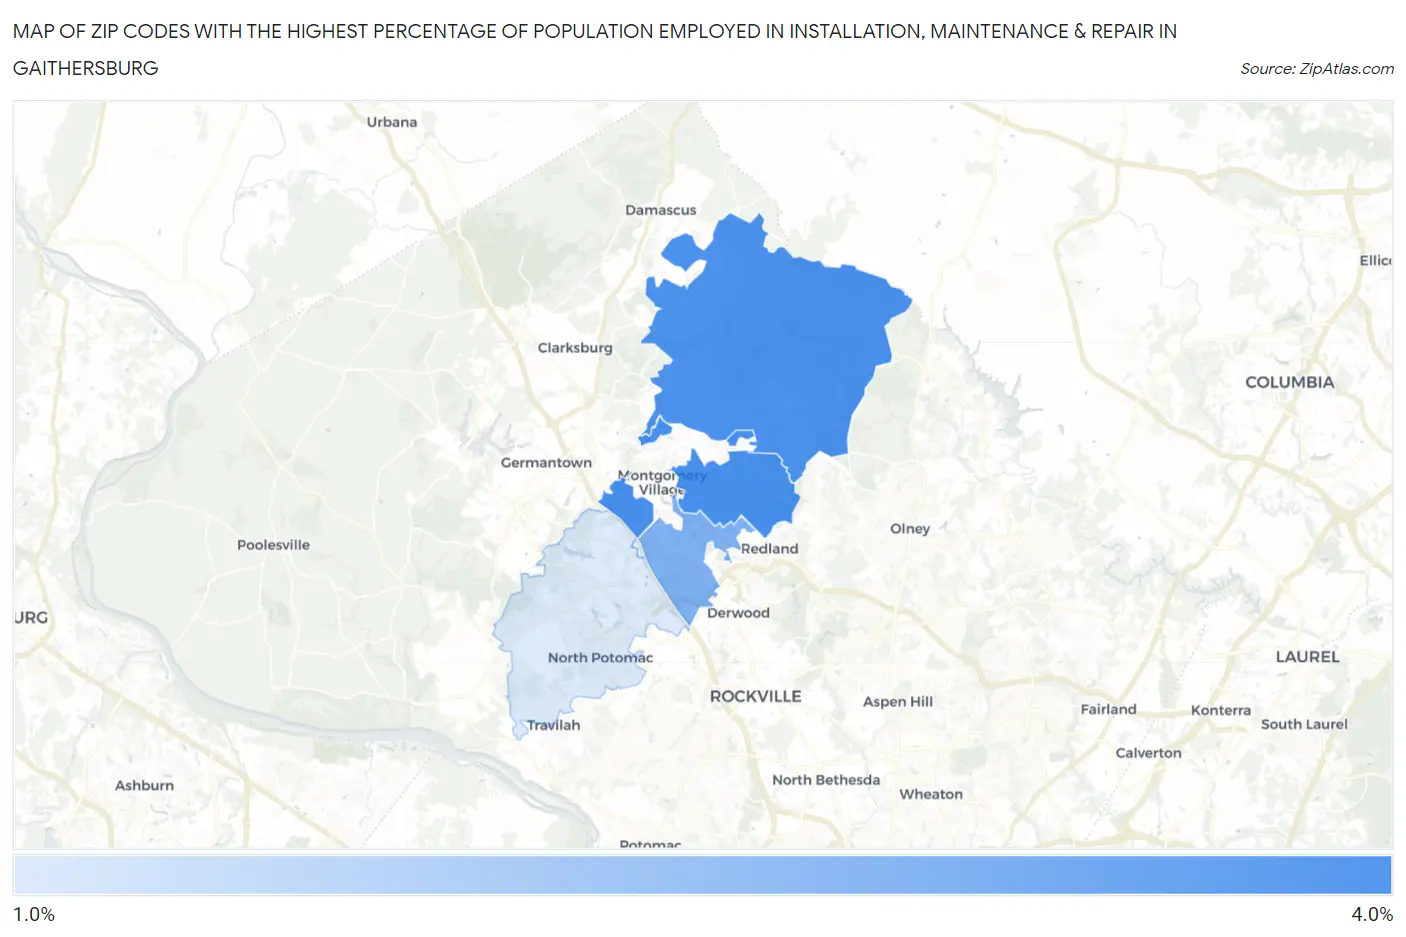
Map of Zip Codes with the Highest Percentage of Population Employed in Installation, Maintenance & Repair in Gaithersburg
1.4%
3.3%
Zip Codes with the Highest Percentage of Population Employed in Installation, Maintenance & Repair in Gaithersburg, MD
| Zip Code | % Employed | vs State | vs National | |
| 1. | 20879 | 3.3% | 2.8%(+0.488)#182 | 3.1%(+0.216)#15,637 |
| 2. | 20882 | 3.2% | 2.8%(+0.428)#183 | 3.1%(+0.156)#15,911 |
| 3. | 20877 | 2.6% | 2.8%(-0.191)#231 | 3.1%(-0.463)#19,059 |
| 4. | 20878 | 1.4% | 2.8%(-1.35)#318 | 3.1%(-1.62)#24,368 |
1
Common Questions
What are the Top 3 Zip Codes with the Highest Percentage of Population Employed in Installation, Maintenance & Repair in Gaithersburg, MD?
Top 3 Zip Codes with the Highest Percentage of Population Employed in Installation, Maintenance & Repair in Gaithersburg, MD are:
What zip code has the Highest Percentage of Population Employed in Installation, Maintenance & Repair in Gaithersburg, MD?
20879 has the Highest Percentage of Population Employed in Installation, Maintenance & Repair in Gaithersburg, MD with 3.3%.
What is the Percentage of Population Employed in Installation, Maintenance & Repair in Gaithersburg, MD?
Percentage of Population Employed in Installation, Maintenance & Repair in Gaithersburg is 2.1%.
What is the Percentage of Population Employed in Installation, Maintenance & Repair in Maryland?
Percentage of Population Employed in Installation, Maintenance & Repair in Maryland is 2.8%.
What is the Percentage of Population Employed in Installation, Maintenance & Repair in the United States?
Percentage of Population Employed in Installation, Maintenance & Repair in the United States is 3.1%.