Zip Codes with the Highest Percentage of Population Employed in Food Preparation & Serving in Germantown, MD
RELATED REPORTS & OPTIONS
Food Preparation & Serving
Germantown
Compare Zip Codes
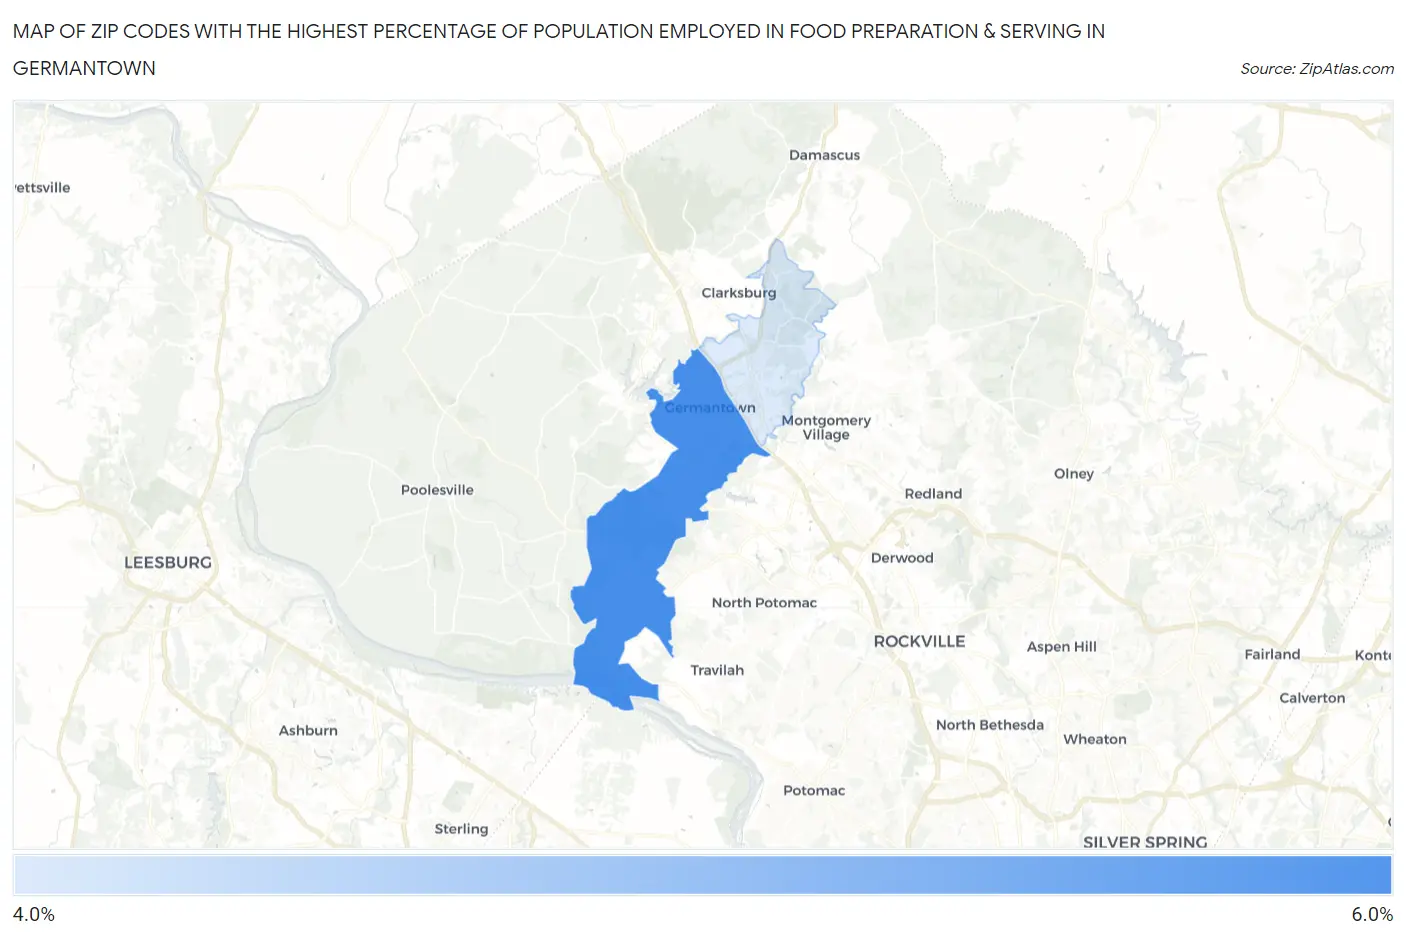
Map of Zip Codes with the Highest Percentage of Population Employed in Food Preparation & Serving in Germantown
4.4%
5.2%
Zip Codes with the Highest Percentage of Population Employed in Food Preparation & Serving in Germantown, MD
| Zip Code | % Employed | vs State | vs National | |
| 1. | 20874 | 5.2% | 4.4%(+0.844)#134 | 5.3%(-0.061)#12,045 |
| 2. | 20876 | 4.4% | 4.4%(-0.027)#183 | 5.3%(-0.933)#15,629 |
1
Common Questions
What are the Top Zip Codes with the Highest Percentage of Population Employed in Food Preparation & Serving in Germantown, MD?
Top Zip Codes with the Highest Percentage of Population Employed in Food Preparation & Serving in Germantown, MD are:
What zip code has the Highest Percentage of Population Employed in Food Preparation & Serving in Germantown, MD?
20874 has the Highest Percentage of Population Employed in Food Preparation & Serving in Germantown, MD with 5.2%.
What is the Percentage of Population Employed in Food Preparation & Serving in Germantown, MD?
Percentage of Population Employed in Food Preparation & Serving in Germantown is 5.0%.
What is the Percentage of Population Employed in Food Preparation & Serving in Maryland?
Percentage of Population Employed in Food Preparation & Serving in Maryland is 4.4%.
What is the Percentage of Population Employed in Food Preparation & Serving in the United States?
Percentage of Population Employed in Food Preparation & Serving in the United States is 5.3%.