Zip Codes with the Highest Percentage of Population Employed in Food Preparation & Serving in Hyattsville, MD
RELATED REPORTS & OPTIONS
Food Preparation & Serving
Hyattsville
Compare Zip Codes
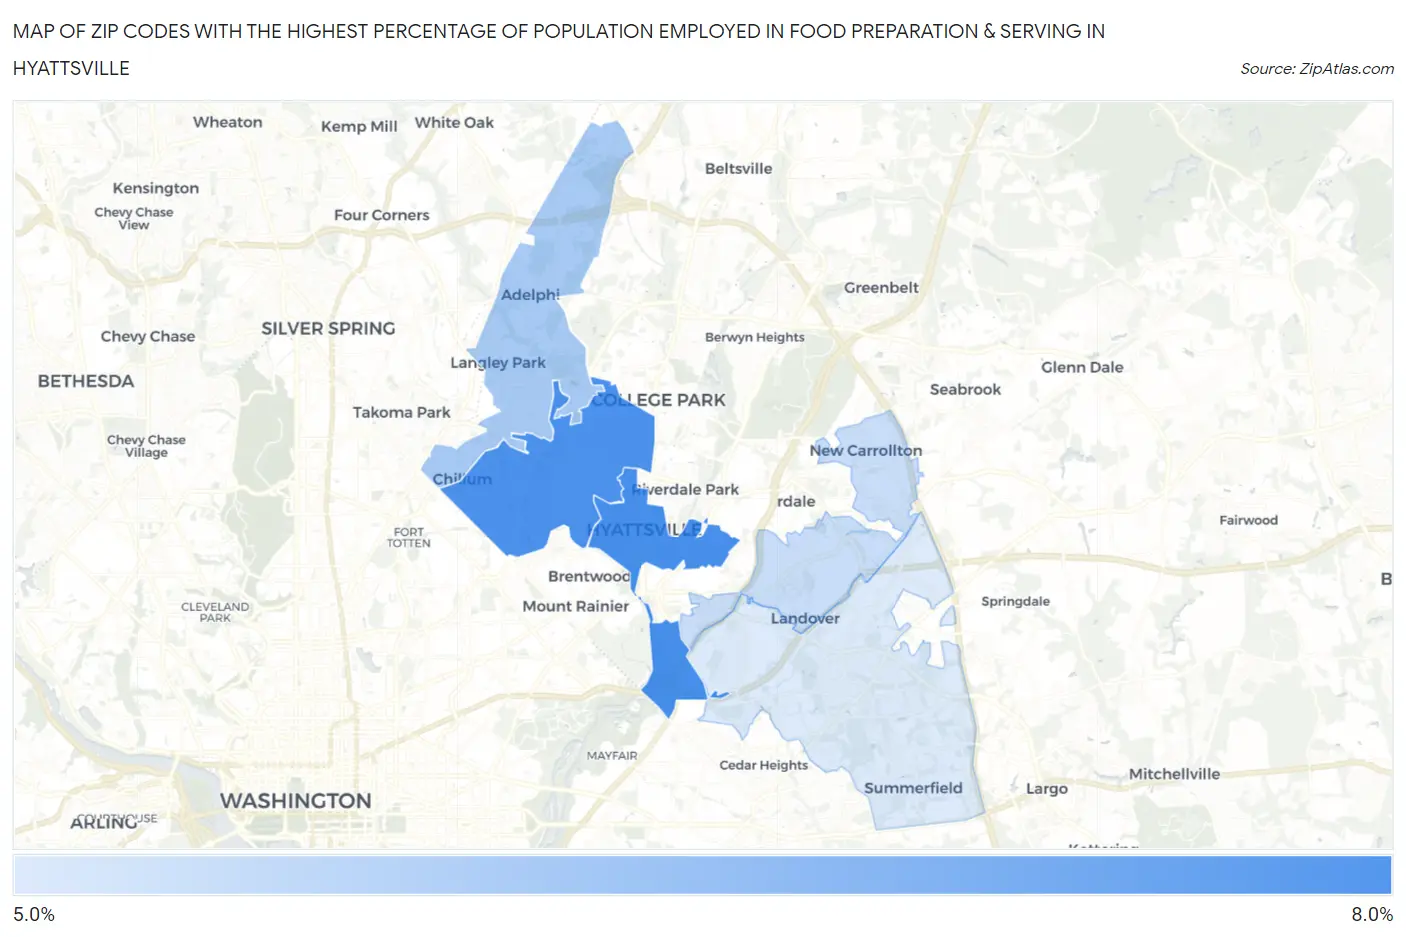
Map of Zip Codes with the Highest Percentage of Population Employed in Food Preparation & Serving in Hyattsville
5.5%
7.7%
Zip Codes with the Highest Percentage of Population Employed in Food Preparation & Serving in Hyattsville, MD
| Zip Code | % Employed | vs State | vs National | |
| 1. | 20781 | 7.7% | 4.4%(+3.28)#48 | 5.3%(+2.37)#5,283 |
| 2. | 20782 | 7.6% | 4.4%(+3.22)#50 | 5.3%(+2.32)#5,372 |
| 3. | 20783 | 6.3% | 4.4%(+1.92)#78 | 5.3%(+1.01)#8,435 |
| 4. | 20784 | 5.8% | 4.4%(+1.45)#98 | 5.3%(+0.543)#9,939 |
| 5. | 20785 | 5.5% | 4.4%(+1.16)#118 | 5.3%(+0.257)#10,918 |
1
Common Questions
What are the Top 3 Zip Codes with the Highest Percentage of Population Employed in Food Preparation & Serving in Hyattsville, MD?
Top 3 Zip Codes with the Highest Percentage of Population Employed in Food Preparation & Serving in Hyattsville, MD are:
What zip code has the Highest Percentage of Population Employed in Food Preparation & Serving in Hyattsville, MD?
20781 has the Highest Percentage of Population Employed in Food Preparation & Serving in Hyattsville, MD with 7.7%.
What is the Percentage of Population Employed in Food Preparation & Serving in Hyattsville, MD?
Percentage of Population Employed in Food Preparation & Serving in Hyattsville is 6.4%.
What is the Percentage of Population Employed in Food Preparation & Serving in Maryland?
Percentage of Population Employed in Food Preparation & Serving in Maryland is 4.4%.
What is the Percentage of Population Employed in Food Preparation & Serving in the United States?
Percentage of Population Employed in Food Preparation & Serving in the United States is 5.3%.