Zip Codes with the Highest Percentage of Population Employed in Food Preparation & Serving in Columbia, MD
RELATED REPORTS & OPTIONS
Food Preparation & Serving
Columbia
Compare Zip Codes
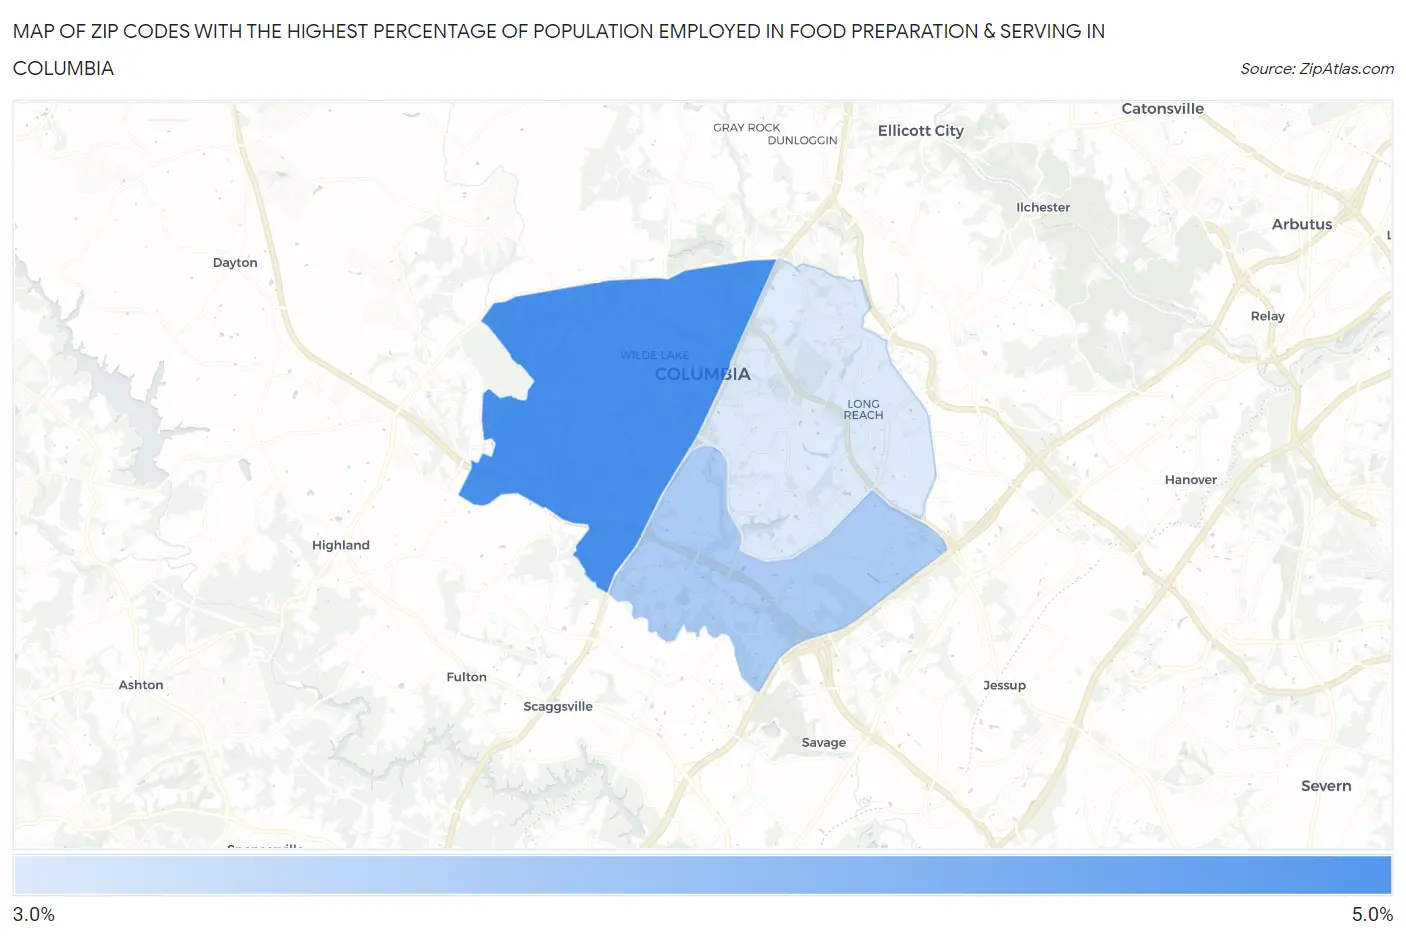
Map of Zip Codes with the Highest Percentage of Population Employed in Food Preparation & Serving in Columbia
3.6%
4.5%
Zip Codes with the Highest Percentage of Population Employed in Food Preparation & Serving in Columbia, MD
| Zip Code | % Employed | vs State | vs National | |
| 1. | 21044 | 4.5% | 4.4%(+0.089)#177 | 5.3%(-0.817)#15,148 |
| 2. | 21046 | 3.9% | 4.4%(-0.498)#218 | 5.3%(-1.40)#17,622 |
| 3. | 21045 | 3.6% | 4.4%(-0.776)#248 | 5.3%(-1.68)#18,756 |
1
Common Questions
What are the Top Zip Codes with the Highest Percentage of Population Employed in Food Preparation & Serving in Columbia, MD?
Top Zip Codes with the Highest Percentage of Population Employed in Food Preparation & Serving in Columbia, MD are:
What zip code has the Highest Percentage of Population Employed in Food Preparation & Serving in Columbia, MD?
21044 has the Highest Percentage of Population Employed in Food Preparation & Serving in Columbia, MD with 4.5%.
What is the Percentage of Population Employed in Food Preparation & Serving in Columbia, MD?
Percentage of Population Employed in Food Preparation & Serving in Columbia is 4.0%.
What is the Percentage of Population Employed in Food Preparation & Serving in Maryland?
Percentage of Population Employed in Food Preparation & Serving in Maryland is 4.4%.
What is the Percentage of Population Employed in Food Preparation & Serving in the United States?
Percentage of Population Employed in Food Preparation & Serving in the United States is 5.3%.