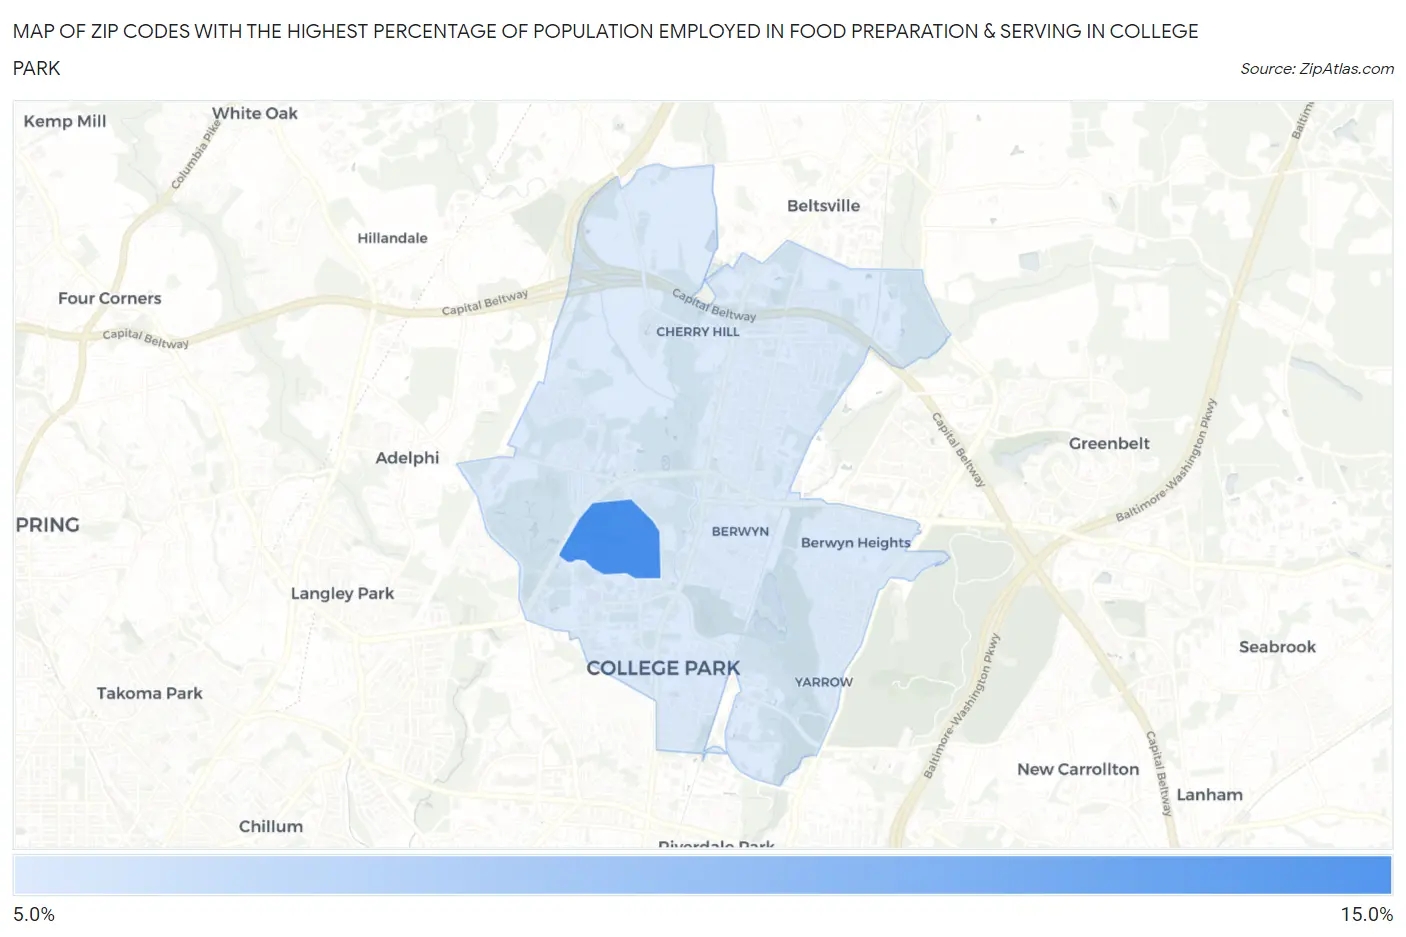
Zip Codes with the Highest Percentage of Population Employed in Food Preparation & Serving in College Park, MD
RELATED REPORTS & OPTIONS
Food Preparation & Serving
College Park
Compare Zip Codes
Map of Zip Codes with the Highest Percentage of Population Employed in Food Preparation & Serving in College Park
6.8%
11.3%
Zip Codes with the Highest Percentage of Population Employed in Food Preparation & Serving in College Park, MD
| Zip Code | % Employed | vs State | vs National | |
| 1. | 20742 | 11.3% | 4.4%(+6.93)#20 | 5.3%(+6.02)#1,917 |
| 2. | 20740 | 6.8% | 4.4%(+2.41)#64 | 5.3%(+1.50)#7,087 |
1
Common Questions
What are the Top Zip Codes with the Highest Percentage of Population Employed in Food Preparation & Serving in College Park, MD?
Top Zip Codes with the Highest Percentage of Population Employed in Food Preparation & Serving in College Park, MD are:
What zip code has the Highest Percentage of Population Employed in Food Preparation & Serving in College Park, MD?
20742 has the Highest Percentage of Population Employed in Food Preparation & Serving in College Park, MD with 11.3%.
What is the Percentage of Population Employed in Food Preparation & Serving in College Park, MD?
Percentage of Population Employed in Food Preparation & Serving in College Park is 7.7%.
What is the Percentage of Population Employed in Food Preparation & Serving in Maryland?
Percentage of Population Employed in Food Preparation & Serving in Maryland is 4.4%.
What is the Percentage of Population Employed in Food Preparation & Serving in the United States?
Percentage of Population Employed in Food Preparation & Serving in the United States is 5.3%.