Zip Codes with the Highest Percentage of Population Employed in Food Preparation & Serving in Salisbury, MD
RELATED REPORTS & OPTIONS
Food Preparation & Serving
Salisbury
Compare Zip Codes
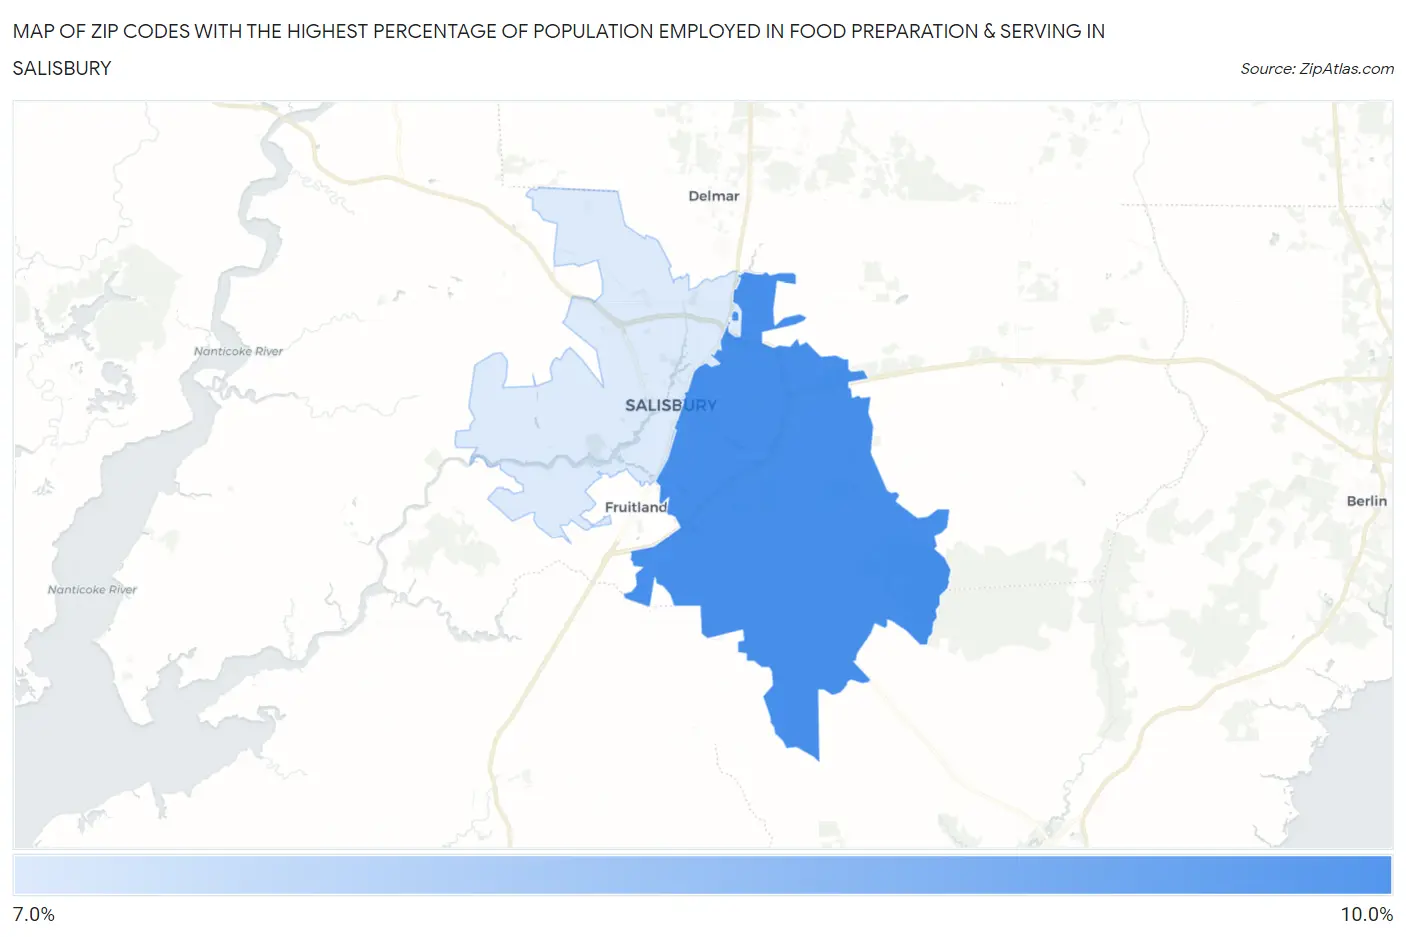
Map of Zip Codes with the Highest Percentage of Population Employed in Food Preparation & Serving in Salisbury
7.7%
8.1%
Zip Codes with the Highest Percentage of Population Employed in Food Preparation & Serving in Salisbury, MD
| Zip Code | % Employed | vs State | vs National | |
| 1. | 21804 | 8.1% | 4.4%(+3.69)#38 | 5.3%(+2.79)#4,624 |
| 2. | 21801 | 7.7% | 4.4%(+3.36)#45 | 5.3%(+2.46)#5,147 |
1
Common Questions
What are the Top Zip Codes with the Highest Percentage of Population Employed in Food Preparation & Serving in Salisbury, MD?
Top Zip Codes with the Highest Percentage of Population Employed in Food Preparation & Serving in Salisbury, MD are:
What zip code has the Highest Percentage of Population Employed in Food Preparation & Serving in Salisbury, MD?
21804 has the Highest Percentage of Population Employed in Food Preparation & Serving in Salisbury, MD with 8.1%.
What is the Percentage of Population Employed in Food Preparation & Serving in Salisbury, MD?
Percentage of Population Employed in Food Preparation & Serving in Salisbury is 9.1%.
What is the Percentage of Population Employed in Food Preparation & Serving in Maryland?
Percentage of Population Employed in Food Preparation & Serving in Maryland is 4.4%.
What is the Percentage of Population Employed in Food Preparation & Serving in the United States?
Percentage of Population Employed in Food Preparation & Serving in the United States is 5.3%.