Zip Codes with the Highest Percentage of Population Employed in Food Preparation & Serving in Annapolis, MD
RELATED REPORTS & OPTIONS
Food Preparation & Serving
Annapolis
Compare Zip Codes
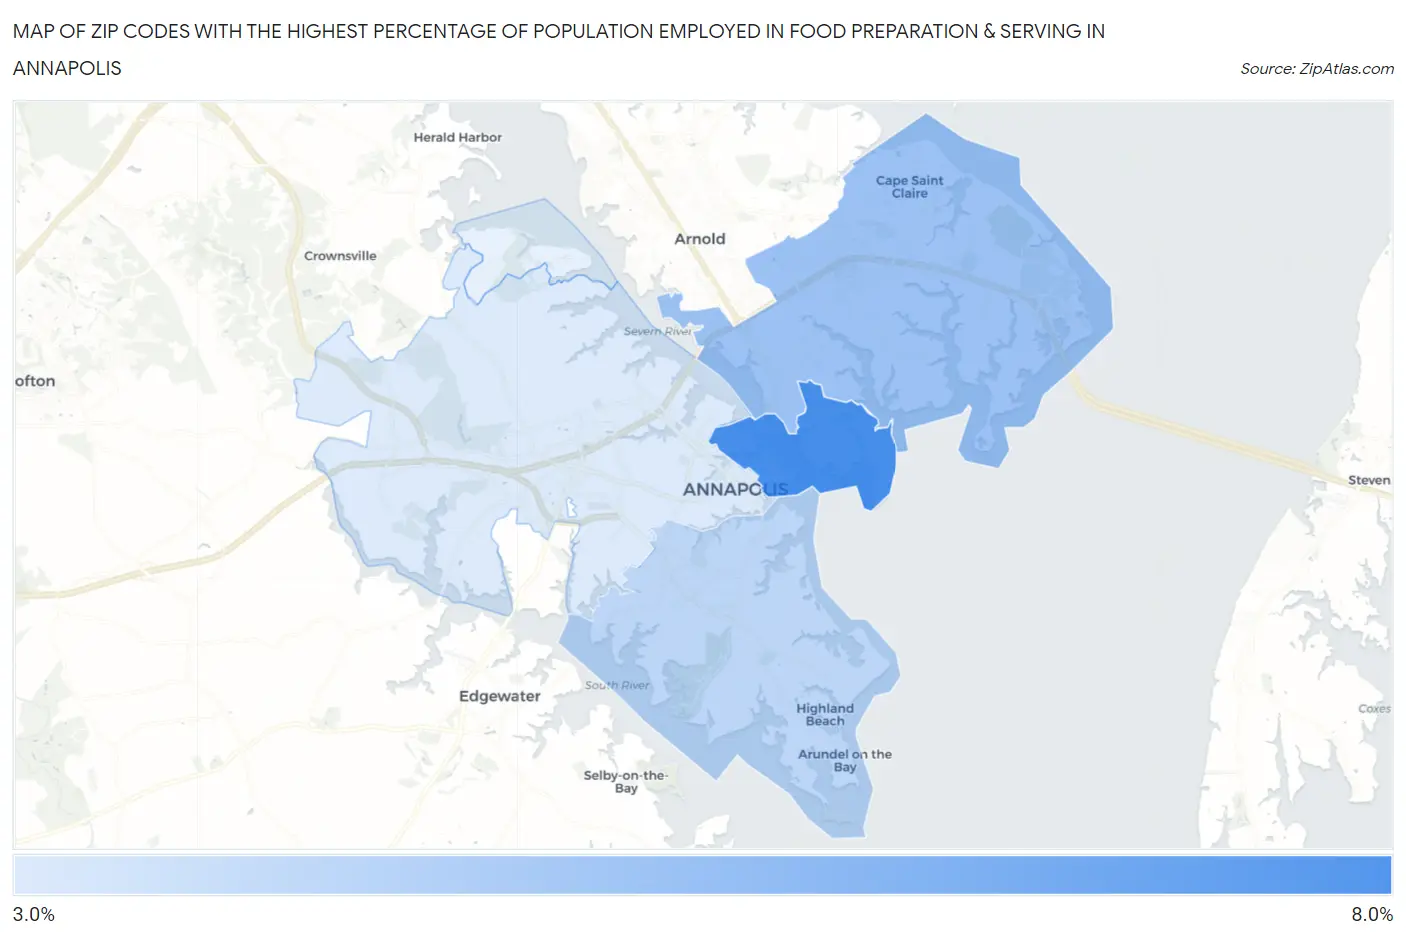
Map of Zip Codes with the Highest Percentage of Population Employed in Food Preparation & Serving in Annapolis
3.9%
7.7%
Zip Codes with the Highest Percentage of Population Employed in Food Preparation & Serving in Annapolis, MD
| Zip Code | % Employed | vs State | vs National | |
| 1. | 21402 | 7.7% | 4.4%(+3.29)#47 | 5.3%(+2.38)#5,263 |
| 2. | 21409 | 5.6% | 4.4%(+1.22)#111 | 5.3%(+0.311)#10,708 |
| 3. | 21403 | 4.8% | 4.4%(+0.376)#160 | 5.3%(-0.530)#13,930 |
| 4. | 21401 | 3.9% | 4.4%(-0.432)#212 | 5.3%(-1.34)#17,347 |
1
Common Questions
What are the Top 3 Zip Codes with the Highest Percentage of Population Employed in Food Preparation & Serving in Annapolis, MD?
Top 3 Zip Codes with the Highest Percentage of Population Employed in Food Preparation & Serving in Annapolis, MD are:
What zip code has the Highest Percentage of Population Employed in Food Preparation & Serving in Annapolis, MD?
21402 has the Highest Percentage of Population Employed in Food Preparation & Serving in Annapolis, MD with 7.7%.
What is the Percentage of Population Employed in Food Preparation & Serving in Annapolis, MD?
Percentage of Population Employed in Food Preparation & Serving in Annapolis is 5.1%.
What is the Percentage of Population Employed in Food Preparation & Serving in Maryland?
Percentage of Population Employed in Food Preparation & Serving in Maryland is 4.4%.
What is the Percentage of Population Employed in Food Preparation & Serving in the United States?
Percentage of Population Employed in Food Preparation & Serving in the United States is 5.3%.